supplemental nutrition assistance program tate …366.5 7.79% supplemental nutrition assistance...
TRANSCRIPT

3TATE ACTIVITY REPORT Fiscal Year 2015
Supplemental Nutrition Assistance Program
Food and Nutrition Service Supplemental Nutrition Assistance Program
Program Accountability and Administration Division August 2016
TABLE OF CONTENTS
Introduction..............................................................................................................1
National Summary FY 2014 – 2015............................................................................2
State Participation and Issuance.............................................................................3
Administrative Costs..............................................................................................10
Fair Hearings...........................................................................................................18
Fraud Investigations, Prosecutions, and Administrative Disqualification Hearings..............................................................21
Recipient Claims.....................................................................................................30
Participation and Issuance Rankings…................................................................37
Multi-Year Comparisons........................................................................................43
End Notes...............................................................................................................59

INTRODUCTION
This is a report of State activity in the Supplemental Nutrition Assistance Program (SNAP). The data contained herein is State reported data or data calculated from State reported data.
The tables are based on data for all of Fiscal Year 2015. Fiscal Year 2015 data in this report reflects data available in National Data Bank as of June 2016.
As may be expected in a report of this size, which consolidates information taken from multiple data sources, there are some apparent discrepancies in reported data. States report nearly all of the data in this report on a quarterly or yearly basis. Differences between State reporting methods and timeframes may lead to minor discrepancies between some similar data elements in this report. In addition, some data may still be revised after the publication of this report.
To assist the reader, end notes are provided at the conclusion of the report identifying the data sources and other pertinent information for each individual section. All data, with two exceptions, was compiled from the National Data Bank, the official repository of SNAP data. The report was prepared by the Program Accountability and Administration Division. Some of the data highlighted in this report are:
• Recipient Claims Table: Reports onthe methods used by Stateagencies to collect claims againstrecipient households. Some of the
data included in the recipient claims table is derived from administrative offset weekly
statistical reports prepared by the U. S. Department of the Treasury.
• Ranking Section: Tables that rank participation and issuance data, from high to low, for each State.
This entire report is available on the SNAP web page at: www.fns.usda.gov/pd/snapmain.html.
If there are any questions concerning the data in this publication, contact the State Administration Branch at [email protected].
1

PERCENTACTIVITY FY 2014 FY 2015 CHANGE
PARTICIPATION AND ISSUANCEPERSONS (MONTHLY) (IN MIL) 46.5 45.8 -1.51%HOUSEHOLDS (MONTHLY) (IN MIL) 22.7 22.5 -0.88%ISSUANCE (IN MIL $) $69,999.8 $69,655.4 -0.49%AVG MONTHLY BENEFIT PER PERSON $125.50 $127.57 1.65%AVG MONTHLY BENEFIT PER HOUSEHOLD $256.98 $257.73 0.29%
STATE ADMINISTRATIVE COSTS (IN MIL $) TOTAL COSTS $7,553.0 $7,653.4 1.33%FEDERAL SHARE OF CERTIFICATION $2,378.8 $2,502.9 5.22%FEDERAL SHARE OF ISSUANCE ACTIVITY $153.3 $145.0 -5.41%FEDERAL SHARE OF FRAUD CONTROL $153.0 $161.4 5.49%FEDERAL SHARE OF TOTAL $3,838.3 $3,777.6 -1.58%
FAIR HEARINGS
FAIR HEARING DECISIONS 91,888 68,213 -25.77%
FRAUD CONTROL ACTIVITYSTATE INVESTIGATIONS COMPLETED 641,005 723,111 12.81%DISQUALIFICATION CONSENT AGREEMENTS 3,513 2,913 -17.08%STATE PROSECUTIONS COMPLETED 4,979 5,075 1.93%FRAUD HEARINGS WAIVED 21,987 20,320 -7.58%FRAUD HEARINGS COMPLETED 17,052 19,910 16.76%TOTAL DISQUALIFICATION DETERMINATIONS 45,202 46,514 2.90%
RECIPIENT CLAIMS (IN MIL $)
FRAUD CLAIMS ESTABLISHED $59.5 $58.6 -1.51%HOUSEHOLD ERROR CLAIMS ESTABLISHED $381.0 $397.2 4.25%AGENCY ERROR CLAIMS ESTABLISHED $134.5 $191.3 42.23%TOTAL CLAIMS ESTABLISHED $575.0 $647.1 12.54%
RECIPIENT CLAIMS RECOUPED $145.6 $143.6 -1.37%RECIPIENT CLAIMS COLLECTED (OTHER STATE MEANS) $57.9 $66.5 14.85%RECIPIENT CLAIMS COLLECTED (TREASURY OFFSET) $136.4 $156.4 14.66%TOTAL CLAIMS COLLECTED $340.0 $366.5 7.79%
SUPPLEMENTAL NUTRITION ASSISTANCE PROGRAM ACTIVITY - FY 2014-2015NATIONAL SUMMARY
2

I.
State Participation
And
Issuance
3
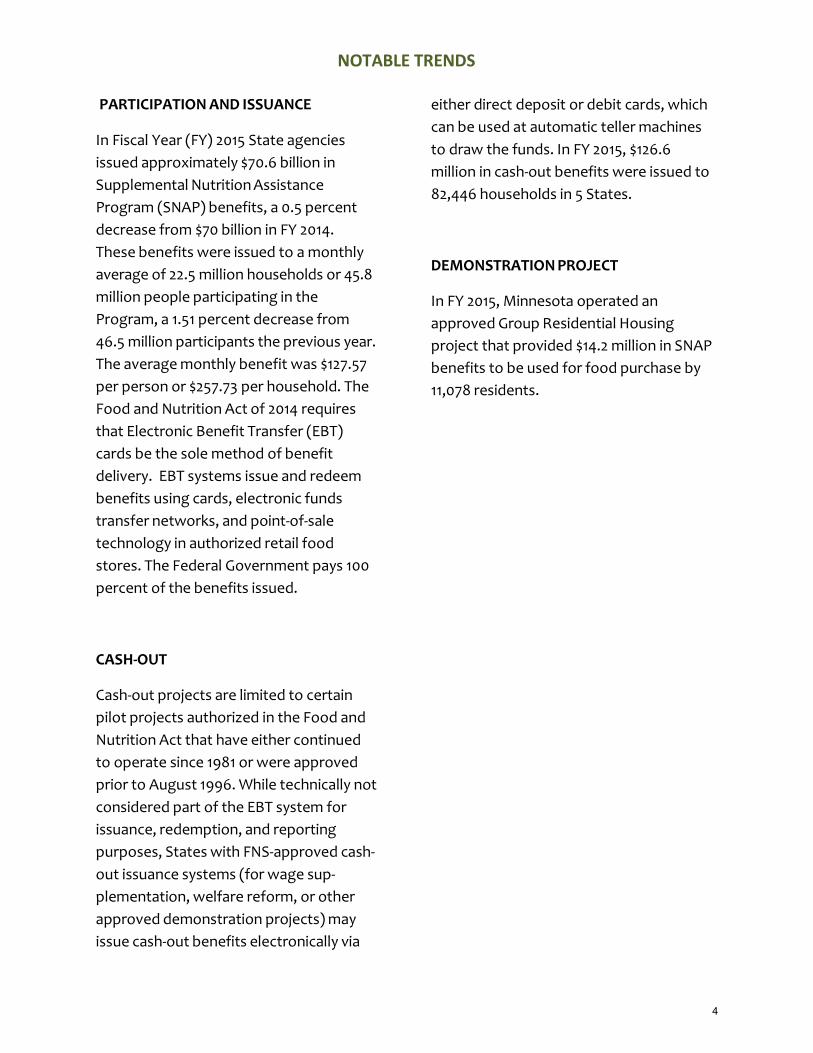
NOTABLE TRENDS
PARTICIPATION AND ISSUANCE
In Fiscal Year (FY) 2015 State agencies issued approximately $70.6 billion in Supplemental Nutrition Assistance Program (SNAP) benefits, a 0.5 percent decrease from $70 billion in FY 2014. These benefits were issued to a monthly average of 22.5 million households or 45.8 million people participating in the Program, a 1.51 percent decrease from 46.5 million participants the previous year. The average monthly benefit was $127.57 per person or $257.73 per household. The Food and Nutrition Act of 2014 requires that Electronic Benefit Transfer (EBT) cards be the sole method of benefit delivery. EBT systems issue and redeem benefits using cards, electronic funds transfer networks, and point-of-sale technology in authorized retail food stores. The Federal Government pays 100 percent of the benefits issued.
CASH-OUT
Cash-out projects are limited to certain pilot projects authorized in the Food and Nutrition Act that have either continued to operate since 1981 or were approved prior to August 1996. While technically not considered part of the EBT system for issuance, redemption, and reporting purposes, States with FNS-approved cash- out issuance systems (for wage sup- plementation, welfare reform, or other approved demonstration projects) may issue cash-out benefits electronically via
either direct deposit or debit cards, which can be used at automatic teller machines to draw the funds. In FY 2015, $126.6 million in cash-out benefits were issued to 82,446 households in 5 States.
DEMONSTRATION PROJECT
In FY 2015, Minnesota operated an approved Group Residential Housing project that provided $14.2 million in SNAP benefits to be used for food purchase by 11,078 residents.
4

TABLE 1: Supplemental Nutrition Assistance Program Participation and Issuance - FY 2015
Persons HouseholdsParticipating Participating
(Monthly) (Monthly) Issuance
STATE
Connecticut 442,161 248,204 $715,334,947Maine 202,579 105,075 $282,015,650Massachusetts 785,778 449,468 $1,202,312,621New Hampshire 106,296 51,478 $132,497,777New York 3,039,108 1,665,683 $5,046,486,639Rhode Island 175,025 100,949 $282,777,163Vermont 84,994 44,950 $124,409,407
Delaware 149,981 71,821 $228,935,464District of Columbia 141,845 80,007 $224,104,447Maryland 781,035 404,708 $1,149,657,589New Jersey 905,728 453,338 $1,291,435,885Pennsylvania 1,826,667 918,761 $2,699,655,059Virgin Islands 27,461 12,610 $56,465,978Virginia 860,375 404,348 $1,230,788,073West Virginia 367,908 181,961 $497,268,953
Alabama 889,380 417,943 $1,341,906,577Florida 3,656,169 2,009,594 $5,688,711,691Georgia 1,800,531 839,207 $2,803,606,880Kentucky 768,882 368,596 $1,112,381,122Mississippi 636,322 296,094 $916,551,543North Carolina 1,646,202 803,495 $2,395,550,386South Carolina 804,572 379,992 $1,208,604,782Tennessee 1,229,391 611,805 $1,884,708,816
Illinois 2,042,306 1,060,589 $3,303,102,831Indiana 831,740 379,929 $1,244,188,231Michigan 1,571,344 824,971 $2,369,233,695Minnesota 496,023 240,410 $627,557,916Ohio 1,676,263 818,704 $2,528,834,777Wisconsin 805,540 406,754 $1,051,153,941
Arkansas 468,904 214,056 $648,769,562Louisiana 859,738 389,519 $1,298,445,656New Mexico 453,146 205,540 $685,206,629Oklahoma 598,257 271,065 $864,950,565Texas 3,724,688 1,558,597 $5,265,414,124
Colorado 495,134 233,113 $771,959,823Iowa 391,224 184,850 $516,608,025Kansas 273,974 121,991 $374,432,741Missouri 844,597 398,662 $1,258,535,557Montana 119,082 56,112 $171,413,823Nebraska 174,092 77,755 $242,092,503North Dakota 53,148 24,771 $77,912,538South Dakota 98,553 43,176 $148,866,948Utah 225,603 88,160 $313,810,557Wyoming 32,606 13,868 $46,448,470
Alaska 81,121 34,187 $168,054,411Arizona 999,401 439,330 $1,459,584,642California 4,417,772 2,096,960 $7,528,039,778Guam 47,166 15,556 $109,108,592Hawaii 188,895 95,545 $505,466,329Idaho 196,872 83,869 $273,758,132Nevada 420,413 209,787 $605,592,527Oregon 779,749 442,090 $1,152,976,715Washington 1,070,933 572,261 $1,527,741,099
US 45,766,672 22,522,261 $69,655,428,586
5

TABLE 2: Supplemental Nutrition Assistance Program Average Monthly Benefit - FY 2015
Average Monthly Average MonthlyBenefit Benefit
Per Person Per Household
STATE
Connecticut $134.82 $240.17Maine $116.01 $223.66Massachusetts $127.51 $222.91New Hampshire $103.87 $214.49New York $138.38 $252.47Rhode Island $134.64 $233.43Vermont $121.98 $230.64
Delaware $127.20 $265.63District of Columbia $131.66 $233.42Maryland $122.66 $236.73New Jersey $118.82 $237.39Pennsylvania $123.16 $244.86Virgin Islands $171.35 $373.17Virginia $119.21 $253.66West Virginia $112.63 $227.74
Alabama $125.73 $267.56Florida $129.66 $235.90Georgia $129.76 $278.40Kentucky $120.56 $251.49Mississippi $120.03 $257.96North Carolina $121.27 $248.45South Carolina $125.18 $265.05Tennessee $127.75 $256.71
Illinois $134.78 $259.53Indiana $124.66 $272.90Michigan $125.65 $239.32Minnesota $105.43 $217.53Ohio $125.72 $257.40Wisconsin $108.74 $215.35
Arkansas $115.30 $252.57Louisiana $125.86 $277.79New Mexico $126.01 $277.81Oklahoma $120.48 $265.91Texas $117.80 $281.53
Colorado $129.92 $275.96Iowa $110.04 $232.90Kansas $113.89 $255.78Missouri $124.18 $263.07Montana $119.96 $254.57Nebraska $115.88 $259.46North Dakota $122.16 $262.11South Dakota $125.88 $287.32Utah $115.92 $296.63Wyoming $118.71 $279.12
Alaska $172.64 $409.64Arizona $121.71 $276.86California $142.00 $299.16Guam $192.78 $584.50Hawaii $222.99 $440.86Idaho $115.88 $272.01Nevada $120.04 $240.56Oregon $123.22 $217.33Washington $118.88 $222.47
US $127.57 $257.73
6

TABLE 3: Supplemental Nutrition Assistance Program Participation By Benefit Type - Persons - FY 2015
Persons Persons Persons TotalReceiving Receiving Receiving Participating
Cash EBT Group Housing Persons (Monthly Average) (Monthly Average) (Monthly Average) (Monthly Average)
STATE
Connecticut 0 442,161 0 442,161Maine 0 202,579 0 202,579Massachusetts 0 785,778 0 785,778New Hampshire 0 106,296 0 106,296New York 0 3,039,108 0 3,039,108Rhode Island 0 175,025 0 175,025Vermont 15,814 69,180 0 84,994
Delaware 0 149,981 0 149,981District of Columbia 0 141,845 0 141,845Maryland 0 781,035 0 781,035New Jersey 0 905,728 0 905,728Pennsylvania 0 1,826,667 0 1,826,667Virgin Islands 0 27,461 0 27,461Virginia 0 860,375 0 860,375West Virginia 0 367,908 0 367,908
Alabama 0 889,380 0 889,380Florida 0 3,656,169 0 3,656,169Georgia 0 1,800,531 0 1,800,531Kentucky 0 768,882 0 768,882Mississippi 0 636,322 0 636,322North Carolina 0 1,646,202 0 1,646,202South Carolina 0 804,572 0 804,572Tennessee 0 1,229,391 0 1,229,391
Illinois 0 2,042,306 0 2,042,306Indiana 0 831,740 0 831,740Michigan 0 1,571,344 0 1,571,344Minnesota 20,568 464,976 11,078 496,023Ohio 16,845 1,659,418 0 1,676,263Wisconsin 0 805,540 0 805,540
Arkansas 0 468,904 0 468,904Louisiana 0 859,738 0 859,738New Mexico 0 453,146 0 453,146Oklahoma 0 598,257 0 598,257Texas 0 3,724,688 0 3,724,688
Colorado 0 495,134 0 495,134Iowa 0 391,224 0 391,224Kansas 0 273,974 0 273,974Missouri 0 844,597 0 844,597Montana 0 119,082 0 119,082Nebraska 0 174,092 0 174,092North Dakota 0 53,148 0 53,148South Dakota 0 98,553 0 98,553Utah 2,026 223,577 0 225,603Wyoming 0 32,606 0 32,606
Alaska 0 81,121 0 81,121Arizona 0 999,401 0 999,401California 0 4,417,772 0 4,417,772Guam 0 47,166 0 47,166Hawaii 0 188,895 0 188,895Idaho 0 196,872 0 196,872Nevada 0 420,413 0 420,413Oregon 33,556 746,193 0 779,749Washington 0 1,070,933 0 1,070,933
US 88,808 45,667,384 11,078 45,766,672
7

TABLE 4: Supplemental Nutrition Assistance Program Participation By Benefit Type - Households - FY 2015
Households Households Households TotalReceiving Receiving Receiving Participating
Cash EBT Group Housing Households(Monthly Average) (Monthly Average) (Monthly Average) (Monthly Average)
STATE
Connecticut -- 248,204 -- 715,334,947Maine -- 105,075 -- 282,015,650Massachusetts -- 449,468 -- 1,202,312,621New Hampshire -- 51,478 -- 132,497,777New York -- 1,665,683 -- 5,046,486,639Rhode Island -- 100,949 -- 282,777,163Vermont 14,471 30,479 -- 124,409,407
Delaware -- 71,821 -- 228,935,464District of Columbia -- 80,007 -- 224,104,447Maryland -- 404,708 -- 1,149,657,589New Jersey -- 453,338 -- 1,291,435,885Pennsylvania -- 918,761 -- 2,699,655,059Virgin Islands -- 12,610 -- 56,465,978Virginia -- 404,348 -- 1,230,788,073West Virginia -- 181,961 -- 497,268,953
Alabama -- 417,943 -- 1,341,906,577Florida -- 2,009,594 -- 5,688,711,691Georgia -- 839,207 -- 2,803,606,880Kentucky -- 368,596 -- 1,112,381,122Mississippi -- 296,094 -- 916,551,543North Carolina -- 803,495 -- 2,395,550,386South Carolina -- 379,992 -- 1,208,604,782Tennessee -- 611,805 -- 1,884,708,816
Illinois -- 1,060,589 -- 3,303,102,831Indiana -- 379,929 -- 1,244,188,231Michigan -- 824,971 -- 2,369,233,695Minnesota 19,219 210,712 10,479 627,557,916Ohio 15,932 802,773 -- 2,528,834,777Wisconsin -- 406,754 -- 1,051,153,941
Arkansas -- 214,056 -- 648,769,562Louisiana -- 389,519 -- 1,298,445,656New Mexico -- 205,540 -- 685,206,629Oklahoma -- 271,065 -- 864,950,565Texas -- 1,558,597 -- 5,265,414,124
Colorado -- 233,113 -- 771,959,823Iowa -- 184,850 -- 516,608,025Kansas -- 121,991 -- 374,432,741Missouri -- 398,662 -- 1,258,535,557Montana -- 56,112 -- 171,413,823Nebraska -- 77,755 -- 242,092,503North Dakota -- 24,771 -- 77,912,538South Dakota -- 43,176 -- 148,866,948Utah 1,926 86,235 -- 313,810,557Wyoming -- 13,868 -- 46,448,470
Alaska -- 34,187 -- 168,054,411Arizona -- 439,330 -- 1,459,584,642California -- 2,096,960 -- 7,528,039,778Guam -- 15,556 -- 109,108,592Hawaii -- 95,545 -- 505,466,329Idaho -- 83,869 -- 273,758,132Nevada -- 209,787 -- 605,592,527Oregon 30,899 411,191 -- 1,152,976,715Washington -- 572,261 -- 1,527,741,099
US 82,446 22,429,335 10,479 69,655,428,586
8

TABLE 5: Supplemental Nutrition Assistance Program Issuance By Benefit Type - Issuance - FY 2015
Issuance By Issuance By Issuance By TotalCash EBT Group Housing Issuance
STATE
Connecticut $715,334,947 -- $715,334,947Maine -- $282,015,650 -- $282,015,650Massachusetts _- $1,202,312,621 -- $1,202,312,621New Hampshire -- $132,497,777 -- $132,497,777New York -- $5,046,486,639 -- $5,046,486,639Rhode Island -- $282,777,163 -- $282,777,163Vermont $28,484,253 $95,925,154 -- $124,409,407
Delaware -- $228,935,464 -- $228,935,464District of Columbia -- $224,104,447 -- $224,104,447Maryland -- $1,149,657,589 -- $1,149,657,589New Jersey -- $1,291,435,885 -- $1,291,435,885Pennsylvania -- $2,699,655,059 -- $2,699,655,059Virgin Islands -- $56,465,978 -- $56,465,978Virginia -- $1,230,788,073 -- $1,230,788,073West Virginia -- $497,268,953 -- $497,268,953
Alabama -- $1,341,906,577 -- $1,341,906,577Florida -- $5,688,711,691 -- $5,688,711,691Georgia -- $2,803,606,880 -- $2,803,606,880Kentucky -- $1,112,381,122 -- $1,112,381,122Mississippi -- $916,551,543 -- $916,551,543North Carolina -- $2,395,550,386 -- $2,395,550,386South Carolina -- $1,208,604,782 -- $1,208,604,782Tennessee -- $1,884,708,816 -- $1,884,708,816
Illinois -- $3,303,102,831 -- $3,303,102,831Indiana -- $1,244,188,231 -- $1,244,188,231Michigan _- $2,369,233,695 -- $2,369,233,695Minnesota $22,463,071 $590,855,198 $14,239,647 $627,557,916Ohio $21,658,579 $2,507,176,198 -- $2,528,834,777Wisconsin -- $1,051,153,941 -- $1,051,153,941
Arkansas -- $648,769,562 -- $648,769,562Louisiana -- $1,298,445,656 -- $1,298,445,656New Mexico -- $685,206,629 -- $685,206,629Oklahoma -- $864,950,565 -- $864,950,565Texas -- $5,265,414,124 -- $5,265,414,124
Colorado -- $771,959,823 -- $771,959,823Iowa -- $516,608,025 -- $516,608,025Kansas -- $374,432,741 -- $374,432,741Missouri -- $1,258,535,557 -- $1,258,535,557Montana -- $171,413,823 -- $171,413,823Nebraska -- $242,092,503 -- $242,092,503North Dakota -- $77,912,538 -- $77,912,538South Dakota -- $148,866,948 -- $148,866,948Utah $2,045,901 $311,764,656 -- $313,810,557Wyoming -- $46,448,470 -- $46,448,470
Alaska -- $168,054,411 -- $168,054,411Arizona -- $1,459,584,642 -- $1,459,584,642California -- $7,528,039,778 -- $7,528,039,778Guam -- $109,108,592 -- $109,108,592Hawaii -- $505,466,329 -- $505,466,329Idaho -- $273,758,132 -- $273,758,132Nevada -- $605,592,527 -- $605,592,527Oregon $51,967,555 $1,101,009,160 -- $1,152,976,715Washington -- $1,527,741,099 -- $1,527,741,099
US $126,619,359 $69,514,569,580 $14,239,647 $69,655,428,586
9

II.
Administrative
Costs
10

NOTABLE TRENDS
ADMINISTRATIVE COSTS
State agency administrative costs are
affected by a number of factors including
participation levels, the number and salary
level of State staff, inflation, the location
of State agency offices, type of issuance
system, worker training costs, degree of
automation, level of fraud control activity,
etc. The Food and Nutrition Service (FNS)
pays approximately 50 percent of State
agency administrative costs to operate the
program. Total State agency admini-
strative costs prior to Federal cost sharing
were $7.65 billion, up 1.33 percent from
$7.55 billion the previous year. In FY 2015,
the Federal share of administrative costs
decreased 1.6 percent to about $3.78
billion. The Federal share of admini-
strative cost per case (i.e., per household)
per month increased by 5.3 percent to
$13.98 in FY2015.
The Federal share of certification costs
increased 5.2 percent to $2.5 billion in FY
2015 from $2.38 billion in FY 2014. The
Federal share of the certification cost per
case (i.e., per household) per month
increased from $8.73 per case per month
to $9.26 per case per month.
11

TABLE 6: Supplemental Nutrition Assistance Program Federal Share of Selected State Admin. Costs - FY 2015
Federal Share Federal Share Federal ShareCertification Issuance Fraud Control
Costs Costs Costs
STATE
Connecticut $21,977,335 $932,971 $2,470,808Maine $5,533,295 $612,274 $830,828Massachusetts $48,247,394 $1,505,845 $2,094,468New Hampshire $1,157,107 $254,130 $231,833New York $226,191,255 $3,678,844 $32,245,742Rhode Island $2,941,789 $430,951 $154,010Vermont $1,624,846 $1,937,561 $281,476
Delaware $10,931,372 $499,712 $0District of Columbia $9,633,312 $415,538 $497,175Maryland $59,119,235 $2,309,064 $731,361New Jersey $91,659,636 $3,518,674 $13,790,695Pennsylvania $127,175,062 $6,569,619 $5,463,175Virgin Islands $3,670,090 $357,285 $189,957Virginia $72,886,990 $4,096,363 $3,672,104West Virginia $10,325,479 $889,526 $378,884
Alabama $32,905,681 $1,403,692 $786,208Florida $53,047,583 $5,484,085 $2,191,111Georgia $68,188,339 $2,669,713 $3,111,879Kentucky $38,492,890 $2,375,806 $1,316,016Mississippi $16,903,237 $437,970 $1,134,506North Carolina $73,920,850 $2,622,814 $5,657,599South Carolina $16,208,873 $1,600,369 $1,724,385Tennessee $63,211,424 $1,919,994 $1,401,364
Illinois $60,985,304 $3,879,697 $2,147,762Indiana $52,085,918 $1,739,309 $588,350Michigan $112,282,059 $1,472,625 $6,906,589Minnesota $39,555,114 $5,349,646 $1,632,311Ohio $40,439,102 $3,968,507 $1,808,539Wisconsin $25,842,552 $2,053,671 $1,419,074
Arkansas $29,132,935 $1,050,412 $1,001,108Louisiana $52,755,602 $1,354,008 $115,577New Mexico $22,526,170 $744,359 $87,107Oklahoma $32,458,807 $1,265,637 $1,242,719Texas $114,282,741 $5,967,471 $5,214,027
Colorado $32,000,338 $1,033,658 $2,719,523Iowa $15,677,431 $1,263,777 $540,246Kansas $13,139,060 $620,055 $59,203Missouri $25,676,146 $1,443,608 $522,970Montana $6,319,443 $657,470 $13,332Nebraska $10,101,207 $309,211 $297,962North Dakota $5,263,859 $325,111 $0South Dakota $4,734,112 $372,936 $141,853Utah $10,660,981 $478,652 $1,202,758Wyoming $2,110,603 $53,800 $296,158
Alaska $8,626,562 $171,793 $505,116Arizona $41,429,986 $2,121,774 $1,658,552California $541,076,514 $49,175,178 $46,669,811Guam $752,384 $60,737 $233,203Hawaii $13,805,953 $371,157 $1,085,868Idaho $4,550,994 $1,539,701 $283,780Nevada $16,437,638 $1,219,913 $1,059,319Oregon $62,370,557 $3,243,274 $174,044Washington $49,842,749 $5,202,469 $1,438,548
US $2,502,875,895 $145,032,416 $161,420,993
12

TABLE 7: Supplemental Nutrition Assistance Program Federal Share of Selected State Admin. Costs - FY 2015
Federal Share Federal ShareADP Development ADP Operations
Costs Costs
STATE
Connecticut $1,337,583 $2,822,002Maine $0 $1,190,646Massachusetts $0 $635,499New Hampshire $35,503 $1,766,443New York $394,699 $5,462,500Rhode Island $0 $1,139,504Vermont $0 $431,083
Delaware $2,500,676 $321,460District of Columbia $0 $588,640Maryland $0 $3,425,289New Jersey $2,763,494 $9,719,481Pennsylvania $1,324,692 $11,977,804Virgin Islands $0 $862,438Virginia $0 $13,011,939West Virginia $0 $2,801,988
Alabama $149,037 $639,633Florida $0 $3,779,649Georgia $0 $15,743,185Kentucky $0 $2,811,710Mississippi $0 $1,354,877North Carolina $2,893,101 $1,522,666South Carolina $0 $2,742,648Tennessee $0 $3,346,103
Illinois $932,003 $8,242,441Indiana $1,885,554 $4,093,005Michigan $0 $13,552,481Minnesota $0 $4,753,634Ohio $0 $13,920,308Wisconsin $0 $9,786,547
Arkansas $1,626,326 $250,750Louisiana $1,499,018 $0New Mexico $2,494,868 $1,843,086Oklahoma $7,221 $2,831,883Texas $0 $36,634,668
Colorado $0 $6,527,183Iowa $92 $1,351,142Kansas $723,190 $1,200,118Missouri $0 $2,891,460Montana $0 $839,214Nebraska $45,073 $2,393,757North Dakota $981,163 $381,304South Dakota $0 $549,582Utah $0 $1,241,860Wyoming $0 $594,336
Alaska $0 $721,810Arizona $3,444,071 $2,375,090California $10,839,718 $100,872,733Guam $0 $60,163Hawaii $0 $2,264,244Idaho $0 $1,004,078Nevada $96,558 $2,690,548Oregon $0 $4,012,239Washington $483,584 $8,630,663
US $40,668,124 $324,607,514
13
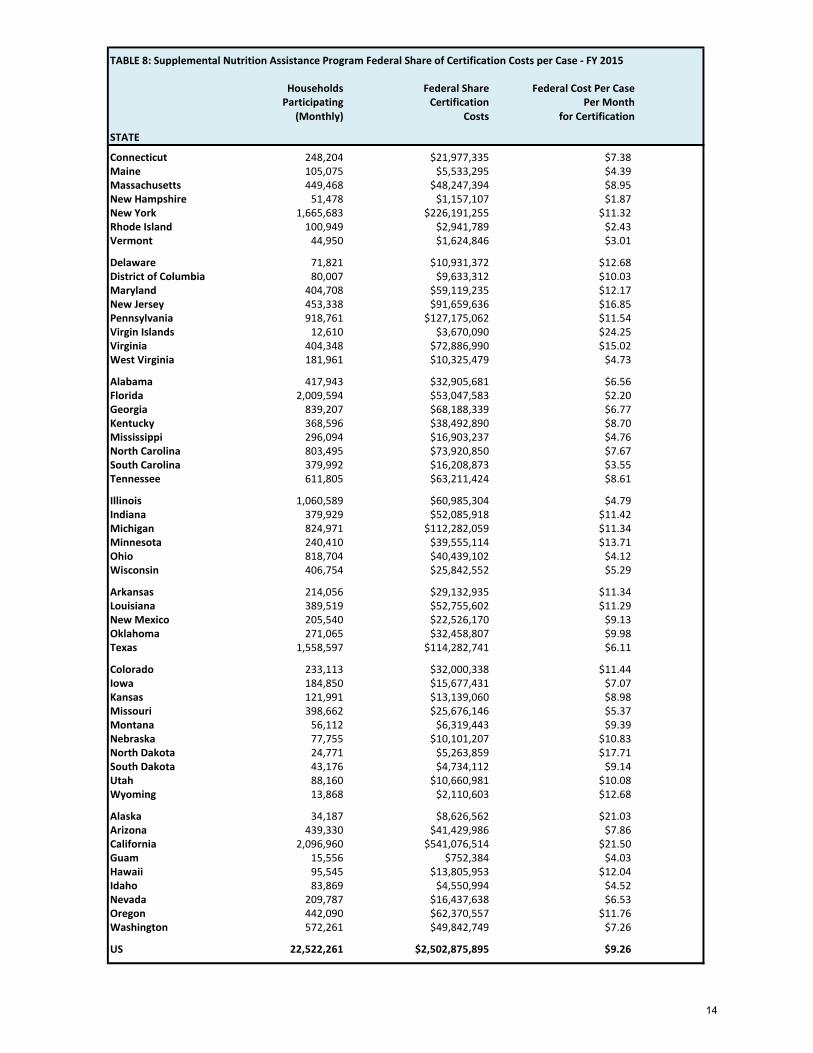
TABLE 8: Supplemental Nutrition Assistance Program Federal Share of Certification Costs per Case - FY 2015
Households Federal Share Federal Cost Per CaseParticipating Certification Per Month
(Monthly) Costs for Certification
STATE
Connecticut 248,204 $21,977,335 $7.38Maine 105,075 $5,533,295 $4.39Massachusetts 449,468 $48,247,394 $8.95New Hampshire 51,478 $1,157,107 $1.87New York 1,665,683 $226,191,255 $11.32Rhode Island 100,949 $2,941,789 $2.43Vermont 44,950 $1,624,846 $3.01
Delaware 71,821 $10,931,372 $12.68District of Columbia 80,007 $9,633,312 $10.03Maryland 404,708 $59,119,235 $12.17New Jersey 453,338 $91,659,636 $16.85Pennsylvania 918,761 $127,175,062 $11.54Virgin Islands 12,610 $3,670,090 $24.25Virginia 404,348 $72,886,990 $15.02West Virginia 181,961 $10,325,479 $4.73
Alabama 417,943 $32,905,681 $6.56Florida 2,009,594 $53,047,583 $2.20Georgia 839,207 $68,188,339 $6.77Kentucky 368,596 $38,492,890 $8.70Mississippi 296,094 $16,903,237 $4.76North Carolina 803,495 $73,920,850 $7.67South Carolina 379,992 $16,208,873 $3.55Tennessee 611,805 $63,211,424 $8.61
Illinois 1,060,589 $60,985,304 $4.79Indiana 379,929 $52,085,918 $11.42Michigan 824,971 $112,282,059 $11.34Minnesota 240,410 $39,555,114 $13.71Ohio 818,704 $40,439,102 $4.12Wisconsin 406,754 $25,842,552 $5.29
Arkansas 214,056 $29,132,935 $11.34Louisiana 389,519 $52,755,602 $11.29New Mexico 205,540 $22,526,170 $9.13Oklahoma 271,065 $32,458,807 $9.98Texas 1,558,597 $114,282,741 $6.11
Colorado 233,113 $32,000,338 $11.44Iowa 184,850 $15,677,431 $7.07Kansas 121,991 $13,139,060 $8.98Missouri 398,662 $25,676,146 $5.37Montana 56,112 $6,319,443 $9.39Nebraska 77,755 $10,101,207 $10.83North Dakota 24,771 $5,263,859 $17.71South Dakota 43,176 $4,734,112 $9.14Utah 88,160 $10,660,981 $10.08Wyoming 13,868 $2,110,603 $12.68
Alaska 34,187 $8,626,562 $21.03Arizona 439,330 $41,429,986 $7.86California 2,096,960 $541,076,514 $21.50Guam 15,556 $752,384 $4.03Hawaii 95,545 $13,805,953 $12.04Idaho 83,869 $4,550,994 $4.52Nevada 209,787 $16,437,638 $6.53Oregon 442,090 $62,370,557 $11.76Washington 572,261 $49,842,749 $7.26
US 22,522,261 $2,502,875,895 $9.26
14

TABLE 9: Supplemental Nutrition Assistance Program Federal Share of Total State Cost per Case - FY 2015
Households Federal Share Federal Total Participating Total Cost Per Case
(Monthly) Costs per Month
STATE
Connecticut 248,204 $49,995,111 $16.79Maine 105,075 $10,066,536 $7.98Massachusetts 449,468 $59,094,513 $10.96New Hampshire 51,478 $7,772,128 $12.58New York 1,665,683 $369,757,073 $18.50Rhode Island 100,949 $10,781,805 $8.90Vermont 44,950 $11,284,251 $20.92
Delaware 71,821 $15,298,965 $17.75District of Columbia 80,007 $18,482,310 $19.25Maryland 404,708 $69,738,932 $14.36New Jersey 453,338 $146,558,599 $26.94Pennsylvania 918,761 $160,788,718 $14.58Virgin Islands 12,610 $5,536,828 $36.59Virginia 404,348 $99,482,594 $20.50West Virginia 181,961 $15,707,645 $7.19
Alabama 417,943 $44,441,833 $8.86Florida 2,009,594 $80,997,415 $3.36Georgia 839,207 $98,443,383 $9.78Kentucky 368,596 $47,696,002 $10.78Mississippi 296,094 $21,053,199 $5.93North Carolina 803,495 $92,158,332 $9.56South Carolina 379,992 $33,182,765 $7.28Tennessee 611,805 $72,765,232 $9.91
Illinois 1,060,589 $97,435,988 $7.66Indiana 379,929 $65,797,553 $14.43Michigan 824,971 $143,174,657 $14.46Minnesota 240,410 $62,382,769 $21.62Ohio 818,704 $104,903,192 $10.68Wisconsin 406,754 $65,643,596 $13.45
Arkansas 214,056 $35,070,739 $13.65Louisiana 389,519 $58,310,092 $12.47New Mexico 205,540 $30,212,428 $12.25Oklahoma 271,065 $38,719,349 $11.90Texas 1,558,597 $190,609,525 $10.19
Colorado 233,113 $50,678,950 $18.12Iowa 184,850 $20,176,910 $9.10Kansas 121,991 $18,680,024 $12.76Missouri 398,662 $33,387,008 $6.98Montana 56,112 $11,425,319 $16.97Nebraska 77,755 $14,358,108 $15.39North Dakota 24,771 $8,135,184 $27.37South Dakota 43,176 $8,403,119 $16.22Utah 88,160 $14,951,211 $14.13Wyoming 13,868 $6,771,354 $40.69
Alaska 34,187 $10,534,912 $25.68Arizona 439,330 $62,930,733 $11.94California 2,096,960 $861,888,092 $34.25Guam 15,556 $1,568,029 $8.40Hawaii 95,545 $19,003,103 $16.57Idaho 83,869 $8,428,958 $8.38Nevada 209,787 $23,747,022 $9.43Oregon 442,090 $76,337,854 $14.39Washington 572,261 $92,863,204 $13.52
US 22,522,261 $3,777,613,151 $13.98
15

TABLE 10: Supplemental Nutrition Assistance Program State Administrative Costs - FY 2015
State Share Federal Share Total StateAdministrative Administrative Administrative
Costs Costs Costs
STATE
Connecticut $52,350,906 $49,995,111 $102,346,017Maine $10,852,274 $10,066,536 $20,918,810Massachusetts $62,278,919 $59,094,513 $121,373,432New Hampshire $8,634,227 $7,772,128 $16,406,355New York $426,280,212 $369,757,073 $796,037,285Rhode Island $10,484,702 $10,781,805 $21,266,507Vermont $12,346,905 $11,284,251 $23,631,156
Delaware $14,925,671 $15,298,965 $30,224,636District of Columbia $21,493,381 $18,482,310 $39,975,691Maryland $70,183,799 $69,738,932 $139,922,731New Jersey $160,913,791 $146,558,599 $307,472,390Pennsylvania $157,298,446 $160,788,718 $318,087,164Virgin Islands $4,916,348 $5,536,828 $10,453,176Virginia $97,511,175 $99,482,594 $196,993,769West Virginia $15,229,257 $15,707,645 $30,936,902
Alabama $43,789,710 $44,441,833 $88,231,543Florida $86,726,922 $80,997,415 $167,724,337Georgia $96,811,245 $98,443,383 $195,254,628Kentucky $52,914,421 $47,696,002 $100,610,423Mississippi $23,467,159 $21,053,199 $44,520,358North Carolina $90,772,973 $92,158,332 $182,931,305South Carolina $34,075,282 $33,182,765 $67,258,047Tennessee $75,718,825 $72,765,232 $148,484,057
Illinois $107,955,488 $97,435,988 $205,391,476Indiana $66,065,666 $65,797,553 $131,863,219Michigan $147,418,908 $143,174,657 $290,593,565Minnesota $65,593,335 $62,382,769 $127,976,104Ohio $105,611,402 $104,903,192 $210,514,594Wisconsin $57,182,185 $65,643,596 $122,825,781
Arkansas $36,990,950 $35,070,739 $72,061,689Louisiana $58,418,342 $58,310,092 $116,728,434New Mexico $31,367,681 $30,212,428 $61,580,109Oklahoma $42,551,773 $38,719,349 $81,271,122Texas $171,783,145 $190,609,525 $362,392,670
Colorado $49,937,199 $50,678,950 $100,616,149Iowa $21,871,983 $20,176,910 $42,048,893Kansas $21,314,990 $18,680,024 $39,995,014Missouri $32,236,270 $33,387,008 $65,623,278Montana $11,078,984 $11,425,319 $22,504,303Nebraska $14,977,985 $14,358,108 $29,336,093North Dakota $8,155,190 $8,135,184 $16,290,374South Dakota $6,843,985 $8,403,119 $15,247,104Utah $16,176,428 $14,951,211 $31,127,639Wyoming $6,769,780 $6,771,354 $13,541,134
Alaska $12,179,870 $10,534,912 $22,714,782Arizona $64,925,859 $62,930,733 $127,856,592California $872,264,076 $861,888,092 $1,734,152,168Guam $1,430,883 $1,568,029 $2,998,912Hawaii $18,725,164 $19,003,103 $37,728,267Idaho $9,541,941 $8,428,958 $17,970,899Nevada $25,508,424 $23,747,022 $49,255,446Oregon $80,454,287 $76,337,854 $156,792,141Washington $80,443,215 $92,863,204 $173,306,419
US $3,875,751,938 $3,777,613,151 $7,653,365,089
16

TABLE 11: Supplemental Nutrition Assistance Program Total Administrative Cost Per Case - FY 2015
Households Total State State Admin.Participating Administrative Cost Per Case
(Monthly) Costs Per Month
STATE
Connecticut 248,204 $102,346,017 $34.36Maine 105,075 $20,918,810 $16.59Massachusetts 449,468 $121,373,432 $22.50New Hampshire 51,478 $16,406,355 $26.56New York 1,665,683 $796,037,285 $39.83Rhode Island 100,949 $21,266,507 $17.56Vermont 44,950 $23,631,156 $43.81
Delaware 71,821 $30,224,636 $35.07District of Columbia 80,007 $39,975,691 $41.64Maryland 404,708 $139,922,731 $28.81New Jersey 453,338 $307,472,390 $56.52Pennsylvania 918,761 $318,087,164 $28.85Virgin Islands 12,610 $10,453,176 $69.08Virginia 404,348 $196,993,769 $40.60West Virginia 181,961 $30,936,902 $14.17
Alabama 417,943 $88,231,543 $17.59Florida 2,009,594 $167,724,337 $6.96Georgia 839,207 $195,254,628 $19.39Kentucky 368,596 $100,610,423 $22.75Mississippi 296,094 $44,520,358 $12.53North Carolina 803,495 $182,931,305 $18.97South Carolina 379,992 $67,258,047 $14.75Tennessee 611,805 $148,484,057 $20.22
Illinois 1,060,589 $205,391,476 $16.14Indiana 379,929 $131,863,219 $28.92Michigan 824,971 $290,593,565 $29.35Minnesota 240,410 $127,976,104 $44.36Ohio 818,704 $210,514,594 $21.43Wisconsin 406,754 $122,825,781 $25.16
Arkansas 214,056 $72,061,689 $28.05Louisiana 389,519 $116,728,434 $24.97New Mexico 205,540 $61,580,109 $24.97Oklahoma 271,065 $81,271,122 $24.99Texas 1,558,597 $362,392,670 $19.38
Colorado 233,113 $100,616,149 $35.97Iowa 184,850 $42,048,893 $18.96Kansas 121,991 $39,995,014 $27.32Missouri 398,662 $65,623,278 $13.72Montana 56,112 $22,504,303 $33.42Nebraska 77,755 $29,336,093 $31.44North Dakota 24,771 $16,290,374 $54.80South Dakota 43,176 $15,247,104 $29.43Utah 88,160 $31,127,639 $29.42Wyoming 13,868 $13,541,134 $81.37
Alaska 34,187 $22,714,782 $55.37Arizona 439,330 $127,856,592 $24.25California 2,096,960 $1,734,152,168 $68.92Guam 15,556 $2,998,912 $16.07Hawaii 95,545 $37,728,267 $32.91Idaho 83,869 $17,970,899 $17.86Nevada 209,787 $49,255,446 $19.57Oregon 442,090 $156,792,141 $29.56Washington 572,261 $173,306,419 $25.24
US 22,522,261 $7,653,365,089 $28.32
17

III.
Fair
Hearings
18

NOTABLE TRENDS
FAIR HEARINGS
SNAP regulations provide recourse to households that are denied benefits or have their allotment reduced, suspended or cancelled as a result of an adverse decision by the State agency. This recourse is called the fair hearing process. The number of fair hearings conducted by States is reported annually on Form FNS- 366B, the Program Activity Statement.
In FY 2015, the number of fair hearings decreased by 25.8 percent to 68,213. The State’s decision was upheld in 53.7 percent of fair hearings, compared to 73.6 percent in FY 2014.
19

TABLE 12: Supplemental Nutrition Assistance Program Fair Hearings Upheld and Reversed - FY 2015
Fair FairHearings Hearings Percent
Upheld Reversed Upheld
STATE
Connecticut 259 77 77.08%Maine 61 16 79.22%Massachusetts 1,610 916 63.74%New Hampshire 18 4 81.82%New York 2,408 5,466 30.58%Rhode Island 15 2 88.24%Vermont 16 3 84.21%
Delaware 94 30 75.81%District of Columbia 32 27 54.24%Maryland 102 30 77.27%New Jersey 101 43 70.14%Pennsylvania 10,396 15,366 40.35%Virgin Islands 12 0 100.00%Virginia 515 77 86.99%West Virginia 69 10 87.34%
Alabama 112 25 81.75%Florida 353 101 77.75%Georgia 36 37 49.32%Kentucky 46 21 68.66%Mississippi 215 12 94.71%North Carolina 381 102 78.88%South Carolina 703 41 94.49%Tennessee 3,454 693 83.29%
Illinois 82 18 82.00%Indiana 805 390 67.36%Michigan 2,618 764 64.31%Minnesota 636 269 70.28%Ohio 5,645 3,523 61.57%Wisconsin 431 119 78.36%
Arkansas 248 40 86.11%Louisiana 428 5 98.85%New Mexico 59 27 68.60%Oklahoma 41 9 82.00%Texas 452 570 44.23%
Colorado 178 30 85.58%Iowa 230 32 87.79%Kansas 389 1 99.74%Missouri 206 55 78.93%Montana 18 4 81.82%Nebraska 394 51 88.54%North Dakota 6 0 100.00%South Dakota 12 1 92.31%Utah 41 3 93.18%Wyoming 4 0 100.00%
Alaska 35 11 76.09%Arizona 406 709 36.41%California 1,702 1,808 48.49%Guam 17 6 73.91%Hawaii 29 3 90.63%Idaho 57 9 86.36%Nevada 157 6 96.32%Oregon 115 8 93.50%Washington 165 29 85.05%
US 36,614 31,599 53.68%
20

IV.
Fraud Investigations, Prosecutions,
And Administrative Disqualification
Hearings
21

NOTABLE TRENDS
FRAUD CONTROL
In FY 2015, State fraud investigations increased 12.8 percent to 723,111 compared to 641,005 in FY 2014.
Fraud investigations are broken into two categories: pre-certification investigations and post-certification investigations. Pre- certification investigations are cases referred for investigation and completed prior to certification. Investigators assist in front-end detection by acting on referrals in suspicious cases and probing more deeply into a client's circumstances. Positive pre-certification investigations prevent fraud at intake and before a dollar loss can occur. They may also result in administrative hearings or prosecutions that lead to disqualification but no claim will be established.
Post- certification investigations are investigations completed after certification. Positive post-certification investigations may result in an administrative disqualification hearing or prosecution, the disqualification of the individual who has committed an intentional program violation, and the establishment of a claim to recover the over-issuance or amount trafficked.
Prosecution activity increased 19.5 percent, while administrative fraud hearing activity increased 3.3 percent in FY 2015. The number of recipients disqualified from SNAP for an intentional program violation in FY 2014 increased 2.9 percent to 46,514 from the previous year.
22

TABLE 13: Supplemental Nutrition Assistance Program Recipient Fraud Investigations - FY 2015
Pre-cert Pre-cert Post-Cert Post-Cert TotalInvestigations Investigations Investigations Investigations Investigations
Negative Positive Negative Positive Completed
STATE
Connecticut 443 487 1,525 387 2,842Maine 20 15 23 183 241Massachusetts 0 0 5,784 5,296 11,080New Hampshire 105 174 853 154 1,286New York 70,930 161,800 18,528 6,331 257,589Rhode Island 422 68 232 29 751Vermont 37 39 115 306 497
Delaware 700 31 4,056 171 4,958District of Columbia 12 12 295 39 358Maryland 0 0 309 264 573New Jersey 616 637 12,050 5,457 18,760Pennsylvania 10,026 7,275 3,193 1,301 21,795Virgin Islands 503 108 15 285 911Virginia 175 335 11,174 1,510 13,194West Virginia 86 4 2,673 281 3,044
Alabama 0 0 698 703 1,401Florida 2,175 12,852 16,031 10,687 41,745Georgia 0 0 5,035 3,959 8,994Kentucky 29 48 81 321 479Mississippi 0 0 68 2,828 2,896North Carolina 166 246 6,952 3,296 10,660South Carolina 0 0 6,247 1,277 7,524Tennessee 0 0 5,397 2,494 7,891
Illinois 1,110 1,790 639 267 3,806Indiana 39 0 3,730 62 3,831Michigan 11,644 18,176 3,970 5,848 39,638Minnesota 3,043 2,650 1,373 363 7,429Ohio 1,934 121 17,266 2,144 21,465Wisconsin 501 2,165 952 4,616 8,234
Arkansas 0 0 1,465 8,928 10,393Louisiana 0 0 339 1,180 1,519New Mexico 0 0 10 59 69Oklahoma 0 0 251 350 601Texas 0 0 773 729 1,502
Colorado 20 12 1,443 640 2,115Iowa 777 960 845 1,914 4,496Kansas 91 196 1,397 947 2,631Missouri 0 0 300 203 503Montana 0 0 242 395 637Nebraska 45 6 302 105 458North Dakota 12 10 57 55 134South Dakota 7 56 106 136 305Utah 119 20 1,622 454 2,215Wyoming 0 0 268 27 295
Alaska 377 1,676 333 140 2,526Arizona 631 1,120 2,257 3,840 7,848California 97,168 16,122 41,906 4,041 159,237Guam 0 0 100 140 240Hawaii 0 0 971 92 1,063Idaho 0 0 1,731 339 2,070Nevada 144 1 5,167 861 6,173Oregon 0 0 1,696 507 2,203Washington 6,542 3,312 48 104 10,006
US 210,649 232,524 192,893 87,045 723,111
23

TABLE 14: Supplemental Nutrition Assistance Program Recipient Fraud Dollars Determined - FY 2015
Fraud Dollars Fraud DollarsDetermined by Determined by
Pre-Cert Post-CertInvestigations Investigations
STATE
Connecticut $68,174 $594,466Maine $0 $0Massachusetts $0 $6,705,815New Hampshire $73,833 $605,012New York $213,692,346 $11,477,541Rhode Island $15,200 $44,229Vermont $8,970 $395,921
Delaware $42,936 $315,129District of Columbi $2,553 $259,269Maryland $0 $588,300New Jersey $297,848 $4,478,650Pennsylvania $3,611,643 $3,676,202Virgin Islands $86,043 $553,493Virginia $71,806 $3,536,669West Virginia $12,249 $2,039,385
Alabama $0 $1,695,374Florida $19,659,118 $19,369,963Georgia $0 $12,394,186Kentucky $17,765 $1,259,153Mississippi $0 $4,330,441North Carolina $80,459 $5,759,359South Carolina $0 $2,059,533Tennessee $0 $9,655,774
Illinois $2,637,756 $8,092,142Indiana $0 $183,329Michigan $4,414,252 $14,007,612Minnesota $805,018 $2,156,289Ohio $21,664 $4,361,382Wisconsin $1,464,151 $9,616,416
Arkansas $0 $6,732,348Louisiana $0 $3,628,776New Mexico $0 $254,870Oklahoma $0 $861,855Texas $0 $5,453,704
Colorado $4,978 $2,078,966Iowa $2,478,174 $4,940,221Kansas $131,198 $3,044,893Missouri $0 $555,717Montana $0 $261,912Nebraska $1,876 $321,224North Dakota $2,445 $6,600South Dakota $110,989 $207,315Utah $32,825 $1,183,181Wyoming $0 $89,923
Alaska $484,623 $274,920Arizona $249,422 $1,043,286California $5,352,504 $8,676,027Guam $0 $204,218Hawaii $0 $693,642Idaho $0 $727,205Nevada $357 $1,760,256Oregon $0 $541,440Washington $1,672,754 $253,800
US $257,605,929 $174,007,333
24

TABLE 15: Supplemental Nutrition Assistance Program State Prosecutions - FY 2015
Total Disqualification Disqualifications
Consent FromAgreement Convictions Acquittals Prosecutions
STATE
Connecticut 0 14 0 14Maine 0 23 0 23Massachusetts 0 6 5 6New Hampshire 0 68 0 68New York 1,105 658 45 1,763Rhode Island 0 0 0 0Vermont 0 0 0 0
Delaware 22 17 0 39District of Columbia 8 1 0 9Maryland 1 0 0 1New Jersey 22 10 0 32Pennsylvania 454 289 2 743Virgin Islands 0 0 0 0Virginia 0 209 38 209West Virginia 2 25 0 27
Alabama 8 60 1 68Florida 0 81 0 81Georgia 0 2 0 2Kentucky 3 103 0 106Mississippi 1 85 5 86North Carolina 19 144 5 163South Carolina 0 60 0 60Tennessee 0 2 0 2
Illinois 0 0 0 0Indiana 0 0 0 0Michigan 325 217 1 542Minnesota 34 64 2 98Ohio 136 265 14 401Wisconsin 2 163 0 165
Arkansas 0 10 1 10Louisiana 23 53 0 76New Mexico 0 13 1 13Oklahoma 13 14 24 27Texas 9 19 3 28
Colorado 36 47 0 83Iowa 0 7 0 7Kansas 0 464 16 464Missouri 0 18 0 18Montana 0 0 0 0Nebraska 0 23 0 23North Dakota 3 3 0 6South Dakota 0 3 0 3Utah 0 25 0 25Wyoming 0 1 0 1
Alaska 0 12 0 12Arizona 0 26 0 26California 642 1,552 0 2,194Guam 0 0 0 0Hawaii 24 17 0 41Idaho 0 15 0 15Nevada 0 1 0 1Oregon 21 7 0 28Washington 0 16 0 16
US 2,913 4,912 163 7,825
25

TABLE 16: Supplemental Nutrition Assistance Program State Prosecutions - FY 2015
Disq. Consent Amount Average AmountAgreements and of Fraud of Fraud per
Convictions Determined DCA or Conviction
STATE
Connecticut 14 $71,263 $5,090Maine 23 $128,659 $5,594Massachusetts 6 $85,848 $14,308New Hampshire 68 $359,554 $5,288New York 1,763 $1,664,538 $944Rhode Island 0 $0 N/AVermont 0 $0 N/A
Delaware 39 $137,164 $3,517District of Columbia 9 $467,000 $51,889Maryland 1 $1,041 $1,041New Jersey 32 $117,280 $3,665Pennsylvania 743 $2,290,543 $3,083Virgin Islands 0 $0 N/AVirginia 209 $1,075,113 $5,144West Virginia 27 $127,886 $4,737
Alabama 68 $577,707 $8,496Florida 81 $485,708 $5,996Georgia 2 $27,513 $13,757Kentucky 106 $650,258 $6,135Mississippi 86 $669,446 $7,784North Carolina 163 $357,249 $2,192South Carolina 60 $180,875 $3,015Tennessee 2 $35,048 $17,524
Illinois 0 $0 N/AIndiana 0 $0 N/AMichigan 542 $2,012,620 $3,713Minnesota 98 $1,048,562 $10,700Ohio 401 $1,090,346 $2,719Wisconsin 165 $358,555 $2,173
Arkansas 10 $38,420 $3,842Louisiana 76 $628,440 $8,269New Mexico 13 $197,798 $15,215Oklahoma 27 $160,171 $5,932Texas 28 $389,551 $13,913
Colorado 83 $416,510 $5,018Iowa 7 $0 N/AKansas 464 $1,957,548 $4,219Missouri 18 $74,503 $4,139Montana 0 $0 N/ANebraska 23 $211,259 $9,185North Dakota 6 $787 $131South Dakota 3 $43,816 $14,605Utah 25 $258,280 $10,331Wyoming 1 $3,665 $3,665
Alaska 12 $83,280 $6,940Arizona 26 $265,429 $10,209California 2,194 $4,710,518 $2,147Guam 0 $0 N/AHawaii 41 $523,502 $12,768Idaho 15 $62,230 $4,149Nevada 1 $199,469 $199,469Oregon 28 $558,720 $19,954Washington 16 $70,899 $4,431
US 7,825 $24,874,571 $3,179
26
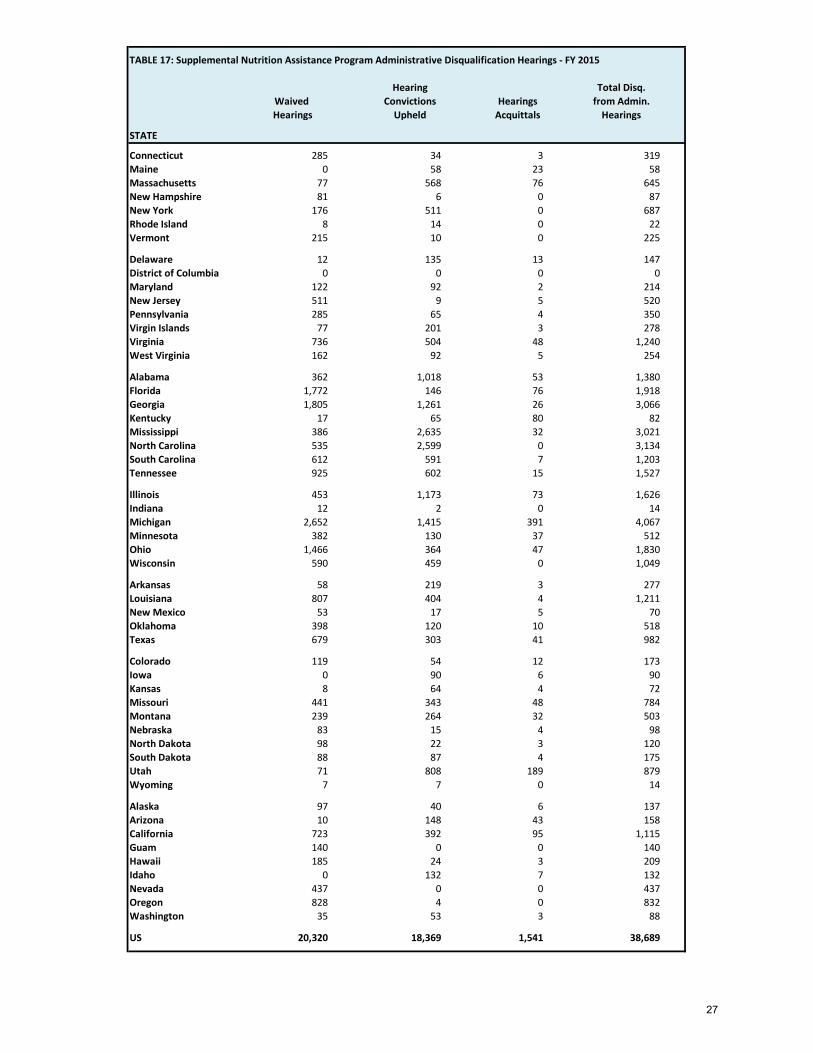
TABLE 17: Supplemental Nutrition Assistance Program Administrative Disqualification Hearings - FY 2015
Hearing Total Disq.Waived Convictions Hearings from Admin.Hearings Upheld Acquittals Hearings
STATE
Connecticut 285 34 3 319Maine 0 58 23 58Massachusetts 77 568 76 645New Hampshire 81 6 0 87New York 176 511 0 687Rhode Island 8 14 0 22Vermont 215 10 0 225
Delaware 12 135 13 147District of Columbia 0 0 0 0Maryland 122 92 2 214New Jersey 511 9 5 520Pennsylvania 285 65 4 350Virgin Islands 77 201 3 278Virginia 736 504 48 1,240West Virginia 162 92 5 254
Alabama 362 1,018 53 1,380Florida 1,772 146 76 1,918Georgia 1,805 1,261 26 3,066Kentucky 17 65 80 82Mississippi 386 2,635 32 3,021North Carolina 535 2,599 0 3,134South Carolina 612 591 7 1,203Tennessee 925 602 15 1,527
Illinois 453 1,173 73 1,626Indiana 12 2 0 14Michigan 2,652 1,415 391 4,067Minnesota 382 130 37 512Ohio 1,466 364 47 1,830Wisconsin 590 459 0 1,049
Arkansas 58 219 3 277Louisiana 807 404 4 1,211New Mexico 53 17 5 70Oklahoma 398 120 10 518Texas 679 303 41 982
Colorado 119 54 12 173Iowa 0 90 6 90Kansas 8 64 4 72Missouri 441 343 48 784Montana 239 264 32 503Nebraska 83 15 4 98North Dakota 98 22 3 120South Dakota 88 87 4 175Utah 71 808 189 879Wyoming 7 7 0 14
Alaska 97 40 6 137Arizona 10 148 43 158California 723 392 95 1,115Guam 140 0 0 140Hawaii 185 24 3 209Idaho 0 132 7 132Nevada 437 0 0 437Oregon 828 4 0 832Washington 35 53 3 88
US 20,320 18,369 1,541 38,689
27

TABLE 18: Supplemental Nutrition Assistance Program Administrative Disqualification Hearings - FY 2015
Waived Amount Average Amountand of of Fraud per Waived
Upheld Hearings Fraud Determined or Upheld Hearing
STATE
Connecticut 319 $405,488 $1,271Maine 58 $709,545 $12,234Massachusetts 645 $2,879,872 $4,465New Hampshire 87 $154,602 $1,777New York 687 $0 $0Rhode Island 22 $38,762 $1,762Vermont 225 $367,883 $1,635
Delaware 147 $470,318 $3,199District of Columbia 0 $0 $0Maryland 214 $466,047 $2,178New Jersey 520 $1,235,748 $2,376Pennsylvania 350 $729,906 $2,085Virgin Islands 278 $553,493 $1,991Virginia 1,240 $2,213,117 $1,785West Virginia 254 $547,344 $2,155
Alabama 1,380 $1,109,776 $804Florida 1,918 $3,245,354 $1,692Georgia 3,066 $3,760,177 $1,226Kentucky 82 $108,409 $1,322Mississippi 3,021 $3,660,995 $1,212North Carolina 3,134 $5,506,094 $1,757South Carolina 1,203 $1,878,658 $1,562Tennessee 1,527 $6,886,470 $4,510
Illinois 1,626 $3,425,949 $2,107Indiana 14 $45,567 $3,255Michigan 4,067 $9,482,807 $2,332Minnesota 512 $0 $0Ohio 1,830 $3,271,037 $1,787Wisconsin 1,049 $1,670,703 $1,593
Arkansas 277 $0 $0Louisiana 1,211 $1,946,073 $1,607New Mexico 70 $479,955 $6,857Oklahoma 518 $1,017,265 $1,964Texas 982 $5,201,852 $5,297
Colorado 173 $377,353 $2,181Iowa 90 $144,376 $1,604Kansas 72 $71,915 $999Missouri 784 $474,741 $606Montana 503 $499,022 $992Nebraska 98 $256,189 $2,614North Dakota 120 $14,950 $125South Dakota 175 $178,413 $1,020Utah 879 $1,119,834 $1,274Wyoming 14 $13,923 $995
Alaska 137 $273,114 $1,994Arizona 158 $234,620 $1,485California 1,115 $2,363,847 $2,120Guam 140 $204,218 $1,459Hawaii 209 $755,294 $3,614Idaho 132 $101,994 $773Nevada 437 $1,760,256 $4,028Oregon 832 $1,995,840 $2,399Washington 88 $204,864 $2,328
US 38,689 $75,256,931 $1,945
28

TABLE 19: Supplemental Nutrition Assistance Program Disqualification Determinations - FY 2015
Total Total Disqualifications Disqualifications
From from Admin. TotalProsecutions Disq. Hearings Disqualified
STATE
Connecticut 14 319 333Maine 23 58 81Massachusetts 6 645 651New Hampshire 68 87 155New York 1,763 687 2,450Rhode Island 0 22 22Vermont 0 225 225
Delaware 39 147 186District of Columbia 9 0 9Maryland 1 214 215New Jersey 32 520 552Pennsylvania 743 350 1,093Virgin Islands 0 278 278Virginia 209 1,240 1,449West Virginia 27 254 281
Alabama 68 1,380 1,448Florida 81 1,918 1,999Georgia 2 3,066 3,068Kentucky 106 82 188Mississippi 86 3,021 3,107North Carolina 163 3,134 3,297South Carolina 60 1,203 1,263Tennessee 2 1,527 1,529
Illinois 0 1,626 1,626Indiana 0 14 14Michigan 542 4,067 4,609Minnesota 98 512 610Ohio 401 1,830 2,231Wisconsin 165 1,049 1,214
Arkansas 10 277 287Louisiana 76 1,211 1,287New Mexico 13 70 83Oklahoma 27 518 545Texas 28 982 1,010
Colorado 83 173 256Iowa 7 90 97Kansas 464 72 536Missouri 18 784 802Montana 0 503 503Nebraska 23 98 121North Dakota 6 120 126South Dakota 3 175 178Utah 25 879 904Wyoming 1 14 15
Alaska 12 137 149Arizona 26 158 184California 2,194 1,115 3,309Guam 0 140 140Hawaii 41 209 250Idaho 15 132 147Nevada 1 437 438Oregon 28 832 860Washington 16 88 104
US 7,825 38,689 46,514
29

V.
Recipient
Claims
30

NOTABLE TRENDS
RECIPIENT CLAIM COLLECTIONS
Recipient claims are established against households that receive more SNAP benefits than it is entitled to receive or households that have trafficked benefits (exchanged for cash). Claims fall into three categories: intentional program violation (fraud and trafficking), inadvertent household error, or agency error. State agencies are entitled to retain 35 percent of the amount they collect on fraud claims and certain inadvertent household error claims; and retain 20 percent of the amount they collect on the remaining inadvertent household error claims.
In FY 2015, State agencies established nearly $647.1 million in new claims against households and collected nearly $367 million. The average claim established was $732. Collections increased 7.8 percent from FY 2014. Collections via recoupment, whereby the State agency reduces a portion of the households benefit allotment to pay an outstanding claim, decreased 1.4 percent to $143.6 million.
During FY 2015, the Federal Government through the Treasury Offset Program (TOP) collected $156.4 million, or 42.7 percent, of the total claims collected. As participating partners in this program, State agencies notify the household and then send the delinquent claims through FNS to the US Department of Treasury for possible collection.
This Federal program offsets amounts from any eligible Federal payment otherwise due a household and uses those funds to pay outstanding claims. The collections are made by Treasury on behalf of SNAP. In FY 2015, all State agencies participated in TOP.
31

TABLE 20: Supplemental Nutrition Assistance Program Recipient Claims - New Claims Established - FY 2015
Fraud Claims Household Error Agency Error Total ClaimsEstablished Established Established Established
STATE
Connecticut $197,091 $790,573 $1,292,826 $2,280,491Maine $1,114,807 $729,014 $1,304,257 $3,148,079Massachusetts $2,721,578 $6,277,858 $210,713 $9,210,150New Hampshire $561,060 $212,738 $59,593 $833,392New York $3,883,939 $7,144,368 $4,601,442 $15,629,749Rhode Island $55,232 $271,634 $186,616 $513,482Vermont $393,615 $225,582 $106,135 $725,332
Delaware $728,254 $2,522,448 $215,093 $3,465,795District of Columbia $3,150 $1,173,379 $74,794 $1,251,323Maryland $185,216 $2,587,214 $799,598 $3,572,028New Jersey $375,242 $8,344,863 $875,175 $9,595,280Pennsylvania $0 $13,136,335 $1,117,592 $14,253,927Virgin Islands $0 $178,447 $65,973 $244,420Virginia $1,173,047 $4,598,362 $1,100,379 $6,871,787West Virginia $706,605 $1,622,460 $321,845 $2,650,910
Alabama $190,247 $7,378,188 $1,807,107 $9,375,542Florida $0 $29,058,163 $4,098,871 $33,157,034Georgia $9,876,124 $1,813,280 $2,141,727 $13,831,131Kentucky $695,317 $6,566,659 $2,162,464 $9,424,440Mississippi $1,571,328 $4,653,669 $514,126 $6,739,123North Carolina $0 $14,544,202 $5,676,900 $20,221,103South Carolina $93,105 $12,702,911 $1,563,018 $14,359,034Tennessee $1,191,795 $13,641,932 $822,669 $15,656,396
Illinois $0 $40,074,617 $2,633,401 $42,708,018Indiana $722,269 $8,115,761 $2,931,081 $11,769,110Michigan $11,713,569 $6,702,915 $2,069,609 $20,486,093Minnesota $447,014 $7,094,185 $1,578,905 $9,120,104Ohio $4,427,532 $12,446,879 $4,017,980 $20,892,391Wisconsin $741,056 $9,625,604 $711,344 $11,078,003
Arkansas $716,855 $1,270,024 $204,160 $2,191,039Louisiana $1,901,272 $1,431,578 $274,507 $3,607,357New Mexico $49,543 $1,212,753 $2,111,471 $3,373,767Oklahoma $735,759 $1,041,843 $235,239 $2,012,841Texas $3,544,928 $26,521,431 $7,410,226 $37,476,585
Colorado $777,237 $4,463,586 $6,869,948 $12,110,771Iowa $167,413 $1,474,442 $60,889 $1,702,744Kansas $103,822 $3,427,718 $346,383 $3,877,923Missouri $109,563 $1,960,976 $517,394 $2,587,933Montana $426,840 $729,560 $486,948 $1,643,348Nebraska $0 $768,279 $807,149 $1,575,428North Dakota $15,903 $250,493 $154,759 $421,155South Dakota $131,550 $903,602 $117,712 $1,152,864Utah $97,744 $1,737,183 $661,798 $2,496,724Wyoming $0 $186,667 $52,507 $239,174
Alaska $313,747 $187,191 $512,269 $1,013,207Arizona $140,002 $2,237,087 $1,115,261 $3,492,350California $1,706,787 $107,985,769 $121,019,982 $230,712,538Guam $0 $221,635 $68,131 $289,766Hawaii $897,098 $1,768,397 $492,384 $3,157,878Idaho $509,827 $627,511 $386,979 $1,524,318Nevada $313,150 $1,913,111 $56,769 $2,283,031Oregon $1,861,527 $6,462,513 $218,182 $8,542,222Washington $110,755 $4,174,004 $2,070,857 $6,355,616
US $58,590,588 $397,191,591 $191,313,137 $647,095,316
32

TABLE 21: Supplemental Nutrition Assistance Program Recipient Claims - New Claims Established - FY 2015
Number of Number of Number of Number ofFraud Claims Household Error Agency Error Total Claims
Established Established Established Established
STATE
Connecticut 182 804 3,828 4,814Maine 307 530 1,616 2,453Massachusetts 1,080 7,641 224 8,945New Hampshire 125 172 62 359New York 1,723 6,177 4,546 12,446Rhode Island 33 234 207 474Vermont 268 288 86 642
Delaware 326 1,744 126 2,196District of Columbia 1 601 71 673Maryland 79 2,487 1,342 3,908New Jersey 200 7,275 1,039 8,514Pennsylvania 0 9,499 1,321 10,820Virgin Islands 0 113 77 190Virginia 849 3,333 1,854 6,036West Virginia 441 1,221 587 2,249
Alabama 92 4,298 1,966 6,356Florida 0 14,830 4,697 19,527Georgia 3,128 1,071 4,618 8,817Kentucky 495 4,462 3,005 7,962Mississippi 1,274 3,253 661 5,188North Carolina 0 8,697 6,697 15,394South Carolina 92 6,022 1,601 7,715Tennessee 234 6,676 765 7,675
Illinois 0 32,222 3,400 35,622Indiana 220 6,087 3,054 9,361Michigan 4,984 3,999 1,272 10,255Minnesota 258 7,585 2,851 10,694Ohio 1,929 7,770 5,867 15,566Wisconsin 655 7,824 1,220 9,699
Arkansas 381 547 305 1,233Louisiana 707 559 278 1,544New Mexico 14 1,754 2,061 3,829Oklahoma 258 716 292 1,266Texas 556 12,987 4,147 17,690
Colorado 207 3,466 23,398 27,071Iowa 57 699 157 913Kansas 56 1,807 1,335 3,198Missouri 93 1,100 459 1,652Montana 137 693 1,161 1,991Nebraska 0 650 1,714 2,364North Dakota 16 340 701 1,057South Dakota 64 760 308 1,132Utah 76 985 621 1,682Wyoming 0 149 104 253
Alaska 125 249 952 1,326Arizona 35 1,784 1,439 3,258California 674 183,440 374,064 558,178Guam 0 160 61 221Hawaii 155 1,267 719 2,141Idaho 400 771 883 2,054Nevada 66 1,178 81 1,325Oregon 371 3,057 165 3,593Washington 20 5,226 5,644 10,890
US 23,548 381,259 479,709 884,516
33

TABLE 22: Supplemental Nutrition Assistance Program Recipient Claims Collected - By Type - FY 2015
Fraud Household Agency TotalClaims Error Error Claims
Collected Collected Collected Collected
STATE
Connecticut $217,636 $270,294 $593,869 $1,081,799Maine $230,433 $624,548 $508,102 $1,363,083Massachusetts $1,032,602 $3,190,620 $109,403 $4,332,625New Hampshire $412,527 $275,141 $47,843 $735,511New York $3,119,727 $4,054,858 $3,080,051 $10,254,636Rhode Island $50,056 $91,061 $121,019 $262,136Vermont $364,253 $339,479 $62,324 $766,056
Delaware $176,596 $1,958,141 $131,917 $2,266,654District of Columbia $40,046 $617,565 $63,757 $721,368Maryland $152,020 $1,437,835 $545,468 $2,135,323New Jersey $1,368,385 $6,218,159 $546,620 $8,133,164Pennsylvania $2,349,422 $7,533,002 $1,149,465 $11,031,889Virgin Islands $136,595 $114,772 $55,442 $306,809Virginia $2,258,477 $2,265,911 $829,799 $5,354,187West Virginia $855,729 $1,057,625 $402,221 $2,315,575
Alabama $959,080 $2,584,567 $1,496,623 $5,040,270Florida $2,990,208 $11,520,314 $4,137,982 $18,648,505Georgia $8,251,181 $758,193 $1,534,020 $10,543,394Kentucky $1,949,915 $3,801,895 $1,306,264 $7,058,074Mississippi $2,950,685 $894,719 $482,283 $4,327,688North Carolina $3,660,068 $4,369,833 $2,901,013 $10,930,914South Carolina $2,303,406 $4,436,210 $1,327,689 $8,067,306Tennessee $5,772,891 $4,738,180 $537,523 $11,048,594
Illinois $2,759,459 $20,744,170 $1,839,906 $25,343,535Indiana $424,406 $1,849,240 $862,156 $3,135,801Michigan $7,576,673 $1,915,997 $1,546,421 $11,039,091Minnesota $884,700 $4,405,556 $1,085,351 $6,375,606Ohio $3,929,068 $6,710,292 $2,622,176 $13,261,537Wisconsin $975,469 $4,979,218 $630,288 $6,584,975
Arkansas $922,296 $258,092 $132,820 $1,313,207Louisiana $1,543,488 $808,054 $227,620 $2,579,162New Mexico $172,704 $868,561 $794,776 $1,836,041Oklahoma $741,242 $463,825 $224,740 $1,429,807Texas $8,210,222 $22,277,612 $7,734,629 $38,222,463
Colorado $1,551,233 $2,126,432 $5,190,003 $8,867,667Iowa $140,294 $1,029,001 $77,031 $1,246,325Kansas $905,644 $713,324 $351,237 $1,970,205Missouri $1,205,066 $1,107,280 $413,340 $2,725,686Montana $335,268 $270,598 $325,875 $931,741Nebraska $170,859 $450,871 $651,134 $1,272,864North Dakota $46,486 $225,575 $104,031 $376,092South Dakota $254,732 $349,153 $105,268 $709,153Utah $930,362 $485,734 $600,223 $2,016,319Wyoming $46,216 $91,020 $36,662 $173,899
Alaska $219,740 $123,072 $323,941 $666,754Arizona $235,326 $1,221,217 $909,114 $2,365,657California $5,762,999 $50,993,779 $35,197,963 $91,954,742Guam $113,996 $12,274 $53,197 $179,467Hawaii $675,548 $749,167 $265,055 $1,689,770Idaho $480,625 $268,302 $248,524 $997,451Nevada $497,067 $548,475 $59,325 $1,104,867Oregon $2,352,972 $2,819,466 $329,297 $5,501,735Washington $318,708 $2,348,701 $1,234,751 $3,902,159
US $85,984,807 $194,366,983 $86,147,548 $366,499,338
34
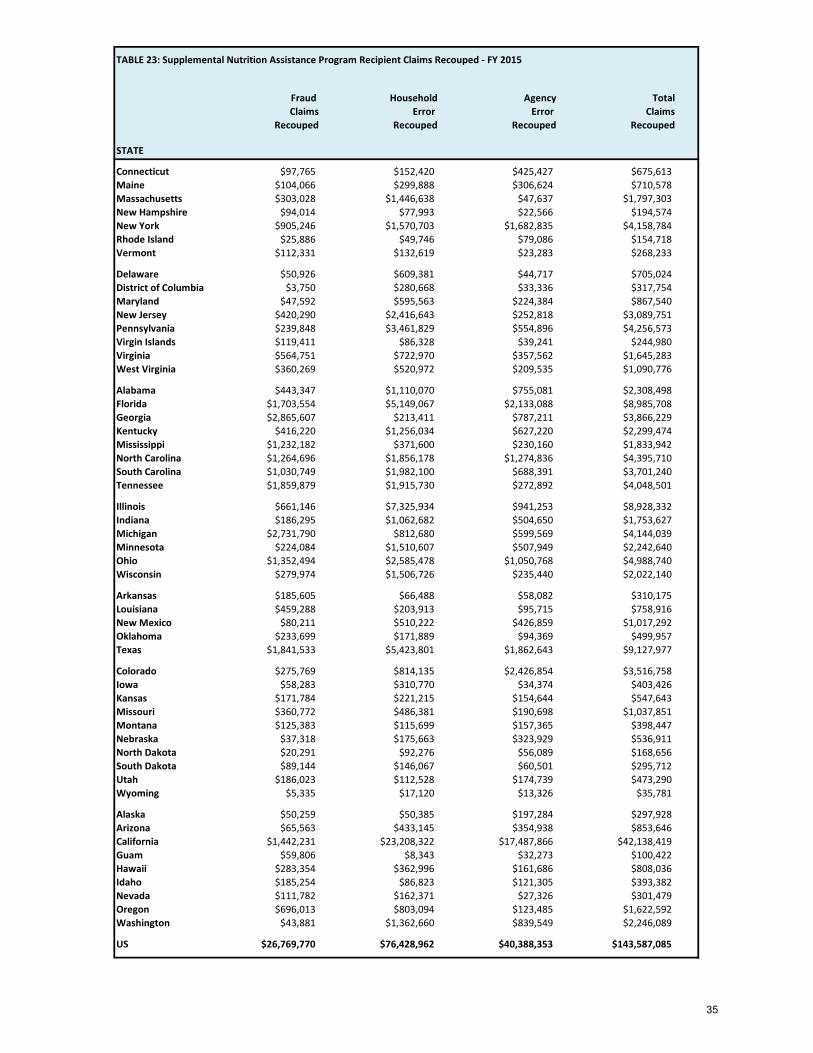
TABLE 23: Supplemental Nutrition Assistance Program Recipient Claims Recouped - FY 2015
Fraud Household Agency TotalClaims Error Error Claims
Recouped Recouped Recouped Recouped
STATE
Connecticut $97,765 $152,420 $425,427 $675,613Maine $104,066 $299,888 $306,624 $710,578Massachusetts $303,028 $1,446,638 $47,637 $1,797,303New Hampshire $94,014 $77,993 $22,566 $194,574New York $905,246 $1,570,703 $1,682,835 $4,158,784Rhode Island $25,886 $49,746 $79,086 $154,718Vermont $112,331 $132,619 $23,283 $268,233
Delaware $50,926 $609,381 $44,717 $705,024District of Columbia $3,750 $280,668 $33,336 $317,754Maryland $47,592 $595,563 $224,384 $867,540New Jersey $420,290 $2,416,643 $252,818 $3,089,751Pennsylvania $239,848 $3,461,829 $554,896 $4,256,573Virgin Islands $119,411 $86,328 $39,241 $244,980Virginia $564,751 $722,970 $357,562 $1,645,283West Virginia $360,269 $520,972 $209,535 $1,090,776
Alabama $443,347 $1,110,070 $755,081 $2,308,498Florida $1,703,554 $5,149,067 $2,133,088 $8,985,708Georgia $2,865,607 $213,411 $787,211 $3,866,229Kentucky $416,220 $1,256,034 $627,220 $2,299,474Mississippi $1,232,182 $371,600 $230,160 $1,833,942North Carolina $1,264,696 $1,856,178 $1,274,836 $4,395,710South Carolina $1,030,749 $1,982,100 $688,391 $3,701,240Tennessee $1,859,879 $1,915,730 $272,892 $4,048,501
Illinois $661,146 $7,325,934 $941,253 $8,928,332Indiana $186,295 $1,062,682 $504,650 $1,753,627Michigan $2,731,790 $812,680 $599,569 $4,144,039Minnesota $224,084 $1,510,607 $507,949 $2,242,640Ohio $1,352,494 $2,585,478 $1,050,768 $4,988,740Wisconsin $279,974 $1,506,726 $235,440 $2,022,140
Arkansas $185,605 $66,488 $58,082 $310,175Louisiana $459,288 $203,913 $95,715 $758,916New Mexico $80,211 $510,222 $426,859 $1,017,292Oklahoma $233,699 $171,889 $94,369 $499,957Texas $1,841,533 $5,423,801 $1,862,643 $9,127,977
Colorado $275,769 $814,135 $2,426,854 $3,516,758Iowa $58,283 $310,770 $34,374 $403,426Kansas $171,784 $221,215 $154,644 $547,643Missouri $360,772 $486,381 $190,698 $1,037,851Montana $125,383 $115,699 $157,365 $398,447Nebraska $37,318 $175,663 $323,929 $536,911North Dakota $20,291 $92,276 $56,089 $168,656South Dakota $89,144 $146,067 $60,501 $295,712Utah $186,023 $112,528 $174,739 $473,290Wyoming $5,335 $17,120 $13,326 $35,781
Alaska $50,259 $50,385 $197,284 $297,928Arizona $65,563 $433,145 $354,938 $853,646California $1,442,231 $23,208,322 $17,487,866 $42,138,419Guam $59,806 $8,343 $32,273 $100,422Hawaii $283,354 $362,996 $161,686 $808,036Idaho $185,254 $86,823 $121,305 $393,382Nevada $111,782 $162,371 $27,326 $301,479Oregon $696,013 $803,094 $123,485 $1,622,592Washington $43,881 $1,362,660 $839,549 $2,246,089
US $26,769,770 $76,428,962 $40,388,353 $143,587,085
35

TABLE 24: Supplemental Nutrition Assistance Program Recipient Claims Collected - By Method - FY 2015
Total Other State Federal TotalClaims Means of Debt Claims
STATE Recouped Collection Collection Collected
Connecticut $675,613 $175,258 $230,928 $1,081,799Maine $710,578 $255,273 $397,231 $1,363,083Massachusetts $1,797,303 $602,375 $1,932,947 $4,332,625New Hampshire $194,574 $296,845 $244,093 $735,511New York $4,158,784 $2,193,393 $3,902,459 $10,254,636Rhode Island $154,718 $48,539 $58,879 $262,136Vermont $268,233 $94,181 $403,641 $766,056
Delaware $705,024 $403,104 $1,158,526 $2,266,654District of Columbia $317,754 $28,903 $374,711 $721,368Maryland $867,540 $427,372 $840,412 $2,135,323New Jersey $3,089,751 $1,141,659 $3,901,754 $8,133,164Pennsylvania $4,256,573 $2,063,707 $4,711,609 $11,031,889Virgin Islands $244,980 $14,829 $47,000 $306,809Virginia $1,645,283 $1,417,172 $2,291,732 $5,354,187West Virginia $1,090,776 $306,161 $918,638 $2,315,575
Alabama $2,308,498 $631,311 $2,100,461 $5,040,270Florida $8,985,708 $3,390,822 $6,271,975 $18,648,505Georgia $3,866,229 $990,318 $5,686,847 $10,543,394Kentucky $2,299,474 $1,497,367 $3,261,233 $7,058,074Mississippi $1,833,942 $375,562 $2,118,184 $4,327,688North Carolina $4,395,710 $585,159 $5,950,046 $10,930,914South Carolina $3,701,240 $768,601 $3,597,465 $8,067,306Tennessee $4,048,501 $1,580,449 $5,419,645 $11,048,594
Illinois $8,928,332 $3,812,554 $12,602,649 $25,343,535Indiana $1,753,627 $522,318 $859,856 $3,135,801Michigan $4,144,039 $1,821,257 $5,073,794 $11,039,091Minnesota $2,242,640 $1,483,000 $2,649,966 $6,375,606Ohio $4,988,740 $823,101 $7,449,696 $13,261,537Wisconsin $2,022,140 $1,636,300 $2,926,535 $6,584,975
Arkansas $310,175 $235,382 $767,650 $1,313,207Louisiana $758,916 $763,553 $1,056,693 $2,579,162New Mexico $1,017,292 $818,749 $0 $1,836,041Oklahoma $499,957 $139,885 $789,965 $1,429,807Texas $9,127,977 $4,816,891 $24,277,595 $38,222,463
Colorado $3,516,758 $2,459,264 $2,891,646 $8,867,667Iowa $403,426 $206,134 $636,765 $1,246,325Kansas $547,643 $420,984 $1,001,578 $1,970,205Missouri $1,037,851 $261,681 $1,426,154 $2,725,686Montana $398,447 $224,096 $309,198 $931,741Nebraska $536,911 $265,256 $470,697 $1,272,864North Dakota $168,656 $59,664 $147,772 $376,092South Dakota $295,712 $177,889 $235,553 $709,153Utah $473,290 $455,473 $1,087,556 $2,016,319Wyoming $35,781 $53,284 $84,834 $173,899
Alaska $297,928 $231,086 $137,740 $666,754Arizona $853,646 $708,138 $803,874 $2,365,657California $42,138,419 $20,793,967 $29,022,356 $91,954,742Guam $100,422 $78,217 $828 $179,467Hawaii $808,036 $410,213 $471,521 $1,689,770Idaho $393,382 $306,302 $297,767 $997,451Nevada $301,479 $363,680 $439,708 $1,104,867Oregon $1,622,592 $2,080,694 $1,798,450 $5,501,735Washington $2,246,089 $762,861 $893,209 $3,902,159
US $143,587,085 $66,480,232 $156,432,020 $366,499,338
36

VI.
Participation and Issuance Rankings
37

TABLE 25: Supplemental Nutrition Assistance Program Participation and Issuance - Ranked by Persons - FY 2015
Persons HouseholdsParticipating Participating
Rank STATE (Monthly) (Monthly) Issuance
1 California 4,417,772 2,096,960 $7,528,039,7782 Texas 3,724,688 1,558,597 $5,265,414,1243 Florida 3,656,169 2,009,594 $5,688,711,6914 New York 3,039,108 1,665,683 $5,046,486,6395 Illinois 2,042,306 1,060,589 $3,303,102,8316 Pennsylvania 1,826,667 918,761 $2,699,655,0597 Georgia 1,800,531 839,207 $2,803,606,8808 Ohio 1,676,263 818,704 $2,528,834,7779 North Carolina 1,646,202 803,495 $2,395,550,386
10 Michigan 1,571,344 824,971 $2,369,233,69511 Tennessee 1,229,391 611,805 $1,884,708,81612 Washington 1,070,933 572,261 $1,527,741,09913 Arizona 999,401 439,330 $1,459,584,64214 New Jersey 905,728 453,338 $1,291,435,88515 Alabama 889,380 417,943 $1,341,906,57716 Virginia 860,375 404,348 $1,230,788,07317 Louisiana 859,738 389,519 $1,298,445,65618 Missouri 844,597 398,662 $1,258,535,55719 Indiana 831,740 379,929 $1,244,188,23120 Wisconsin 805,540 406,754 $1,051,153,94121 South Carolina 804,572 379,992 $1,208,604,78222 Massachusetts 785,778 449,468 $1,202,312,62123 Maryland 781,035 404,708 $1,149,657,58924 Oregon 779,749 442,090 $1,152,976,71525 Kentucky 768,882 368,596 $1,112,381,12226 Mississippi 636,322 296,094 $916,551,54327 Oklahoma 598,257 271,065 $864,950,56528 Minnesota 496,023 240,410 $627,557,91629 Colorado 495,134 233,113 $771,959,82330 Arkansas 468,904 214,056 $648,769,56231 New Mexico 453,146 205,540 $685,206,62932 Connecticut 442,161 248,204 $715,334,94733 Nevada 420,413 209,787 $605,592,52734 Iowa 391,224 184,850 $516,608,02535 West Virginia 367,908 181,961 $497,268,95336 Kansas 273,974 121,991 $374,432,74137 Utah 225,603 88,160 $313,810,55738 Maine 202,579 105,075 $282,015,65039 Idaho 196,872 83,869 $273,758,13240 Hawaii 188,895 95,545 $505,466,32941 Rhode Island 175,025 100,949 $282,777,16342 Nebraska 174,092 77,755 $242,092,50343 Delaware 149,981 71,821 $228,935,46444 District of Columbia 141,845 80,007 $224,104,44745 Montana 119,082 56,112 $171,413,82346 New Hampshire 106,296 51,478 $132,497,77747 South Dakota 98,553 43,176 $148,866,94848 Vermont 84,994 44,950 $124,409,40749 Alaska 81,121 34,187 $168,054,41150 North Dakota 53,148 24,771 $77,912,53851 Guam 47,166 15,556 $109,108,59252 Wyoming 32,606 13,868 $46,448,47053 Virgin Islands 27,461 12,610 $56,465,978
US 45,766,672 22,522,261 $69,655,428,586
38

TABLE 26: Supplemental Nutrition Assistance Program Participation and Issuance - Ranked by Households - FY 2015
Persons HouseholdsParticipating Participating
Rank STATE (Monthly) (Monthly) Issuance
1 California 4,417,772 2,096,960 $7,528,039,7782 Florida 3,656,169 2,009,594 $5,688,711,6913 New York 3,039,108 1,665,683 $5,046,486,6394 Texas 3,724,688 1,558,597 $5,265,414,1245 Illinois 2,042,306 1,060,589 $3,303,102,8316 Pennsylvania 1,826,667 918,761 $2,699,655,0597 Georgia 1,800,531 839,207 $2,803,606,8808 Michigan 1,571,344 824,971 $2,369,233,6959 Ohio 1,676,263 818,704 $2,528,834,777
10 North Carolina 1,646,202 803,495 $2,395,550,38611 Tennessee 1,229,391 611,805 $1,884,708,81612 Washington 1,070,933 572,261 $1,527,741,09913 New Jersey 905,728 453,338 $1,291,435,88514 Massachusetts 785,778 449,468 $1,202,312,62115 Oregon 779,749 442,090 $1,152,976,71516 Arizona 999,401 439,330 $1,459,584,64217 Alabama 889,380 417,943 $1,341,906,57718 Wisconsin 805,540 406,754 $1,051,153,94119 Maryland 781,035 404,708 $1,149,657,58920 Virginia 860,375 404,348 $1,230,788,07321 Missouri 844,597 398,662 $1,258,535,55722 Louisiana 859,738 389,519 $1,298,445,65623 South Carolina 804,572 379,992 $1,208,604,78224 Indiana 831,740 379,929 $1,244,188,23125 Kentucky 768,882 368,596 $1,112,381,12226 Mississippi 636,322 296,094 $916,551,54327 Oklahoma 598,257 271,065 $864,950,56528 Connecticut 442,161 248,204 $715,334,94729 Minnesota 496,023 240,410 $627,557,91630 Colorado 495,134 233,113 $771,959,82331 Arkansas 468,904 214,056 $648,769,56232 Nevada 420,413 209,787 $605,592,52733 New Mexico 453,146 205,540 $685,206,62934 Iowa 391,224 184,850 $516,608,02535 West Virginia 367,908 181,961 $497,268,95336 Kansas 273,974 121,991 $374,432,74137 Maine 202,579 105,075 $282,015,65038 Rhode Island 175,025 100,949 $282,777,16339 Hawaii 188,895 95,545 $505,466,32940 Utah 225,603 88,160 $313,810,55741 Idaho 196,872 83,869 $273,758,13242 District of Columbia 141,845 80,007 $224,104,44743 Nebraska 174,092 77,755 $242,092,50344 Delaware 149,981 71,821 $228,935,46445 Montana 119,082 56,112 $171,413,82346 New Hampshire 106,296 51,478 $132,497,77747 Vermont 84,994 44,950 $124,409,40748 South Dakota 98,553 43,176 $148,866,94849 Alaska 81,121 34,187 $168,054,41150 North Dakota 53,148 24,771 $77,912,53851 Guam 47,166 15,556 $109,108,59252 Wyoming 32,606 13,868 $46,448,47053 Virgin Islands 27,461 12,610 $56,465,978
US 45,766,672 22,522,261 $69,655,428,586
39
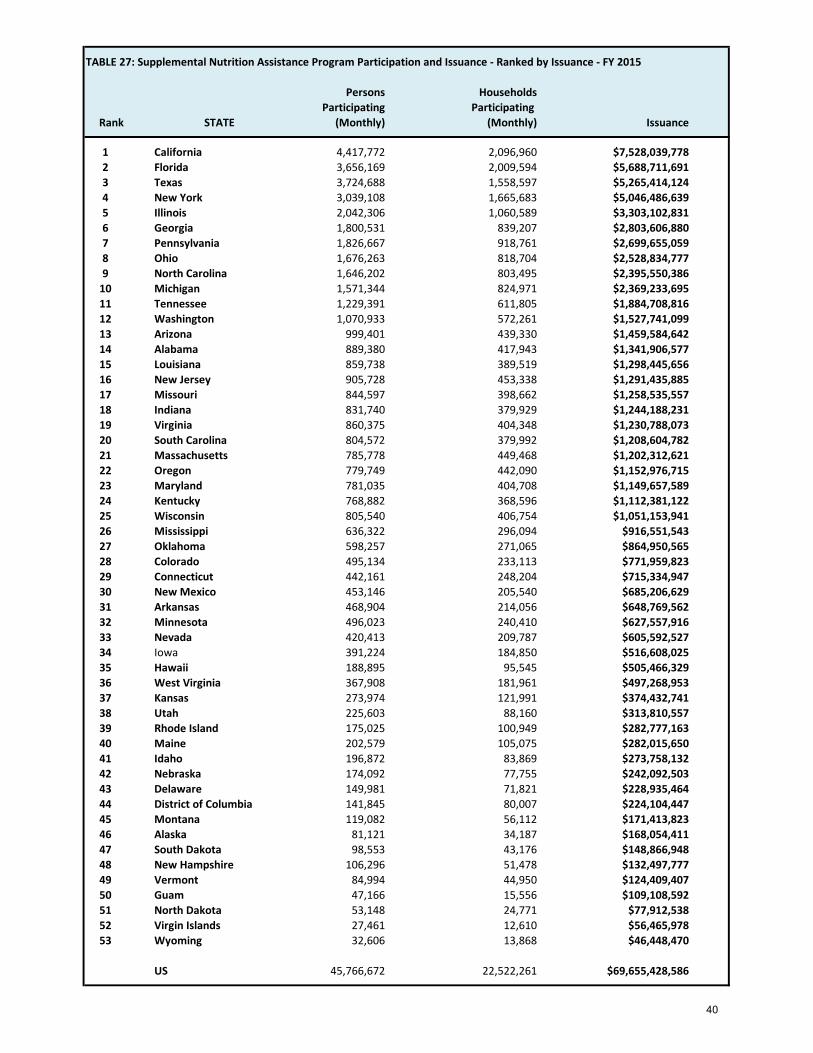
TABLE 27: Supplemental Nutrition Assistance Program Participation and Issuance - Ranked by Issuance - FY 2015
Persons HouseholdsParticipating Participating
Rank STATE (Monthly) (Monthly) Issuance
1 California 4,417,772 2,096,960 $7,528,039,7782 Florida 3,656,169 2,009,594 $5,688,711,6913 Texas 3,724,688 1,558,597 $5,265,414,1244 New York 3,039,108 1,665,683 $5,046,486,6395 Illinois 2,042,306 1,060,589 $3,303,102,8316 Georgia 1,800,531 839,207 $2,803,606,8807 Pennsylvania 1,826,667 918,761 $2,699,655,0598 Ohio 1,676,263 818,704 $2,528,834,7779 North Carolina 1,646,202 803,495 $2,395,550,386
10 Michigan 1,571,344 824,971 $2,369,233,69511 Tennessee 1,229,391 611,805 $1,884,708,81612 Washington 1,070,933 572,261 $1,527,741,09913 Arizona 999,401 439,330 $1,459,584,64214 Alabama 889,380 417,943 $1,341,906,57715 Louisiana 859,738 389,519 $1,298,445,65616 New Jersey 905,728 453,338 $1,291,435,88517 Missouri 844,597 398,662 $1,258,535,55718 Indiana 831,740 379,929 $1,244,188,23119 Virginia 860,375 404,348 $1,230,788,07320 South Carolina 804,572 379,992 $1,208,604,78221 Massachusetts 785,778 449,468 $1,202,312,62122 Oregon 779,749 442,090 $1,152,976,71523 Maryland 781,035 404,708 $1,149,657,58924 Kentucky 768,882 368,596 $1,112,381,12225 Wisconsin 805,540 406,754 $1,051,153,94126 Mississippi 636,322 296,094 $916,551,54327 Oklahoma 598,257 271,065 $864,950,56528 Colorado 495,134 233,113 $771,959,82329 Connecticut 442,161 248,204 $715,334,94730 New Mexico 453,146 205,540 $685,206,62931 Arkansas 468,904 214,056 $648,769,56232 Minnesota 496,023 240,410 $627,557,91633 Nevada 420,413 209,787 $605,592,52734 Iowa 391,224 184,850 $516,608,02535 Hawaii 188,895 95,545 $505,466,32936 West Virginia 367,908 181,961 $497,268,95337 Kansas 273,974 121,991 $374,432,74138 Utah 225,603 88,160 $313,810,55739 Rhode Island 175,025 100,949 $282,777,16340 Maine 202,579 105,075 $282,015,65041 Idaho 196,872 83,869 $273,758,13242 Nebraska 174,092 77,755 $242,092,50343 Delaware 149,981 71,821 $228,935,46444 District of Columbia 141,845 80,007 $224,104,44745 Montana 119,082 56,112 $171,413,82346 Alaska 81,121 34,187 $168,054,41147 South Dakota 98,553 43,176 $148,866,94848 New Hampshire 106,296 51,478 $132,497,77749 Vermont 84,994 44,950 $124,409,40750 Guam 47,166 15,556 $109,108,59251 North Dakota 53,148 24,771 $77,912,53852 Virgin Islands 27,461 12,610 $56,465,97853 Wyoming 32,606 13,868 $46,448,470
US 45,766,672 22,522,261 $69,655,428,586
40

TABLE 28: Supplemental Nutrition Assistance Program Avg. Monthly Benefit - Ranked per Person - FY 2015
Average Monthly Average MonthlyBenefit Benefit
STATE Per Person Per Household
1 Hawaii $222.99 $440.862 Guam $192.78 $584.503 Alaska $172.64 $409.644 Virgin Islands $171.35 $373.175 California $142.00 $299.166 New York $138.38 $252.477 Connecticut $134.82 $240.178 Illinois $134.78 $259.539 Rhode Island $134.64 $233.43
10 District of Columbia $131.66 $233.4211 Colorado $129.92 $275.9612 Georgia $129.76 $278.4013 Florida $129.66 $235.9014 Tennessee $127.75 $256.7115 Massachusetts $127.51 $222.9116 Delaware $127.20 $265.6317 New Mexico $126.01 $277.8118 South Dakota $125.88 $287.3219 Louisiana $125.86 $277.7920 Alabama $125.73 $267.5621 Ohio $125.72 $257.4022 Michigan $125.65 $239.3223 South Carolina $125.18 $265.0524 Indiana $124.66 $272.9025 Missouri $124.18 $263.0726 Oregon $123.22 $217.3327 Pennsylvania $123.16 $244.8628 Maryland $122.66 $236.7329 North Dakota $122.16 $262.1130 Vermont $121.98 $230.6431 Arizona $121.71 $276.8632 North Carolina $121.27 $248.4533 Kentucky $120.56 $251.4934 Oklahoma $120.48 $265.9135 Nevada $120.04 $240.5636 Mississippi $120.03 $257.9637 Montana $119.96 $254.5738 Virginia $119.21 $253.6639 Washington $118.88 $222.4740 New Jersey $118.82 $237.3941 Wyoming $118.71 $279.1242 Texas $117.80 $281.5343 Maine $116.01 $223.6644 Utah $115.92 $296.6345 Nebraska $115.88 $259.4646 Idaho $115.88 $272.0147 Arkansas $115.30 $252.5748 Kansas $113.89 $255.7849 West Virginia $112.63 $227.7450 Iowa $110.04 $232.9051 Wisconsin $108.74 $215.3552 Minnesota $105.43 $217.5353 New Hampshire $103.87 $214.49
US $126.83 $257.73
41

TABLE 29: Supplemental Nutrition Assistance Program Avg. Monthly Benefit - Ranked per Household - FY 2015
Average Monthly Average MonthlyBenefit Benefit
STATE Per Person Per Household
1 Guam $192.78 $584.502 Hawaii $222.99 $440.863 Alaska $172.64 $409.644 Virgin Islands $171.35 $373.175 California $142.00 $299.166 Utah $115.92 $296.637 South Dakota $125.88 $287.328 Texas $117.80 $281.539 Wyoming $118.71 $279.12
10 Georgia $129.76 $278.4011 New Mexico $126.01 $277.8112 Louisiana $125.86 $277.7913 Arizona $121.71 $276.8614 Colorado $129.92 $275.9615 Indiana $124.66 $272.9016 Idaho $115.88 $272.0117 Alabama $125.73 $267.5618 Oklahoma $120.48 $265.9119 Delaware $127.20 $265.6320 South Carolina $125.18 $265.0521 Missouri $124.18 $263.0722 North Dakota $122.16 $262.1123 Illinois $134.78 $259.5324 Nebraska $115.88 $259.4625 Mississippi $120.03 $257.9626 Ohio $125.72 $257.4027 Tennessee $127.75 $256.7128 Kansas $113.89 $255.7829 Montana $119.96 $254.5730 Virginia $119.21 $253.6631 Arkansas $115.30 $252.5732 New York $138.38 $252.4733 Kentucky $120.56 $251.4934 North Carolina $121.27 $248.4535 Pennsylvania $123.16 $244.8636 Nevada $120.04 $240.5637 Connecticut $134.82 $240.1738 Michigan $125.65 $239.3239 New Jersey $118.82 $237.3940 Maryland $122.66 $236.7341 Florida $129.66 $235.9042 Rhode Island $134.64 $233.4343 District of Columbia $131.66 $233.4244 Iowa $110.04 $232.9045 Vermont $121.98 $230.6446 West Virginia $112.63 $227.7447 Maine $116.01 $223.6648 Massachusetts $127.51 $222.9149 Washington $118.88 $222.4750 Minnesota $105.43 $217.5351 Oregon $123.22 $217.3352 Wisconsin $108.74 $215.3553 New Hampshire $103.87 $214.49
US $126.83 $257.73
42

VII.
Multi-Year
Comparisons
43

TABLE 30: Supplemental Nutrition Assistance Program Participation - Persons - FY 2013 - FY 2015
Persons Persons Persons PercentParticipating Participating Participating Change
(Monthly) (Monthly) (Monthly) FY 2014-FY 2013 FY 2014 FY 2015 FY 2015
STATE
Connecticut 425,320 438,559 442,161 0.8%Maine 249,119 230,536 202,579 -12.1%Massachusetts 887,619 863,412 785,778 -9.0%New Hampshire 117,315 111,701 106,296 -4.8%New York 3,170,465 3,122,879 3,039,108 -2.7%Rhode Island 179,925 178,518 175,025 -2.0%Vermont 100,541 93,000 84,994 -8.6%
Delaware 153,137 150,232 149,981 -0.2%District of Columbia 144,889 142,707 141,845 -0.6%Maryland 771,021 787,597 781,035 -0.8%New Jersey 876,266 883,434 905,728 2.5%Pennsylvania 1,784,790 1,796,154 1,826,667 1.7%Virgin Islands 27,436 27,824 27,461 -1.3%Virginia 940,932 918,902 860,375 -6.4%West Virginia 350,695 362,501 367,908 1.5%
Alabama 915,322 902,073 889,380 -1.4%Florida 3,556,473 3,526,311 3,656,169 3.7%Georgia 1,948,189 1,815,833 1,800,531 -0.8%Kentucky 872,439 828,076 768,882 -7.1%Mississippi 668,624 656,871 636,322 -3.1%North Carolina 1,703,700 1,575,676 1,646,202 4.5%South Carolina 875,866 834,511 804,572 -3.6%Tennessee 1,342,089 1,312,505 1,229,391 -6.3%
Illinois 2,040,053 2,015,303 2,042,306 1.3%Indiana 926,011 892,699 831,740 -6.8%Michigan 1,775,646 1,679,421 1,571,344 -6.4%Minnesota 552,928 533,743 496,023 -7.1%Ohio 1,824,675 1,752,135 1,676,263 -4.3%Wisconsin 856,730 841,533 805,540 -4.3%
Arkansas 504,621 491,965 468,904 -4.7%Louisiana 940,100 877,340 859,738 -2.0%New Mexico 440,362 430,622 453,146 5.2%Oklahoma 621,831 608,492 598,257 -1.7%Texas 4,041,891 3,852,675 3,724,688 -3.3%
Colorado 507,934 505,169 495,134 -2.0%Iowa 420,344 408,070 391,224 -4.1%Kansas 316,983 293,456 273,974 -6.6%Missouri 929,943 858,416 844,597 -1.6%Montana 128,531 124,906 119,082 -4.7%Nebraska 179,711 173,530 174,092 0.3%North Dakota 56,523 53,753 53,148 -1.1%South Dakota 104,052 100,938 98,553 -2.4%Utah 251,626 229,911 225,603 -1.9%Wyoming 38,046 35,871 32,606 -9.1%
Alaska 91,364 87,486 81,121 -7.3%Arizona 1,111,105 1,044,310 999,401 -4.3%California 4,159,031 4,349,634 4,417,772 1.6%Guam 45,554 47,289 47,166 -0.3%Hawaii 189,350 194,264 188,895 -2.8%Idaho 227,006 211,781 196,872 -7.0%Nevada 360,953 383,622 420,413 9.6%Oregon 817,575 802,190 779,749 -2.8%Washington 1,113,441 1,095,551 1,070,933 -2.2%
US 47,636,090 46,535,888 45,766,672 -1.7%
44

TABLE 31: Supplemental Nutrition Assistance Program Participation - Households - FY 2013 - FY 2015
Households Households Households PercentParticipating Participating Participating Change
(Monthly) (Monthly) (Monthly) FY 2014 -FY 2013 FY 2014 FY 2015 FY 2015
STATE
Connecticut 233,171 242,982 248,204 2.1%Maine 130,374 122,690 105,075 -14.4%Massachusetts 498,580 489,039 449,468 -8.1%New Hampshire 56,201 53,559 51,478 -3.9%New York 1,710,501 1,698,559 1,665,683 -1.9%Rhode Island 100,543 101,002 100,949 -0.1%Vermont 52,337 48,575 44,950 -7.5%
Delaware 72,244 71,408 71,821 0.6%District of Columbia 81,904 80,360 80,007 -0.4%Maryland 392,184 403,781 404,708 0.2%New Jersey 432,270 439,695 453,338 3.1%Pennsylvania 869,836 889,725 918,761 3.3%Virgin Islands 11,957 12,478 12,610 1.1%Virginia 456,489 443,607 404,348 -8.8%West Virginia 167,014 176,029 181,961 3.4%
Alabama 421,302 419,552 417,943 -0.4%Florida 1,943,902 1,920,697 2,009,594 4.6%Georgia 907,896 838,034 839,207 0.1%Kentucky 420,211 399,207 368,596 -7.7%Mississippi 305,005 302,202 296,094 -2.0%North Carolina 786,064 761,105 803,495 5.6%South Carolina 416,724 395,209 379,992 -3.9%Tennessee 662,204 650,251 611,805 -5.9%
Illinois 1,017,190 1,021,150 1,060,589 3.9%Indiana 415,518 404,575 379,929 -6.1%Michigan 909,764 872,538 824,971 -5.5%Minnesota 274,236 260,437 240,410 -7.7%Ohio 889,427 851,972 818,704 -3.9%Wisconsin 416,826 420,833 406,754 -3.3%
Arkansas 224,454 221,446 214,056 -3.3%Louisiana 425,648 396,428 389,519 -1.7%New Mexico 197,359 194,963 205,540 5.4%Oklahoma 287,398 279,606 271,065 -3.1%Texas 1,674,350 1,607,669 1,558,597 -3.1%
Colorado 231,488 234,098 233,113 -0.4%Iowa 198,500 193,372 184,850 -4.4%Kansas 149,233 132,825 121,991 -8.2%Missouri 437,443 403,913 398,662 -1.3%Montana 59,398 59,097 56,112 -5.1%Nebraska 79,379 76,919 77,755 1.1%North Dakota 26,270 25,011 24,771 -1.0%South Dakota 45,312 44,039 43,176 -2.0%Utah 101,027 90,570 88,160 -2.7%Wyoming 16,211 15,249 13,868 -9.1%
Alaska 38,279 36,997 34,187 -7.6%Arizona 476,689 449,640 439,330 -2.3%California 1,905,869 2,019,272 2,096,960 3.8%Guam 15,097 15,480 15,556 0.5%Hawaii 96,022 98,830 95,545 -3.3%Idaho 97,927 90,161 83,869 -7.0%Nevada 174,638 188,739 209,787 11.2%Oregon 451,420 448,855 442,090 -1.5%Washington 591,113 585,105 572,261 -2.2%
US 23,052,396 22,699,534 22,522,261 -0.8%
45
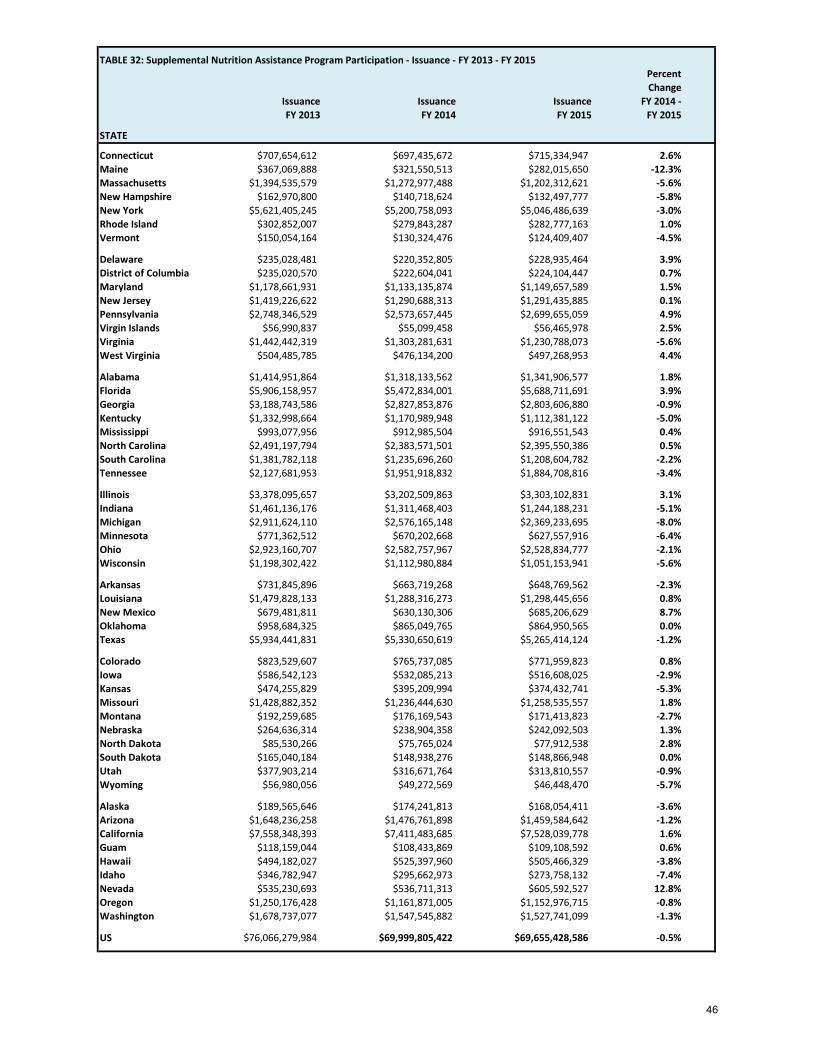
TABLE 32: Supplemental Nutrition Assistance Program Participation - Issuance - FY 2013 - FY 2015PercentChange
Issuance Issuance Issuance FY 2014 -FY 2013 FY 2014 FY 2015 FY 2015
STATE
Connecticut $707,654,612 $697,435,672 $715,334,947 2.6%Maine $367,069,888 $321,550,513 $282,015,650 -12.3%Massachusetts $1,394,535,579 $1,272,977,488 $1,202,312,621 -5.6%New Hampshire $162,970,800 $140,718,624 $132,497,777 -5.8%New York $5,621,405,245 $5,200,758,093 $5,046,486,639 -3.0%Rhode Island $302,852,007 $279,843,287 $282,777,163 1.0%Vermont $150,054,164 $130,324,476 $124,409,407 -4.5%
Delaware $235,028,481 $220,352,805 $228,935,464 3.9%District of Columbia $235,020,570 $222,604,041 $224,104,447 0.7%Maryland $1,178,661,931 $1,133,135,874 $1,149,657,589 1.5%New Jersey $1,419,226,622 $1,290,688,313 $1,291,435,885 0.1%Pennsylvania $2,748,346,529 $2,573,657,445 $2,699,655,059 4.9%Virgin Islands $56,990,837 $55,099,458 $56,465,978 2.5%Virginia $1,442,442,319 $1,303,281,631 $1,230,788,073 -5.6%West Virginia $504,485,785 $476,134,200 $497,268,953 4.4%
Alabama $1,414,951,864 $1,318,133,562 $1,341,906,577 1.8%Florida $5,906,158,957 $5,472,834,001 $5,688,711,691 3.9%Georgia $3,188,743,586 $2,827,853,876 $2,803,606,880 -0.9%Kentucky $1,332,998,664 $1,170,989,948 $1,112,381,122 -5.0%Mississippi $993,077,956 $912,985,504 $916,551,543 0.4%North Carolina $2,491,197,794 $2,383,571,501 $2,395,550,386 0.5%South Carolina $1,381,782,118 $1,235,696,260 $1,208,604,782 -2.2%Tennessee $2,127,681,953 $1,951,918,832 $1,884,708,816 -3.4%
Illinois $3,378,095,657 $3,202,509,863 $3,303,102,831 3.1%Indiana $1,461,136,176 $1,311,468,403 $1,244,188,231 -5.1%Michigan $2,911,624,110 $2,576,165,148 $2,369,233,695 -8.0%Minnesota $771,362,512 $670,202,668 $627,557,916 -6.4%Ohio $2,923,160,707 $2,582,757,967 $2,528,834,777 -2.1%Wisconsin $1,198,302,422 $1,112,980,884 $1,051,153,941 -5.6%
Arkansas $731,845,896 $663,719,268 $648,769,562 -2.3%Louisiana $1,479,828,133 $1,288,316,273 $1,298,445,656 0.8%New Mexico $679,481,811 $630,130,306 $685,206,629 8.7%Oklahoma $958,684,325 $865,049,765 $864,950,565 0.0%Texas $5,934,441,831 $5,330,650,619 $5,265,414,124 -1.2%
Colorado $823,529,607 $765,737,085 $771,959,823 0.8%Iowa $586,542,123 $532,085,213 $516,608,025 -2.9%Kansas $474,255,829 $395,209,994 $374,432,741 -5.3%Missouri $1,428,882,352 $1,236,444,630 $1,258,535,557 1.8%Montana $192,259,685 $176,169,543 $171,413,823 -2.7%Nebraska $264,636,314 $238,904,358 $242,092,503 1.3%North Dakota $85,530,266 $75,765,024 $77,912,538 2.8%South Dakota $165,040,184 $148,938,276 $148,866,948 0.0%Utah $377,903,214 $316,671,764 $313,810,557 -0.9%Wyoming $56,980,056 $49,272,569 $46,448,470 -5.7%
Alaska $189,565,646 $174,241,813 $168,054,411 -3.6%Arizona $1,648,236,258 $1,476,761,898 $1,459,584,642 -1.2%California $7,558,348,393 $7,411,483,685 $7,528,039,778 1.6%Guam $118,159,044 $108,433,869 $109,108,592 0.6%Hawaii $494,182,027 $525,397,960 $505,466,329 -3.8%Idaho $346,782,947 $295,662,973 $273,758,132 -7.4%Nevada $535,230,693 $536,711,313 $605,592,527 12.8%Oregon $1,250,176,428 $1,161,871,005 $1,152,976,715 -0.8%Washington $1,678,737,077 $1,547,545,882 $1,527,741,099 -1.3%
US $76,066,279,984 $69,999,805,422 $69,655,428,586 -0.5%
46

TABLE 33: Supplemental Nutrition Assistance Program Federal Share Certification Costs - FY 2014 - FY 2015
Federal Share Federal ShareCertification Certification Percent
Costs - FY 2014 Costs - FY 2015 Change
STATE
Connecticut $20,204,587 $21,977,335 8.8%Maine $5,603,717 $5,533,295 -1.3%Massachusetts $43,308,122 $48,247,394 11.4%New Hampshire $1,081,299 $1,157,107 7.0%New York $199,340,944 $226,191,255 13.5%Rhode Island $3,038,345 $2,941,789 -3.2%Vermont $989,604 $1,624,846 64.2%
Delaware $10,695,796 $10,931,372 2.2%District of Columbia $8,302,275 $9,633,312 16.0%Maryland $50,327,604 $59,119,235 17.5%New Jersey $88,552,360 $91,659,636 3.5%Pennsylvania $115,001,400 $127,175,062 10.6%Virgin Islands $3,716,259 $3,670,090 -1.2%Virginia $71,713,829 $72,886,990 1.6%West Virginia $10,306,506 $10,325,479 0.2%
Alabama $30,624,060 $32,905,681 7.5%Florida $54,216,068 $53,047,583 -2.2%Georgia $60,515,569 $68,188,339 12.7%Kentucky $36,147,654 $38,492,890 6.5%Mississippi $17,965,084 $16,903,237 -5.9%North Carolina $81,129,627 $73,920,850 -8.9%South Carolina $15,332,342 $16,208,873 5.7%Tennessee $57,242,445 $63,211,424 10.4%
Illinois $53,473,521 $60,985,304 14.0%Indiana $38,898,458 $52,085,918 33.9%Michigan $103,848,577 $112,282,059 8.1%Minnesota $42,288,574 $39,555,114 -6.5%Ohio $38,701,553 $40,439,102 4.5%Wisconsin $27,456,216 $25,842,552 -5.9%
Arkansas $26,736,547 $29,132,935 9.0%Louisiana $53,528,851 $52,755,602 -1.4%New Mexico $22,105,314 $22,526,170 1.9%Oklahoma $34,156,740 $32,458,807 -5.0%Texas $128,989,469 $114,282,741 -11.4%
Colorado $29,859,138 $32,000,338 7.2%Iowa $15,539,016 $15,677,431 0.9%Kansas $13,933,534 $13,139,060 -5.7%Missouri $28,856,271 $25,676,146 -11.0%Montana $6,566,035 $6,319,443 -3.8%Nebraska $10,208,050 $10,101,207 -1.0%North Dakota $5,025,151 $5,263,859 4.8%South Dakota $4,773,620 $4,734,112 -0.8%Utah $11,255,885 $10,660,981 -5.3%Wyoming $1,475,108 $2,110,603 43.1%
Alaska $8,169,087 $8,626,562 5.6%Arizona $36,762,261 $41,429,986 12.7%California $516,435,320 $541,076,514 4.8%Guam $668,968 $752,384 12.5%Hawaii $13,216,261 $13,805,953 4.5%Idaho $4,915,542 $4,550,994 -7.4%Nevada $15,408,300 $16,437,638 6.7%Oregon $57,744,995 $62,370,557 8.0%Washington $42,512,882 $49,842,749 17.2%
US $2,378,864,740 $2,502,875,895 5.2%
47

TABLE 34: Supplemental Nutrition Assistance Program Federal Share Certification Costs per Case - FY 2014 - FY 2015
Federal Share Cert Cost Federal Share Cert CostPer Case Per Month Per Case Per Month Percent
Costs - FY 2014 Costs - FY 2015 Change
STATE
Connecticut $6.93 $7.38 6.5%Maine $3.81 $4.39 15.3%Massachusetts $7.38 $8.95 21.2%New Hampshire $1.68 $1.87 11.3%New York $9.78 $11.32 15.7%Rhode Island $2.51 $2.43 -3.1%Vermont $1.70 $3.01 77.4%
Delaware $12.48 $12.68 1.6%District of Columbia $8.61 $10.03 16.5%Maryland $10.39 $12.17 17.2%New Jersey $16.78 $16.85 0.4%Pennsylvania $10.77 $11.54 7.1%Virgin Islands $24.82 $24.25 -2.3%Virginia $13.47 $15.02 11.5%West Virginia $4.88 $4.73 -3.1%
Alabama $6.08 $6.56 7.9%Florida $2.35 $2.20 -6.5%Georgia $6.02 $6.77 12.5%Kentucky $7.55 $8.70 15.3%Mississippi $4.95 $4.76 -4.0%North Carolina $8.88 $7.67 -13.7%South Carolina $3.23 $3.55 10.0%Tennessee $7.34 $8.61 17.4%
Illinois $4.36 $4.79 9.8%Indiana $8.01 $11.42 42.6%Michigan $9.92 $11.34 14.4%Minnesota $13.53 $13.71 1.3%Ohio $3.79 $4.12 8.7%Wisconsin $5.44 $5.29 -2.6%
Arkansas $10.06 $11.34 12.7%Louisiana $11.25 $11.29 0.3%New Mexico $9.45 $9.13 -3.3%Oklahoma $10.18 $9.98 -2.0%Texas $6.69 $6.11 -8.6%
Colorado $10.63 $11.44 7.6%Iowa $6.70 $7.07 5.5%Kansas $8.74 $8.98 2.7%Missouri $5.95 $5.37 -9.8%Montana $9.26 $9.39 1.4%Nebraska $11.06 $10.83 -2.1%North Dakota $16.74 $17.71 5.8%South Dakota $9.03 $9.14 1.2%Utah $10.36 $10.08 -2.7%Wyoming $8.06 $12.68 57.3%
Alaska $18.40 $21.03 14.3%Arizona $6.81 $7.86 15.3%California $21.31 $21.50 0.9%Guam $3.60 $4.03 11.9%Hawaii $11.14 $12.04 8.1%Idaho $4.54 $4.52 -0.5%Nevada $6.80 $6.53 -4.0%Oregon $10.72 $11.76 9.7%Washington $6.05 $7.26 19.9%
US $8.73 $9.26 6.0%
48

TABLE 35: Supplemental Nutrition Assistance Program Federal Share of Total Admin. Costs - FY 2014 - FY 2015
Federal Share Federal Share Total Admin Cost Total Admin Cost Percent
FY 2014 FY 2015 Change
STATE
Connecticut $42,676,806 $49,995,111 17.1%Maine $10,878,676 $10,066,536 -7.5%Massachusetts $63,119,158 $59,094,513 -6.4%New Hampshire $7,742,834 $7,772,128 0.4%New York $417,421,238 $369,757,073 -11.4%Rhode Island $12,129,376 $10,781,805 -11.1%Vermont $11,678,124 $11,284,251 -3.4%
Delaware $15,885,703 $15,298,965 -3.7%District of Columbia $12,820,202 $18,482,310 44.2%Maryland $57,333,971 $69,738,932 21.6%New Jersey $137,285,344 $146,558,599 6.8%Pennsylvania $151,758,249 $160,788,718 6.0%Virgin Islands $6,166,840 $5,536,828 -10.2%Virginia $100,498,831 $99,482,594 -1.0%West Virginia $15,975,515 $15,707,645 -1.7%
Alabama $42,156,116 $44,441,833 5.4%Florida $82,829,988 $80,997,415 -2.2%Georgia $92,275,304 $98,443,383 6.7%Kentucky $52,995,630 $47,696,002 -10.0%Mississippi $34,911,864 $21,053,199 -39.7%North Carolina $95,834,815 $92,158,332 -3.8%South Carolina $34,253,810 $33,182,765 -3.1%Tennessee $66,427,783 $72,765,232 9.5%
Illinois $105,031,252 $97,435,988 -7.2%Indiana $52,189,120 $65,797,553 26.1%Michigan $136,951,536 $143,174,657 4.5%Minnesota $70,758,137 $62,382,769 -11.8%Ohio $112,886,199 $104,903,192 -7.1%Wisconsin $66,325,789 $65,643,596 -1.0%
Arkansas $33,751,245 $35,070,739 3.9%Louisiana $57,263,102 $58,310,092 1.8%New Mexico $29,773,496 $30,212,428 1.5%Oklahoma $40,613,711 $38,719,349 -4.7%Texas $211,616,848 $190,609,525 -9.9%
Colorado $49,363,012 $50,678,950 2.7%Iowa $21,231,171 $20,176,910 -5.0%Kansas $21,202,565 $18,680,024 -11.9%Missouri $37,358,986 $33,387,008 -10.6%Montana $12,650,519 $11,425,319 -9.7%Nebraska $11,631,202 $14,358,108 23.4%North Dakota $7,553,604 $8,135,184 7.7%South Dakota $8,234,710 $8,403,119 2.0%Utah $21,365,813 $14,951,211 -30.0%Wyoming $4,851,447 $6,771,354 39.6%
Alaska $14,429,382 $10,534,912 -27.0%Arizona $62,132,288 $62,930,733 1.3%California $825,151,376 $861,888,092 4.5%Guam $1,791,421 $1,568,029 -12.5%Hawaii $15,917,152 $19,003,103 19.4%Idaho $11,300,720 $8,428,958 -25.4%Nevada $26,256,273 $23,747,022 -9.6%Oregon $75,985,541 $76,337,854 0.5%Washington $87,615,156 $92,863,204 6.0%
US $3,838,332,199 $3,777,613,151 -1.6%
49

TABLE 36: Supplemental Nutrition Assistance Program Federal Share of Total Cost per Case - FY 2014 - FY 2015
Federal Share Total Cost Federal Share Total CostPer Case Per Month Per Case Per Month Percent
Costs - FY 2014 Costs - FY 2015 Change
STATE
Connecticut $14.64 $16.79 14.7%Maine $7.39 $7.98 8.0%Massachusetts $10.76 $10.96 1.9%New Hampshire $12.05 $12.58 4.4%New York $20.48 $18.50 -9.7%Rhode Island $10.01 $8.90 -11.1%Vermont $20.03 $20.92 4.4%
Delaware $18.54 $17.75 -4.2%District of Columbia $13.29 $19.25 44.8%Maryland $11.83 $14.36 21.4%New Jersey $26.02 $26.94 3.5%Pennsylvania $14.21 $14.58 2.6%Virgin Islands $41.19 $36.59 -11.2%Virginia $18.88 $20.50 8.6%West Virginia $7.56 $7.19 -4.9%
Alabama $8.37 $8.86 5.8%Florida $3.59 $3.36 -6.5%Georgia $9.18 $9.78 6.5%Kentucky $11.06 $10.78 -2.5%Mississippi $9.63 $5.93 -38.5%North Carolina $10.49 $9.56 -8.9%South Carolina $7.22 $7.28 0.8%Tennessee $8.51 $9.91 16.4%
Illinois $8.57 $7.66 -10.7%Indiana $10.75 $14.43 34.3%Michigan $13.08 $14.46 10.6%Minnesota $22.64 $21.62 -4.5%Ohio $11.04 $10.68 -3.3%Wisconsin $13.13 $13.45 2.4%
Arkansas $12.70 $13.65 7.5%Louisiana $12.04 $12.47 3.6%New Mexico $12.73 $12.25 -3.7%Oklahoma $12.10 $11.90 -1.7%Texas $10.97 $10.19 -7.1%
Colorado $19.67 $18.12 -7.9%Iowa $11.85 $9.10 -23.3%Kansas $13.36 $12.76 -4.5%Missouri $10.21 $6.98 -31.6%Montana $17.93 $16.97 -5.4%Nebraska $18.30 $15.39 -15.9%North Dakota $24.87 $27.37 10.0%South Dakota $16.28 $16.22 -0.4%Utah $28.95 $14.13 -51.2%Wyoming $26.51 $40.69 53.5%
Alaska $32.50 $25.68 -21.0%Arizona $11.52 $11.94 3.7%California $34.05 $34.25 0.6%Guam $9.64 $8.40 -12.9%Hawaii $13.42 $16.57 23.5%Idaho $10.44 $8.38 -19.8%Nevada $11.59 $9.43 -18.6%Oregon $14.11 $14.39 2.0%Washington $12.48 $13.52 8.4%
US $14.09 $13.98 -0.8%
50

TABLE 37: Supplemental Nutrition Assistance Program Total Fair Hearings - FY 2014 - FY 2015
Fair Hearings Fair HearingsCompleted Completed Percent
FY 2014 FY 2015 Change
STATE
Connecticut 194 336 73.2%Maine 50 77 54.0%Massachusetts 2,924 2,526 -13.6%New Hampshire 22 22 0.0%New York 1,074 7,874 633.1%Rhode Island 20 17 -15.0%Vermont 18 19 5.6%
Delaware 123 124 0.8%District of Columbia 35 59 68.6%Maryland 123 132 7.3%New Jersey 158 144 -8.9%Pennsylvania 35,098 25,762 -26.6%Virgin Islands 11 12 9.1%Virginia 488 592 21.3%West Virginia 65 79 21.5%
Alabama 144 137 -4.9%Florida 502 454 -9.6%Georgia 81 73 -9.9%Kentucky 80 67 -16.3%Mississippi 233 227 -2.6%North Carolina 426 483 13.4%South Carolina 564 744 31.9%Tennessee 6,207 4,147 -33.2%
Illinois 90 100 11.1%Indiana 1,375 1,195 -13.1%Michigan 1,769 3,382 91.2%Minnesota 1,046 905 -13.5%Ohio 8,162 9,168 12.3%Wisconsin 433 550 27.0%
Arkansas 281 288 2.5%Louisiana 87 433 397.7%New Mexico 105 86 -18.1%Oklahoma 51 50 -2.0%Texas 21,975 1,022 -95.3%
Colorado 123 208 69.1%Iowa 237 262 10.5%Kansas 612 390 -36.3%Missouri 359 261 -27.3%Montana 29 22 -24.1%Nebraska 415 445 7.2%North Dakota 6 6 0.0%South Dakota 17 13 -23.5%Utah 177 44 -75.1%Wyoming 2 4 5.0%
Alaska 64 46 -28.1%Arizona 1,148 1,115 -2.9%California 3,833 3,510 -8.4%Guam 9 23 155.6%Hawaii 46 32 -30.4%Idaho 86 66 -23.3%Nevada 458 163 -64.4%Oregon 100 123 23.0%Washington 153 194 26.8%
US 91,888 68,213 -25.8%
51

TABLE 38: Supplemental Nutrition Assistance Program - Fraud Investigations - FY 2014 - FY 2015
Total TotalInvestigations Investigations
Completed Completed PercentFY 2014 FY 2015 Change
STATE
Connecticut 1,997 2,842 42.3%Maine 3,435 241 -93.0%Massachusetts 11,059 11,080 0.2%New Hampshire 1,361 1,286 -5.5%New York 190,923 257,589 34.9%Rhode Island 863 751 -13.0%Vermont 424 497 17.2%
Delaware 5,403 4,958 -8.2%District of Columbia 391 358 -8.4%Maryland 437 573 31.1%New Jersey 11,878 18,760 57.9%Pennsylvania 24,176 21,795 -9.8%Virgin Islands 1,187 911 -23.3%Virginia 12,813 13,194 3.0%West Virginia 4,357 3,044 -30.1%
Alabama 2,187 1,401 -35.9%Florida 46,282 41,745 -9.8%Georgia 8,668 8,994 3.8%Kentucky 739 479 -35.2%Mississippi 1,826 2,896 58.6%North Carolina 9,284 10,660 14.8%South Carolina 481 7,524 1464.2%Tennessee 7,605 7,891 3.8%
Illinois 5,456 3,806 -30.2%Indiana 205 3,831 1768.8%Michigan 44,097 39,638 -10.1%Minnesota 7,904 7,429 -6.0%Ohio 17,490 21,465 22.7%Wisconsin 6,710 8,234 22.7%
Arkansas 10,455 10,393 -0.6%Louisiana 1,027 1,519 47.9%New Mexico 92 69 -25.0%Oklahoma 652 601 -7.8%Texas 4,207 1,502 -64.3%
Colorado 7,835 2,115 -73.0%Iowa 4,513 4,496 -0.4%Kansas 3,426 2,631 -23.2%Missouri 973 503 -48.3%Montana 483 637 31.9%Nebraska 522 458 -12.3%North Dakota 1 134 13300.0%South Dakota 364 305 -16.2%Utah 2,997 2,215 -26.1%Wyoming 357 295 -17.4%
Alaska 2,973 2,526 -15.0%Arizona 8,340 7,848 -5.9%California 147,969 159,237 7.6%Guam 241 240 -0.4%Hawaii 927 1,063 14.7%Idaho 1,633 2,070 26.8%Nevada 4,504 6,173 37.1%Oregon 2,145 2,203 2.7%Washington 4,731 10,006 111.5%
US 641,005 723,111 12.8%
52

TABLE 39: Supplemental Nutrition Assistance Program - Total Disqualifications - FY 2014 - FY 2015
Total TotalDisqualified Disqualified Percent
FY 2014 FY 2015 Change
STATE
Connecticut 103 333 223.3%Maine 151 81 -46.4%Massachusetts 754 651 -13.7%New Hampshire 194 155 -20.1%New York 2,184 2,450 12.2%Rhode Island 20 22 10.0%Vermont 201 225 11.9%
Delaware 155 186 20.0%District of Columbia 15 9 -40.0%Maryland 112 215 92.0%New Jersey 541 552 2.0%Pennsylvania 1,018 1,093 7.4%Virgin Islands 190 278 46.3%Virginia 1,667 1,449 -13.1%West Virginia 362 281 -22.4%
Alabama 684 1,448 111.7%Florida 3,136 1,999 -36.3%Georgia 2,061 3,068 48.9%Kentucky 198 188 -5.1%Mississippi 1,868 3,107 66.3%North Carolina 1,985 3,297 66.1%South Carolina 881 1,263 43.4%Tennessee 1,788 1,529 -14.5%
Illinois 1,499 1,626 8.5%Indiana 25 14 -44.0%Michigan 4,404 4,609 4.7%Minnesota 450 610 35.6%Ohio 2,639 2,231 -15.5%Wisconsin 993 1,214 22.3%
Arkansas 357 287 -19.6%Louisiana 1,063 1,287 21.1%New Mexico 81 83 2.5%Oklahoma 584 545 -6.7%Texas 3,528 1,010 -71.4%
Colorado 626 256 -59.1%Iowa 166 97 -41.6%Kansas 505 536 6.1%Missouri 536 802 49.6%Montana 685 503 -26.6%Nebraska 136 121 -11.0%North Dakota 97 126 29.9%South Dakota 76 178 134.2%Utah 791 904 14.3%Wyoming 45 15 -66.7%
Alaska 157 149 -5.1%Arizona 169 184 8.9%California 2,868 3,309 15.4%Guam 89 140 57.3%Hawaii 164 250 52.4%Idaho 996 147 -85.2%Nevada 294 438 49.0%Oregon 781 860 10.1%Washington 130 104 -20.0%
US 45,202 46,514 2.9%
53

TABLE 40: Supplemental Nutrition Assistance Program - Recipient Claims Established - FY 2014 - FY 2015
Total Claims Total ClaimsEstablished Established Percent
STATE FY 2014 FY 2015 Change
Connecticut $1,714,509 $2,280,491 33.0%Maine $1,642,247 $3,148,079 91.7%Massachusetts $6,169,632 $9,210,150 49.3%New Hampshire $1,117,238 $833,392 -25.4%New York $14,432,958 $15,629,749 8.3%Rhode Island $291,193 $513,482 76.3%Vermont $966,429 $725,332 -24.9%
Delaware $4,098,271 $3,465,795 -15.4%District of Columbia $1,533,241 $1,251,323 -18.4%Maryland $3,196,768 $3,572,028 11.7%New Jersey $9,969,026 $9,595,280 -3.7%Pennsylvania $17,649,149 $14,253,927 -19.2%Virgin Islands $310,661 $244,420 -21.3%Virginia $7,410,416 $6,871,787 -7.3%West Virginia $2,688,828 $2,650,910 -1.4%
Alabama $10,749,285 $9,375,542 -12.8%Florida $34,995,599 $33,157,034 -5.3%Georgia $14,763,811 $13,831,131 -6.3%Kentucky $9,997,850 $9,424,440 -5.7%Mississippi $5,370,479 $6,739,123 25.5%North Carolina $15,413,438 $20,221,103 31.2%South Carolina $12,895,638 $14,359,034 11.3%Tennessee $16,416,933 $15,656,396 -4.6%
Illinois $35,582,252 $42,708,018 20.0%Indiana $8,904,977 $11,769,110 32.2%Michigan $18,311,296 $20,486,093 11.9%Minnesota $8,056,260 $9,120,104 13.2%Ohio $19,919,190 $20,892,391 4.9%Wisconsin $10,534,116 $11,078,003 5.2%
Arkansas $1,228,394 $2,191,039 78.4%Louisiana $3,806,024 $3,607,357 -5.2%New Mexico $2,233,145 $3,373,767 51.1%Oklahoma $2,157,148 $2,012,841 -6.7%Texas $50,245,933 $37,476,585 -25.4%
Colorado $14,656,231 $12,110,771 -17.4%Iowa $1,691,992 $1,702,744 0.6%Kansas $3,632,372 $3,877,923 6.8%Missouri $2,242,900 $2,587,933 15.4%Montana $1,248,408 $1,643,348 31.6%Nebraska $2,114,799 $1,575,428 -25.5%North Dakota $427,361 $421,155 -1.5%South Dakota $950,304 $1,152,864 21.3%Utah $2,591,654 $2,496,724 -3.7%Wyoming $232,336 $239,174 2.9%
Alaska $943,888 $1,013,207 7.3%Arizona $3,547,298 $3,492,350 -1.5%California $168,639,941 $230,712,538 36.8%Guam $379,120 $289,766 -23.6%Hawaii $1,910,239 $3,157,878 65.3%Idaho $1,128,612 $1,524,318 35.1%Nevada $2,168,383 $2,283,031 5.3%Oregon $5,379,933 $8,542,222 58.8%Washington $6,145,049 $6,355,616 3.4%
US $574,983,971 $647,095,316 12.5%
54

TABLE 41: Supplemental Nutrition Assistance Program - Recipient Claims Collected - FY 2014 - FY 2015
Total Claims Total ClaimsCollected Collected Percent
STATE FY 2014 FY 2015 Change
Connecticut $781,002 $1,081,799 38.5%Maine $1,437,164 $1,363,083 -5.2%Massachusetts $4,049,067 $4,332,625 7.0%New Hampshire $640,946 $735,511 14.8%New York $8,997,022 $10,254,636 14.0%Rhode Island $282,837 $262,136 -7.3%Vermont $647,412 $766,056 18.3%
Delaware $1,745,504 $2,266,654 29.9%District of Columbia $756,484 $721,368 -4.6%Maryland $1,781,009 $2,135,323 19.9%New Jersey $7,085,393 $8,133,164 14.8%Pennsylvania $8,969,725 $11,031,889 23.0%Virgin Islands $240,940 $306,809 27.3%Virginia $5,119,103 $5,354,187 4.6%West Virginia $2,570,589 $2,315,575 -9.9%
Alabama $4,512,708 $5,040,270 11.7%Florida $17,999,228 $18,648,505 3.6%Georgia $9,660,461 $10,543,394 9.1%Kentucky $6,305,273 $7,058,074 11.9%Mississippi $4,148,924 $4,327,688 4.3%North Carolina $9,494,749 $10,930,914 15.1%South Carolina $8,127,337 $8,067,306 -0.7%Tennessee $9,769,197 $11,048,594 13.1%
Illinois $22,000,790 $25,343,535 15.2%Indiana $3,208,456 $3,135,801 -2.3%Michigan $10,086,330 $11,039,091 9.4%Minnesota $5,812,692 $6,375,606 9.7%Ohio $12,286,733 $13,261,537 7.9%Wisconsin $5,328,823 $6,584,975 23.6%
Arkansas $1,219,982 $1,313,207 7.6%Louisiana $2,622,483 $2,579,162 -1.7%New Mexico $991,157 $1,836,041 85.2%Oklahoma $1,430,170 $1,429,807 0.0%Texas $32,228,036 $38,222,463 18.6%
Colorado $9,882,133 $8,867,667 -10.3%Iowa $1,235,981 $1,246,325 0.8%Kansas $1,617,479 $1,970,205 21.8%Missouri $2,927,331 $2,725,686 -6.9%Montana $916,235 $931,741 1.7%Nebraska $1,042,014 $1,272,864 22.2%North Dakota $395,958 $376,092 -5.0%South Dakota $521,606 $709,153 36.0%Utah $1,829,439 $2,016,319 10.2%Wyoming $162,888 $173,899 6.8%
Alaska $551,256 $666,754 21.0%Arizona $1,832,957 $2,365,657 29.1%California $92,407,949 $91,954,742 -0.5%Guam $97,987 $179,467 83.2%Hawaii $1,428,531 $1,689,770 18.3%Idaho $782,310 $997,451 27.5%Nevada $991,577 $1,104,867 11.4%Oregon $5,235,331 $5,501,735 5.1%Washington $3,792,968 $3,902,159 2.9%
US $339,989,653 $366,499,338 7.8%
55

FY 2009 FY 2010 FY 2011 FY 2012 FY 2013 FY 2014 FY 2015
TOTAL PARTICIPATION AND ISSUANCE
PERSONS (MONTHLY) (IN MIL) 33.5 40.3 44.7 46.6 47.6 46.5 45.8
HOUSEHOLDS (MONTHLY) (IN MIL) 15.2 18.6 21.1 22.3 23.1 22.7 22.5
ISSUANCE (IN MIL $) $50,360 $64,704 $71,811 $74,619 $76,066 $69,999 $69,655
AVG MONTHLY BENEFIT PER PERSON $125.31 $133.79 $133.85 $133.41 $133.07 $125.48 $126.83
AVG MONTHLY BENEFIT PER HSHLD $275.51 $289.61 $284.00 $278.48 $274.98 $264.88 $257.73
Supplemental Nutrition Assistance Program Issuance and Particpation - FY 2009 - 2015
56

FY 2009 FY 2010 FY 2011 FY 2012 FY 2013 FY 2014 FY 2015
INVESTIGATIONSINV COMPLETED 842,973 784,430 797,828 729,742 709,112 641,005 723,111 FRAUD $ DETERMINED BY INV (IN MIL $) $102.59 $118.03 $115.40 $160.45 $183.85 $173.36 $174.01
PROSECUTIONSPROS. COMPLETED 6,748 6,084 5,839 5,432 5,407 4,979 5,075 DISQ CONSENT AGRMNTS 8,272 7,955 8,468 6,849 4,143 3,513 2,913 FRAUD INVOLVED (IN MIL $) $31.95 $34.41 $35.92 $39.48 $31.97 $24.60 $24.96PERSONS DISQUALIFIED 14,686 13,668 13,974 12,078 9,237 8,259 7,825
FRAUD HEARINGSHEARINGS HELD 15,340 13,869 14,372 13,350 16,188 17,052 19,910 WAIVED HEARINGS 21,334 18,132 19,305 18,112 19,670 21,987 20,320 FRAUD INVOLVED (IN MIL $) $46.03 $48.70 $48.60 $54.38 $68.85 $70.35 $75.26PERSONS DISQUALIFIED 35,492 30,815 32,995 30,359 34,514 36,943 38,689
TOTALS (PROSECUTIONS & HEARINGS)TOTAL DISQUALIFIED 50,178 44,483 46,369 42,437 43,751 45,202 46,514 TOTAL FRAUD INVOLVED (IN MIL $) $77.98 $83.11 $84.60 $93.86 $100.83 $94.95 $100.21
RECIPIENT CLAIMSCLAIMS ESTABLISHED (IN MIL $)FRAUD 1/ $32.00 $38.30 $40.50 $49.30 $57.88 $59.48 $58.59NONFRAUD $335.02 $421.40 $480.40 $484.82 $495.56 $515.50 $588.50TOTAL $367.03 $459.70 $520.90 $534.12 $553.44 $574.98 $647.10
CLAIMS COLLECTED (IN MIL $)FRAUD $60.8 $67.2 $72.0 $74.0 $75.2 $77.7 $86.0NONFRAUD $198.8 $220.1 $241.7 $254.1 $263.5 $262.3 $280.5TOTAL $259.6 $287.3 $313.7 $328.1 $338.7 $340.0 $366.5
TOTALS MAY NOT ADD DUE TO ROUNDING.1/ SOME STATES ESTABLISH POTENTIAL FRAUD CLAIMS AS HOUSEHOLD ERROR CLAIMS INITIALLY AND THEN TRANSFER THE CLAIM FROM INADVERTENT HOUSEHOLD ERROR TO FRAUD CLAIM AFTER THE PROSECUTION OR FRAUD HEARING. THUS, THE SUM OF THE FRAUD INVOLVED FROM PROSECUTION AND FRAUD HEARINGS IS A BETTER MEASURE OF THE AMOUNT OF FRAUD CLAIMS ULTIMATELY ESTABLISHED.
Supplemental Nutrition Assistance Program Recipient Fraud Activity - FY 2009 - 2015
57

FY 2009 FY 2010 FY 2011 FY 2012 FY 2013 FY 2014 FY 2015
$32.0 $38.3 $40.5 $49.3 $57.9 $59.5 $58.6$236.5 $275.9 $320.7 $330.0 $351.5 $381.0 $397.2
NEW CLAIMS ESTABLISHED FRAUDHOUSEHOLD ERROR AGENCY ERROR $98.6 $145.5 $159.7 $154.8 $144.1 $134.5 $191.3TOTAL $367.0 $459.7 $520.9 $534.1 $553.4 $575.0 $647.1
$60.8 $67.2 $72.0 $74.0 $75.2 $77.7 $86.0$133.6 $143.7 $156.7 $168.8 $175.7 $178.8 $194.4
CLAIMS COLLECTED FRAUD HOUSEHOLD ERROR AGENCY ERROR $65.1 $76.4 $85.0 $85.4 $87.8 $83.5 $86.1TOTAL $259.6 $287.3 $313.7 $328.1 $338.7 $340.0 $366.5
$48.0 $52.3 $56.6 $59.7 $61.5 $62.9 $69.0STATE SHARE OF COLL. FNS SHARE OF COLL. $211.6 $235.0 $257.2 $268.5 $277.2 $277.0 $297.5
$131.5 $143.6 $153.8 $153.4 $158.5 $145.6 $143.6$91.0 $86.7 $104.6 $104.6 $122.5 $136.4 $156.4
COLLECTIONS BY COLLECTION METHOD RECOUPED TREASURY OFFSET OTHER $37.0 $50.7 $55.3 $70.1 $57.7 $57.9 $66.5TOTAL $259.6 $287.3 $313.7 $328.1 $338.7 $340.0 $366.5
AVERAGE DOLLAR AMOUNT PER CLAIM FOR NEW CLAIMS ESTABLISHED (ACTUAL DOLLARS)FRAUD $1,871 $2,109 $2,310 $2,487 $2,660 $2,706 $2,488
$675 $704 $741 $757 $833 $1,011 $1,042HOUSEHOLD ERROR AGENCY ERROR $308 $341 $337 $335 $364 $403 $399ALL CLAIMS $534 $549 $564 $582 $659 $784 $732
TOTALS MAY NOT ADD DUE TO ROUNDING.
Supplemental Nutrition Assistance Program Recipient Claims - FY 2009 - 2015
CLAIMS AND COLLECTIONS IN MILLIONS $ (EXCEPT AVERAGE DOLLAR AMOUNT PER CLAIM)
58

END NOTES
STATE PARTICIPATION AND ISSUANCE
States report participation data on the FNS-388 reports and issuance data on the FNS-46. Average monthly participation and household participation in this report may not add for the national total due to rounding. The total participation data in this report is the average monthly participation from all States for the fiscal year (12-month average).
ADMINISTRATIVE COSTS
Administrative Cost data cited in this section is derived from the SF-425;
FAIR HEARINGS
Fair Hearings data cited in this section is derived from the FNS-366B.
FRAUD INVESTIGATIONS, PROSECUTIONS, AND ADMINISTRATIVE DISQUALIFICATION HEARINGS
Fraud Investigations, Prosecutions, and Administrative Disqualification Hearings data cited in this section is derived from the FNS-366B.
RECIPIENT CLAIMS
Claims data cited in this section is derived from the FNS-209; Federal debt collection data is derived from the FNS Federal Debt Collection Biweekly Collection Report. All recoupment amounts are included in collections data.
Data on new claims established is included in Tables 22, 23 and 24. When referring to data in these tables it should be noted that some States show no or low fraud claims newly established because they establish such claims as inadvertent household error and subsequently transfer the claim to fraud after the court or hearing officer’s determination. Therefore we recommend that the data in Tables 16, 18, and 20 (amount of fraud determined from prosecutions and administrative disqualification hearings and number of fraud determinations) be used as a better measure of the amount of fraud claims ultimately established. Data included in Table 27 (Recipient Claims Collected - by Method) includes total claims collected through various means including Federal Debt.
Calculations for other means of collection employed by State agencies include all State methods except for recoupment and Federal collections from the Treasury Offset Program minus all refunds and negative adjustments.
59

END NOTES
Calculations for Federal Debt Collection amounts include Treasury Offset Program collections but not voluntary payments and offset fees paid by the client. Totals represented are for calendar year 2015 – however 98% of Federal collections occurred during FY 2015. Some offsets are subject to refunds.
RANKINGS OF PARTICIPATION AND ISSUANCE
Please refer to the explanations above for the sources of various data cited in this section. Note that totals for persons and households may not add due to rounding.
COMPARISON TO PRIOR YEARS
Please refer to the explanations above for the sources of various data cited in this section.
60