supplementary data of biosynthesis of novel phloretin...
TRANSCRIPT

1
Supplementary Data of 1
2
Biosynthesis of novel phloretin glucosides 3
4
Ramesh Prasad Pandey1, Tai Feng Li1, Eun-Hee Kim2, Tokutaro Yamaguchi1, Yong 5
Il Park3, Joong Su Kim4, Jae Kyung Sohng1* 6
7
1Institute of Biomolecule Reconstruction (iBR), Department of Pharmaceutical Engineering, 8
Sun Moon University, 100, Kalsan-ri, Tangjeong-myeon, Asansi, Chungnam 336-708, Korea 9
2Division of Magnetic Resonance, Korea Basic Science Institute, Ochang, Chungbuk 363-883, 10
Korea 11
3Department of Biotechnology, The Catholic University of Korea, Bucheon, Gyeonggi-do 12
420-743, Korea 13
4Bioindustry Process Center, Jeonbuk Branch Institute, Korea Research Institute of 14
Bioscience and Biotechnology, Jeonbuk 580-185, Jeong-Ub, Korea 15
16 17

2
Supplementary Materials and Methods 18
Bacterial strains, vectors, media 19
Bacillus licheniformis ATCC14580 was used for the isolation of genomic DNA. E. coli XL1 20
Blue MRF’ (Stratagene, USA) was used for DNA manipulation, and E. coli BL21 (DE3) host 21
(Stratagene) was used for the expression of protein. All E. coli strains were grown at 37°C in 22
Luria Bertani (LB) liquid or plate supplemented with ampicillin antibiotic (100 µg mL−1) 23
when required. pGEM®-T Easy vector (Promega, USA) was used for the cloning of PCR 24
products and pET28a (+) vector was used as an expression vector. All DNA manipulation was 25
performed by using standard techniques for Escherichia coli (1). The restriction enzymes 26
were from Takara (Shiga, Japan), while phloretin and UDP-glucose used in this study were 27
purchased from Sigma. 28
Cloning and expression of yjiC 29
The yjiC gene was amplified by using primer pairs: yjiC-F/yjiC-R (Supplementary table S1). 30
The 1,191 bp long fragment of yjiC (sequence correct) was excised from pGEM®-T vector 31
by BamHI/XhoI and was cloned into the same sites of pET28a (+) to generate the 32
recombinant expression vector pET28-YjiC. pET28-YjiC was transformed into E. coli BL21 33
(DE3) using the heat shock transformation method. 50 µL of E. coli BL21 (DE3) harboring 34
pET28-YjiC was cultured overnight and was inoculated into 50 mL LB medium and 35
incubated at 37°C until absorbance at 600 nm (OD600) reached to 0.5-0.7. The culture was 36
induced with 0.5 mM of isopropyl-β-D-thiogalactopyranoside (IPTG) followed by continued 37
growth at 20°C with shaking for 20 h. The cells were harvested by centrifugation at 3,000 38
rpm for 10 min, washed twice with 100 mM Tris-Cl (pH: 8.0) and resuspended in 1 mL of the 39
same buffer. The cells were lysed by sonication and the lysate was cleared by centrifugation 40
(12,000×g) for 30 min at 4°C. Cleared lysate was mixed with 1 mL of Ni-nitrilotriacetic acid 41

3
(Ni-NTA) agarose (Qiagen) and was purified according to the manufacturer’s instructions. 42
Fractions containing purified protein were assessed via sodium dodecyl sulfate-43
polyacrylamide gel electrophoresis (12% SDS-PAGE), and were concentrated using Amicon 44
Ultra-15 (Millipore, 10K NMWL centrifugal filters). The purified protein was stored in the 45
buffer containing 100 mM Tris-HCl (pH 8.0) and 20% [v/v] glycerol until use. Protein 46
concentration was determined by the Bradford assay. 47
Glycosyltransferase activity assay 48
The reactions for YjiC were carried out in a total volume of 100 µl of reaction mixture 49
containing100 mM Tris-Cl (pH 8.8), 2 mM UDP-glucose, 2 mM phloretin, 2 mM MgCl2 and 50
40 µg/mL of appropriately diluted enzyme. The reaction mixture was incubated at 30°C for 4 51
h. The assay mixtures lacking enzyme served as controls. The reaction was quenched by 52
heating the reaction mixtures to 100°C for 1 min, centrifuged to remove proteins, and the 53
reaction product was monitored by HPLC-PDA after proper dilution. 54
Whole-cell biocatalysis 55
The engineered host E. coli BL21 (DE3)/ΔpgiΔzwfΔushA harboring recombinant plasmid 56
was used for the whole cell biocatalyst assay. 200 µL of overnight culture of the above strain 57
was transferred to 50 mL of LB liquid medium (with antibiotics for triple mutants, 58
supplemented with 1% mannitol) and was incubated at 37⁰C until the optical density at 600 59
nm (OD600nm) reached approximately 0.6. Then, 0.5 mM of IPTG was added to the final 60
concentration, and the cultures were incubated at 25°C for 6 h. The cells were aseptically 61
centrifuged at room temperature, and the cell pellets were resuspended in terrific broth (TB) 62
medium (15 mL). 500 µL of each cell suspension was transferred to wells of a 1 mL 96 well 63
plate. To the same cultures 100 µM, 250 µM, and 500 µM of phloretin (final concentration) 64
was fed, and they were then incubated at 25°C/500 rpm in a Thermoshaker. Samples were 65

4
taken at different time intervals, were centrifuged, and were extracted by double volume of 66
ethyl acetate. The organic layer was dried and was again dissolved in 500 µL of HPLC grade 67
methanol for HPLC-PDA analysis. 68
Product analysis and elucidation 69
Reverse-phase HPLC-PDA analysis was performed with a C18 column (YMC-Pack ODS-70
AQ (4.6x150, 5μm) connected to a photo diode array (288 nm) using an isocratic condition of 71
70% H2O (0.1% trifluroacetic acid buffer) and 30% acetonitrile (ACN) at a flow rate of 2 72
mL/min. The molecular weight of the products were confirmed by LC-QTOF-ESI-MS/MS 73
[ACQUITY (UPLC, Waters Corp., USA)-SYNAPT G2-S (Waters Corp., USA)]. The 74
products were purified by prep-HPLC with a C18 column (YMC-Pack ODS-AQ (150 x 20 75
mm I. D., 10 μm) connected to a UV detector (288 nm) using a 36 min binary program with 76
ACN 20% (0-5 min), 40% (5-10 min), 40% (10-15 min), 90% (15-25 min), 90% (25-30 min), 77
and (30-35 min) 10% at a flow rate of 10 mL/min. The purified products were then dried 78
completely in a lyophilizer and were used for structural elucidation. Nuclear magnetic 79
resonance (NMR) spectra were obtained in methanol-d4 (Aldrich, USA) using 800 and 500 80
MHz Bruker, BioSpin when appropriate. 81
82
5
Supplementary Table Legends 83
Table S1. Primers used in this study. 84
Table S2.Strains and vectors used and constructed in this study. 85
Table S3. Reaction conditions for in vitro reaction at different donor substrate concentrations 86
and time of incubation. Reaction incubation time 4h for reactions 1 to 4 and 12 h for reactions 87
5 to 8. All the reactions were incubated at 30oCand stopped by heating at 100oC for 1 min. 88
89

6
Table S1. 90
Primers Oligonucleotide Sequences (5’-3’) Restriction sites
yjiCF
yjiCR
GGATCCATGGGACATAAACATATCGCG
CTCGAGTTATTTTACTCCTGCGGGTGCTAA
BamHI
XhoI
91

7
Table S2. 92
Strains/Plasmids Description Source/reference Strains Escherichia coli XL-1 Blue (MRF’) General cloning host Stratagene, USA BL21(DE3)
BL21(DE3)/ΔpgiΔzwfΔushA BL21 (DE3)/ pET28-YjiC B L 2 1 ( D E 3 ) / Δpgi Δzwf
ΔushA/ pET28-YjiC
ompT hsdT hsdS (rB- mB
-) gal (DE3) BL21(DE3)/pgi, zwf, and ushAdeleted BL21(DE3) carrying pET28-YjiC, yjiCglycosyltransferaseover-expression BL21(DE3)/ ΔpgiΔzwfΔushA carrying pET28-YjiC, yjiC glycosyltransferase over-expression
Novagen [20] This study This study
Plasmid vectors pGEM®-T easy vector pET28a (+)
General cloning vector,T7 and SP6 promoters, f1 ori, Ampr Expression vector,, T7 promoter, pBR322 ori, Ampr
Promega, USA Novagen
93
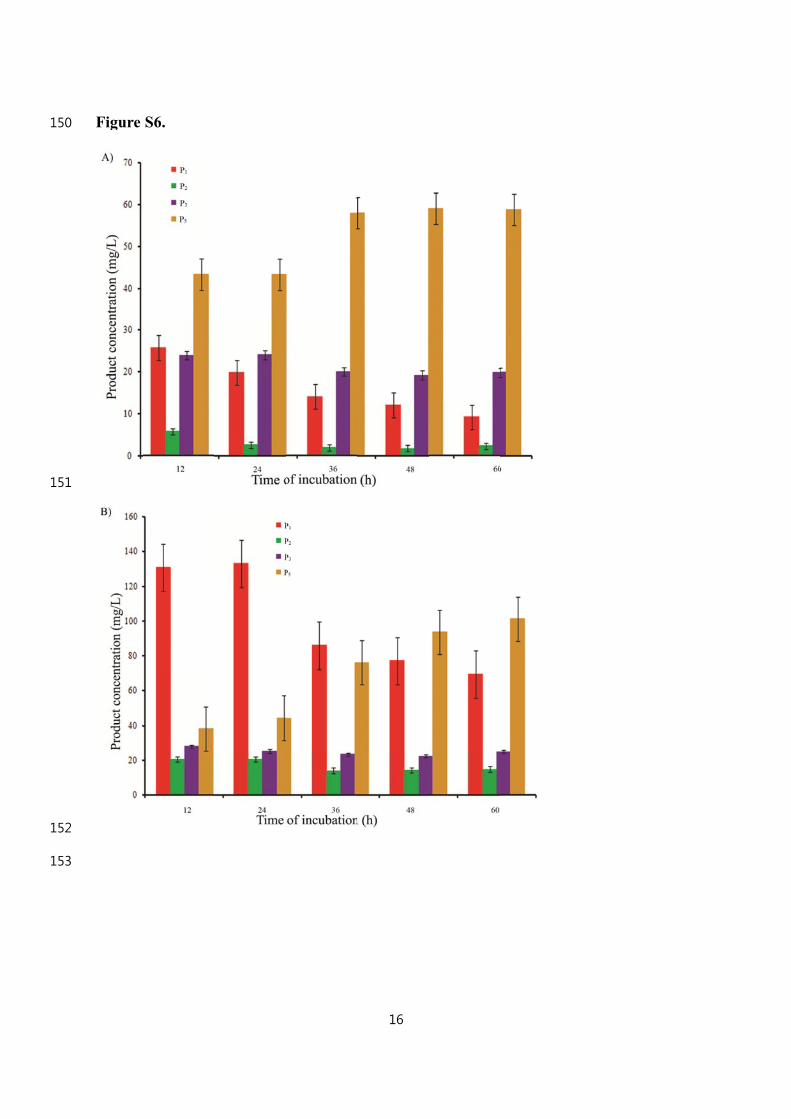
94

8
Table S3. 95
Total reaction volume: 100μl Tris-HCI buffer MgCl2 UDP-Glucose Phloretin Protien (YjiC)
Phloretinin vitro reaction 1 50 mM 2mM 2mM 2mM 40μg/mL Phloretinin vitro reaction 2 50 mM 2mM 4mM 2mM 40μg/mL Phloretinin vitro reaction 3 50 mM 2mM 8mM 2mM 40μg/mL Phloretinin vitro reaction 4 50 mM 2mM 16mM 2mM 40μg/mL Phloretinin vitro reaction 5 50 mM 2mM 2mM 2mM 40μg/mL Phloretinin vitro reaction 6 50 mM 2mM 4mM 2mM 40μg/mL Phloretinin vitro reaction 7 50 mM 2mM 8mM 2mM 40μg/mL Phloretinin vitro reaction 8 50 mM 2mM 16mM 2mM 40μg/mL
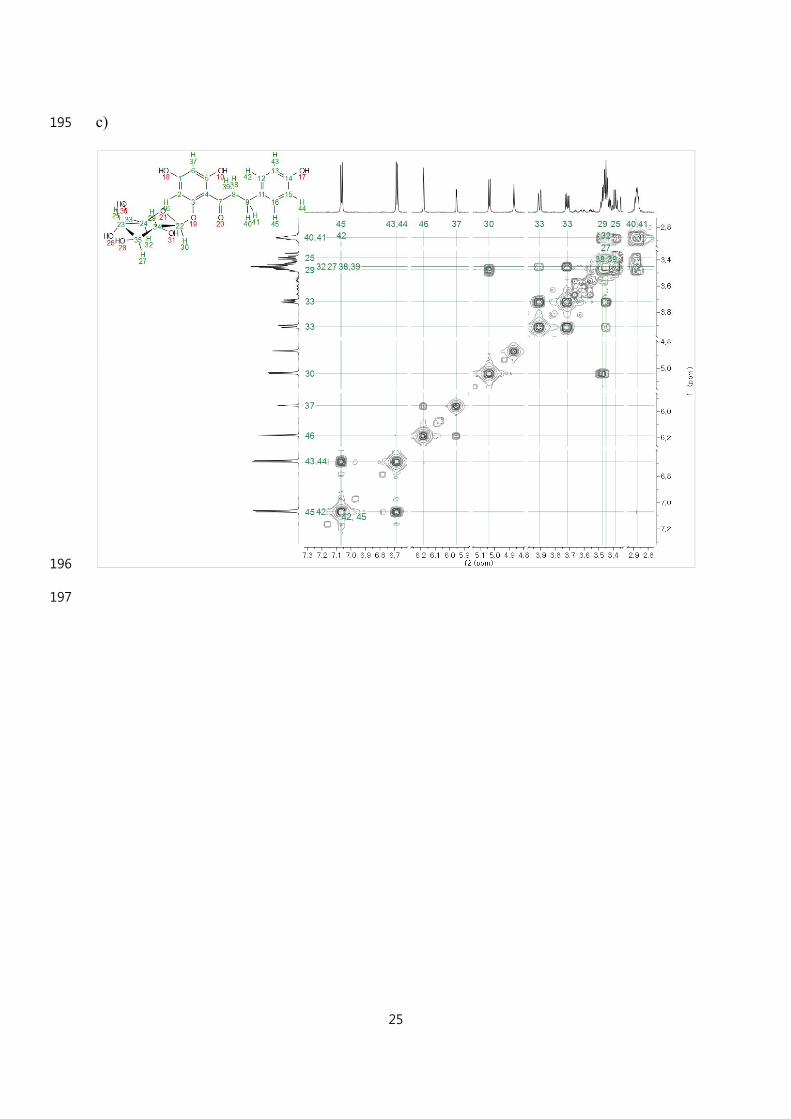
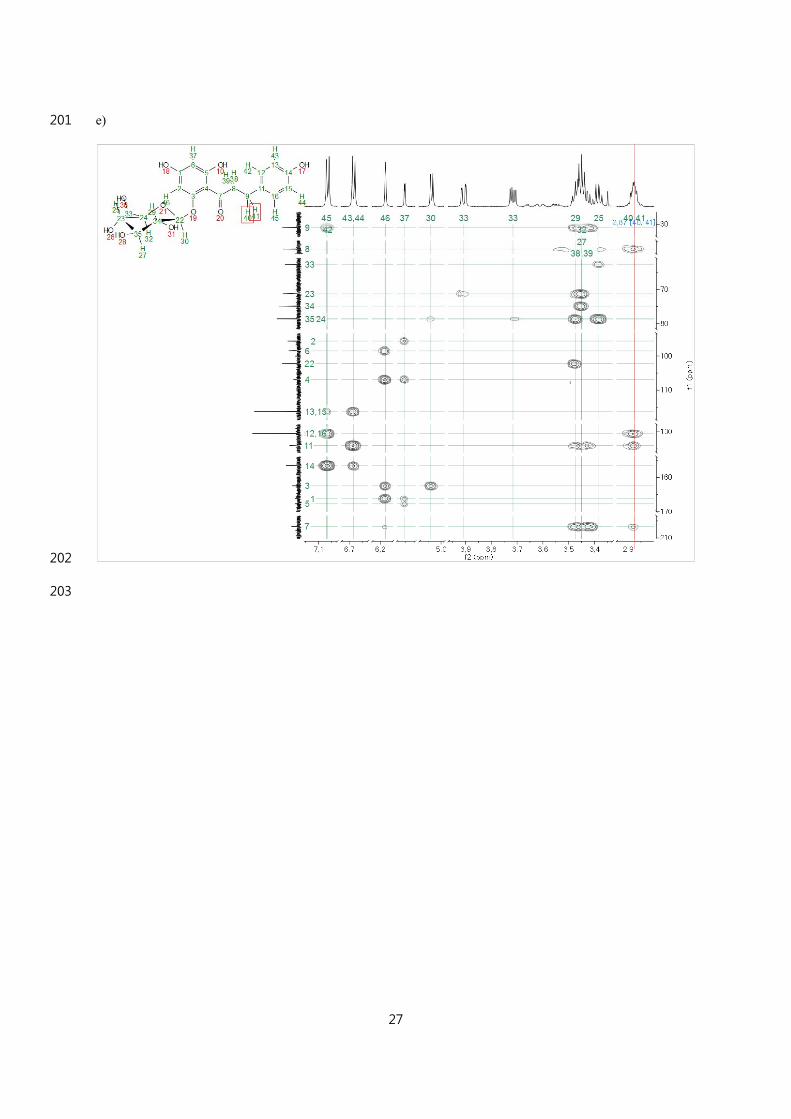
96

9
Supplementary Figure Legends 97
Figure S1. Amino acid sequences alignment of YjiC with other different bacterial 98
glycosyltransferases.The BLAST analysis and sequence alignment study with previously 99
known bacterial glycosyltransferases has different level of amino acid identities and 100
similarities. YjiC has 31%, 33%, and 38% identities with BcGt-3 from Bacillus cereus ATCC 101
14580 (GenBank: AAS41737.1), OleD from Streptomyces antibioticus (UniportKB accession: 102
Q53685), and CalG4 from Micromonospora echinospora (GenBank: AAM70365.1) 103
respectively. The similarities of YjiC were 53%, 52% and 56% respectively with BcGt-3, 104
OleD, and CalG4 respectively. 105
Figure S2. pET28a-YjiC recombinant expression vector harboring yjiC glycosyltransferase 106
gene. The gene yjiC was cloned in BamHI/XhoI site of the expression vector pET28a (+). 107
Figure S3. Expression and purification of the recombinant YjiC protein by Ni-NTA resin. 108
Lane 1: Insoluble protein fraction; Lane 2:Soluble protein fraction; Lane 3:Protein marker; 109
Lane 4: Eluted protein by 100mM imidazole; and Lane 6: Eluted protein by 200mM 110
imidazole. 111
Figure S4. Comparative HPLC chromatogram for the in vitro reactions 1 to 4 (Table S3). 112
Area percentage of each peak is given in the table below the chromatogram. 113
Figure S5.Comparative HPLC chromatogram for the in vitro reactions 5 to 8 (Table S3). 114
Area percentage of each peak is given in the table below the chromatogram. In reaction 8, a 115
novel peak P4 is seen in between P3 and P5. 116
Figure S6. Comparative study of bioconversion of phloretin and production optimization at 117
different substrate concentrations at different time interval with E. coli BL21 118
(DE3)/ΔpgiΔzwfΔushA/pET28-YjiC) Production of different products when 100 µM of 119
phloretin was supplemented. B) Production of different products when 250 µM of phloretin 120

10
was supplemented. 121
Figure S7. Structural elucidation of product P1 as Phloretin-4’-O-glucoside. a) 1H NMR, b) 122
13C NMR, c) 1H-1H COSY, d) HSQC, e) HMBC, and f) ROSEY. 123
Figure S8. Structural elucidation of product P2 as Phloretin-2’-O-glucoside. a) 1H NMR, b) 124
13C NMR, c) 1H-1H COSY, d) HSQC, e) HMBC, and f) ROSEY. 125
Figure S9. Comparing 1H-NMR of all the five phloretin glucosides products (P1, P2, P3, P4, 126
and P5) from buttom to top respectively. P3 and P4 were identified in mixture. 127
Figure S10. 1H-NMR analysis of P3 (Phloretin 4’,4-O-diglucoside) and P4 (Phloretin 6’,4-O-128
diglucoside). 129
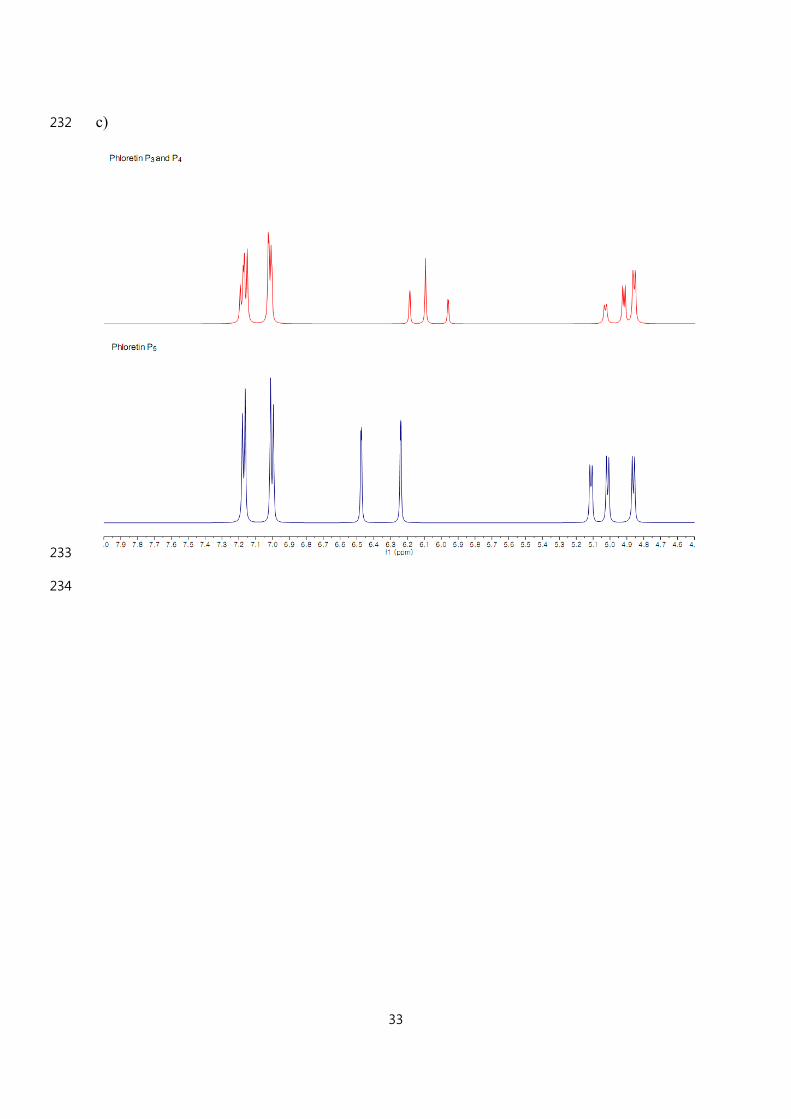
Figure S11. Structural elucidation of compound P5 (Phloretin2’, 4’, 4-O-triglucoside). a) 1H-130
NMR analysis. b) Comparing 1H-NMR of all the three novel phloretin glucosides products 131
(P3, P4, and P5). P3 and P4 were identified in mixture. c) Comparision of aglycone part and d) 132
comparision of glucose part. 133
134

135
136
137
Figure
S1.
11

138
139
140
Figure
S2.
12

141
142
143
Figure
S3.
13

144
145146
Figure
S4.
14

147
148
149
Figure
S5.
15
150
151
152
153
Figure
S6.
16

17
Structural elucidation of phloretin glucosides products 154
Figure S7 155
a) 156
157
1H NMR (800 MHz, Methanol-d4) δ 6.95 – 6.91 (m, 2H), 6.59 (d, J = 8.4 Hz, 2H), 5.99 (d, J 158
= 1.7 Hz, 2H), 4.83 (dd, J = 7.6, 1.6 Hz, 1H), 3.81 (dd, J = 12.2, 2.3 Hz, 1H), 3.62 (dd, J = 159
12.2, 5.5 Hz, 1H), 3.37 (t, J = 9.3 Hz, 1H), 3.36 (t, J = 9.3 Hz, 1H), 3.35 (dd, J = 9.3, 7.5 Hz, 160
1H), 3.30 (t, J = 9.2 Hz, 1H), 3.19 (dd, J = 8.8, 7.0 Hz, 2H), 2.75 (t, J = 7.8 Hz, 2H). 161
162

18
b) 163
164
13C NMR (201 MHz, MeOD) δ 207.13, 165.06, 164.85, 156.51, 133.96, 130.43, 116.23, 165
106.99, 101.21, 96.55, 78.34, 77.99, 74.73, 71.25, 62.49, 47.61, 31.31. 166
167

19
c) 168
169
170

20
d) 171
172
173

21
e) 174
175
176

22
f) 177
178
179

23
Figure S8 180
a) 181
182
1H NMR (800 MHz, Methanol-d4) δ 7.10 – 7.02 (m, 2H), 6.74 – 6.64 (m, 2H), 6.18 (d, J = 183
2.0 Hz, 1H), 5.95 (d, J = 2.2 Hz, 1H), 5.04 (d, J = 7.4 Hz, 1H), 3.91 (dd, J = 12.2, 2.3 Hz, 184
1H), 3.72 (dd, J = 12.2, 5.6 Hz, 1H), 3.47 (dd, J = 9.3, 7.4 Hz, 1H), 3.45 (t, J = 9.3 Hz, 1H), 185
3.49 – 3.42 (m, 2H), 3.47 – 3.43 (m, 1H), 3.38 (t, J = 9.1 Hz, 1H), 2.87 (dtd, J = 11.5, 7.1, 6.7, 186
4.4 Hz, 2H). 187
188

24
b) 189
190
13C NMR (201 MHz, Methanol-d4) δ 206.67 , 167.71 , 166.16 , 162.45 , 156.53 , 134.02 , 191
130.52 , 116.22 , 106.91 , 102.23 , 98.50 , 95.61 , 78.65 , 78.58 , 74.86 , 71.25 , 62.58 , 47.11 , 192
31.00 . 193
194
25
c) 195
196
197

26
d) 198
199
200
27
e) 201
202
203

28
f) 204
205
206

29
Figure S9 207
208
209

30
Structural elucidation of compound P3and P4 210
Figure S10. 211
212
1H-NMR (500 MHz, MeOD): δ 7.16 (dd, J = 12.2,8.3 Hz, 4H), 7.01 (dd, J = 8.6, 2.9 Hz, 4H), 213
6.19 (d, J= 2.0 Hz, 1H), 6.09 (s, 1H), 5.96 (d, J = 2.2 Hz, 1H), 4.98 (dd, J = 54.9, 6.7 Hz, 214
2H), 4.89-4.79 (m, 2H). Other signals in sugar regions are fairly complex because of mixture 215
of two diglucosides which are as follows 4.01-3.80 (m, 4H), 3.70 (ddd, J =11.9,9.2,5.2 Hz, 216
4H), 3.55-3.21 (m, 24 H), 2.92 (q, J=7.8 Hz, 4H). Since the two products (P3 and P4) are 217
diglucosides, their separation by preparative HPLC was quite difficult. Hence we 218
characterized those products by NMR analysis. We apologize to report both compounds in a 219
single chromatogram. 220
221

31
Figure S11. Structural elucidation of compound P5 222
a) 223
224
1H-NMR (500 MHz, MeOD): δ 7.27-7.10 (m, 2H), 7.06-6.91 (m, 2H), 6.47 (d, J = 2.4 Hz, 225
1H), 6.24 (d, J=2.3 Hz, 1H), 5.17-5.07 (m, 1H), 5.01 (d, J = 7.1 Hz, 1H), 4.92-4.79 (m, 1H), 226
Glucose region: δ (4.01- 2.9). 227
228

32
b) 229
230
231
33
c) 232
233
234

34
d) 235
236
237

35
References 238
1. Sambrook, J., E. F. Fritsch, T. Maniatis. 1989. Molecular Cloning: A Laboratory Manual, 239
Vol.5 2nd ed., Cold Spring Harbor Laboratory Press, NewYork. 23 240
241
242