supplementary figure 1: cells in antephase show a … figure 1: cells in antephase show a unique...
TRANSCRIPT
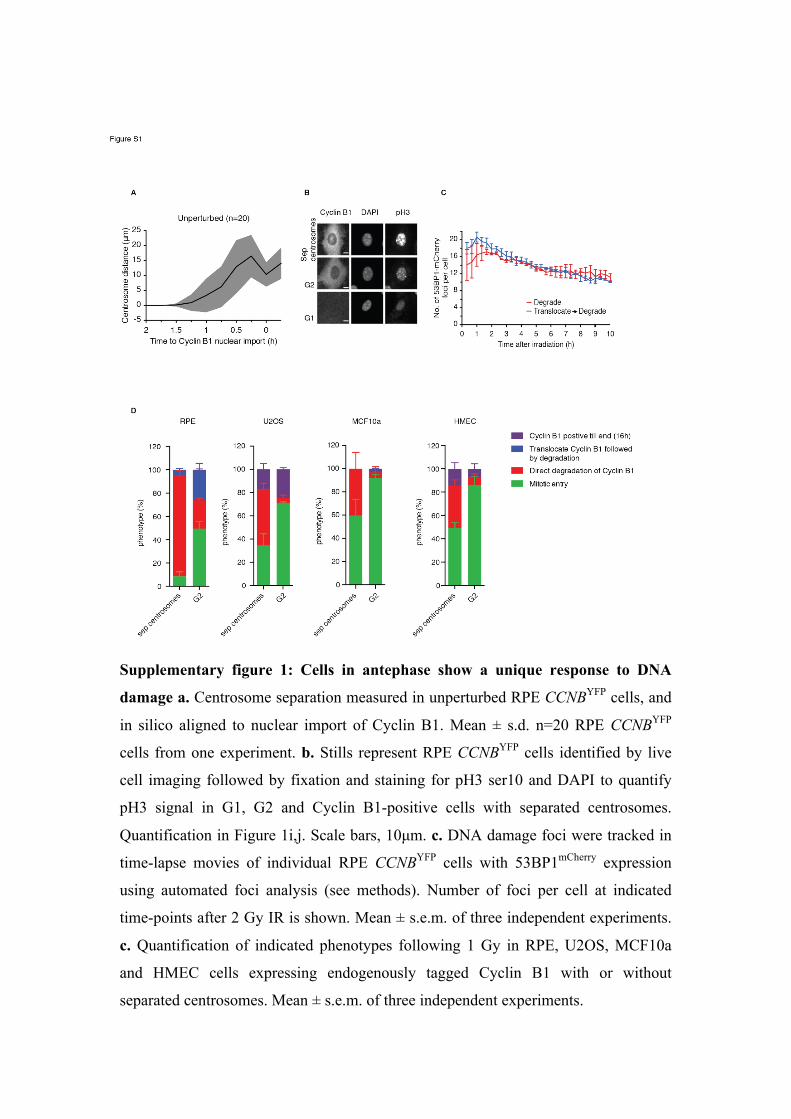
Supplementary figure 1: Cells in antephase show a unique response to DNA
damage a. Centrosome separation measured in unperturbed RPE CCNBYFP cells, and
in silico aligned to nuclear import of Cyclin B1. Mean ± s.d. n=20 RPE CCNBYFP
cells from one experiment. b. Stills represent RPE CCNBYFP cells identified by live
cell imaging followed by fixation and staining for pH3 ser10 and DAPI to quantify
pH3 signal in G1, G2 and Cyclin B1-positive cells with separated centrosomes.
Quantification in Figure 1i,j. Scale bars, 10µm. c. DNA damage foci were tracked in
time-lapse movies of individual RPE CCNBYFP cells with 53BP1mCherry expression
using automated foci analysis (see methods). Number of foci per cell at indicated
time-points after 2 Gy IR is shown. Mean ± s.e.m. of three independent experiments.
c. Quantification of indicated phenotypes following 1 Gy in RPE, U2OS, MCF10a
and HMEC cells expressing endogenously tagged Cyclin B1 with or without
separated centrosomes. Mean ± s.e.m. of three independent experiments.
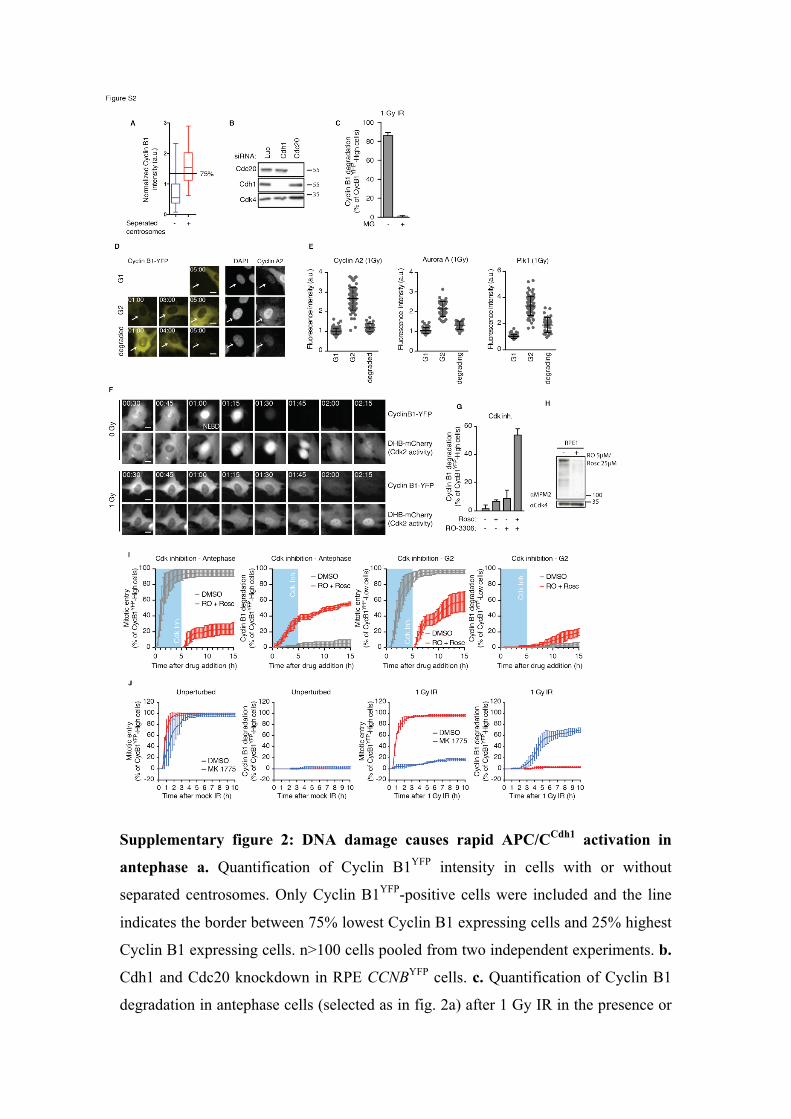
Supplementary figure 2: DNA damage causes rapid APC/CCdh1 activation in
antephase a. Quantification of Cyclin B1YFP intensity in cells with or without
separated centrosomes. Only Cyclin B1YFP-positive cells were included and the line
indicates the border between 75% lowest Cyclin B1 expressing cells and 25% highest
Cyclin B1 expressing cells. n>100 cells pooled from two independent experiments. b.
Cdh1 and Cdc20 knockdown in RPE CCNBYFP cells. c. Quantification of Cyclin B1
degradation in antephase cells (selected as in fig. 2a) after 1 Gy IR in the presence or
absence of proteasome inhibitor MG132. Mean ± s.e.m. of three independent
experiments. d. Representative stills of Cyclin B1 expression in a G1 and G2 cell or
in an antephase cell that degrades Cyclin B1 following 1Gy. Cells were fixed after 5h
and stained for Cyclin A2, Aurora A and Plk1. Scale bars, 10µm. e. Quantification of
fluorescence intensity in G1, G2 and antephase cells that degraded Cyclin B1 selected
based on 5h live cell imaging (Fig 2d). n=22-82 cells per condition, pooled from two
(Plk1) or three (Cyc A and Aur A) independent experiments. Error bars, mean ± s.d. f.
Time-lapse images of RPE CCNBYFP DHBmCherry cells show the higher cytoplasmic
signal before mitosis and the increased nuclear signal after mitosis in unperturbed
growing cells. Relative Cdk2 activity is determined by dividing the mean
Cytoplasmic intensity over the mean nuclear intensity in every frame. Scale bars,
10µm. g. Quantification of Cyclin B1 degradation in antephase cells (selected as in
fig. 2a) after addition of indicated inhibitors. Mean ± s.d. of three independent
experiments. h. Western blot of asynchronous RPE cells following 1h treatment with
RO-3306 5µM and Roscovotin 25µM. i. Line graphs of the data presented in figure 2c
and d showing cumulative mitotic entry or cumulative Cyclin B1 degradation. Mean ±
s.d. of three independent experiments. j. Line graphs of the data presented in figure 2
e and f showing cumulative Cyclin B1 degradation. In addition cumulative mitotic
entry is shown. Mean ± s.d. of three independent experiments.

Supplementary figure 3: Emi1 acts to maintain recovery competence in G2 cells
a. Scheme representing how early S phase cells were obtained by FACS sorting of
double positive RPE Fucci cells (Azami-Green (AG) and Kusabira-Orange (KO)). b.
FACS plots showing the cell cycle profiles at indicated time-points after the early S
phase sort based on PI staining. n≥1000 cells measured per time-point from one
experiment. c. Cumulative mitotic entry of unperturbed RPE Fucci cells sorted in
early S phase and followed by time-lapse imaging after re-plating shows the highly
synchronous progression through S/G2 phase. n=51 cells from one experiment. d,e. A
partial knock down of Emi1 was obtained by titration of siEmi1 in RPE CCNBYFP
cells (Final concentrations siRNA: 10, 5, 2.5, 1.25nM). Mitotic entry of undamaged
G2 cells upon Luc- and Emi1-depletion is shown. Representative graph and western
blot of two independent experiments. f. Line graphs of the data presented in figure 3d
and e showing cumulative mitotic entry or cumulative Cyclin B1 degradation. Mean ±
s.d. of three independent experiments. g. Line graphs of the data presented in figure 3f
showing cumulative mitotic entry or cumulative Cyclin B1 degradation. Mean ± s.d.
of three independent experiments. h. TurqEMI overexpression induced by doxycycline
addition. Representative western blot of two independent experiments.

Supplementary figure 4: Hypersensitivity to DNA damage in antephase is needed
to protect genomic stability a. Line graph of the data presented in figure 4d. Mean ±
s.d. of three independent experiments. b. Mitotic entry of antephase cells (selected as
in fig. 2a) within 15h following 1 Gy. The APC/C inhibitor proTAME was added just
after IR. Mean ± s.e.m. of three independent experiments is shown. c. Quantification
of mitotic cells with broken chromosomes as in figure 4g. Caffeine was added 30 min
before IR to override DNA damage checkpoint signalling. Average of two
independent experiments is shown. d. Stills showing nucleolar localized γH2AX,
indicating rDNA damage upon I-PpoI induction. Scale bars, 10µm.
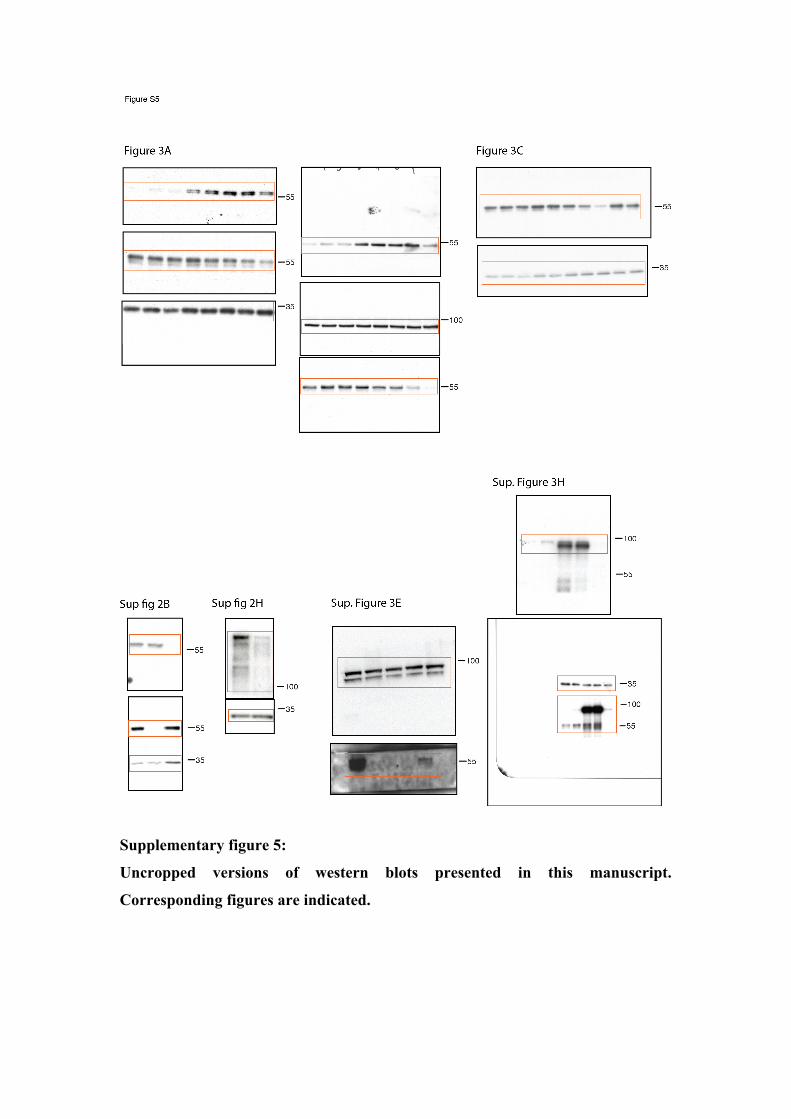
Supplementary figure 5:
Uncropped versions of western blots presented in this manuscript.
Corresponding figures are indicated.
Supplementary methods
Spontaneous recovery analysis by FACS
Cells depleted for Emi1 using decreasing concentrations of siRNA (Final
concentrations siRNA: 10, 5, 2.5, 1.25nM) were washed 24h after siRNA transfection
with 1xPBS and cultured for 16h in medium containing BrdU (10µM) and nocodazole
(250ng/ml). Cells were harvested and fixed in 70% ethanol (4˚C) for a minimum of 2
hours. In order to denature the DNA for BrdU staining, cells were incubated with 2M
HCl for 15 minutes. Subsequently, the pH was neutralized with 0.1M Borate buffer
(pH=8.5). Cells were stained with the primary antibodies: anti-BrdU and anti-pH3
(see methods) and corresponding secondary antibodies. Cells were treated with
RNAse A (Sigma), and DNA was stained with Propidium Iodide. Cells were analysed
using flow cytometry of 103 events (Cell Quest, Becton Dickinson).