supplementary figure 1. nmf analysis of core clinical microarray … · 2011-04-11 ·...
TRANSCRIPT

Supplementary Figure 1. NMF analysis of core clinical microarray datasets after selecting for genes with SD > 0.8
b: NMF, UCSF Tumor Samples
a: NMF, Badea et al., Tumor Samples
0% 100%
1a. NMF analysis of Badea et al. microarray dataset after selecting for genes with SD greater than 0.8. Maximum cophenetic coefficient occurred for k = 2 to 4 clusters. Consensus matrix (right panel) for k = 2 to 4 are shown. 1b. NMF analysis of the UCSF PDA microarray dataset after selecting for genes with SD greater than 0.8. Maximum cophenetic coefficient occurred for k = 2 to 4 clusters. Consensus matrix (right panel) for k = 2 to 4 are shown.
Nature Medicine doi:10.1038/nm.2344

Supplementary Figure 2. NMF analysis of merged microarray datasets
a: NMF, Merged UCSF and Badea et al., Tumor Samples
0% 100%
2a. NMF analysis of DWD merged UCSF and Badea et al. (i.e. core clinical) PDA microarray datasets using common probes with SD greater than 0.8. Maximum cophenetic coefficient occurred for k = 2 to 3 clusters. Consensus matrix (right panel) for k = 2 and 3 are shown.
Nature Medicine doi:10.1038/nm.2344

Supplementary Figure 2
0% 100%
b: NMF, Merged Core Tumor Samples and Human Cell Line Microarray Dataset
c: NMF, Merged Core Tumor Samples and Mouse Cell Line Microarray Dataset
2b. NMF analysis of DWD merged core clinical PDA datasets with human PDA cell line microarray dataset using PDAssigner genes. Maximum cophenetic coefficient occurred for k = 2 to 4 clusters. Consensus matrix (right panel) for k = 2 and 3 are shown. 2c. NMF analysis of DWD merged core clinical PDA dataset with mouse PDA cell line microarray dataset using PDAssigner genes. Maximum cophenetic coefficient occurred for k = 2 to 3 clusters. Consensus matrix (right panel) for k = 2 and 3 are shown.
Nature Medicine doi:10.1038/nm.2344

Supplementary Figure 2
d: PDAssigner Genes from Human Cell lines e: PDAssigner Genes from Mouse Cell lines
Classical QM-PDA
-‐3 0 +3 -‐3 0 +3
2d. Hierarchical clustering of human PDA cell lines with PDAssigner genes. The clusters show classical and QM-PDA subtypes. 2e. Hierarchical clustering of mouse PDA cell lines with PDAssigner genes. The clusters show classical and QM-PDA subtypes.
Nature Medicine doi:10.1038/nm.2344

a b
c d
Supplementary Figure 3. Immunohistochemistry detection of exocrine-like markers in PDA subtypes
Immunohistochemistry of exocrine-like markers. Representative sections of PDAssigner-subtyped UCSF PDA tumors were stained with antibodies against either ELA3A (a,b) or CFTR (3c,d). Non-exocrine-like samples (panels 3a,c) expressed relatively lower levels of these markers than exocrine-like samples (panels 3b,d), in agreement with gene expression profiling.
ELA
3A
CFT
R
Non-Exocrine-like Exocrine-like
Nature Medicine doi:10.1038/nm.2344

Supplementary Figure 4. PDA subtypes in additional microarray datasets
0% 100%
a: NMF, Merged Core Tumor Samples and Balaragunathan et al., PDA dataset
-‐3 0 +3
b: Merged Core Tumor Samples and Balaragunathan et al., PDA dataset
Classical QM-PDA Exocrine-like
UCSF Badea et al.
Balaragunathan et al.
Confirmation of PDA Subtypes using on a unique microarray platform. a. NMF consensus matrix and cophenetic plot for k = 2 and 3 and b. Heatmap showing three subtypes of PDA in DWD-merged core clinical and Balaragunathan et al. (GSE11838) PDA microarray datasets using the PDAssigner geneset. Balaragunathan et al. is a whole tumor Agilent Human 1A oligonucleotide microarray dataset. Samples from each dataset are found across all of the subtypes. The side bar denotes subtype specific genes in the PDAssigner, with dark blue labeling exocrine-like genes, black labeling QM-PDA genes and gray labeling classical subtype genes.
Nature Medicine doi:10.1038/nm.2344

d: Merged Core Tumor Samples and Pei et al., PDA dataset
c: NMF, Merged Core Tumor Samples and Pei et al., PDA dataset
0% 100%
Supplementary Figure 4
Classical QM-PDA Exocrine-like
UCSF Badea et al. Pei et al.
Confirmation of PDA Subtypes using an independent dataset. c. NMF consensus matrix and cophenetic plot for k = 2 and 3 and d. heatmap showing three subtypes of PDA in a DWD-merged core clinical and Pei et al., (GSE16515) PDA microarray dataset using the PDAssigner geneset. Pei et al., is a whole tumor Affymetrix Human U133plus2 microarray dataset. Samples from each dataset are found across all of the subtypes. The side bar denotes subtype specific genes in the PDAssigner, with dark blue labeling exocrine-like genes, black labeling QM-PDA genes and gray labeling classical subtype genes.
-‐3 0 +3
Nature Medicine doi:10.1038/nm.2344

f: Merged Core Tumor Samples and Grützmann et al., PDA dataset e: NMF, Merged Core Tumor Samples and
Grützmann et al., PDA dataset
Supplementary Figure 4
Classical QM-PDA Exocrine-like
UCSF Badea, et al. Grützmann, et al.
0% 100%
Confirmation of PDA Subtypes using an unique microdissected samples. e. NMF consensus matrix and cophenetic plot for k = 2 and 3 and f. heatmap showing three subtypes of PDA in a DWD-merged core clinical and Grützmann et al., (E-MEXP-950) PDA microarray dataset using the PDAssigner geneset. Grützmann et al., is a microdissected Affymetrix Human U133A microarray dataset. Samples from each dataset are found across all of the subtypes. The side bar denotes subtype specific genes in the PDAssigner, with dark blue labeling exocrine-like genes, black labeling QM-PDA genes and gray labeling classical subtype genes.
-‐3 0 +3
Nature Medicine doi:10.1038/nm.2344

Supplementary Figure 4
g: PDAssigner Genes from Balaragunathan et al., PDA dataset h: PDAssigner Genes from Pei et al., PDA dataset
-‐3 0 +3 -‐3 0 +3
Classical
QM-‐PDA
Exocrine-‐like
Hierarchical clustering of g. Balaragunathan et al., and h. Pei et al., human PDA (public datasets) using PDAssigner genes. The clusters show classical, QM-PDA and exocrine-like subtypes.
Nature Medicine doi:10.1038/nm.2344

Classical
QM-‐PDA
Exocrine-‐like
Supplementary Figure 4
i: PDAssigner Genes from Grützmann, et al. PDA dataset
i. Hierarchical clustering of Grützmann, et al., human PDA (public dataset) using PDAssigner genes. The clusters show classical, QM-PDA and exocrine-like subtypes.
-‐3 0 +3
Nature Medicine doi:10.1038/nm.2344

p = 0.005 p = 0.013
p = 0.006
Med
ian
cent
ered
log 2
GAT
A6
expr
essi
on
Supplementary Figure 5. GATA6 mRNA expression by subtype in:
b: UCSF Tumors a: Badea et al., Tumors
c: Human Cell Lines
Classical QM-PDA Exocrine-like
Classical QM-PDA
Med
ian
cent
ered
log 2
GAT
A6
expr
essi
on
Med
ian
cent
ered
log 2
GAT
A6
expr
essi
on
Classical QM-PDA Exocrine-like
Association of GATA6 mRNA levels with subtypes in patient pancreatic tumors and cell lines. There was significantly higher expression of GATA6 in the classical subtype compared to QM-PDA and/or exocrine-like subtypes in: a. Badea et al clinical PDA samples, b. UCSF PDA clinical samples, and c. human cell lines. The p-values were estimated using a Kruskal-Wallis Test.
Nature Medicine doi:10.1038/nm.2344

Supplementary Figure 5. GATA6 Signature projected on:
e: Badea et al., Tumors
f: Human Cell Lines Classical
QM-‐PDA
Exocrine-‐like
A: UCSF Tumors
-‐3 0 +3
-‐3 0 +3
d: UCSF Tumors
PosiMve GATA6 signature FDR < 0.2
NegaMve GATA6 signature FDR < 0.2
Unknown, FDR > 0.2
-‐3 0 +3
Association of GATA6 gene signature with PDA subtypes. The GATA6 gene expression signature (Kwei et al.) distinguishes samples with high or low GATA6 expression and was used for clustering the: d. UCSF clinical PDA samples, e. Badea et al. clinical PDA samples and f. human PDA cell lines. The samples significantly (FDR < 0.2) enriched for upregulated genes from Kwei et al. [as predicted by the NearestTemplatePrediction (NTP) algorithm] are denoted with a green top bar and those significantly enriched for downregulated genes with a blue top bar. Samples not enriched for either with a FDR > 0.2 are denoted with a grey bar. The PDA subtype sample assignments are shown in one of the top bars. Most of the genes overexpressed in GATA6 overexpressing cells (per Kwei et al.) were highly expressed in the classical subtype relative to the QM-PDA subtype.
Nature Medicine doi:10.1038/nm.2344

p = 0.03 p = 0.2 M
edia
n ce
nter
ed lo
g2 K
RA
S ex
pres
sion
Med
ian
cent
ered
log2
KR
AS
expr
essi
on
Supplementary Figure 6: KRAS mRNA expression by subtype in:
b: UCSF Tumors a: Badea et al, Tumors
Classical QM-PDA Exocrine-like Classical QM-PDA Exocrine-like
Association of KRAS mRNA levels with PDA subtype. Classical subtype expresses relatively higher levels of KRAS than the QM-PDA or exocrine-like subtypes. a. Badea et al clinical PDA samples and b. UCSF PDA clinical samples. p-values estimated by Kruskal Wallis Test.
Nature Medicine doi:10.1038/nm.2344
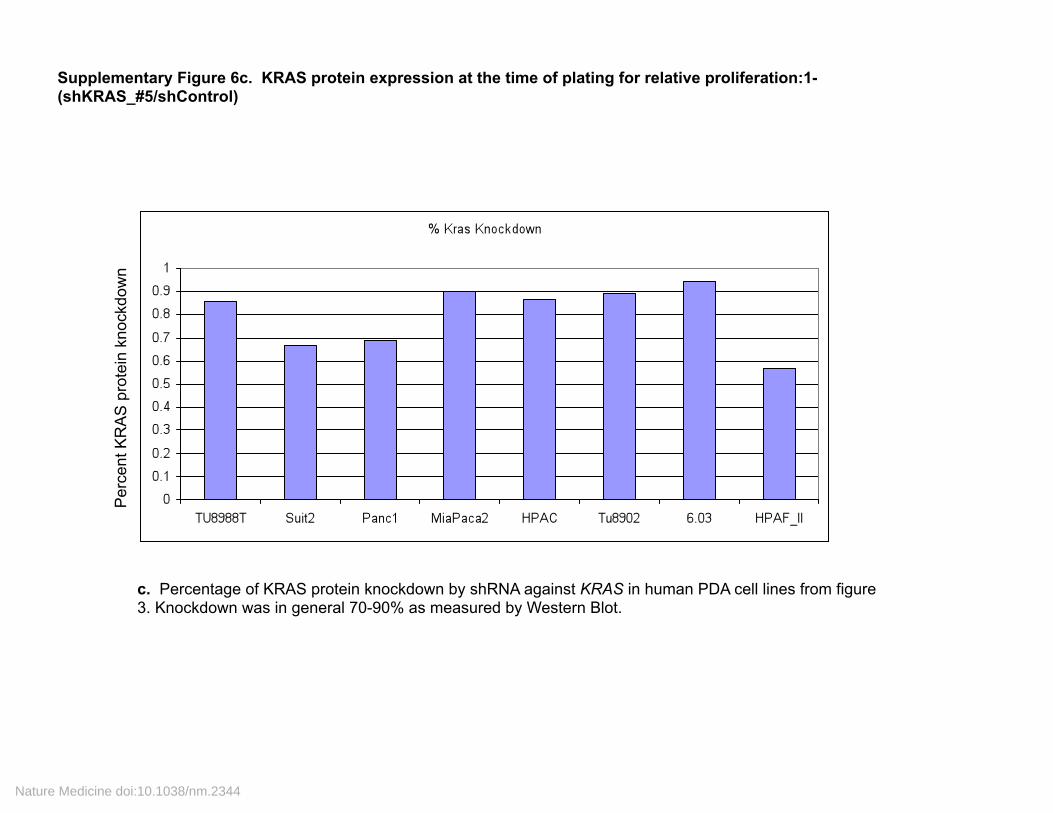
Supplementary Figure 6c. KRAS protein expression at the time of plating for relative proliferation:1-(shKRAS_#5/shControl)
c. Percentage of KRAS protein knockdown by shRNA against KRAS in human PDA cell lines from figure 3. Knockdown was in general 70-90% as measured by Western Blot.
Per
cent
KR
AS
pro
tein
kno
ckdo
wn
Nature Medicine doi:10.1038/nm.2344

-‐3 0 +3 -‐3 0 +3
-‐3 0 +3
b: Badea et al. Tumors a: UCSF Tumors
c: Human Cell Lines
Classical QM-PDA Exocrine-like
Supplementary Figure 7. KRAS dependency signature projected on:
KRAS dependent FDR < 0.2
KRAS independent FDR < 0.2
Unknown, FDR > 0.2
A signature of KRAS addiction is enriched in the classical PDA subtype. Gene signature from Singh et al. projected on a: UCSF PDA tumors, b: Badea et al. tumors and c: Human PDA cell lines. The NTP algorithm was used to predict the Singh et al. defined KRAS-dependence of each sample with FDR < 0.2. The samples enriched for upregulated genes from KRAS dependency signature are KRAS dependent (green top bar) and those enriched for downregulated genes are KRAS independent (blue top bar). Whereas those that are not enriched for up or downregulated genes with FDR > 0.2 are called as unknown (grey top bar). The PDA subtype assignments of the samples are shown in one of the top bars.
Nature Medicine doi:10.1038/nm.2344

Supplementary Information for: Subtypes of Pancreatic Ductal Adenocarcinoma
and Their Differing Responses to Therapy.
Authors: Eric A. Collisson1,2,*, Anguraj Sadanandam1,7,*, Peter Olson3,8, William J.
Gibb1,9, Morgan Truitt3, Shenda Gu1, Janine Cooc6, Jennifer Weinkle1, Grace E. Kim4,
Lakshmi Jakkula1, Heidi S. Feiler1, Andrew H. Ko2, Adam B. Olshen5, Kathleen L.
Danenberg6, Margaret A. Tempero2, Paul T. Spellman1, Douglas Hanahan3,7, Joe W.
Gray1,10,
Affiliations:
Life Sciences Division, Lawrence Berkeley National Laboratory, Berkeley, CA 94720, USA1
Division of Hematology and Oncology2, Diabetes Center, and Department of Biochemistry and Biophysics3, and Department of Pathology4, Department of Epidemiology and Biostatistics and Helen Diller Family Comprehensive Cancer Center5, University of California, San Francisco, CA 94143, USA
Response Genetics Inc., Los Angeles, CA 90033, USA6 Swiss Institute for Experimental Cancer Research (ISREC), Swiss Federal Institute of Technology Lausanne (EPFL), Lausanne CH-1015, Switzerland7
Current Address: Pfizer, 10724 Science Center Drive, La Jolla, CA 921218 Current Address: Genomic Health, 301 Penobscot Drive, Redwood City, CA 940639
Biomedical Engineering, Oregon Health and Science University10
*Equal Contributors
¶ Corresponding Author: Biomedical Engineering, 3303 SW Bond Ave., CH13B, Portland, OR 97239 Tel: 503-494-6500, Fax: 503-418-9311 [email protected]
Nature Medicine doi:10.1038/nm.2344

Supplementary Methods:
Tissue Processing: After University of California, San Francisco institutional review board approval, we selected archival FFPE specimens from patients who underwent resection of the pancreas for PDA between 1993 and 2006 at UCSF. G.E.K (a gastrointestinal pathologist) selected a representative FFPE block after examination of hematoxylin and eosin-stained slides. We then stained several 10 µm thick sections with nuclear fast red to enable visualization of histology for macro dissection or LCM1 (P.A.L.M. Microlaser Technologies AG, Munich, Germany).
Immunohistochemistry: We processed 6 µm tissue sections for antigen retrieval using Citra Plus Solution (BioGenex). ELA3A antibody (Abcam ab56564) was used at 1:200 in 1% BSA. CFTR antibody (Abcam ab2784) was used at 1:500 in Dako Protein Block (Dako).
NearestTemplatePrediction Algorithm. We used the NearestTemplatePrediction (NTP) algorithm2 using R code from GenePattern3 to predict the class of a given sample with statistical significance (false discovery rate, FDR<0.2) using a predefined set of markers that are specific to multiple (i.e. two or more) classes.
Cell Lines. Dr. L. Chin (Dana Farber Cancer Institute) provided 3.27, TU8988S, TU8988T, Tu8902, DanG, HupT3. Dr. S. Batra (Univ. Nebraska) provided Suit2. Dr. M. McMahon (UC San Francisco) provided HPAC, Capan2, HPAF II, 6.03, CFPac1, MPanc96, 2.13, Panc1, MiaPaca2, 10.05, and Colo357. Dr. A. Singh (Massachusetts General Hospital) provided SW1990. All mouse PDA cell lines were derived in the laboratory of D.H. in compliance with University of California Institutional Animal Care and Use Committee (IACUC) guidelines. We backcrossed the KrasLSL_G12D lox-stop-lox G12D, p48cre, Ink4a-Arfflox and Tp53flox alleles 10 generations into FVB/n and then intercrossed progeny to generate p48cre, KrasLSL_G12D, Tp53flox/wt or p48cre, KrasLSL_G12D, Ink4a/Arfflox/flox mice. We sacrificed tumor-bearing mice, and then excised and processed tumors to single cells, which we then plated in serial dilutions on collagen coated plates such that single cell clones could easily be identified and picked after 1-2 weeks. We maintained all cell lines in DMEM with 10% FBS in 5% CO2 on plastic.
Gene Expression Microarrays. After tissue dissection and processing RNA from tumor tissues was extracted from formalin fixed, paraffin embedded dissected tissues and processed using a proprietary phenol-chloroform technique (Response Genetics, Los Angeles, CA: United States Patent Number 6,248,535) (Los Angeles)4. Human cell line mRNA was extracted from exponentially growing cultures using RNAeasy columns (Qiagen). After two rounds of RNA amplification, cRNA from PDA tissue samples and human PDA cell lines was synthesized and hybridized to Affymetrix Human GeneChip® U133Plus2.0. Mouse PDA cell lines were profiled on Affymetrix Mouse GeneChip® 430A. All array data is available at National Center for Biological Information (NCBI) Gene Expression Omnibus (GEO) omnibus GSE17891.
Processing of Microarrays. We processed and robust multiarray analysis (RMA) normalized CEL files from Affymetrix GeneChip® arrays for all samples including a published datasets with GEO Omnibus accession IDs - GSE154715, GSE165156 and Array Express IDs – E-MEXP-9507 using the affy package from the R-based Bioconductor8 Project. We obtained the processed Agilent array data for PDA samples
Nature Medicine doi:10.1038/nm.2344

from GEO Omnibus (GSE11838)9 using Bioconductor package GEOquery. We preprocessed the UCSF PDA dataset using the R program COMBAT10 and assessed the quality of microarrays using normalized unscaled standard error (NUSE)11. We removed arrays with a NUSE score of > 1+0.25 or < 1–0.25.
Supplemental Statistical Analyses:
Quantification of NMF Model Fitting. Results from NMF (and other consensus clustering methods) vary slightly based on initial conditions. We quantified the amount by which NMF results change for the different model fits by estimating the coefficient of variation for each metagene across all 20 initial conditions in the core PDA dataset. The coefficient of variation of a variable (x) was defined as standard_deviation(x)/mean(x). We used the usual unbiased estimators to compute the standard deviation and the mean of metagene expression (for each sample and each metagene) across the 20 initial conditions. The coefficient of variation is an indicator of consistency except when mean(x) is extremely small. To circumvent the small-mean-value problem, we computed, for each metagene, the coefficient of variation as a least-squares estimate of the slope of mean(x) vs. standard deviation(x) across all of the samples, yielding one coefficient of variation for each metagene. Since our data provided compelling evidence in support of k = 3 clusters for the merged core clinical datasets, the three pertinent coefficients of variation are: 0.047, 0.038 and 0.058 (i.e. one for each of the 3 metagenes). Hence, the results from different initial conditions (or model fits) are within roughly 6% across all 3 metagenes.
Clinical/histopathologic Correlations: We performed several statistical analyses to examine the relationship(s) between clinical/histopathologic variables and subtype membership. While subtype was known for the outside datasets GSE118389 and GSE154715, clinical/histopathologic variables were not, so our correlations were limited to those samples for which we had clinical/histopathologic variables (i.e. UCSF samples). We studied the relationships among the PDA molecular subtypes, stage, grade, and overall survival. For every comparison, a corresponding p-value less than 0.05 was considered significant, while a p-value between 0.05 and 0.1 was considered marginally significant. Because of the small sample size we made binary variables out of stage and grade. For stage, our variable was IIB vs. IA, IB, or IIA and for grade it was G3 vs. G1 or G2. By Fisher’s exact test, stage and grade were not significantly related to each other (p>0.99). Stage was not significantly associated with subtype (p=0.40), while grade was significantly associated with subtype (p=0.041), Supplemental Table 3.
Without adjusting for any other factors, PDA subtype was significantly associated with overall survival (p=0.038). Tumor stage was only marginally associated with overall survival (p=0.055), while grade was not associated with overall survival (p=0.10). In a Cox proportional hazards model that included stage, PDA subtype was an independent predictor of overall survival (p=0.024), Supplemental Table 3. This finding indicates that PDA subtype contributes information on survival beyond advanced stage. Larger sample size is necessary to make definitive comments about the relative contributions of stage, grade, and subtype to post-resection prognosis in PDA.
Additional information supporting Supplemental Figures 1 and 2.
Subtypes of PDA based on Differential Gene Expression. Non-negative matrix factorization (NMF)12 was computed 20 times for each rank k=2,…5, where k was a
Nature Medicine doi:10.1038/nm.2344
presumed number of subtypes in the gene expression data set. For each k, the 20 matrix factorizations were used to classify each sample 20 times. With samples appearing along both the horizontal and vertical axes of the consensus matrix (right panel for k=3), one can visualize how consistently sample-pairs cluster together – spanning a range from 0% (never clustering together in blue) to 100% (always clustering together in red). A crisp boundary between red and blue implies stable, robust clustering for all samples. The cophenetic coefficient provides a scalar summary of global clustering robustness across the consensus matrix, 0 being least robust, 1 being most robust. The maximum peak of the cophenetic coefficient plot determines (from the standpoint of robustness) the optimal number of subtypes in a given dataset.
Supplementary Table 1. Variable genes with standard deviation (SD > 0.8) were derived from a. UCSF and b. Badea et al. PDA microarray datasets. GATA6 and KRAS are among the variable genes from UCSF tumors. c. and d. Metagenes were derived by weighing the discriminatory power of each gene for each subtype as part of the NMF algorithm. The coefficients were the average of 20 iterations from the NMF algorithm. Genes common between UCSF and Badea et al.,5 PDA datasets and their metagenes and subtypes are provided in different worksheets.
Supplementary Table 2. Subtypes as identified by NMF analysis for UCSF tumors, Badea et al.5, human and mouse PDA cell lines and other published PDA datasets.
Supplementary Table 3. DWD merged UCSF and Badea et al., PDA microarray data matrix containing 62 PDA assigner genes.
Supplementary Table 4. Clinical data with patient characteristics and statistical associations of PDA subtype with clinical outcome.
Supplementary Table 5. DWD merged core clinical PDA tumors and human PDA cell lines microarray data matrix containing 62 PDA assigner genes.
Supplementary Table 6. DWD merged core clinical tumors and mouse PDA cell lines microarray data matrix containing 62 PDA assigner genes.
References
1. Makino, H., Uetake, H., Danenberg, K., Danenberg, P.V. & Sugihara, K. Efficacy of laser capture microdissection plus RT-PCR technique in analyzing gene expression levels in human gastric cancer and colon cancer. BMC Cancer 8, 210 (2008). 2. Hoshida, Y., et al. Gene expression in fixed tissues and outcome in hepatocellular carcinoma. N Engl J Med 359, 1995-2004 (2008). 3. Reich, M., et al. GenePattern 2.0. Nat Genet 38, 500-501 (2006). 4. Mori, R., Wang, Q., Danenberg, K.D., Pinski, J.K. & Danenberg, P.V. Both beta-actin and GAPDH are useful reference genes for normalization of quantitative RT-PCR in human FFPE tissue samples of prostate cancer. Prostate 68, 1555-1560 (2008). 5. Badea, L., Herlea, V., Dima, S.O., Dumitrascu, T. & Popescu, I. Combined gene expression analysis of whole-tissue and microdissected pancreatic ductal adenocarcinoma identifies genes specifically overexpressed in tumor epithelia. Hepatogastroenterology 55, 2016-2027 (2008).
Nature Medicine doi:10.1038/nm.2344

6. Pei, H., et al. FKBP51 affects cancer cell response to chemotherapy by negatively regulating Akt. Cancer Cell 16, 259-266 (2009). 7. Grutzmann, R., et al. Gene expression profiling of microdissected pancreatic ductal carcinomas using high-density DNA microarrays. Neoplasia 6, 611-622 (2004). 8. Gentleman, R.C., et al. Bioconductor: open software development for computational biology and bioinformatics. Genome Biol 5, R80 (2004). 9. Balagurunathan, Y., et al. Gene expression profiling-based identification of cell-surface targets for developing multimeric ligands in pancreatic cancer. Mol Cancer Ther 7, 3071-3080 (2008). 10. Johnson, W.E., Li, C. & Rabinovic, A. Adjusting batch effects in microarray expression data using empirical Bayes methods. Biostatistics 8, 118-127 (2007). 11. Bolstad, B.M., et al. Quality control of Affymetrix GeneChip data in Bioinformatics and Computational Biology Solutions using R and Bioconductor (eds. Gentleman, R., Carey, V., Dudoit, S., Irizarry, R. & Huber, W.) (Springer, New York, 2005).
12. Brunet, J.P., Tamayo, P., Golub, T.R. & Mesirov, J.P. Metagenes and molecular pattern discovery using matrix factorization. Proc Natl Acad Sci U S A 101, 4164-4169 (2004).
Nature Medicine doi:10.1038/nm.2344