supplementary information10.1186... · web viewafter data filtering, the analysis resulted in the...
TRANSCRIPT

Broek, JAC │1
APPENDIX: SYNAPTIC VESICLE DYNAMIC CHANGES IN A MODEL
OF FRAGILE X
SUPPLEMENTARY INFORMATION
LABEL-FREE LC-MSE PROFILING
Label-free LC-MSE profiling was performed for the indication of protein level
differences in brain tissue and synaptosomal fraction of a Fmr1 KO mouse model. In
the experiment, all reagents were obtained from Sigma-Aldrich (Poole, UK) unless
specified otherwise, and sample preparation and LC-MSE analysis were performed
as previously described [1, 2]. Protein extraction was performed by addition of
fractionation buffer (7M urea, 2M thiourea, 4% 3-[(3-
cholamidopropyl)dimethylammonio]-1-propanesulfonate, 2% ASB14 and 70 mM
dithiotreitol (DTT)), followed by sonication for 10 seconds using a Branson Sonifier
150 (Thistle Scientific; Glasgow, UK) and vortexing for 30 minutes at 4°C. The
homogenates were centrifuged for 3 minutes at 17,000g and the supernatants
collected for precipitation of the proteins using 4:1 volumes ice-cold acetone. The
resulting pellets were suspended in 100 μL of 50 mM NH4HCO3 (pH 8.0). Disulfide
groups on proteins were reduced into sulfhydryl groups in the expense of S-S
bridges by incubation with 100 mM DTT for 30 minutes at 60°C and alkylated with
200mM iodacetamide for 30 minutes at 37°C. Quality control (QC) samples were
created by pooling all samples for use, and sample preparation of all samples and

Broek, JAC │2
QCs proceeded with tryptic digestion of the proteins. Proteins were cleaved into
peptides by incubation with 1:50 (trypsin:protein) porcine trypsin (Promega; Madison,
WI, USA) for 17 hours at 37°C and stopped after 16 hours by addition of 0.80μL of
8.8M HCl. Samples were stored at -80°C. Prior to mass spectrometry analyses,
0.1% formic acid was added to a final concentration of 0.12 μg/μL protein.
Peptides were separated by reversed-phase ultra performance-liquid-
chromatography (UPLC), which was accomplished using the splitless Waters’
nanoACQUITY UPLC system (10kpsi). For chromatography, all solvents were mass
spectrometry grade (Fisher Scientific) and C-18 columns were used during the
experiment. The nanoUPLC system was coupled to a MS system through a nano
electron spray ionization (ESI) online emitter (7 cm length, 10μm tip; NewObjective;
Woburn, MA), which causes the ionization of peptides before they can be analysed
by a Q-TOF PremierTM MS (Waters). The Q-TOF MS was operated in positive ion
nanoES V mode with alternate scanning data independent acquisition (MSE) at a
mass resolution of 10,000. During the LC-MSE process, LockSpray was used with
reference compound Glu-fibrinopeptide B (Sigma) to correct for any drift in mass
calibration.
LC-MSE data was processed using the ProteinLynx Global Server v.2.5
(Waters Corporation) and Rosetta Elucidator v.3.3 (Rosetta Biosoftware, Seattle,
WA) for time and mass/charge alignment of mass spectrometer data as described
previously [3]. The Mus musculus complete proteome fasta sequence Integr8
database was used for the assignment of protein identities. Quantitative peptide
measurements for each replicate were normalized against the total ion volume of all
deconvoluted spectra. The criteria for protein identification were set to ≥ 3 fragment
ions per peptide, and ≥ 7 fragment ions per protein and ≥ 2 peptides per protein. The

Broek, JAC │3
data were also searched against a randomised decoy database, which was created
using the original database, thus conserving amino acid frequencies. Only peptides
that were present in all samples of each treatment group were considered for further
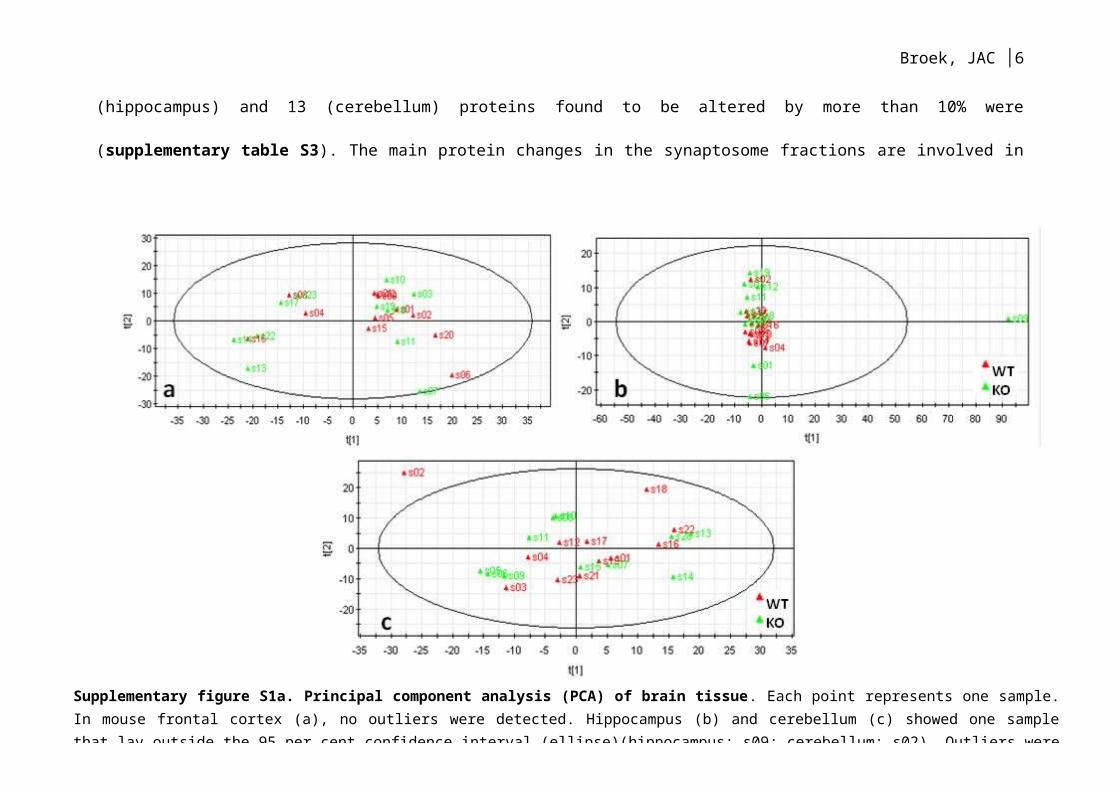
analysis. The final part of the data processing was a principal component analysis
(PCA; SIMCA P+ version 2.12; Umetrics; Malmö, Sweden), which was used to
identify unwanted variability due to sample non-homogeneity or inconsistent
manipulation during the preparation and analytical stages (supplementary figure
S1a and S1b). Testing for outlying samples resulted in removal of one sample from
both the mouse brain hippocampus and cerebellum, and one sample from the
synaptosome hippocampus.
After data filtering, the analysis resulted in the identification of 553 (frontal
cortex), 705 (hippocampus) and 536 (cerebellum) proteins in mouse brain tissue,
and 1114 (hippocampus) and 1040 (cerebellum) proteins in mouse synaptosome
fractions. In brain tissue, following data quality assessment with FC>10%, 24
proteins were significantly different in the frontal cortex, 14 in the hippocampus, and
11 in the cerebellum (supplementary table S1). These significant findings of the
brain tissue were predominantly proteins located at the synapse, such as ATPases
and proteins important for neurotransmitter signalling (supplementary table S2).
Further protein changes were associated with metabolism and cell connectivity. Due
to the initial results in the brain tissue profiling study, a synaptosome fraction study
was performed to investigate proteomic profiles using both LC-MSE and SRM. In this
supplementary part, only the LC-MSE study of the synaptosome fractions are shown,
as the SRM study is discussed in the paper. In the synaptosome fraction study, the
hippocampus and cerebellum were prioritized as these are affected in FXS. The
same LC-MSE procedure for the synaptosome fractions resulted in 23

Broek, JAC │4
(hippocampus) and 13 (cerebellum) proteins found to be altered by more than 10% were (supplementary table S3). The main
protein changes in the synaptosome fractions are involved in synaptic signalling, neurotransmission, synaptic vesicles and neuron
development (supplementary table S4).
Supplementary figure S1a. Principal component analysis (PCA) of brain tissue. Each point represents one sample. In mouse frontal cortex (a), no outliers were detected. Hippocampus (b) and cerebellum (c) showed one sample that lay outside the 95 per cent confidence interval (ellipse)(hippocampus: s09; cerebellum: s02). Outliers were excluded from further analysis.

Broek, JAC │5
Supplementary figure S1b. Principal component analysis (PCA) of synaptosome fractions. Each point represents one sample. In the mouse synaptosomes, one outlier was detected in the hippocampus (d) (s33) and none in the cerebellum (e). Outliers were excluded from further analysis.
Broek, JAC │6
Supplementary table S1. Analysis of protein levels in mouse brain tissue of Fmr1 KO and WT
Protein nameNo. of
peptides
ratio Fmr1
KO/WTp-value
biological function
Frontal cortex
Creatine kinase B (KCRB) 31 0.90 0.0012 creatine kinase
Sarcoplasmic endoplasmic reticulum calcium ATPase
2 (AT2A2)4 0.84 0.0059 ATPase
L-lactate dehydrogenase B chain (LDHB) 32 0.92 0.0063 glycolysis
Tubulin beta-2A chain (TBB2A) 16 0.93 0.0080 tubulin
Sodium/potassium-transporting ATPase subunit beta-
1 (AT1B1)20 0.93 0.0102 ATPase
Fructose-bisphosphate aldolase A (ALDOA) 29 0.92 0.0103 glycolysis
Ubiquitin 60S ribosomal L40 (RL40) 13 0.87 0.0104 translation
Lysine-specific histone demethylase 1A (KDM1A) 2 0.86 0.0109 transcription
Cytochrome c oxidase 5A (COX5A) 5 0.73 0.0112 mitochondrion
Ras related Rab 43 (RAB43) 10 0.82 0.0115 transport
Complex I intermediate-associated protein 30 (CIA30) 4 0.82 0.0115 mitochondrion
Tubulin alpha-4A chain (TBA4A) 19 0.92 0.0123 Tubulin
Calcium calmodulin dependent kinase II delta
(KCC2D)8 0.87 0.0128
calcium
regulation
Succinate semialdehyde dehydrogenase (SSDH) 2 1.16 0.0135 neurotransmitter
Myelin basic protein (MBP) 24 0.92 0.0163 Myelin
Hippocalcin like 4 (HPCL4) 3 0.74 0.0182 rhodopsin
Cofilin 2 (COF2) 6 0.75 0.0193 cytoskeleton
Serine threonine kinase 4 (STK4) 2 0.74 0.0194 apoptosis
Destrin (DEST) 5 0.75 0.0198 actin regulation

Broek, JAC │7
Tubulin beta 1 (TBB1) 11 0.88 0.0220 Tubulin
Tubulin alpha 8 (TBA8) 9 0.81 0.0248 Tubulin
Clusterin-like 1 (CLUL1) 2 0.76 0.0276 apoptosis
Keratin, type II cytoskeletal 71 (K2C71) 3 1.26 0.0284 Keratin
14-3-3 protein theta (1433T) 21 0.92 0.0296 14-3-3 protein
Neuromodulin (NEUM) 8 1.17 0.0319 connectivity
Septin-7 (SEPT7) 9 1.07 0.0335 cell cycle
Sodium/potassium-transporting ATPase subunit
alpha-3 (AT1A3)56 0.95 0.0349 ATPase
Heat shock 70kDa 4 (HSP74) 5 1.20 0.0361heat shock
protein
BAG family molecular chaperone regulator 3 (BAG3) 3 0.85 0.0361 apoptosis
Synaptogyrin 3 (SNG3) 6 1.21 0.0365 synaptic vesicle
14-3-3 protein epsilon (1433E) 23 0.94 0.0406 14-3-3 protein
ATP synthase delta (ATPD) 5 0.88 0.0411 mitochondrion
Actin cytoplasmic 1 (ACTB) 12 0.87 0.0414 actin
Ras related Rab-3A (RAB3A) 15 0.94 0.0435 synaptic vesicles
Plasma membrane calcium-transporting ATPase 2
(AT2B2)32 0.93 0.0438 ATPase
Stathmin (STMN1) 4 1.07 0.0452 neurogenesis
insulin-like growth factor-binding (ALS) 2 0.74 0.0473 cell adhesion
Hippocampus
FAD synthase (FAD1) 2 0.68 0.0057FAD biosynthetic
process
Protein argonaute-3 (AGO3) 2 0.53 0.0074 Translation
Visinin like protein 1 (VISL1) 15 0.89 0.0077 Rhodopsin
Glial fibrillary acidic protein (GFAP) 28 1.08 0.0189 cytoskeleton
Pyruvate kinase PKM (KPYM) 54 0.94 0.0202 Glycolysis
Macrophage migration inhibitory factor (MIF) 3 0.78 0.0213 inflammation
Testis-specific H1 histone 4 0.91 0.0230 Histone
ATP-dependent 6-phosphofructokinase, liver type
(K6PL)2 0.78 0.0270 glycolysis
Sodium/potassium-transporting ATPase subunit
alpha-1 (AT1A1)48 0.96 0.0279 ATPase
Voltage-dependent anion-selective channel protein 3
(VDAC3)8 1.06 0.0294 mitochondrion
60S ribosomal protein L6 (RL6) 6 1.31 0.0302 ribosome

Broek, JAC │8
Beta-arrestin 1 (ARRB1) 2 0.73 0.0306 protein transport
Ubiquitin-like modifier-activating enzyme 1 (UBA1) 25 0.93 0.0310 Ubiquitin
Heat shock 70kDa protein 1-like (HS71L) 28 0.94 0.0316heat shock
protein
78 kDa glucose-regulated protein (GRP78) 45 0.95 0.0335heat shock
protein
Histone H1t (H1T) 5 1.10 0.0340 Histone
V type proton ATPase F (VATF) 2 0.65 0.0359 ATPase
Rho GTPase-activating 12 (RHG12) 2 0.82 0.0390 GTPase
BTB POZ domain containing protein KCTD12
(KCD12)3 1.13 0.0412 neurotransmitter
L-lactate dehydrogenase B chain (LDHB) 26 0.94 0.0435 glycolysis
ATP-dependent 6-phosphofructokinase, platelet type
(K6PP)5 0.86 0.0436 glycolysis
Adenylate kinase isoenzyme 1 (KAD1) 4 0.87 0.0444 Energy
Heat shock-related 70kDa protein 2 (HSP72) 48 1.03 0.0445heat shock
protein
Myomesin-1 (MYOM1) 3 0.87 0.0487 cytoskeleton
Vesicular glutamate transporter 1 (VGLU1) 3 1.10 0.0496 neurotransmitter
Cerebellum
Sodium potassium transporting ATPase beta 2
(AT1B2)3 1.23 0.0052 ATPase
Ras related Rab 8B (RAB8B) 3 1.49 0.0078 Synapse
Histone H2B type 1-F/J/L (H2B1F) 4 0.91 0.0117 Histone
Hexokinase-1 (HXK1) 32 0.93 0.0136 glycolysis
Histone H2B type 1-P (H2B1P) 2 0.91 0.0186 Histone
Guanine nucleotide binding G t alpha 3 (GNAT3) 2 1.46 0.0193 signalling
Cysteine and glycine-rich 1 (CSRP1) 3 1.19 0.0195 cytoskeleton
Microtubule-associated protein tau (TAU) 5 0.91 0.0198 cytoskeleton
14-3-3 protein epsilon (1433E) 21 0.93 0.0214 14-3-3 protein
Tripartite motif-containing 45 (TRI45) 2 0.75 0.0350 transcription
IQ calmodulin-binding motif-containing 1 (IQCB1) 2 1.23 0.0386 cytoskeleton
Putative adenosylhomocysteinase 2 (SAHH2) 9 1.17 0.0387one-carbon
metabolism
NADH dehydrogenase ubiquinone 1 alpha 10
(NDUAA)5 0.84 0.0393 mitochondrion
Heat shock cognate 71 kDa protein (HSP7C) 31 1.05 0.0400heat shock
protein

Broek, JAC │9
Acyl-CoA-binding protein (ACBP) 6 0.91 0.0407 neurotransmitter
Excitatory amino acid transporter 1 (EAA1) 9 0.81 0.0424 neurotransmitter
Hippocalcin like 1 (HPCL1) 3 0.81 0.0427 rhodopsin
Cytochrome c oxidase 6B1 (CX6B1) 5 1.14 0.0470 mitochondrion
The table includes Uniprot ID, ratios (calculated based on average), and P values. Adjusted P values for the
brain areas were respectively 0.4172 (FC), 0.9296 (HC), and 0.8302 (CB).

Broek, JAC │10
Supplementary table S2. Proteins changed significantly in expression level using LC-MSE on mouse frontal cortex (FC), hippocampus (HC) and cerebellum (CB)
protein namebrain area
No. of peptides
ratio Fmr1 KO/WT
p-value
synaptic proteins
Excitatory amino acid transporter 1 (EAA1) CB 9 0.81 0.0424
Vesicular glutamate transporter 1 (VGLU1) HC 3 1.1 0.0496
BTB POZ domain containing protein KCTD12 (KCD12) HC 3 1.13 0.0412
Succinate semialdehyde dehydrogenase (SSDH) FC 2 1.16 0.0135
Neuromodulin (NEUM) FC 8 1.17 0.0319
Cysteine and glycine-rich 1 (CSRP1) CB 3 1.19 0.0195
Synaptogyrin 3 (SNG3) FC 6 1.21 0.0365
Guanine nucleotide binding G t alpha 3 (GNAT3) CB 2 1.46 0.0193
Ras related Rab 8B (RAB8B) CB 3 1.49 0.0078
ATPase
V type proton ATPase F (VATF) HC 2 0.65 0.0359
Sarcoplasmic endoplasmic reticulum calcium ATPase 2
(AT2A2) FC 4 0.84 0.0059
Sodium potassium transporting ATPase beta 2 (AT1B2) CB 3 1.23 0.0052
transcription
Tripartite motif-containing 45 (TRI45) CB 2 0.75 0.035
lysine-specific histone demethylase 1A (KDM1A) FC 2 0.86 0.0109
histone H1t (H1T) HC 5 1.1 0.034
translation
Protein argonaute-3 (AGO3) HC 2 0.53 0.0074
Ubiquitin 60S ribosomal L40 (RL40) FC 13 0.87 0.0104
60S ribosomal protein L6 (RL6) HC 6 1.31 0.0302
transport
beta-arrestin 1 (ARRB1) HC 2 0.73 0.0306
Ras related Rab 43 (RAB43) FC 10 0.82 0.0115
rhodopsin regulation
Hippocalcin like 4 (HPCL4) FC 3 0.74 0.0182

Broek, JAC │11
Hippocalcin like 1 (HPCL1) CB 3 0.81 0.0427
Visinin like protein 1 (VISL1) HC 15 0.89 0.0077
Mitochondrial/metabolic proteins
Cytochrome c oxidase 5A (COX5A) FC 5 0.73 0.0112
6 phosphofructokinase liver (K6PL) HC 2 0.78 0.027
complex I intermediate-associated 30 (CIA30) FC 4 0.82 0.0115
NADH dehydrogenase ubiquinone 1 alpha 10 (NDUAA) CB 5 0.84 0.0393
6 phosphofructokinase (K6PP) HC 5 0.86 0.0436
ATP synthase delta (ATPD) FC 5 0.88 0.0411
Cytochrome c oxidase 6B1 (CX6B1) CB 5 1.14 0.047
The table includes Uniprot ID, ratios (calculated based on average), and P values. Adjusted P values for the
brain areas were respectively 0.4172 (FC), 0.9296 (HC), and 0.8302 (CB). Significant proteins with an
increase/decrease greater than 10% are depicted here. FC = frontal cortex; HC = hippocampus; CB =
cerebellum

Broek, JAC │12
Supplementary table S3. Analysis of protein levels in mouse brain synaptosome fractions of Fmr1 KO and WT
protein nameNo. of
peptidesratio Fmr1
KO/WTp-value
Hippocampus
NADH dehydrogenase ubiquinone flavoprotein 1 (NDUV1) 32 0.89 0.0006
Uridine 5 monophosphate synthase (UMPS) 2 0.82 0.0010
Septin 10 (SEP10) 5 0.57 0.0011
Guanine nucleotide binding protein G i alpha 1 (GNAI1) 21 0.90 0.0016
Calmodulin protein 3 (CALL3) 10 1.18 0.0034
cytoplasmic FMR1-interacting protein 2 (CYFP2) 19 1.08 0.0051
Septin 11 (SEP11) 27 1.06 0.0066
Glucose-induced degradation 8 homolog (GID8) 2 1.11 0.0074
Guanine nucleotide binding protein G s alpha Xlas (GNAS1) 10 1.12 0.0104
Estradiol 17 beta dehydrogenase 8 (DHB8) 2 0.78 0.0113
Neutral amino acid transporter A (SATT) 3 1.10 0.0116
Tetraspanin 7 (TSN7) 2 1.13 0.0139
V-type proton ATPase subunit C 1 (VATC1) 32 1.05 0.0143
Tyrosine phosphatase non receptor substrate 1 (SHPS1) 22 0.89 0.0148
Leucine-rich repeat-containing 8D (LRC8D) 2 1.35 0.0149
Peroxiredoxin-6 (PRDX6) 27 0.93 0.0184
Glutamate decarboxylase 1 (DCE1) 6 1.12 0.0187
Hippocalcin like 1 (HPCL1) 6 0.88 0.0193
Pikachurin (EGFLA) 2 0.89 0.0203
Dihydrolipoyllysine succinyltransferase component (ODO2) 16 0.85 0.0207
Homeobox protein Hox C9 (HXC9) 2 1.13 0.0244
Neuronal-specific septin 3 (SEPT3) 26 1.07 0.0253
Cofilin-1 (COF1) 23 1.04 0.0269
ATP synthase subunit beta, mitochondrial (ATPB) 50 0.93 0.0282
Glutamate receptor 4 (GRIA4) 3 1.19 0.0288
Bicaudal D related protein 2 (BICR2) 3 1.14 0.0295
26S protease regulatory subunit 8 (PRS8) 3 0.69 0.0340
Neuron specific calcium binding hippocalcin (HPCA) 16 0.90 0.0343
Heat shock 70 kDa protein 1A (HS71A) 34 0.95 0.0364
NADH dehydrogenase [ubiquinone] 1 alpha subcomplex
subunit 10, mitochondrial (NDUAA)28 0.91 0.0377

Broek, JAC │13
Meiosis-specific with OB domain-containing (MEIOB) 3 0.85 0.0379
Intercellular adhesion molecule 5 (ICAM5) 34 0.92 0.0390
Rho GTPase activating protein 1 (RHG01) 2 1.16 0.0466
Immunoglobulin superfamily member 8 (IGSF8) 15 0.94 0.0467
Cerebellum
Neuronal growth regulator 1 (NEGR1) 12 1.07 0.0038
Ribonuclease UK114 (UK114) 7 0.92 0.0047
Heat shock 70 kDa 1A (HS71A) 21 1.12 0.0048
Glycerol 3 phosphate dehydrogenase NAD cytoplasmic
(GPDA)34 0.95 0.0049
Serine threonine protein phosphatase 2A 65 kDa regulatory
subunit A alpha isoform (2AAA)23 0.92 0.0062
Myristoylated alanine rich C kinase substrate (MARCS) 16 0.91 0.0085
Transitional endoplasmic reticulum ATPase (TERA) 33 0.92 0.0093
Pyruvate kinase isozymes (KPYM) 53 0.96 0.0099
Plakophilin-1 (PKP1) 3 0.89 0.0109
Ras related Rab 3C (RAB3C) 20 0.88 0.0119
Ras related protein Rab 3D (RAB3D) 15 0.93 0.0120
Synaptic vesicle glycoprotein 2B (SV2B) 8 0.87 0.0124
6 phosphofructokinase muscle type (K6PF) 52 0.94 0.0154
cAMP dependent protein kinase type II alpha regulatory
subunit (KAP2)5 1.08 0.0201
F actin capping protein alpha 2 (CAZA2) 3 0.90 0.0209
ADP ribosylation factor 4 (ARF4) 7 1.06 0.0213
Nucleoside diphosphate kinase B (NDKB) 3 0.92 0.0219
Profilin 1 (PROF1) 5 0.91 0.0223
L-asparaginase (ASGL1) 10 0.93 0.0263
Homeobox protein Hox A9 (HXA9) 2 0.82 0.0273
Adenosine deaminase-like (ADAL) 2 0.87 0.0275
Guanine nucleotide binding protein Gi Gs Gt subunit beta 2
(GBB2)15 1.06 0.0296
Myosin regulatory light chain 2 (MLRV) 2 0.83 0.0319
Guanine nucleotide binding protein G t subunit alpha 2
(GNAT2)12 0.93 0.0325
Cytosolic 10 formyltetrahydrofolate dehydrogenase (AL1L1) 25 0.95 0.0352
Guanine nucleotide binding G I G S G T beta 3 (GBB3) 12 0.90 0.0353
Sulfated glycoprotein 1 (SAP) 8 0.72 0.0369

Broek, JAC │14
Sarcoplasmic endoplasmic reticulum calcium ATPase 2
(AT2A2)55 0.97 0.0371
Tropomodulin-2 (TMOD2) 4 0.90 0.0400
Protein SERAC1 (SRAC1) 4 0.88 0.0414
BSD domain-containing 1 (BSDC1) 3 0.86 0.0432
NADH ubiquinone oxidoreductase chain 4 (NU4M) 8 1.10 0.0435
Dihydropyrimidinase related protein 4 (DPYL4) 17 1.06 0.0486
The table includes Uniprot ID, ratios (calculated based on average), and P values. Adjusted P values for
the brain areas were respectively 0.95318 (HC) and 0.91602 (CB).

Broek, JAC │15
Supplementary table S4. Proteins significantly changed in expression level using LC-MSE with mouse brain synaptosome fractions from the hippocampus (HC) and cerebellum (CB)
protein namesynaptosome
fractionNo. of
peptidesratio Fmr1
KO/WTp-value
cell signalling
Guanine nucleotide binding protein Gi alpha 1 (GNAI1) HC 21 0.90 0.0016
Guanine nucleotide binding protein Gs alpha Xlas (GNAS1) HC 10 1.12 0.0104
Leucine-rich repeat-containing 8D (LRC8D) HC 2 1.35 0.0149
Rho GTPase activating protein 1 (RHG01) HC 2 1.16 0.0466
Guanine nucleotide binding G(I)/G(S)/G(T) beta-3 (GBB3) CB 12 0.90 0.0353
Hippocalcin like 1 (HPCL1) HC 6 0.88 0.0193
Sulfated glycoprotein 1 (SAP) CB 8 0.72 0.0369
synaptic signalling
Glutamate decarboxylase 1 (DCE1) HC 6 1.12 0.0187
Glutamate receptor 4 (GRIA4) HC 3 1.19 0.0288
Ras related Rab 3C (RAB3C) CB 20 0.88 0.0119
Synaptic vesicle glycoprotein 2B (SV2B) CB 8 0.87 0.0124
connectivity
Tyrosine phosphatase non receptor substrate 1 (SHPS1) HC 22 0.89 0.0148
Plakophilin-1 (PKP1) CB 3 0.89 0.0109
neuron development
Septin 10 (SEP10) HC 5 0.57 0.0011
Tetraspanin 7 (TSN7) HC 2 1.13 0.0139
Pikachurin (EGFLA) HC 2 0.89 0.0203
Meiosis-specific with OB domain-containing (MEIOB) HC 3 0.85 0.0379
mitochondrial/metabolic proteins
NADH dehydrogenase ubiquinone flavoprotein 1 (NDUV1) HC 32 0.89 0.0006
Estradiol 17 beta dehydrogenase 8 (DHB8) HC 2 0.78 0.0113
Dihydrolipoyllysine succinyltransferase component (ODO2) HC 16 0.85 0.0207
Protein SERAC1 (SRAC1) CB 4 0.88 0.0414
NADH ubiquinone oxidoreductase chain 4 (NU4M) CB 8 1.10 0.0435
transcription

Broek, JAC │16
Uridine 5 monophosphate synthase (UMPS) HC 2 0.82 0.0010
Homeobox protein Hox C9 (HXC9) HC 2 1.13 0.0244
26S protease regulatory subunit 8 (PRS8) HC 3 0.69 0.0340
Homeobox protein Hox A9 (HXA9) CB 2 0.82 0.0273
Adenosine deaminase-like (ADAL) CB 2 0.87 0.0275
The table includes Uniprot ID, ratios (calculated based on average), and P values. Adjusted P values for the
synaptic fractions were respectively 0.9532 (HC) and 0.9960 (CB). Significant proteins with an increase/decrease
greater than 10% are depicted here. HC = hippocampus; CB = cerebellum

Broek, JAC │17
GO-ENRICHMENT ANALYSIS
GO-enrichment analysis was performed to identify altered networks in brain tissue
and synaptosome fractions of the Fmr1 KO mouse model using all significantly
changed proteins with a ratio Fmr1 KO/WT of >10%. Protein-Protein Interaction
(PPI) networks were constructed from the significantly changed proteins by finding
first-degree interacting neighbours across 3 databases: MINT, IntAct and Uniprot.
Enrichment was computed on each network using the ClueGO package in
Cytoscape[4]. Proteins were annotated according to the Mus Musculus gene
ontology database (ontology: Biological Process), which creates a functionally
organized GO-pathway term network. A two-sided hypergeometric distribution was
used to compute the statistical significance of each GO annotation, describing the
probabilities associated with sampling randomly without replacement from a finite
network of proteins where all proteins have an equal chance of being drawn. Only
GO terms with a significant q value (q <0.05, Benjamini-Hochberg test) were taken
forward. Subsequently, fuzzy heuristic partitioning was used to enhance the
biological interpretation of the pathways[5] and a diffusion-type manifold embedding
technique was used to emphasize short range interactions between GO terms[6].
For each GO term of interest, similar terms were represented by positive distances
while dissimilar terms were represented by negative distances. This allowed
functional groups of similar terms to be created for each tissue sample
(supplementary table S5) and synaptosome (supplementary table S6). The
functional correlation between synaptosomes and tissue was examined by
constructing a heatmap showing the percentage overlap of GO terms between the
functional groups (supplementary figure S2).

Broek, JAC │18
Supplementary table S5. GO term enrichment of mouse brain tissue of Fmr1 KO and WT
GO terms q-value proteinssignificant protein (1),
neighbour (0)
Frontal cortex
protein polymerization 1.49*10-9
Micall2, Pfn1, Pfn2, Prkce, Sept2,
Tmod3, Tuba1a, Tuba8, Tubb4b,
Tubb5
1
actin polymerization or depolymerization 5.86*10-8 Cfl2, Dstn, Micall2, Pfn1, Pfn2,
Plekhh2, Prkce, Tmod31
regulation of actin filament
depolymerization4.11*10-5
Cfl2, Dstn, Plekhh2, Tmod3 1
cellular potassium ion homeostasis 0.0002 Camk2d, Kcnma1 1
negative regulation of histone H3-K4
methylation0.0002 Gfi1b, Kdm1a 1
regulation of cell projection assembly 0.0002 Espn, Gap43, Pfn1, Pfn2 1
positive regulation of actin filament
depolymerization0.0004 Cfl2, Dstn 1
regulation of histone H3-K9 methylation 0.0007 Gfi1b, Kdm1a 1
regulation of neural precursor cell
proliferation0.0015 Kdm1a, Kdm2b, Lrrk2 1
histone demethylation 0.0025 Kdm1a, Kdm2b 1
positive regulation of Ras protein signal
transduction0.0033 Camk2d, Csf1 1
regulation of filopodium assembly 0.0036 Espn, Gap43 1
negative regulation of cytoskeleton
organization4.71*10-5
Espn, Pfn1, Pfn2, Plekhh2, Tmod3 0
dendrite morphogenesis 5.32*10-5Dlg4, Grin1, Ilk, Lrrk2, Ywhah 0
exploration behavior 6.83*10-5Dlg4, Lrrk2, Prkce 0
actin filament polymerization 7.52*10-5Micall2, Pfn1, Pfn2, Prkce, Tmod3 0
negative regulation of protein
dephosphorylation0.0002 Ywhab, Ywhae 0
regulation of long-term neuronal synaptic
plasticity0.0003 Dlg4, Grin1, Grin2b 0
membrane depolarization 0.0003 Dlg4, Grin1, Grin2b, Ywhah 0
negative regulation of actin filament 0.0004 Pfn1, Pfn2, Tmod3 0

Broek, JAC │19
polymerization
response to ammonium ion 0.0004 Dlg4, Grin1, Prkce 0
lateral ventricle development 0.0004 Kdm2b, Rpgrip1l 0
histone H2A monoubiquitination 0.0004 Kdm2b, Rnf2 0
endodermal cell fate specification 0.0005 Nanog, Pou5f1 0
regulation of ruffle assembly 0.0007 Pfn1, Pfn2 0
positive regulation of actin filament
polymerization0.0007 Pfn1, Pfn2, Prkce 0
determination of adult lifespan 0.0011 Lrrk2, Tfcp2l1 0
regulation of cell-matrix adhesion 0.0012 Cask, Csf1, Ilk 0
glutamate receptor signaling pathway 0.0012 Dlg4, Grin1, Grin2b 0
mesodermal cell fate commitment 0.0017 Nanog, Pou5f1 0
regulation of cell fate specification 0.0018 Nanog, Pou5f1 0
dendritic spine morphogenesis 0.0028 Dlg4, Lrrk2 0
negative regulation of actin filament
depolymerization0.0037 Plekhh2, Tmod3 0
positive regulation of stress fiber assembly 0.0037 Pfn1, Pfn2 0
olfactory bulb development 0.0053 Lrrk2, Rpgrip1l 0
Hippocampus
negative regulation of cell cycle arrest 2.58*10-6Cdk9, Mdm2, Mif 1
negative regulation of DNA damage
response, signal transduction by p53 class
mediator
0.0001 Mdm2, Mif 1
ATP hydrolysis coupled proton transport 0.0005 Atp6v1a, Atp6v1f 1
positive regulation of Ras protein signal
transduction0.0005 Arrb1, Csf1 1
negative regulation of protein
dephosphorylation4.10*10-5
Ywhab, Ywhae 0
intermediate filament organization 0.0005 Dnajb6, Vim 0
Cerebellum
ATP catabolic process 2.31*10-5
Atp1b2, Atp2a2, Atp5a1,
Hsp90aa1, Hspa8, Myh10, Myh9,
Myo1c
1
neuromuscular process controlling
balance6.58*10-5 Dlg4, Hexa, Kcnma1, Myh10,
Slc1a31
glutamate biosynthetic process 0.0007 Glud1, Slc1a3 1

Broek, JAC │20
mitochondrial transport 0.0008Acaa2, Hsp90aa1, Hspa4, Slc1a3,
Ywhaz1
protein folding 4.50*10-7
Cct3, Cct6a, Dnaja1, Dnaja3,
Hsp90aa1, Hsp90ab1, Hspa8,
Hspa9, Hsph1
0
negative regulation of protein
dephosphorylation0.0007 Ywhab, Ywhae 0
cellular response to interleukin-4 0.0007 Hsp90ab1, Hspa5, Tuba1b 0
positive regulation of cell migration by
vascular endothelial growth factor
signalling pathway
0.0008 Hspb1, Myo1c 0
cell junction assembly 0.0008 Actn4, Epb4.1l5, Jup, Myo1c, Plec 0
response to unfolded protein 0.0008 Hsp90aa1, Hspa5, Hspb1, Hsph1 0
protein targeting to mitochondrion 0.0011 Hsp90aa1, Hspa4, Ywhaz 0
lateral ventricle development 0.0012 Myh10, Rpgrip1l 0
cell-cell junction assembly 0.0026 Actn4, Jup, Myo1c 0
negative regulation of inflammatory
response to antigenic stimulus0.0026 Psma1, Psmb4 0
iron-sulfur cluster assembly 0.0026 Ciao1, Mms19 0
positive regulation of protein import into
nucleus, translocation0.0026 Hsp90aa1, Hsp90ab1 0
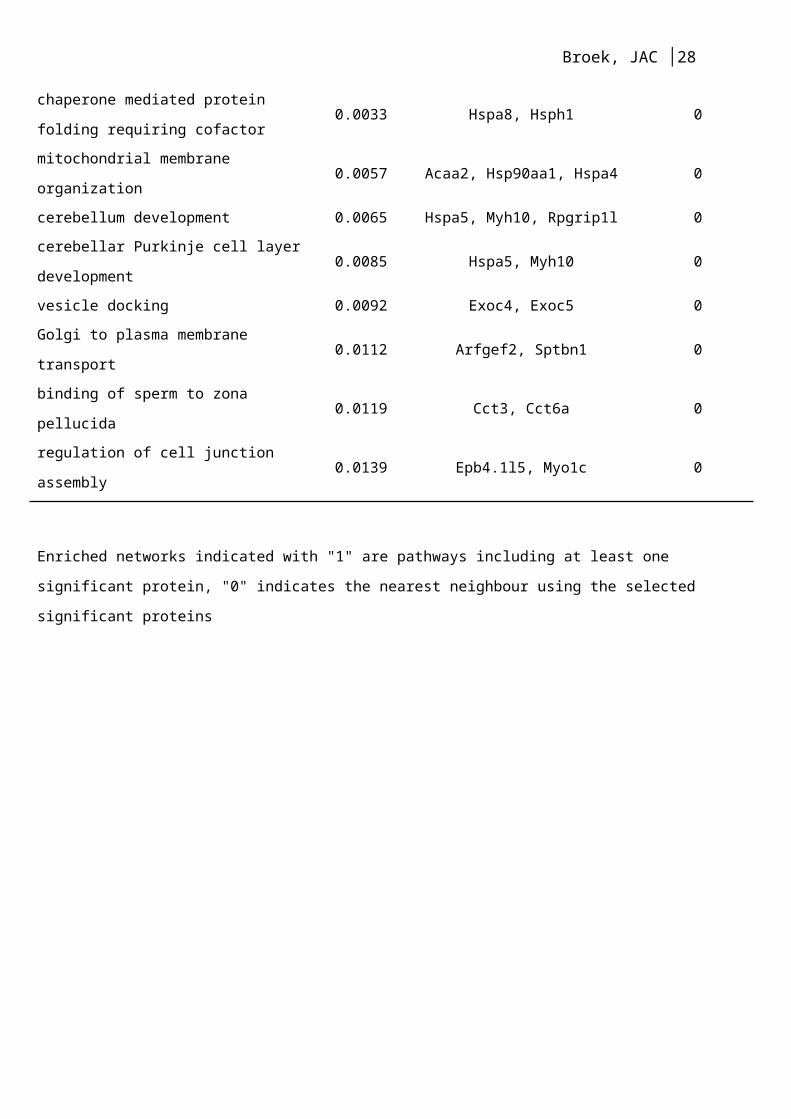
chaperone mediated protein folding
requiring cofactor0.0033 Hspa8, Hsph1 0
mitochondrial membrane organization 0.0057 Acaa2, Hsp90aa1, Hspa4 0
cerebellum development 0.0065 Hspa5, Myh10, Rpgrip1l 0
cerebellar Purkinje cell layer development 0.0085 Hspa5, Myh10 0
vesicle docking 0.0092 Exoc4, Exoc5 0
Golgi to plasma membrane transport 0.0112 Arfgef2, Sptbn1 0
binding of sperm to zona pellucida 0.0119 Cct3, Cct6a 0
regulation of cell junction assembly 0.0139 Epb4.1l5, Myo1c 0
Enriched networks indicated with "1" are pathways including at least one significant protein, "0" indicates the
nearest neighbour using the selected significant proteins

Broek, JAC │21
Supplementary table S6. GO term enrichment of mouse hippocampus and cerebellum synaptosome
fraction
GO Terms q-value proteinssignificant protein (1),
neighbour (0)
Hippocampus
negative regulation of protein
dephosphorylation1.86*10-5 Ywhab, Ywhae 0
glutamate receptor signalling pathway 3.37*10-5 Dlg4, Gria2, Gria4 1
Cerebellum
exploration behaviour 1.53*10-6 Dlg4, Lrrk2, Prkce 0
negative regulation of protein
dephosphorylation1.28*10-5 Ywhab, Ywhae 0
dendritic spine morphogenesis 0.0003 Dlg4, Lrrk2 0
positive regulation of proteasomal
ubiquitin-dependent protein catabolic
process
0.0006 Lrrk2, Vcp 0
Enriched networks indicated with "1" are pathways including at least one significant protein, "0" indicates the
nearest neighbour using the selected significant proteins

Broek, JAC │22
Supplementary figure S2. Overlapping significant GO-enriched networks between Fmr1 KO mouse brain tissue and synaptosome fractions. The gradual change in yellow colour indicates the ratio of overlap between the identified networks. Negative regulation of protein dephosphorylation was indicated in all studies. Other overlapping networks are involved in synaptic signalling and exploration behaviour.
Broek, JAC │23
PRIMARY HIPPOCAMPAL AND CEREBELLAR NEURON CULTURE
To study synaptic vesicle dynamics in live cell imaging, primary hippocampal and
cerebellar neurons were cultured. The dissected mouse brains were placed in ice
cold Hank’s Balanced Salt Solution (HBSS, Life Technologies). After dissection, the
hippocampi and cerebella were dissociated as discussed in [7] using papain and
mechanical treatment for 30 minutes at 34 degrees. The neurons were extracted in a
stepwise manner by first adding HBSS (8mL) and 10% fetal bovine serum (2mL,
FBS, Life Technologies), which is followed by centrifugation for 4 minutes at 200G.
The supernatant is supplemented with HBSS (5mL), MgSO4 (4mM) and DNase
(10μL, Roche), and the cells are dissociated using Nylon Net Filters (180μm NY8H,
Merck Millipore Ltd.). Removing of DNase occurred by washing with HBSS and
centrifugation for 2x4 minutes at 200 G. Respective media were as follows:
cerebella: Primary Neuron Basal Medium (PNBM, 50mL, Lonza), insulin (20μg/mL),
Gentamicin 2000x (5μg/mL, Life Technologies), GlutaMAX (100x, Life
Technologies), progesterone (40nM, Sigma), triiodo-L-Thyronine (0.5ng/mL, Sigma),
albumin (100μg/mL), B-27 supplements (50x, Life Technologies), apo-transferin
(200μg/mL, Sigma); hippocampi: Neurobasal medium (NB, 50mL, Life
Technologies), Gentamicin 2000x (5μg/mL, Life Technologies), GlutaMAX (100x,
Life Technologies), B-27 supplements (50x, Life Technologies). Per well in
respective media with 10% FBS, a concentration of 5x10⁶ cells for cerebellum and
1x10⁶ for hippocampus were plated on ⌀19mm coverslips coated with poly-D-lysine
(200μg/mL, Sigma). After 1.5 hour the medium+FBS was replaced with medium
only. After 3 days in vitro, ara-C (2μM) was added to the cerebellum cells to inhibit
glia growth.

Broek, JAC │24
VISUALIZATION OF SYNAPTIC BOUTON ACTIVITY WITH LIVE CELL
IMAGING
This part of the supplementary information describes the detailed process of the
visualization of synaptic bouton activity using live cell imaging. Visualization of
synaptic bouton activity is based on the uptake and unloading of styryl FM1-43 dye
(Molecular Probes, Life Technologies) by synaptic vesicles in the primary
hippocampal or cerebellar neurons. The primary neurons were plated on coverslips
and incubated for 10 minutes with pre-warmed low K+ medium (5mM KCl) and
subsequently loaded with FM1-43 styryl dye (5μg/mL, Molecular Probes, Life
Technologies) for 5 minutes in high-K+ medium (50mM KCl in 10mL respective
medium) (Supplementary figure S3). To remove surface bound dye, the neurons
were washed for 10 minutes with respective medium. Before stimulation of the
synaptic boutons, baseline measurements were recorded for 100 seconds, which
was followed by recordings of dye unloading kinetics via stimulation of the primary
neurons with high-K+ medium. Live cell images were acquired of synaptic bouton
activity using spinning-disk confocal microscopy (SDCM) technique based on a
Nikon Eclipse Ti-E inverted microscope with a 40x 1.30 NA oil objective (Plan Fluor
DIC, Nikon) connected to a Yokogawa dual spinning-disk confocal scanner unit
(Yokogawa, CSU-X1) with a 630/75m bandpass emission filter (Chroma). FM1-43
was excited with a 491nm 50mW diode pumped solid state laser (Calypso, Cobolt),
which caused emission at 566nm. Images were recorded with an EMCCD camera
(QuantEM:512C, Photometrics) at a magnification of 164 nm/pixel. The microscope
was equipped with a perfect focus system (Nikon). An incubation chamber (zylxs
type INUG2, Tokai Hit) was used to keep the cells at 37°C and 5% CO 2 in a
humidified environment. Timelapse imaging was performed for 20 minutes with 10
second intervals. The microscope setup was controlled by MetaMorph 7.7 software
(Molecular Devices).

Broek, JAC │25
Supplementary figure S3. Live cell imaging of hippocampal and cerebellar neurons. (a) Experimental diagram for cell loading and unloading. Camera icon 1 depicts a representative baseline measurement; camera icon 2 a representative experimental measurement; (b-e) synaptic bouton visualization with FM1-43 styryl dye in hippocampus KO (b) and WT (c), and cerebellum KO (d) and WT (e). (f-g) different kinetics of FM1-43 unloading results in strong (f) and weak (g) unloading boutons. (h) Average unloading kinetics of strong and weak unloading of FM1-43 dye.

Broek, JAC │26
Supplementary figure S4. Average number of synaptic boutons for different unloading profiles. The number of functional boutons was compared between Fmr1 KO and WT for cerebellum and hippocampus. The number of hippocampal neurons investigated is greater than the number of cerebellar neurons, due to the difficulty of culturing cerebellar neurons. For both the strong and weak unloading boutons, no significant differences were found in hippocampus or cerebellum. Data represent the mean ± s.e.m.

Broek, JAC │27
ULTRASTRUCTURE ANALYSIS USING ELECTRON MICROSCOPY
This part describes the ultrastructural analysis performed using electron microscopy
to investigate subcellular changes in synapses. Cerebellar tissue was obtained from
Fmr1 KO mice, which were anesthetized (Nembutal, 50mg/kg) and subsequently
perfused transcardially with 4% paraformaldehyde and 0.5% glutaraldehyde in
cacodylate buffer. Further procedures were performed according to Hoebeek, 2008
[8]. The brains were cut into 80 μm thick coronal sections with a vibratome and
calbindin immunocytochemistry was performed by incubating the sections with rabbit
anti-calbindin antibody and diaminobenzidine for visualization of Purkinje cells. The
sections were osmicated with 2% osmium in 8% glucose solution, dehydrated in
dimethoxypropane and stained en block with 3% uranyl acetate/70% ethanol for 60
minutes and embedded in Araldite (Durcupan, Fluka, Germany). Ultrathin sections
(70-90 nm) were cut using an Ultramicrotome (Leica, Germany), mounted on copper
grids, and counterstained with uranyl acetate and lead citrate [8]. Purkinje cell
terminals were recorded at magnifications x4900, x7000, x9800 and analyzed under
the electron microscope (Philips, Eindhoven, the Netherlands). The digital electron
micrographs were analyzed for total vesicle number, active zone (AZ) length,
presynaptic area, and vesicle density (nm2) using Fiji, ImageJ v2.0.0[9]. The
observer was blind to genotype during the procedure. The data were statistical
analyzed using a t-test with permutations (AZ length, presynaptic area, and vesicle
density) and correlation (density with AZ length) in R statistical programming
language (version 3.1.1 [10]).
Broek, JAC │28
SUPPLEMENTAL REFERENCES
1. Broek JA, Guest PC, Rahmoune H, Bahn S: Proteomic analysis of post mortem brain tissue from autism patients: evidence for opposite changes in prefrontal cortex and cerebellum in synaptic connectivity-related proteins. Mol Autism 2014, 5:41.
2. Wesseling H, Want EJ, Guest PC, Rahmoune H, Holmes E, Bahn S: Hippocampal proteomic and metabonomic abnormalities in neurotransmission, oxidative stress and apoptotic pathways in a chronic phencyclidine rat model. J Proteome Res 2015.
3. Krishnamurthy D, Harris LW, Levin Y, Koutroukides TA, Rahmoune H, Pietsch S, Vanattou-Saifoudine N, Leweke FM, Guest PC, Bahn S: Metabolic, hormonal and stress-related molecular changes in post-mortem pituitary glands from schizophrenia subjects. World J Biol Psychiatry 2013, 14:478-489.
4. Bindea G, Mlecnik B, Hackl H, Charoentong P, Tosolini M, Kirilovsky A, Fridman WH, Pages F, Trajanoski Z, Galon J: ClueGO: a Cytoscape plug-in to decipher functionally grouped gene ontology and pathway annotation networks. Bioinformatics 2009, 25:1091-1093.
5. Frohlich H, Speer N, Poustka A, Beissbarth T: GOSim--an R-package for computation of information theoretic GO similarities between terms and gene products. BMC Bioinformatics 2007, 8:166.
6. Lerman G, Shakhnovich BE: Defining functional distance using manifold embeddings of gene ontology annotations. Proc Natl Acad Sci U S A 2007, 104:11334-11339.
7. Tabata T, Sawada S, Araki K, Bono Y, Furuya S, Kano M: A reliable method for culture of dissociated mouse cerebellar cells enriched for Purkinje neurons. J Neurosci Methods 2000, 104:45-53.
8. Hoebeek FE, Khosrovani S, Witter L, De Zeeuw CI: Purkinje cell input to cerebellar nuclei in tottering: ultrastructure and physiology. Cerebellum 2008, 7:547-558.
9. Schindelin J, Arganda-Carreras I, Frise E, Kaynig V, Longair M, Pietzsch T, Preibisch S, Rueden C, Saalfeld S, Schmid B, et al: Fiji: an open-source platform for biological-image analysis. Nat Methods 2012, 9:676-682.
10. R ct: R: A language and environment for statistical computing. Vienna, Austria; 2013.