supplementary information holocene winter … supplementary information holocene winter climate...
TRANSCRIPT
1
SUPPLEMENTARY INFORMATION
Holocene winter climate variability in mid-latitude western
North America
Vasile Ersek, Peter U. Clark, Alan C. Mix, Hai Cheng, R. Lawrence Edwards
Supplementary Figures S1-S5
Supplementary Tables S1-S2
Supplementary Reference
2
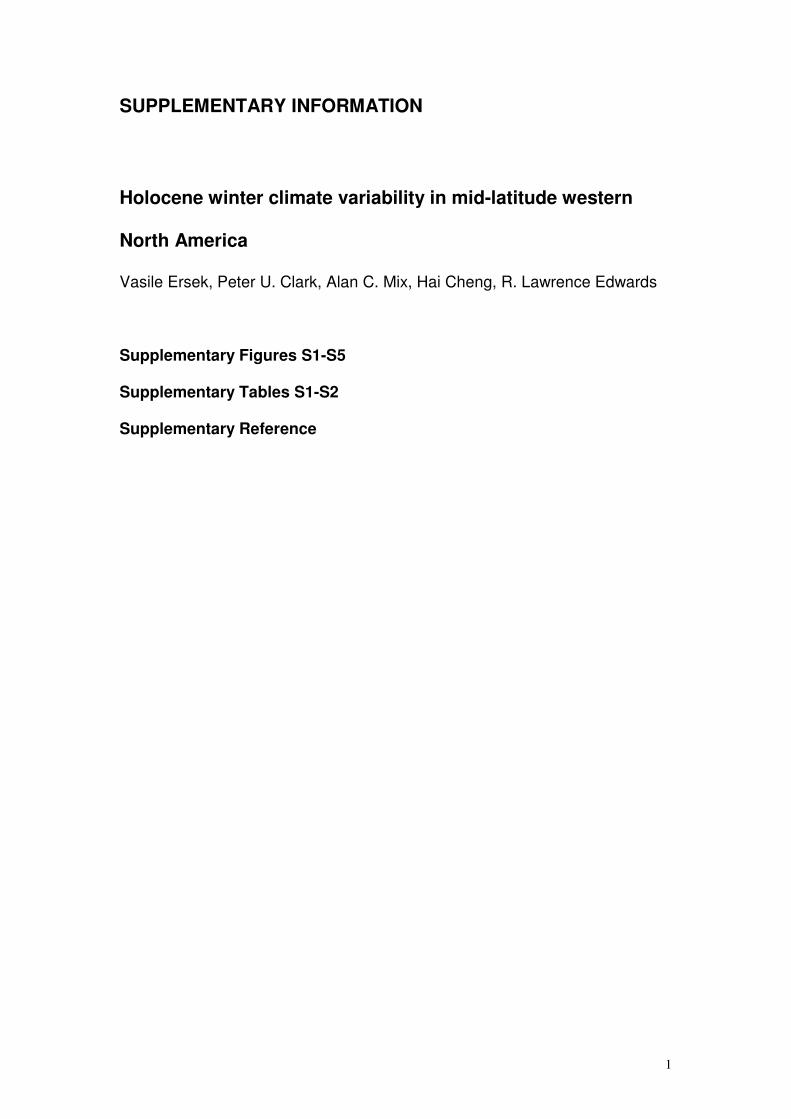
Supplementary Figure S1Age model and photo of stalagmite OCNM02-
1. The U-Th ages are represented by the black diamonds and the 2σ errors are indicated by black vertical lines. Also shown are previously published dates7 from the same stalagmite (open circles). Shaded gray area indicates
the modeled error envelope at 2σ level. The inset shows the Late-Glacial and Holocene section of stalagmite OCNM02-1 with the location of U-Th dates presented in this study (black lines) and the hiatus is marked by the red dashed line. The sampling track for stable isotope analysis is visible along the growth axis, and the red arrows mark changes in the sampling track.
3
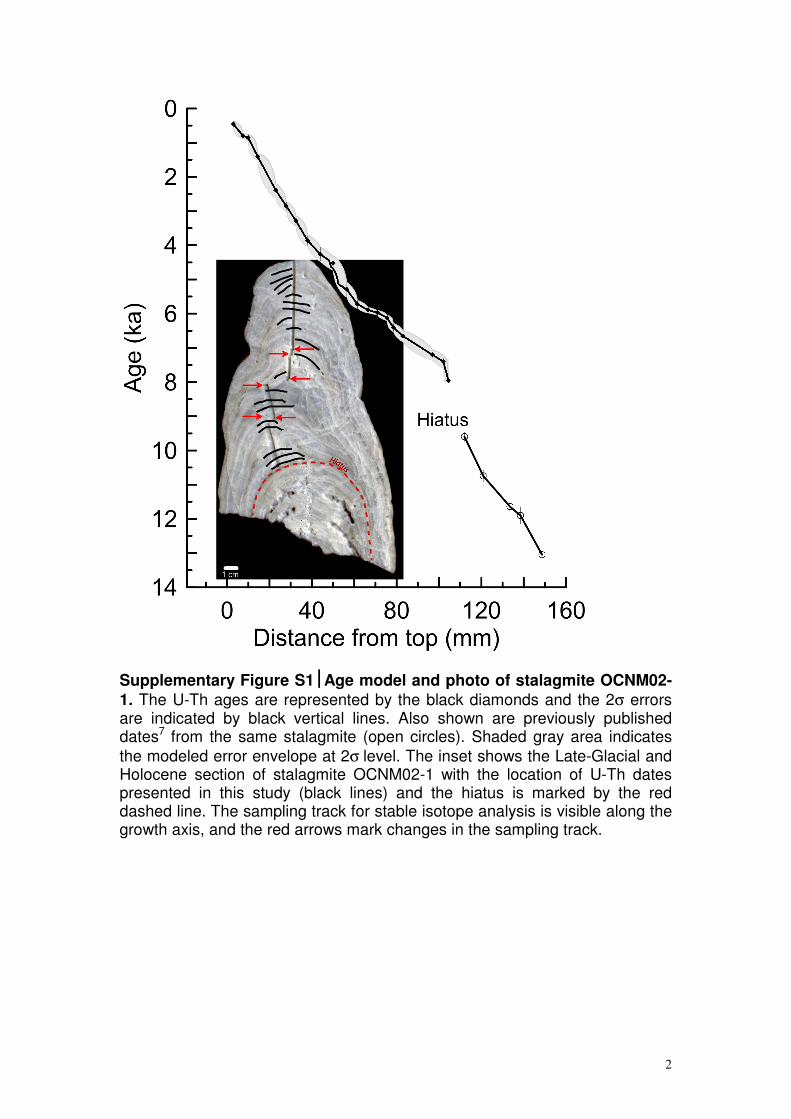
Supplementary Figure S2Cross-wavelet analysis. Cross-wavelet transform of the Holocene δ18O and δ13C at OCNM indicating the common power (color bar) and the phase relations between the two timeseries (arrows). The 95% confidence interval is shown by thick black contours and the lighter shadow indicates the cone of influence where edge effects could distort the signal. In-phase relationship is indicated by arrows pointing to the left, out-of-phase pointing to the right, and δ18O leading δ13C by 90o pointing straight up.
4
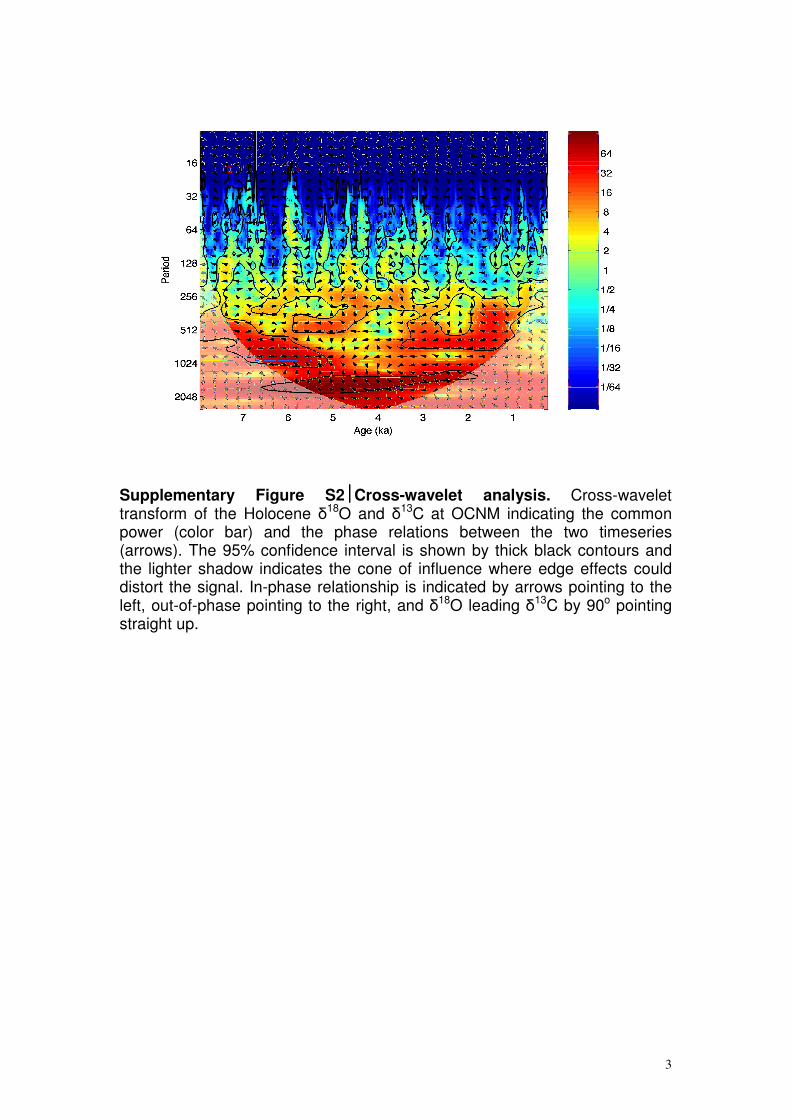
Supplementary Figure S3Equilibrium fractionation tests. Dashed lines show the results of sampling along a growth layer with a conventional dental drill, while continuous lines show the results for milling along a growth layer using a micromill. Error bars represent the average analytical error for δ18O and δ13C measurements. The inset shows the correlation between δ18O and δ
13C along the growth axis (R2=0.13, P value < 0.001, n=2680).
5
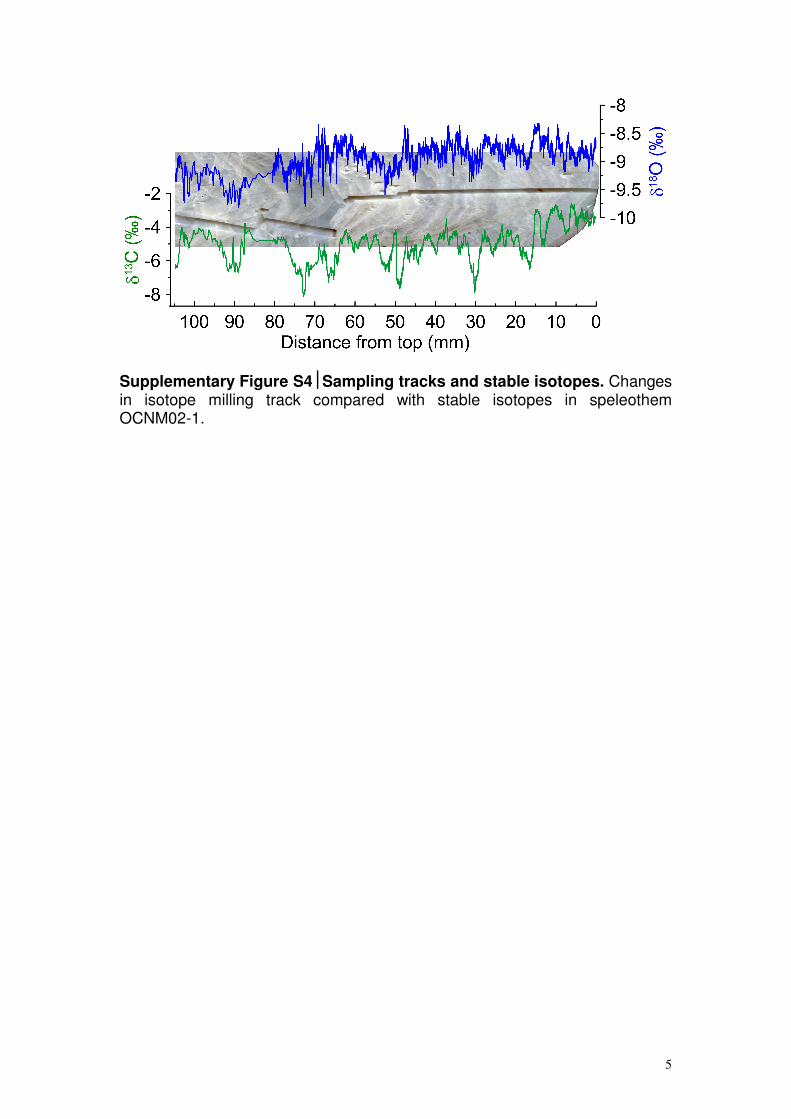
Supplementary Figure S4Sampling tracks and stable isotopes. Changes in isotope milling track compared with stable isotopes in speleothem OCNM02-1.
6
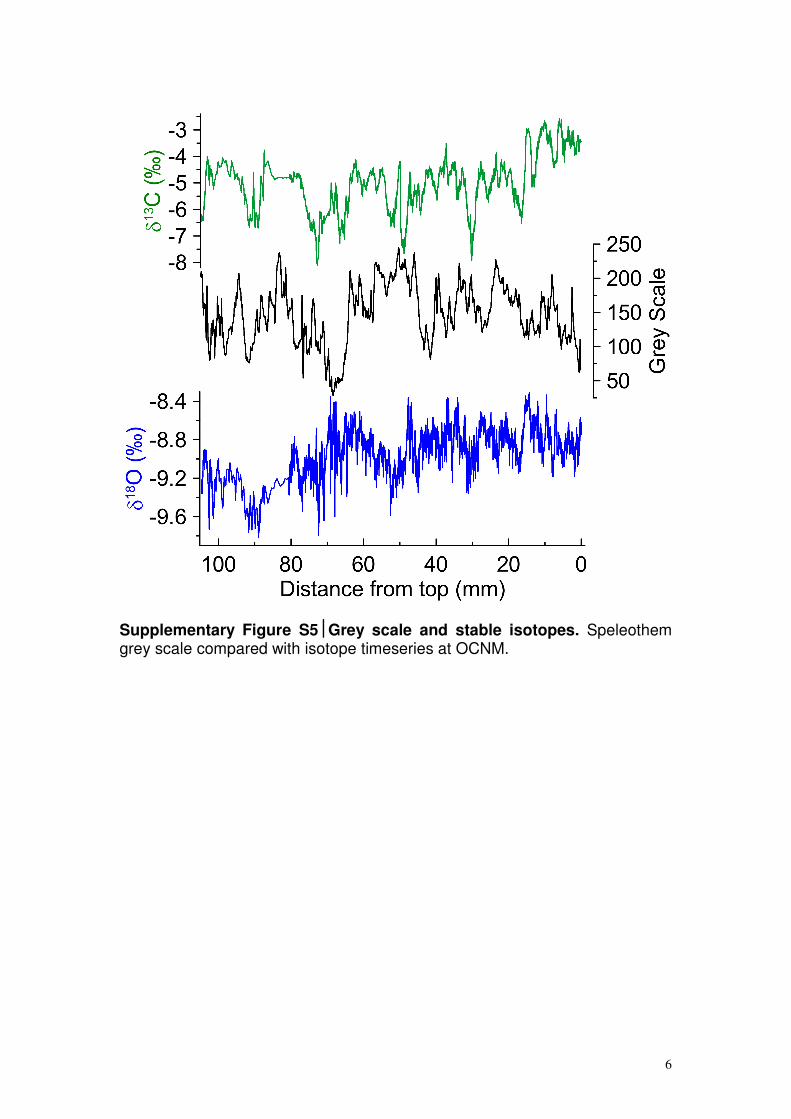
Supplementary Figure S5Grey scale and stable isotopes. Speleothem grey scale compared with isotope timeseries at OCNM.
7
Sample 238
U (ppb)
232Th
(ppt)
230Th /
232Th
(atomic x10-6)
δδδδ234U*
(measured)
230Th /
238U
(activity)
230Th Age (yr)
(uncorrected)
230Th Age (yr)
(corrected) δδδδ234
UInitial* (corrected)
230Th Age (ka BP)**
(corrected ) Depth (mm)
OCNM02-1-4 90.9 ±0.1 190 ±23 53 ±7 105.5 ±2 0.00671 ±0.00048 664 ±48 514 ±74 105.6 ±2 0.46 ±0.07 3
OCNM02-0.85 108.0 ±0.4 288 ±23 66 ±6 105.3 ±3 0.01068 ±0.00054 1057 ±53 866 ±73 105.6 ±3 0.81 ±0.07 7.5
OCNM02-01-1.0 91.0 ±0.2 359 ±7 49 ±4 102.2 ±2 0.01166 ±0.00083 1159 ±83 870 ±130 102.5 ±2 0.82 ±0.13 10
OCNM02-1.8 101.9 ±0.2 193 ±22 140 ±17 100.9 ±2 0.01613 ±0.00059 1608 ±59 1471 ±70 101.3 ±2 1.42 ±0.07 14.5
OCNM02-2.95 118.7 ±0.2 1192 ±24 52 ±1 91.1 ±3 0.03141 ±0.00065 3181 ±67 2448 ±200 91.8 ±3 2.39 ±0.20 23
OCNM02-01-2.8 81.1 ±0.2 287 ±6 146 ±4 91.4 ±2 0.03132 ±0.00065 3174 ±67 2916 ±110 92.1 ±2 2.86 ±0.11 28
OCNM02-01-3.25 100.3 ±0.2 480 ±10 125 ±3 91.8 ±2 0.03636 ±0.00050 3692 ±52 3343 ±130 92.7 ±2 3.29 ±0.13 32.5
OCNM02-3.5 128.5 ±0.2 872 ±23 106 ±3 92.3 ±2 0.04346 ±0.00073 4421 ±76 3928 ±150 93.3 ±2 3.87 ±0.15 38
OCNM02-4.7 67.3 ±0.1 792 ±24 72 ±3 94.7 ±2 0.0513 ±0.0013 5230 ±140 4372 ±260 95.8 ±2 4.32 ±0.26 44
OCNM02-01-5.0 60.4 ±0.1 528 ±11 95 ±2 88.5 ±2 0.05024 ±0.00063 5149 ±67 4512 ±240 89.6 ±2 4.45 ±0.24 50
OCNM02-01-5.65 66.0 ±0.1 512 ±10 122 ±3 83.5 ±2 0.05734 ±0.00077 5925 ±83 5356 ±220 84.7 ±2 5.30 ±0.22 56.5
OCNM02-6.3 95.9 ±0.2 283 ±20 326 ±23 87.1 ±3 0.05835 ±0.00098 6010 ±110 5791 ±120 88.5 ±3 5.73 ±0.12 61.5
OCNM02-01-6.65 81.6 ±0.1 243 ±5 333 ±8 87.1 ±2 0.06012 ±0.00065 6199 ±70 5981 ±100 88.6 ±2 5.92 ±0.10 66.5
OCNM02-01-7.1 106.9 ±0.2 121 ±3 859 ±20 85.9 ±2 0.05910 ±0.00051 6098 ±55 6015 ±63 87.3 ±2 5.96 ±0.06 71
OCNM02-01-7.55 105.7 ±0.2 224 ±5 477 ±10 85.6 ±2 0.06123 ±0.00045 6326 ±50 6171 ±74 87.1 ±2 6.11 ±0.07 75.5
OCNM02-8.1 86.2 ±0.2 277 ±17 338 ±21 102.1 ±3 0.06582 ±0.00094 6700 ±100 6472 ±120 104.0 ±3 6.42 ±0.12 78.5
OCNM02-01-8.3 86.8 ±0.1 583 ±12 173 ±4 92.9 ±2 0.07028 ±0.00054 7241 ±58 6754 ±180 94.7 ±2 6.70 ±0.18 83
OCNM02-01-9.7 117.4 ±0.2 760 ±15 188 ±4 81.0 ±2 0.07402 ±0.00040 7729 ±45 7253 ±170 82.6 ±2 7.19 ±0.17 97
OCNM02-10 85.5 ±0.3 840 ±24 131 ±4 94.3 ±4 0.0782 ±0.0013 8070 ±140 7355 ±230 96.2 ±4 7.30 ±0.23 102
OCNM02-01-104.5 92.2 ±0.1 329 ±7 369 ±8 89.8 ±1 0.07981 ±0.00043 8285 ±48 8025 ±100 91.8 ±1 7.97 ±0.10 104.5
A7 *** 134.2 ±0.2 630 ±10 339 ±8 102.5 ±2 0.0965 ±0.0011 9920 ±130 9654 ±140 105 ±2 9.60 ±0.14 112
A9 *** 126.9 ±0.3 480 ±10 470 ±10 111.9 ±4 0.1062 ±0.0015 10890 ±170 10674 ±170 115 ±4 10.62 ±0.17 120.9
A12 *** 127.6 ±0.1 880 ±10 263 ±4 110.4 ±2 0.1096 ±0.0010 11270 ±110 10834 ±150 114 ±2 10.78 ±0.15 120.9
A13 *** 126.1 ±0.1 1830 ±10 130 ±1 105.4 ±2 0.1146 ±0.0010 11870 ±120 10874 ±250 109 ±2 10.82 ±0.25 120.9
A8 *** 159.2 ±0.3 2310 ±10 139 ±1 129.4 ±2 0.1224 ±0.0011 12440 ±120 11474 ±240 134 ±2 11.42 ±0.24 133.5
A10 *** 164.8 ±0.2 2590 ±10 131 ±1 122.0 ±2 0.1251 ±0.0010 12820 ±110 11764 ±260 126 ±2 11.71 ±0.26 133.5
A11 *** 151.1 ±0.2 2450 ±20 126 ±2 99.0 ±2 0.1237 ±0.0013 12960 ±150 11834 ±290 102 ±2 11.78 ±0.29 133.5
A6 *** 103.1 ±0.2 1320 ±10 163 ±2 134.0 ±3 0.1262 ±0.0014 12790 ±160 11954 ±240 139 ±3 11.90 ±0.24 138.5
A3 *** 170.9 ±0.3 430 ±20 830 ±40 107.6 ±3 0.1271 ±0.0016 13220 ±170 13094 ±180 112 ±3 13.04 ±0.18 148.6
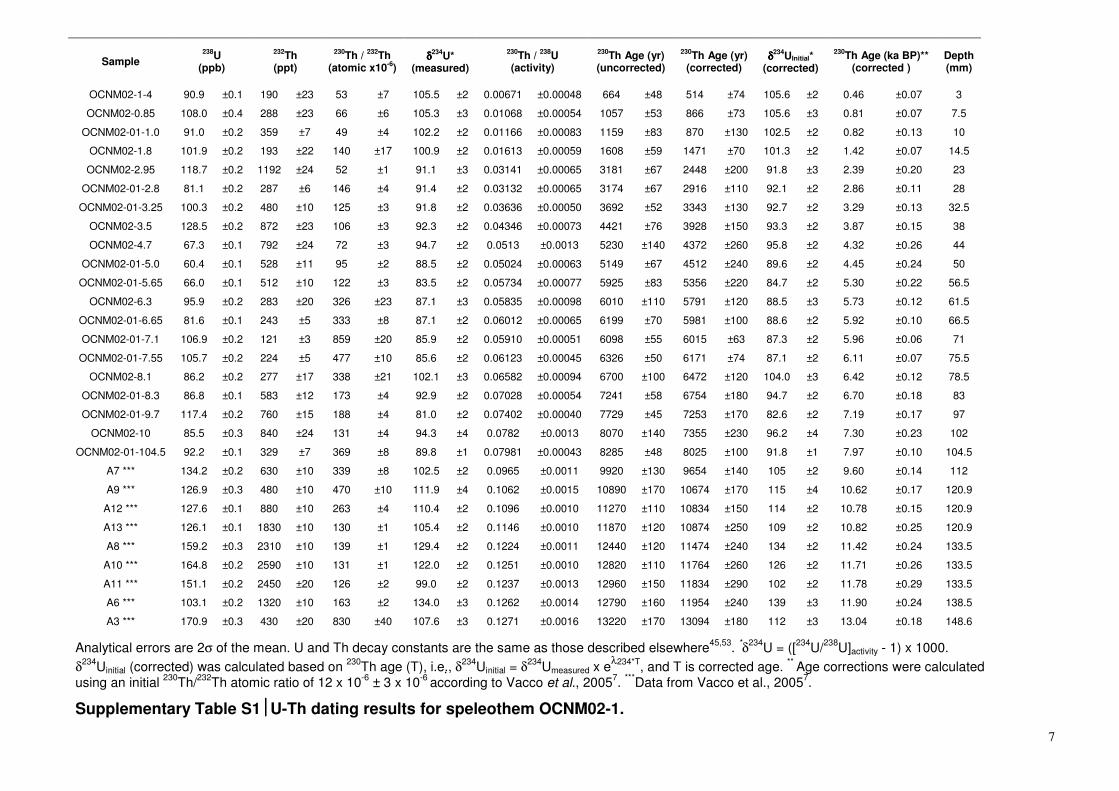
Analytical errors are 2σ of the mean. U and Th decay constants are the same as those described elsewhere45,53
. *δ234
U = ([234
U/238
U]activity - 1) x 1000.
δ234Uinitial (corrected) was calculated based on
230Th age (T), i.e., δ234
Uinitial = δ234Umeasured x e
λ234*T, and T is corrected age.
** Age corrections were calculated
using an initial 230
Th/232
Th atomic ratio of 12 x 10-6
± 3 x 10⁻⁶
according to Vacco et al., 20057.
***Data from Vacco et al., 2005
7.
Supplementary Table S1U-Th dating results for speleothem OCNM02-1.
8
Location Depth below
surface (m)
Average δ
18O
1σσσσ Number of samples
Number of months
King and Queen Room
14 -11.00 1.02 23 14
Imagination Room
18 -11.80 0.96 28 17
Miller’s Chapel
30 -11.22 0.62 40 19
Rain Room 51 -11.34 0.20 88 19
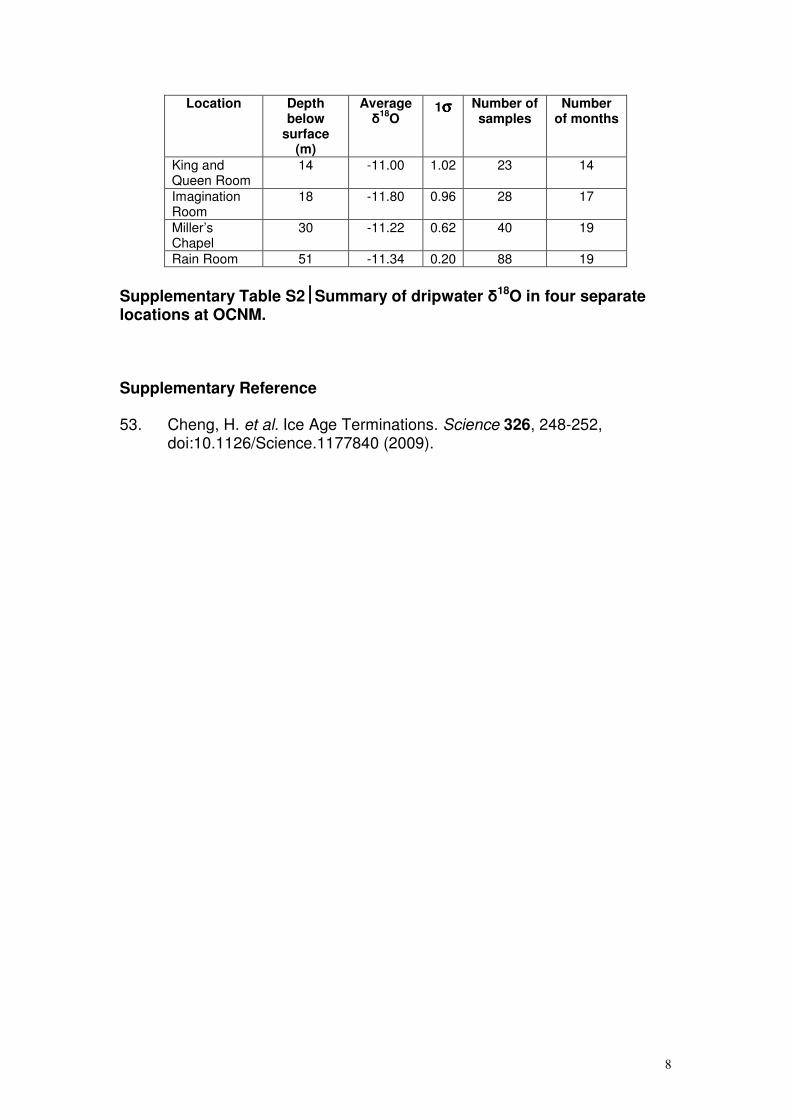
Supplementary Table S2Summary of dripwater δ18O in four separate locations at OCNM. Supplementary Reference 53. Cheng, H. et al. Ice Age Terminations. Science 326, 248-252,
doi:10.1126/Science.1177840 (2009).