supplementary material supplementary figures 1-8 ... · gene symbol entrez gene name fold-change...
TRANSCRIPT
Supplementary material Supplementary Figures 1-8 Supplementary Tables 1-9
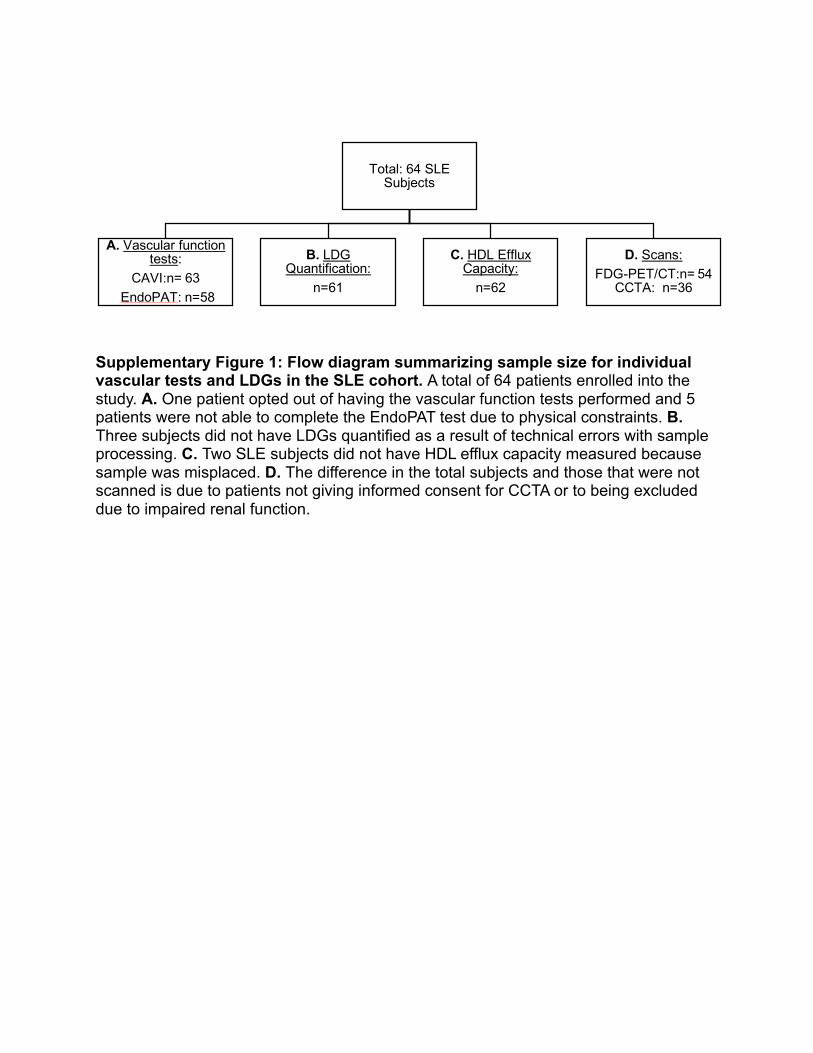
Supplementary Figure 1: Flow diagram summarizing sample size for individual vascular tests and LDGs in the SLE cohort. A total of 64 patients enrolled into the study. A. One patient opted out of having the vascular function tests performed and 5 patients were not able to complete the EndoPAT test due to physical constraints. B. Three subjects did not have LDGs quantified as a result of technical errors with sample processing. C. Two SLE subjects did not have HDL efflux capacity measured because sample was misplaced. D. The difference in the total subjects and those that were not scanned is due to patients not giving informed consent for CCTA or to being excluded due to impaired renal function.
Total: 64 SLE Subjects
A. Vascular function tests:
CAVI:n= 63EndoPAT: n=58
B. LDG Quantification:
n=61
C. HDL Efflux Capacity:
n=62
D. Scans: FDG-PET/CT:n= 54
CCTA: n=36

Supplementary Figure 2: Flow diagram summarizing sample size for individual vascular tests and LDGs in the healthy control cohort A total of 44 controls enrolled into the study and 9 were subsequently excluded on the basis of having one or more of the following: HDL <40, BMI >35, diagnosed hypertension, and dyslipidemia. A. Five controls opted out of having the vascular function tests performed. B. Seven controls did not have LDGs measured as a result of lab technical errors. C. One control did not have HDL efflux capacity measured because sample was misplaced. D. The difference in the total patients and those that were not scanned is due to subjects not signing informed consent for this specific test.
Total: n=44 Controls
A. Vascular function tests:
CAVI:n= 30 EndoPAT: n=30
B. LDG Measure:n=28
C. HDL Efflux Capacity:
n=34
D. Scans:FDG-PET/CT: n=28
CCTA: n=18
After Exclusion:n= 35
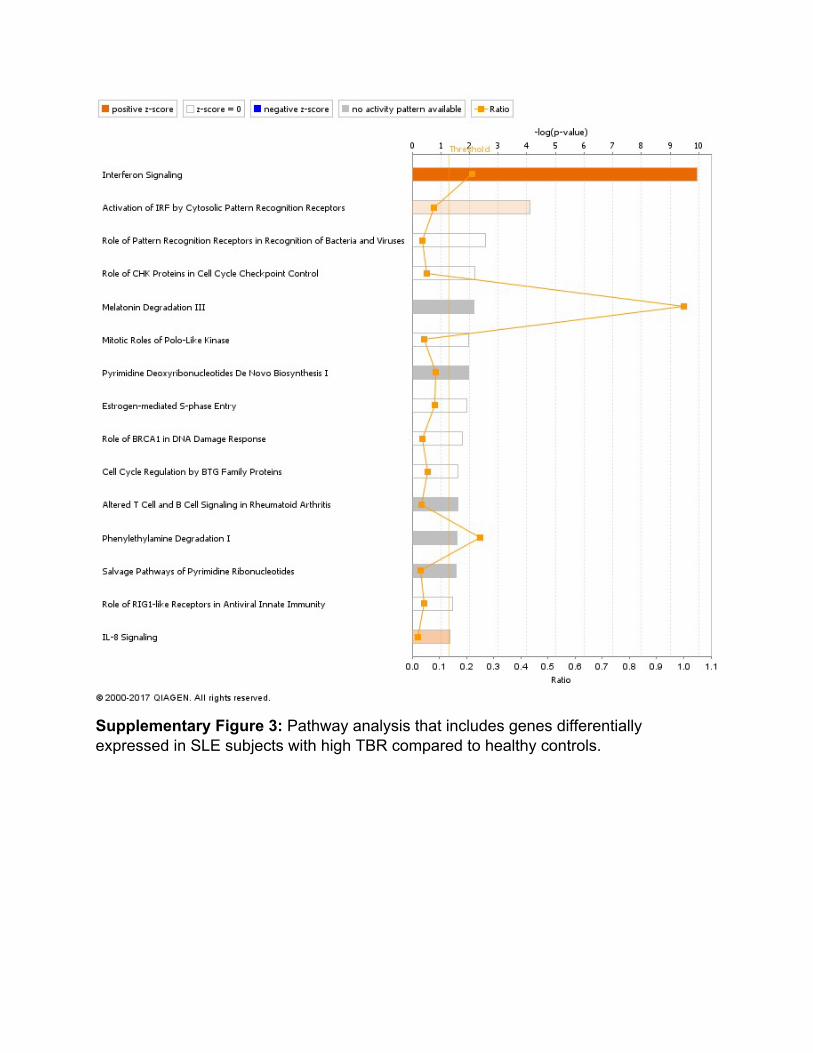
Supplementary Figure 3: Pathway analysis that includes genes differentially expressed in SLE subjects with high TBR compared to healthy controls.

Supplementary Figure 4: Pathway analysis that includes genes differentially expressed in SLE subjects with normal TBR compared to controls


Supplementary Figure 5: Pathway analysis that includes genes differentially expressed in SLE subjects with high TBR compared to SLE subjects with normal TBR.
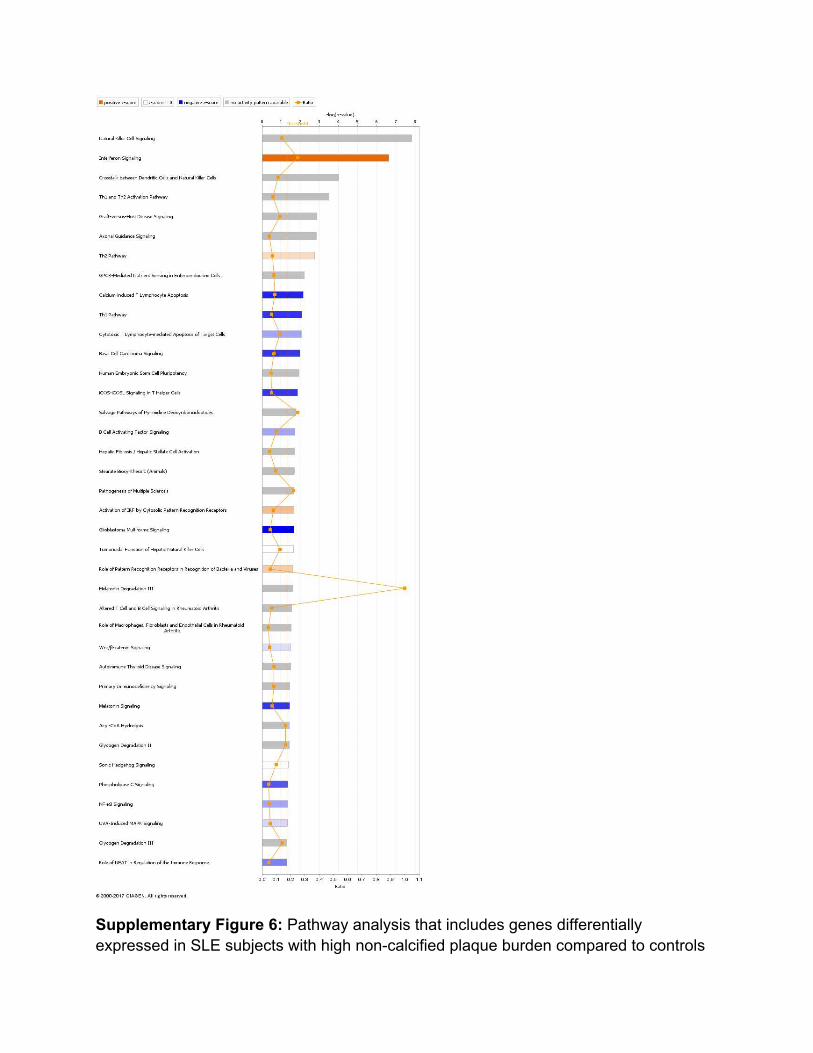
Supplementary Figure 6: Pathway analysis that includes genes differentially expressed in SLE subjects with high non-calcified plaque burden compared to controls
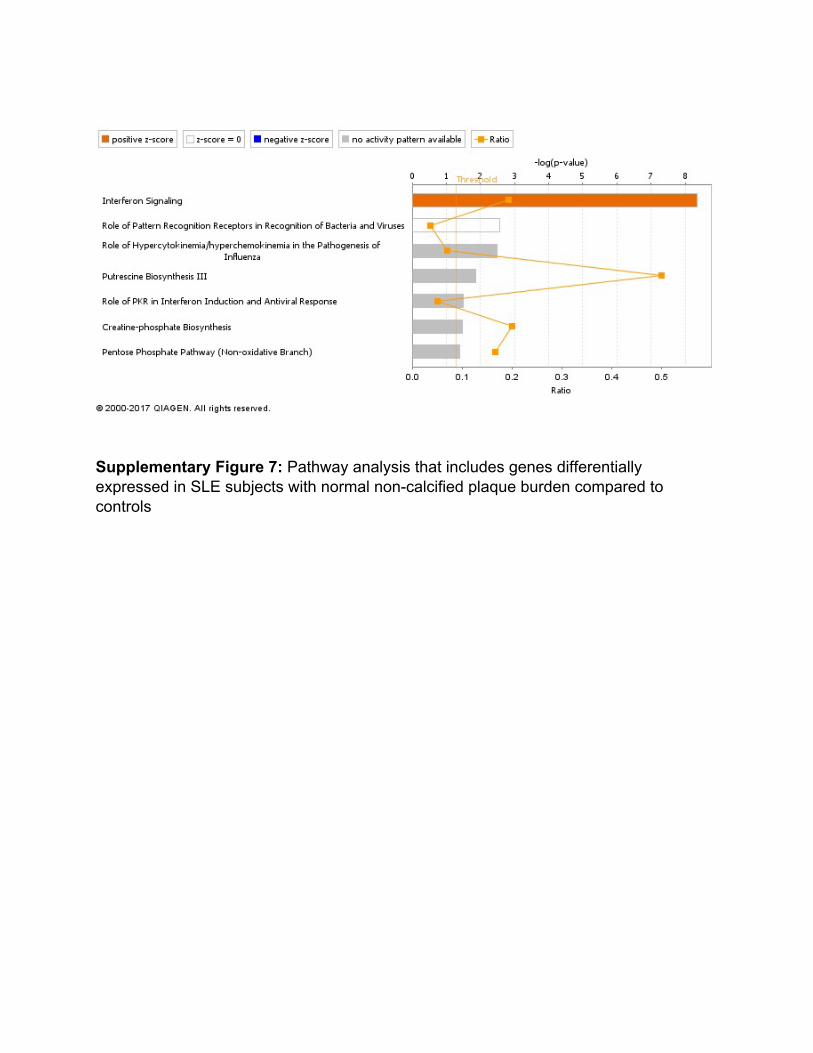
Supplementary Figure 7: Pathway analysis that includes genes differentially expressed in SLE subjects with normal non-calcified plaque burden compared to controls

Supplementary Figure 8: Pathway analysis that includes genes differentially expressed in SLE subjects with high non-calcified plaque burden compared to SLE subjects with low non-calcified plaque burden.

Supplementary Table 1: Concentrations (pg/ml) of cytokines measured in serum of SLE and healthy controls. Results shown as median (IQR). Mann Whitney test was used to determine significance. Cytokine(pg/ml) SLE Control p-valueIL-1B 2.95(2.46-4.885) 2.88(2.31-3.79) 0.33IL-1Ra 87.02(73.09-118.36) 73.25(43.68-146.6) 0.12IL-2 1.17(0.22-2.31) 1.165(0-10.38) 0.36IL-4 5.25(4.61-6.02) 5.08(4.36-7.62) 0.9IL-5 4.21(0.57-25.24) 5.17(0.055-24.9) 0.76IL-6 12.00(8.05-27.5) 9.18(5.92-34.9) 0.46IL-7 7.33(4.22-11.93) 5.83(4.68-12.33) 0.66IL-8 31.04(19.13-56.69) 23.28(16.13-36.03) 0.07IL-9 46.50(11.49-82.38) 61(11.68-78.31) 0.76IL-10 4.35(1.06-14.91) 3.41(0.13-19.3) 0.47IL-12B 23.15(8.31-52.31) 24.66(8.41-66.34) 0.99IL-13 2.90(0.81-6.25) 2.23(0.99-5.38) 0.81IL-15 0.89(0-0.89) 0(0-0.89) 0.34IL-17A 54.28(27.81-89.88) 52.1(34.55-96.92) 0.51Eotaxin 136.91(71.7-216.19) 91.44(53.38-147.15) 0.02BasicFGF 42.24(0.55-77.31) 44.46(0.545-77.49) 0.71G-CSF 42.4(30.58-55.89) 39.25(32.26-59.69) 0.93GM-CSF 1.015(0-1.015) 0(0-1.015) 0.17IFN-g 70.62(60.01-94.3) 72.19(38.44-94.3) 0.62IP-10 1498.12(739.91-3181.98) 876.48(582.74-1264.48) 0.01MCP-1 11.86(6.19-36.75) 11.765(6.19-26.32) 0.37MIP-1a 4.74(3.48-9.26) 4.58(3.36-7.32) 0.33PDGF 2605.41(1648.52-3318.08) 3128.38(1901.2-3975.49) 0.1MIP-1b 157.59(98.92-248.82) 110.08(81.53-161.06) 0.05
RANTES12456.61(11007.88-14825.64)
13003.86(11865.22-17205.06) 0.36
TNFa 34.41(30.3-57.47) 36.71(30.3-48.27) 0.36VEGF 43.20(17.27-105.32) 46.82(24.12-68.79) 0.74
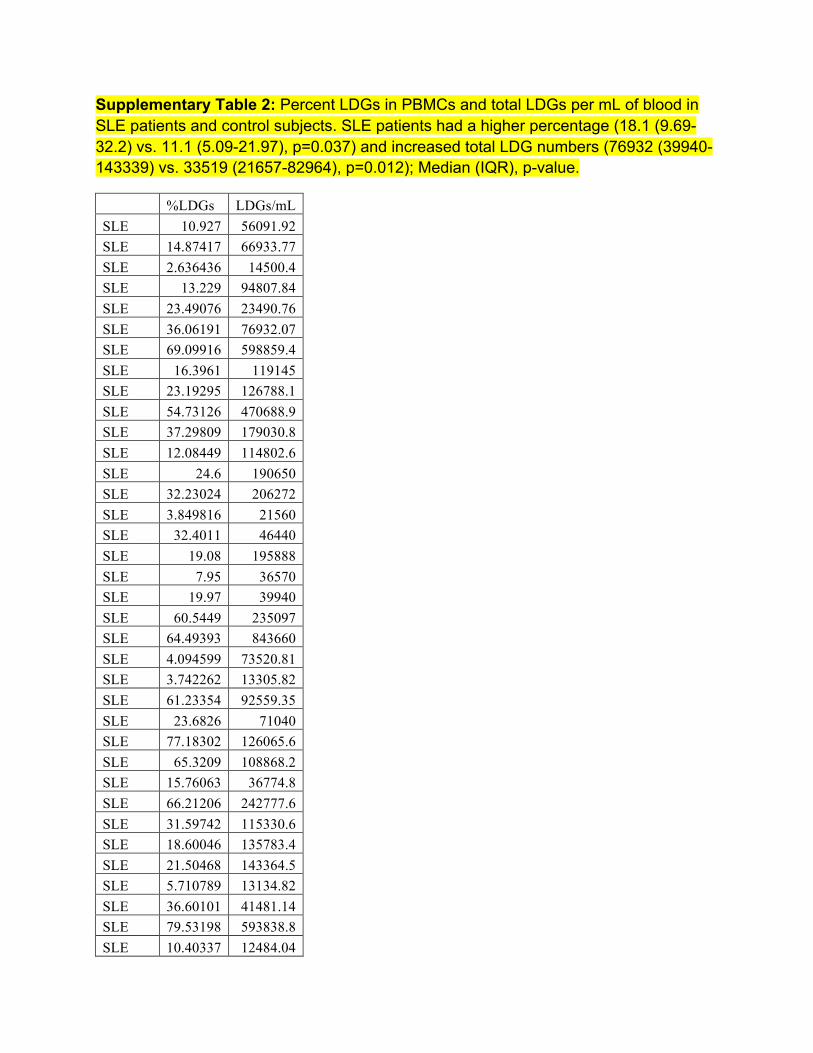
Supplementary Table 2: Percent LDGs in PBMCs and total LDGs per mL of blood in SLE patients and control subjects. SLE patients had a higher percentage (18.1 (9.69-32.2) vs. 11.1 (5.09-21.97), p=0.037) and increased total LDG numbers (76932 (39940-143339) vs. 33519 (21657-82964), p=0.012); Median (IQR), p-value.
%LDGs LDGs/mL SLE 10.927 56091.92 SLE 14.87417 66933.77 SLE 2.636436 14500.4 SLE 13.229 94807.84 SLE 23.49076 23490.76 SLE 36.06191 76932.07 SLE 69.09916 598859.4 SLE 16.3961 119145 SLE 23.19295 126788.1 SLE 54.73126 470688.9 SLE 37.29809 179030.8 SLE 12.08449 114802.6 SLE 24.6 190650 SLE 32.23024 206272 SLE 3.849816 21560 SLE 32.4011 46440 SLE 19.08 195888 SLE 7.95 36570 SLE 19.97 39940 SLE 60.5449 235097 SLE 64.49393 843660 SLE 4.094599 73520.81 SLE 3.742262 13305.82 SLE 61.23354 92559.35 SLE 23.6826 71040 SLE 77.18302 126065.6 SLE 65.3209 108868.2 SLE 15.76063 36774.8 SLE 66.21206 242777.6 SLE 31.59742 115330.6 SLE 18.60046 135783.4 SLE 21.50468 143364.5 SLE 5.710789 13134.82 SLE 36.60101 41481.14 SLE 79.53198 593838.8 SLE 10.40337 12484.04
SLE 23.21975 27863.7 SLE 2.027315 13684.38 SLE 13.7796 136418.1 SLE 21.90557 61335.6 SLE 12.62967 54728.56 SLE 12.51091 26272.91 SLE 44.48575 222428.7 SLE 5.37202 3357.512 SLE 7.692308 104615.4 SLE 28.25667 78249.23 SLE 6.301146 9451.718 SLE 22.6147 60305.86 SLE 15.8561 143339.1 SLE 47.75214 86749.73 SLE 18.10046 66609.68 SLE 13.73573 230760.3 SLE 9.691752 51172.45 SLE 9.503546 61582.98 SLE 8.251076 57427.49 SLE 11.3533 110354.1 SLE 9.067753 58214.98 SLE 20.22777 160203.9 SLE 1.718809 5775.198 SLE 1.054945 7342.418 SLE 10.97846 153918 Control 4.22325 25339.5 Control 11.17647 31666.67 Control 6.740967 27525.62 Control 6.233371 5713.924 Control 0.717036 35.85181 Control 11.49326 50570.36 Control 42.37427 529678.4 Control 15.33705 95089.74 Control 24.03277 71697.77 Control 18.00581 94230.4 Control 4.246087 17975.1 Control 31.14879 202467.1 Control 19.90943 28868.67 Control 29.31034 37614.94 Control 5.35248 36396.87 Control 14.77042 25355.89
Control 14.84468 10391.27 Control 26.1004 68296.06 Control 5.731978 30379.49 Control 34.73349 532580.2 Control 11.74917 45430.11 Control 0.546563 6449.443 Control 8.770079 35372.65 Control 18.73238 156103.1 Control 2.311461 3813.91 Control 0.514608 1363.712 Control 4.845397 31282.5 Control 25.34147 189750
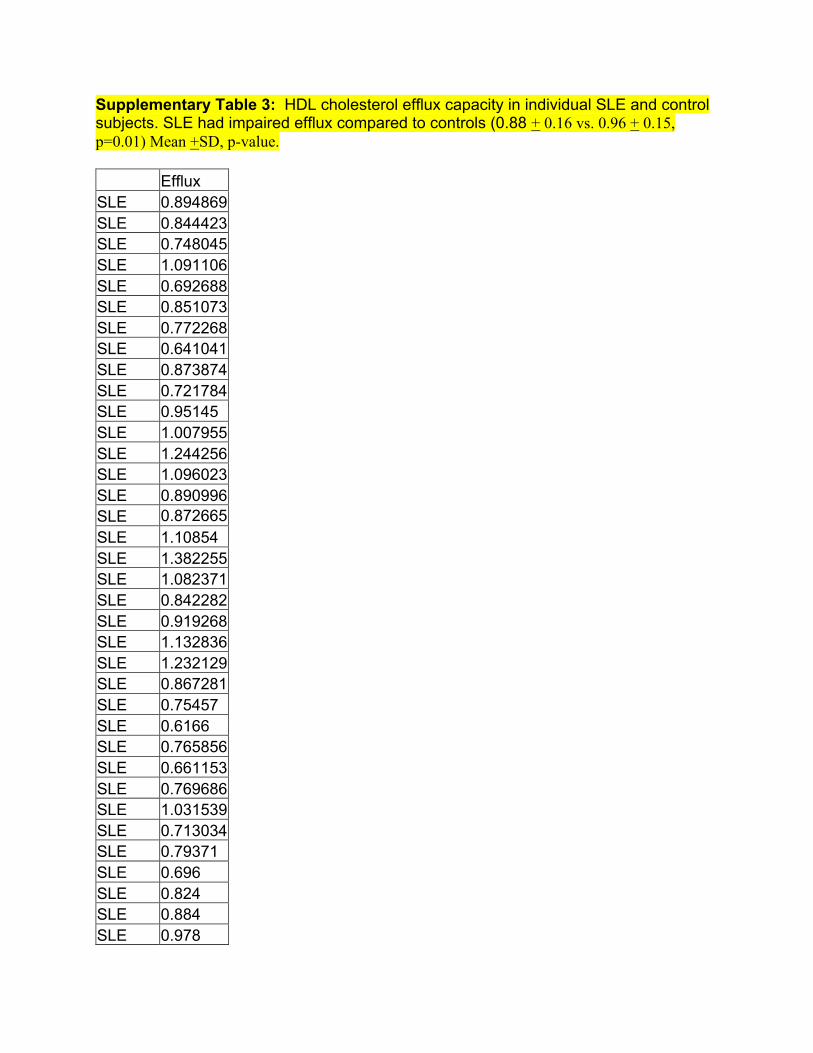
Supplementary Table 3: HDL cholesterol efflux capacity in individual SLE and control subjects. SLE had impaired efflux compared to controls (0.88 + 0.16 vs. 0.96 + 0.15, p=0.01) Mean +SD, p-value. Efflux SLE 0.894869 SLE 0.844423 SLE 0.748045 SLE 1.091106 SLE 0.692688 SLE 0.851073 SLE 0.772268 SLE 0.641041 SLE 0.873874 SLE 0.721784 SLE 0.95145 SLE 1.007955 SLE 1.244256 SLE 1.096023 SLE 0.890996 SLE 0.872665 SLE 1.10854 SLE 1.382255 SLE 1.082371 SLE 0.842282 SLE 0.919268 SLE 1.132836 SLE 1.232129 SLE 0.867281 SLE 0.75457 SLE 0.6166 SLE 0.765856 SLE 0.661153 SLE 0.769686 SLE 1.031539 SLE 0.713034 SLE 0.79371 SLE 0.696 SLE 0.824 SLE 0.884 SLE 0.978

SLE 0.702 SLE 0.911 SLE 0.872 SLE 0.891 SLE 0.703 SLE 0.796 SLE 0.751 SLE 0.819 SLE 0.849 SLE 0.96 SLE 0.756 SLE 0.7483 SLE 0.8297 SLE 0.76 SLE 0.707 SLE 0.924 SLE 1.056 SLE 0.8257 SLE 0.930351 SLE 0.710349 SLE 0.955941 SLE 0.877365 SLE 0.91422 SLE 0.819821 SLE 1.130696 SLE 1.039698 Control 0.88927 Control 0.952621 Control 0.91029 Control 0.856119 Control 0.862145 Control 0.931536 Control 1.147978 Control 0.808337 Control 0.951641 Control 0.886487 Control 0.765116 Control 0.826784 Control 1.018249 Control 0.84384 Control 0.820669
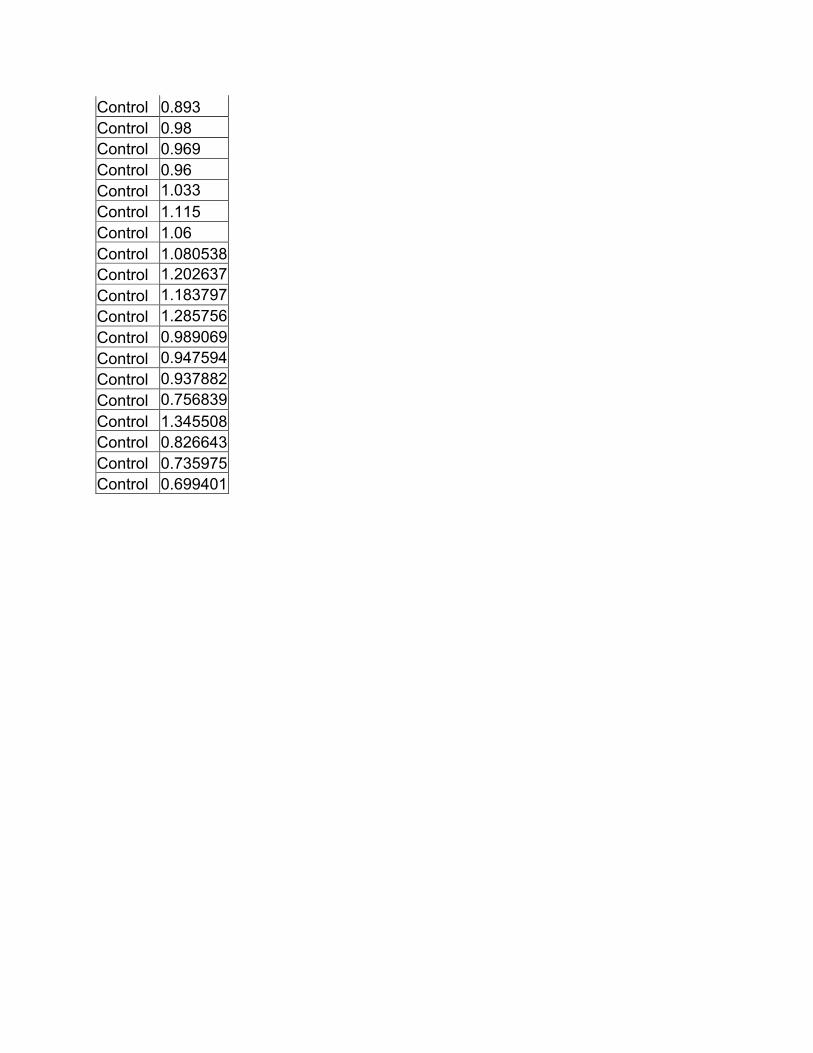
Control 0.893 Control 0.98 Control 0.969 Control 0.96 Control 1.033 Control 1.115 Control 1.06 Control 1.080538 Control 1.202637 Control 1.183797 Control 1.285756 Control 0.989069 Control 0.947594 Control 0.937882 Control 0.756839 Control 1.345508 Control 0.826643 Control 0.735975 Control 0.699401
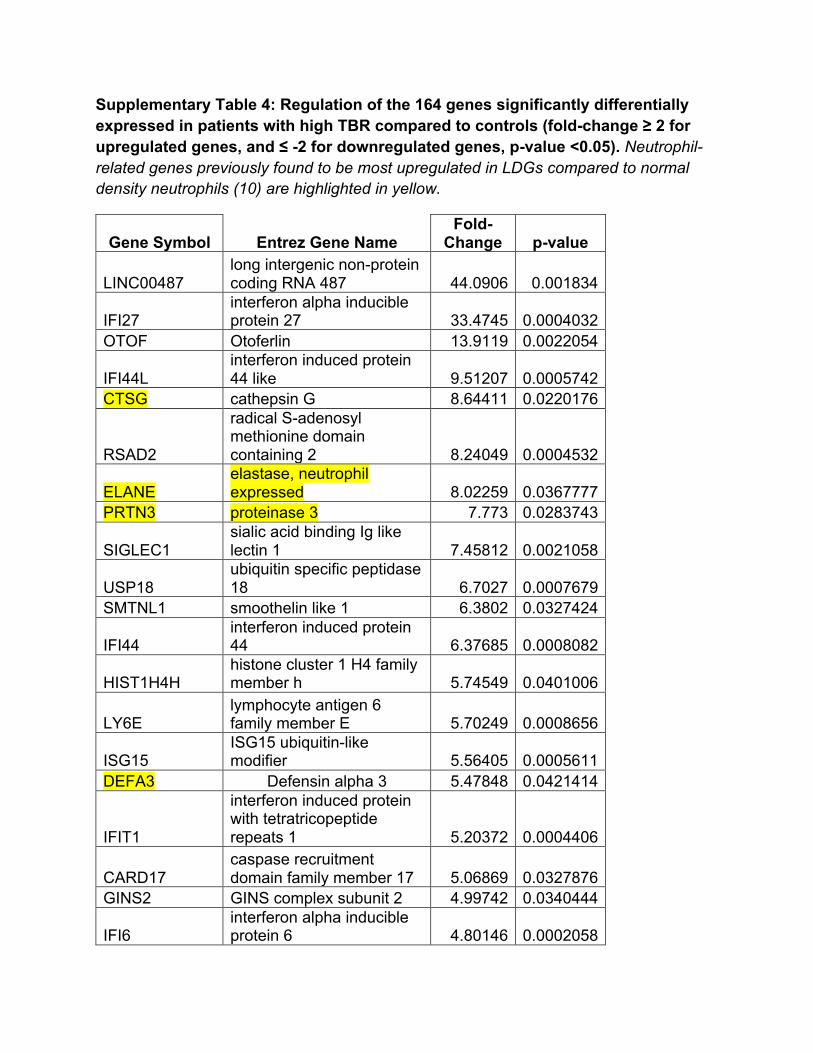
Supplementary Table 4: Regulation of the 164 genes significantly differentially expressed in patients with high TBR compared to controls (fold-change ≥ 2 for upregulated genes, and ≤ -2 for downregulated genes, p-value <0.05). Neutrophil-related genes previously found to be most upregulated in LDGs compared to normal density neutrophils (10) are highlighted in yellow.
Gene Symbol Entrez Gene Name Fold-
Change p-value
LINC00487 long intergenic non-protein coding RNA 487 44.0906 0.001834
IFI27 interferon alpha inducible protein 27 33.4745 0.0004032
OTOF Otoferlin 13.9119 0.0022054
IFI44L interferon induced protein 44 like 9.51207 0.0005742
CTSG cathepsin G 8.64411 0.0220176
RSAD2
radical S-adenosyl methionine domain containing 2 8.24049 0.0004532
ELANE elastase, neutrophil expressed 8.02259 0.0367777
PRTN3 proteinase 3 7.773 0.0283743
SIGLEC1 sialic acid binding Ig like lectin 1 7.45812 0.0021058
USP18 ubiquitin specific peptidase 18 6.7027 0.0007679
SMTNL1 smoothelin like 1 6.3802 0.0327424
IFI44 interferon induced protein 44 6.37685 0.0008082
HIST1H4H histone cluster 1 H4 family member h 5.74549 0.0401006
LY6E lymphocyte antigen 6 family member E 5.70249 0.0008656
ISG15 ISG15 ubiquitin-like modifier 5.56405 0.0005611
DEFA3 Defensin alpha 3 5.47848 0.0421414
IFIT1
interferon induced protein with tetratricopeptide repeats 1 5.20372 0.0004406
CARD17 caspase recruitment domain family member 17 5.06869 0.0327876
GINS2 GINS complex subunit 2 4.99742 0.0340444
IFI6 interferon alpha inducible protein 6 4.80146 0.0002058

OAS3 2'-5'-oligoadenylate synthetase 3 4.78287 0.0007621
MX1 MX dynamin like GTPase 1 4.63897 0.000307
CMPK2 cytidine/uridine monophosphate kinase 2 4.38393 0.0025508
OAS1 2'-5'-oligoadenylate synthetase 1 4.31363 0.0004776
HERC5
HECT and RLD domain containing E3 ubiquitin protein ligase 5 3.97082 0.0003245
NME1-NME2 NME1-NME2 readthrough 3.95781 0.035256
EPSTI1 epithelial stromal interaction 1 3.93409 0.0008329
RNASE1 ribonuclease A family member 1, pancreatic 3.87702 0.0167496
IFIT3
interferon induced protein with tetratricopeptide repeats 3 3.61292 0.0002006
RSPH9 radial spoke head 9 homolog 3.41443 0.0004396
XAF1 XIAP associated factor 1 3.33145 0.0002004
ZDHHC19 zinc finger DHHC-type containing 19 3.3264 0.0087313
TNNT1 troponin T1, slow skeletal type 3.29901 0.003575
OASL 2'-5'-oligoadenylate synthetase like 3.29828 0.0006313
HES4 hes family bHLH transcription factor 4 3.29083 0.0109374
OAS2 2'-5'-oligoadenylate synthetase 2 3.28672 0.0027644
SPATS2L
spermatogenesis associated serine rich 2 like 3.13646 0.0027561
AZU1 azurocidin 1 3.08357 0.0113821
ZWINT ZW10 interacting kinetochore protein 3.05582 7.409E-05
EMP1 epithelial membrane protein 1 3.02752 0.0002232
KLHDC7B kelch domain containing 7B 2.98983 0.0060807
LAMP3 lysosomal associated membrane protein 3 2.88073 0.0012879
CDC20 cell division cycle 20 2.86348 0.0201342 AGRN Agrin 2.86301 0.0047161
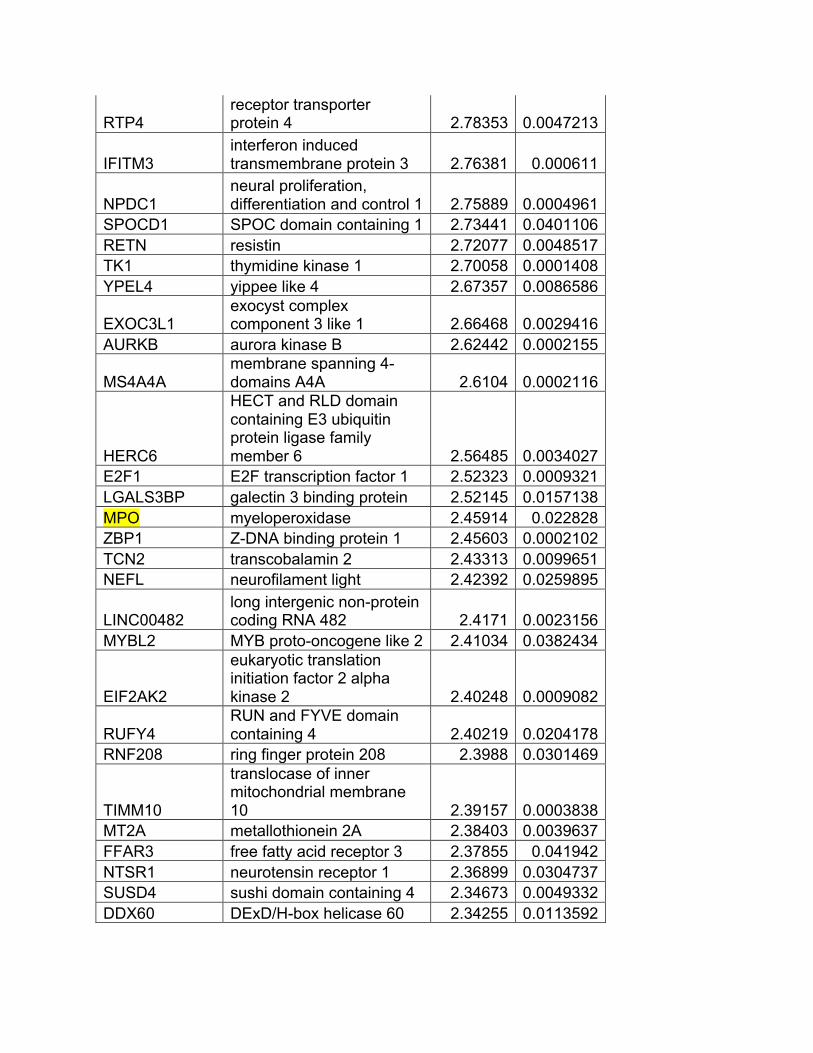
RTP4 receptor transporter protein 4 2.78353 0.0047213
IFITM3 interferon induced transmembrane protein 3 2.76381 0.000611
NPDC1 neural proliferation, differentiation and control 1 2.75889 0.0004961
SPOCD1 SPOC domain containing 1 2.73441 0.0401106 RETN resistin 2.72077 0.0048517 TK1 thymidine kinase 1 2.70058 0.0001408 YPEL4 yippee like 4 2.67357 0.0086586
EXOC3L1 exocyst complex component 3 like 1 2.66468 0.0029416
AURKB aurora kinase B 2.62442 0.0002155
MS4A4A membrane spanning 4-domains A4A 2.6104 0.0002116
HERC6
HECT and RLD domain containing E3 ubiquitin protein ligase family member 6 2.56485 0.0034027
E2F1 E2F transcription factor 1 2.52323 0.0009321 LGALS3BP galectin 3 binding protein 2.52145 0.0157138 MPO myeloperoxidase 2.45914 0.022828 ZBP1 Z-DNA binding protein 1 2.45603 0.0002102 TCN2 transcobalamin 2 2.43313 0.0099651 NEFL neurofilament light 2.42392 0.0259895
LINC00482 long intergenic non-protein coding RNA 482 2.4171 0.0023156
MYBL2 MYB proto-oncogene like 2 2.41034 0.0382434
EIF2AK2
eukaryotic translation initiation factor 2 alpha kinase 2 2.40248 0.0009082
RUFY4 RUN and FYVE domain containing 4 2.40219 0.0204178
RNF208 ring finger protein 208 2.3988 0.0301469
TIMM10
translocase of inner mitochondrial membrane 10 2.39157 0.0003838
MT2A metallothionein 2A 2.38403 0.0039637 FFAR3 free fatty acid receptor 3 2.37855 0.041942 NTSR1 neurotensin receptor 1 2.36899 0.0304737 SUSD4 sushi domain containing 4 2.34673 0.0049332 DDX60 DExD/H-box helicase 60 2.34255 0.0113592
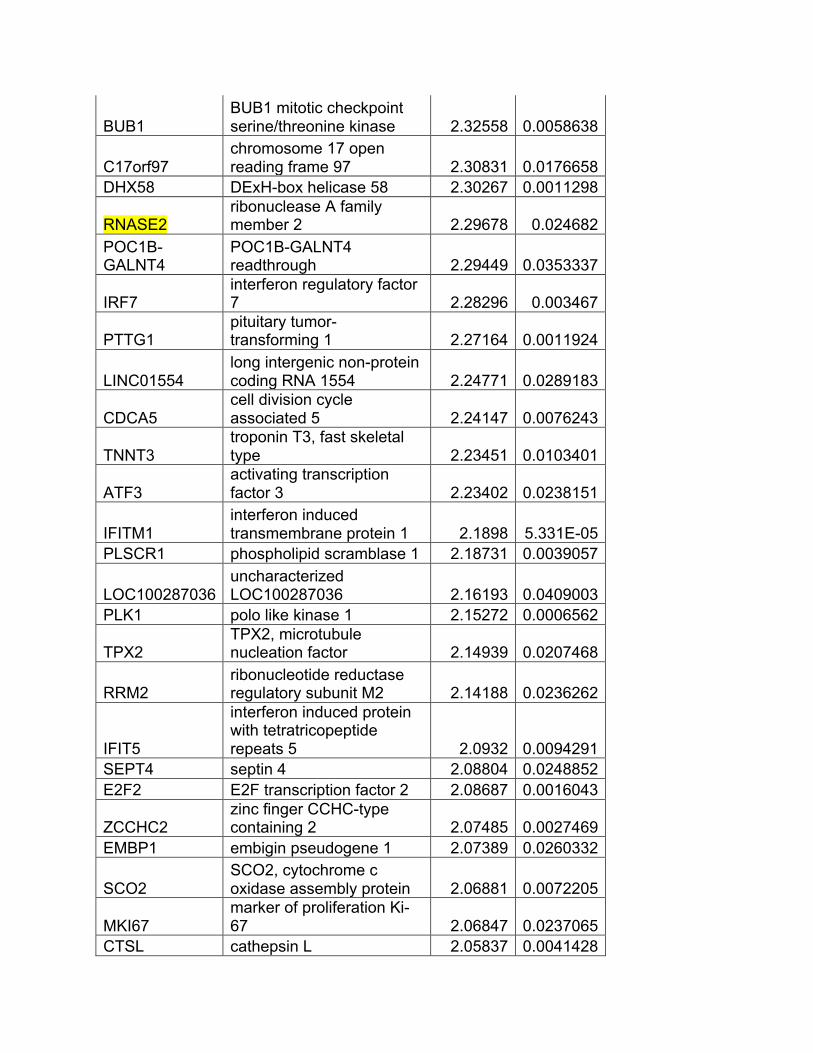
BUB1 BUB1 mitotic checkpoint serine/threonine kinase 2.32558 0.0058638
C17orf97 chromosome 17 open reading frame 97 2.30831 0.0176658
DHX58 DExH-box helicase 58 2.30267 0.0011298
RNASE2 ribonuclease A family member 2 2.29678 0.024682
POC1B-GALNT4
POC1B-GALNT4 readthrough 2.29449 0.0353337
IRF7 interferon regulatory factor 7 2.28296 0.003467
PTTG1 pituitary tumor-transforming 1 2.27164 0.0011924
LINC01554 long intergenic non-protein coding RNA 1554 2.24771 0.0289183
CDCA5 cell division cycle associated 5 2.24147 0.0076243
TNNT3 troponin T3, fast skeletal type 2.23451 0.0103401
ATF3 activating transcription factor 3 2.23402 0.0238151
IFITM1 interferon induced transmembrane protein 1 2.1898 5.331E-05
PLSCR1 phospholipid scramblase 1 2.18731 0.0039057
LOC100287036 uncharacterized LOC100287036 2.16193 0.0409003
PLK1 polo like kinase 1 2.15272 0.0006562
TPX2 TPX2, microtubule nucleation factor 2.14939 0.0207468
RRM2 ribonucleotide reductase regulatory subunit M2 2.14188 0.0236262
IFIT5
interferon induced protein with tetratricopeptide repeats 5 2.0932 0.0094291
SEPT4 septin 4 2.08804 0.0248852 E2F2 E2F transcription factor 2 2.08687 0.0016043
ZCCHC2 zinc finger CCHC-type containing 2 2.07485 0.0027469
EMBP1 embigin pseudogene 1 2.07389 0.0260332
SCO2 SCO2, cytochrome c oxidase assembly protein 2.06881 0.0072205
MKI67 marker of proliferation Ki-67 2.06847 0.0237065
CTSL cathepsin L 2.05837 0.0041428
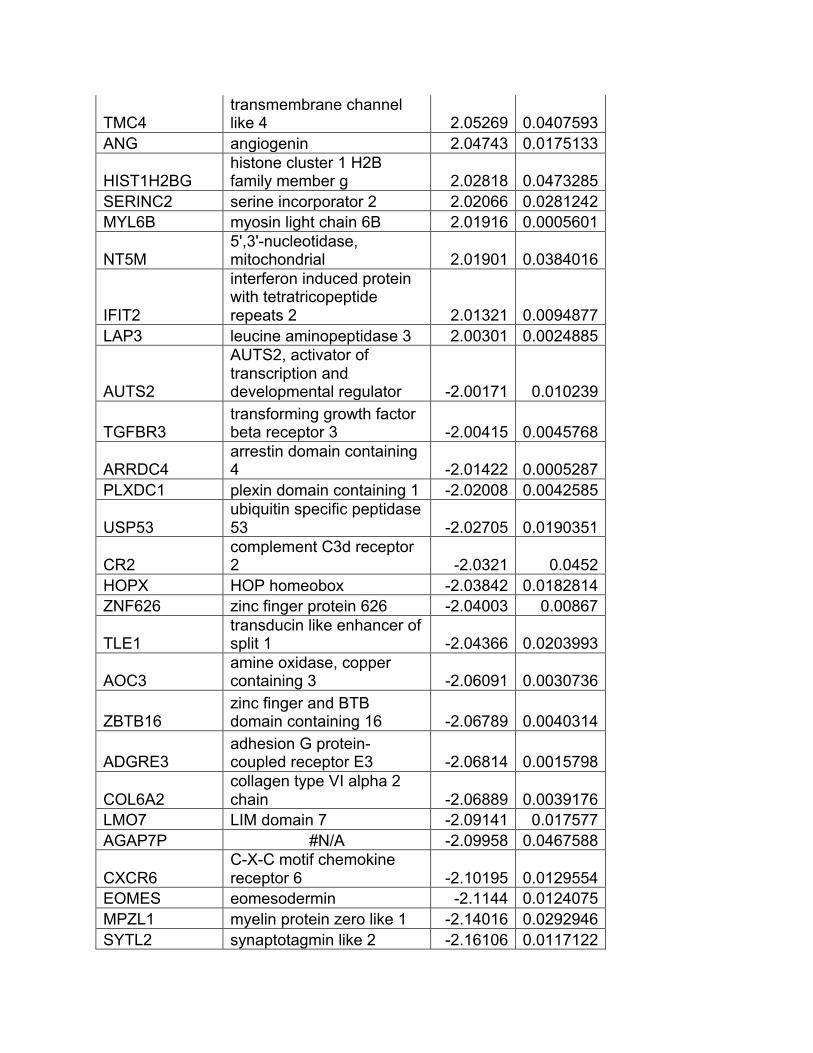
TMC4 transmembrane channel like 4 2.05269 0.0407593
ANG angiogenin 2.04743 0.0175133
HIST1H2BG histone cluster 1 H2B family member g 2.02818 0.0473285
SERINC2 serine incorporator 2 2.02066 0.0281242 MYL6B myosin light chain 6B 2.01916 0.0005601
NT5M 5',3'-nucleotidase, mitochondrial 2.01901 0.0384016
IFIT2
interferon induced protein with tetratricopeptide repeats 2 2.01321 0.0094877
LAP3 leucine aminopeptidase 3 2.00301 0.0024885
AUTS2
AUTS2, activator of transcription and developmental regulator -2.00171 0.010239
TGFBR3 transforming growth factor beta receptor 3 -2.00415 0.0045768
ARRDC4 arrestin domain containing 4 -2.01422 0.0005287
PLXDC1 plexin domain containing 1 -2.02008 0.0042585
USP53 ubiquitin specific peptidase 53 -2.02705 0.0190351
CR2 complement C3d receptor 2 -2.0321 0.0452
HOPX HOP homeobox -2.03842 0.0182814 ZNF626 zinc finger protein 626 -2.04003 0.00867
TLE1 transducin like enhancer of split 1 -2.04366 0.0203993
AOC3 amine oxidase, copper containing 3 -2.06091 0.0030736
ZBTB16 zinc finger and BTB domain containing 16 -2.06789 0.0040314
ADGRE3 adhesion G protein-coupled receptor E3 -2.06814 0.0015798
COL6A2 collagen type VI alpha 2 chain -2.06889 0.0039176
LMO7 LIM domain 7 -2.09141 0.017577 AGAP7P #N/A -2.09958 0.0467588
CXCR6 C-X-C motif chemokine receptor 6 -2.10195 0.0129554
EOMES eomesodermin -2.1144 0.0124075 MPZL1 myelin protein zero like 1 -2.14016 0.0292946 SYTL2 synaptotagmin like 2 -2.16106 0.0117122

BANK1 B-cell scaffold protein with ankyrin repeats 1 -2.20616 0.0231729
HLA-DOB major histocompatibility complex, class II, DO beta -2.20881 0.0063869
ABCB1 ATP binding cassette subfamily B member 1 -2.22733 0.0076762
NOG noggin -2.23711 0.0367173 ZNF595 zinc finger protein 595 -2.24208 0.0044803
CHST10 carbohydrate sulfotransferase 10 -2.25316 0.0028181
CD200 CD200 molecule -2.32324 0.0320995 FCRLA Fc receptor like A -2.3389 0.0453378
MS4A1 membrane spanning 4-domains A1 -2.3578 0.0447481
ZNF141 zinc finger protein 141 -2.36222 0.0308683
TP53INP2 tumor protein p53 inducible nuclear protein 2 -2.3645 0.000272
LOC100132111 uncharacterized LOC100132111 -2.42448 0.007236
MYBL1 MYB proto-oncogene like 1 -2.43392 0.0095491
DLG5 discs large MAGUK scaffold protein 5 -2.44281 0.0009586
LGALS4 galectin 4 -2.45572 9.946E-05
FCER2 Fc fragment of IgE receptor II -2.482 0.0385009
ISL2 ISL LIM homeobox 2 -2.50256 0.0095004
SIGLEC17P sialic acid binding Ig like lectin 17, pseudogene -2.51019 0.0005958
AFF3 AF4/FMR2 family member 3 -2.5195 0.0067812
FCGBP Fc fragment of IgG binding protein -2.54779 0.0196559
LINC00926 long intergenic non-protein coding RNA 926 -2.57542 0.01652
SETDB2-PHF11
SETDB2-PHF11 readthrough -2.60491 0.0459943
TNFRSF13C TNF receptor superfamily member 13C -2.67791 0.0177334
KLRF1 killer cell lectin like receptor F1 -2.79779 0.0286004
TSPAN13 tetraspanin 13 -2.84515 0.0028523
FAM129C family with sequence similarity 129 member C -2.92415 0.0187868
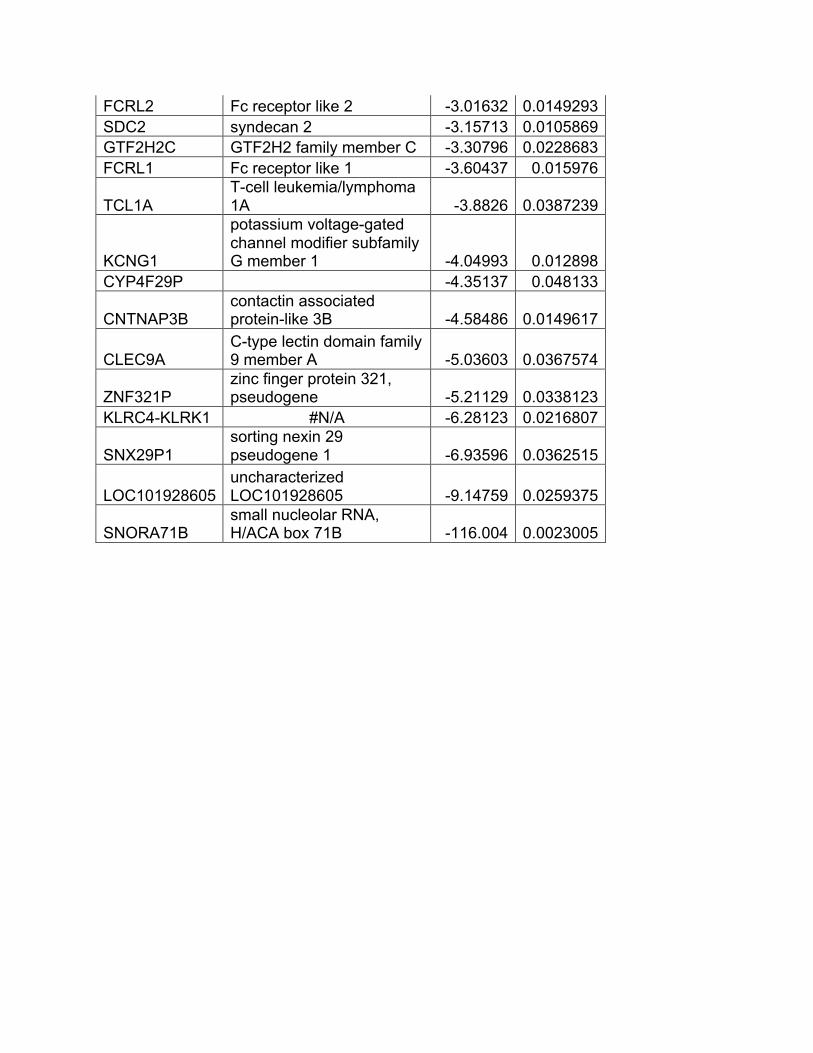
FCRL2 Fc receptor like 2 -3.01632 0.0149293 SDC2 syndecan 2 -3.15713 0.0105869 GTF2H2C GTF2H2 family member C -3.30796 0.0228683 FCRL1 Fc receptor like 1 -3.60437 0.015976
TCL1A T-cell leukemia/lymphoma 1A -3.8826 0.0387239
KCNG1
potassium voltage-gated channel modifier subfamily G member 1 -4.04993 0.012898
CYP4F29P -4.35137 0.048133
CNTNAP3B contactin associated protein-like 3B -4.58486 0.0149617
CLEC9A C-type lectin domain family 9 member A -5.03603 0.0367574
ZNF321P zinc finger protein 321, pseudogene -5.21129 0.0338123
KLRC4-KLRK1 #N/A -6.28123 0.0216807
SNX29P1 sorting nexin 29 pseudogene 1 -6.93596 0.0362515
LOC101928605 uncharacterized LOC101928605 -9.14759 0.0259375
SNORA71B small nucleolar RNA, H/ACA box 71B -116.004 0.0023005
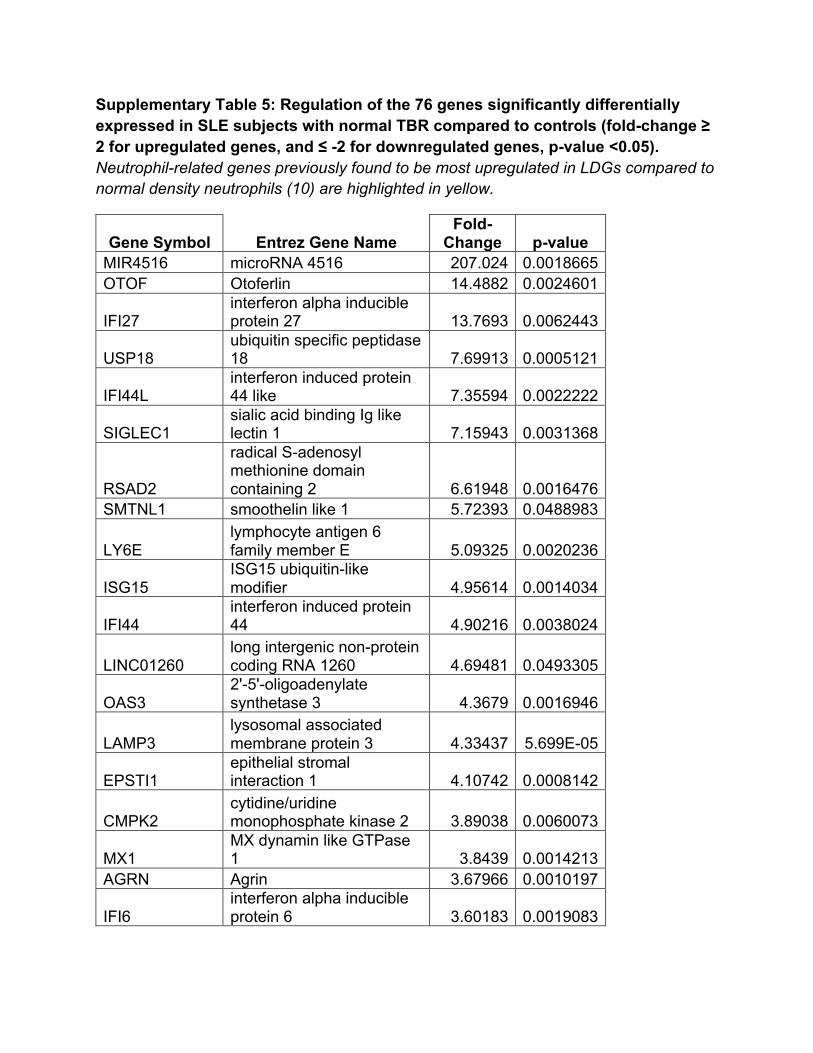
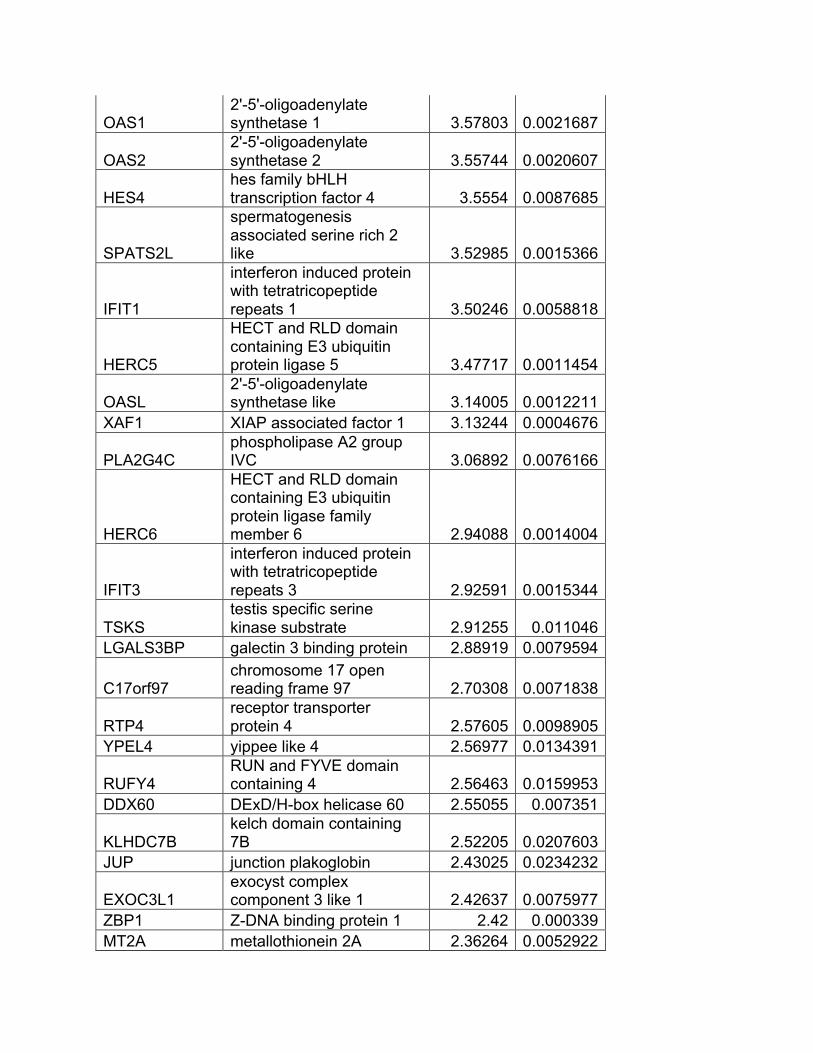
Supplementary Table 5: Regulation of the 76 genes significantly differentially expressed in SLE subjects with normal TBR compared to controls (fold-change ≥ 2 for upregulated genes, and ≤ -2 for downregulated genes, p-value <0.05). Neutrophil-related genes previously found to be most upregulated in LDGs compared to normal density neutrophils (10) are highlighted in yellow.
Gene Symbol Entrez Gene Name Fold-
Change p-value MIR4516 microRNA 4516 207.024 0.0018665 OTOF Otoferlin 14.4882 0.0024601
IFI27 interferon alpha inducible protein 27 13.7693 0.0062443
USP18 ubiquitin specific peptidase 18 7.69913 0.0005121
IFI44L interferon induced protein 44 like 7.35594 0.0022222
SIGLEC1 sialic acid binding Ig like lectin 1 7.15943 0.0031368
RSAD2
radical S-adenosyl methionine domain containing 2 6.61948 0.0016476
SMTNL1 smoothelin like 1 5.72393 0.0488983
LY6E lymphocyte antigen 6 family member E 5.09325 0.0020236
ISG15 ISG15 ubiquitin-like modifier 4.95614 0.0014034
IFI44 interferon induced protein 44 4.90216 0.0038024
LINC01260 long intergenic non-protein coding RNA 1260 4.69481 0.0493305
OAS3 2'-5'-oligoadenylate synthetase 3 4.3679 0.0016946
LAMP3 lysosomal associated membrane protein 3 4.33437 5.699E-05
EPSTI1 epithelial stromal interaction 1 4.10742 0.0008142
CMPK2 cytidine/uridine monophosphate kinase 2 3.89038 0.0060073
MX1 MX dynamin like GTPase 1 3.8439 0.0014213
AGRN Agrin 3.67966 0.0010197
IFI6 interferon alpha inducible protein 6 3.60183 0.0019083
OAS1 2'-5'-oligoadenylate synthetase 1 3.57803 0.0021687
OAS2 2'-5'-oligoadenylate synthetase 2 3.55744 0.0020607
HES4 hes family bHLH transcription factor 4 3.5554 0.0087685
SPATS2L
spermatogenesis associated serine rich 2 like 3.52985 0.0015366
IFIT1
interferon induced protein with tetratricopeptide repeats 1 3.50246 0.0058818
HERC5
HECT and RLD domain containing E3 ubiquitin protein ligase 5 3.47717 0.0011454
OASL 2'-5'-oligoadenylate synthetase like 3.14005 0.0012211
XAF1 XIAP associated factor 1 3.13244 0.0004676
PLA2G4C phospholipase A2 group IVC 3.06892 0.0076166
HERC6
HECT and RLD domain containing E3 ubiquitin protein ligase family member 6 2.94088 0.0014004
IFIT3
interferon induced protein with tetratricopeptide repeats 3 2.92591 0.0015344
TSKS testis specific serine kinase substrate 2.91255 0.011046
LGALS3BP galectin 3 binding protein 2.88919 0.0079594
C17orf97 chromosome 17 open reading frame 97 2.70308 0.0071838
RTP4 receptor transporter protein 4 2.57605 0.0098905
YPEL4 yippee like 4 2.56977 0.0134391
RUFY4 RUN and FYVE domain containing 4 2.56463 0.0159953
DDX60 DExD/H-box helicase 60 2.55055 0.007351
KLHDC7B kelch domain containing 7B 2.52205 0.0207603
JUP junction plakoglobin 2.43025 0.0234232
EXOC3L1 exocyst complex component 3 like 1 2.42637 0.0075977
ZBP1 Z-DNA binding protein 1 2.42 0.000339 MT2A metallothionein 2A 2.36264 0.0052922

RSPH9 radial spoke head 9 homolog 2.36002 0.0102893
POC1B-GALNT4
POC1B-GALNT4 readthrough 2.34006 0.0361989
GSDMA gasdermin A 2.32901 0.0101089
TMEM119 transmembrane protein 119 2.32564 0.0166203
NR4A1 nuclear receptor subfamily 4 group A member 1 2.27033 0.0240068
DHX58 DExH-box helicase 58 2.24673 0.0018873
IRF7 interferon regulatory factor 7 2.23983 0.0051221
TIMM10
translocase of inner mitochondrial membrane 10 2.23568 0.0010999
ZCCHC2 zinc finger CCHC-type containing 2 2.22568 0.001621
ATF3 activating transcription factor 3 2.19391 0.0308876
RNF157-AS1 RNF157 antisense RNA 1 2.18341 0.01954 TCEB3-AS1 #N/A 2.17046 0.0383309
LOC554206
leucine carboxyl methyltransferase 1 pseudogene 2.17032 0.0141568
GAS6-AS1 GAS6 antisense RNA 1 2.16839 0.0216209
EIF2AK2
eukaryotic translation initiation factor 2 alpha kinase 2 2.09441 0.004749
LAP3 leucine aminopeptidase 3 2.08173 0.0020162 MAMDC4 MAM domain containing 4 2.04431 0.0071912
IFITM3 interferon induced transmembrane protein 3 2.01909 0.0135809
IFI35 interferon induced protein 35 2.014 0.0084892
PLSCR1 phospholipid scramblase 1 2.01177 0.0104786 PLB1 phospholipase B1 -2.00322 0.0022645
AOC2 amine oxidase, copper containing 2 -2.05283 0.0014785
SULT1B1 sulfotransferase family 1B member 1 -2.06165 0.0112251
CHI3L1 chitinase 3 like 1 -2.09763 0.0488975
IL1RAP interleukin 1 receptor accessory protein -2.10605 0.005016
MMP9 matrix metallopeptidase 9 -2.11412 0.045932
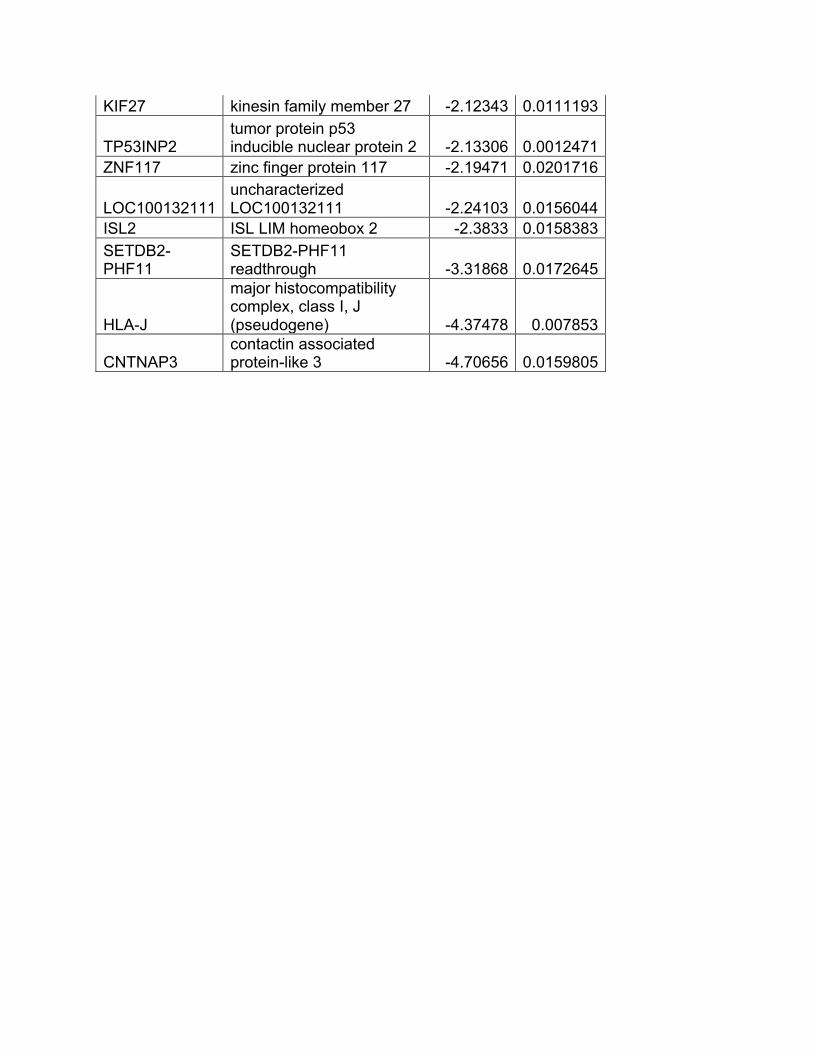
KIF27 kinesin family member 27 -2.12343 0.0111193
TP53INP2 tumor protein p53 inducible nuclear protein 2 -2.13306 0.0012471
ZNF117 zinc finger protein 117 -2.19471 0.0201716
LOC100132111 uncharacterized LOC100132111 -2.24103 0.0156044
ISL2 ISL LIM homeobox 2 -2.3833 0.0158383 SETDB2-PHF11
SETDB2-PHF11 readthrough -3.31868 0.0172645
HLA-J
major histocompatibility complex, class I, J (pseudogene) -4.37478 0.007853
CNTNAP3 contactin associated protein-like 3 -4.70656 0.0159805

Supplementary Table 6: Regulation of the 98 genes significantly differentially expressed in SLE subjects with high TBR compared to SLE subjects with normal TBR (fold-change ≥ 2 for upregulated genes, and ≤ -2 for downregulated genes, p-value <0.05). Neutrophil-related genes previously found to be most upregulated in LDGs compared to normal density neutrophils (10) are highlighted in yellow.
Gene Symbol Entrez Gene Name Fold-
Change p-value
RAP1GAP RAP1 GTPase activating protein 12.2513 0.0011236
ACKR1
atypical chemokine receptor 1 (Duffy blood group) 7.17989 0.0494747
IPO11-LRRC70 IPO11-LRRC70 readthrough 6.39057 0.0486009
NME1-NME2 NME1-NME2 readthrough 5.71053 0.0094959
AOC1 amine oxidase, copper containing 1 5.25165 0.0316878
C1QC complement C1q C chain 3.82905 0.0260316
RNASE1 ribonuclease A family member 1, pancreatic 3.78119 0.0186116
C1QB complement C1q B chain 3.70518 0.0337536
ALAS2 5'-aminolevulinate synthase 2 3.5751 0.0194871
NEFL neurofilament light 3.33801 0.00367 MYL9 myosin light chain 9 3.24511 0.0185717 LOC400927-CSNK1E
LOC400927-CSNK1E readthrough 2.95737 0.016411
CBS #N/A 2.91948 0.0115694
TNNT1 troponin T1, slow skeletal type 2.59557 0.0161264
SERPINB2 serpin family B member 2 2.36446 0.0070791 E2F1 E2F transcription factor 1 2.36132 0.0018068
GPR146 G protein-coupled receptor 146 2.35633 0.0419564
XK X-linked Kx blood group 2.2951 0.0456607
TMEM158 transmembrane protein 158 (gene/pseudogene) 2.24354 0.0384103
FAM210B family with sequence similarity 210 member B 2.21956 0.0396648
FKBP1B FK506 binding protein 1B 2.20727 0.0097638
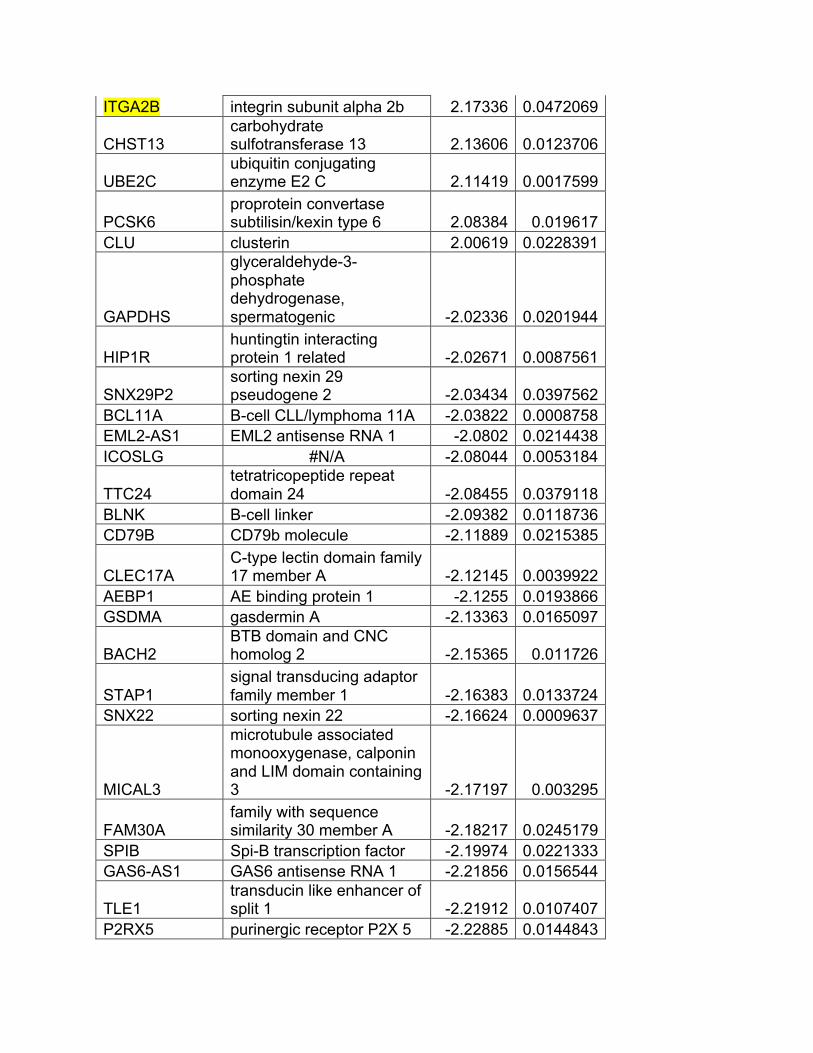
ITGA2B integrin subunit alpha 2b 2.17336 0.0472069
CHST13 carbohydrate sulfotransferase 13 2.13606 0.0123706
UBE2C ubiquitin conjugating enzyme E2 C 2.11419 0.0017599
PCSK6 proprotein convertase subtilisin/kexin type 6 2.08384 0.019617
CLU clusterin 2.00619 0.0228391
GAPDHS
glyceraldehyde-3-phosphate dehydrogenase, spermatogenic -2.02336 0.0201944
HIP1R huntingtin interacting protein 1 related -2.02671 0.0087561
SNX29P2 sorting nexin 29 pseudogene 2 -2.03434 0.0397562
BCL11A B-cell CLL/lymphoma 11A -2.03822 0.0008758 EML2-AS1 EML2 antisense RNA 1 -2.0802 0.0214438 ICOSLG #N/A -2.08044 0.0053184
TTC24 tetratricopeptide repeat domain 24 -2.08455 0.0379118
BLNK B-cell linker -2.09382 0.0118736 CD79B CD79b molecule -2.11889 0.0215385
CLEC17A C-type lectin domain family 17 member A -2.12145 0.0039922
AEBP1 AE binding protein 1 -2.1255 0.0193866 GSDMA gasdermin A -2.13363 0.0165097
BACH2 BTB domain and CNC homolog 2 -2.15365 0.011726
STAP1 signal transducing adaptor family member 1 -2.16383 0.0133724
SNX22 sorting nexin 22 -2.16624 0.0009637
MICAL3
microtubule associated monooxygenase, calponin and LIM domain containing 3 -2.17197 0.003295
FAM30A family with sequence similarity 30 member A -2.18217 0.0245179
SPIB Spi-B transcription factor -2.19974 0.0221333 GAS6-AS1 GAS6 antisense RNA 1 -2.21856 0.0156544
TLE1 transducin like enhancer of split 1 -2.21912 0.0107407
P2RX5 purinergic receptor P2X 5 -2.22885 0.0144843

PLA2G4C phospholipase A2 group IVC -2.24379 0.0403552
LOC100130950 uncharacterized LOC100130950 -2.27122 0.0091084
ZNF667-AS1 ZNF667 antisense RNA 1 (head to head) -2.30202 0.011874
ABCA11P
ATP binding cassette subfamily A member 11, pseudogene -2.32612 0.0082822
HLA-DOA
major histocompatibility complex, class II, DO alpha -2.3352 0.0075272
DBNDD1 dysbindin domain containing 1 -2.33702 0.0041806
ZNF879 zinc finger protein 879 -2.34819 0.0040934 BCL7A BCL tumor suppressor 7A -2.35816 0.0136881 FCRL3 Fc receptor like 3 -2.35999 0.0142624
KCNIP2
potassium voltage-gated channel interacting protein 2 -2.39186 0.0005959
TCEB3-AS1 #N/A -2.39528 0.0180253
HLA-DQA1
major histocompatibility complex, class II, DQ alpha 1 -2.4018 0.0121206
CR2 complement C3d receptor 2 -2.43805 0.014022
FCRL5 Fc receptor like 5 -2.47554 0.0490623 MIR600HG MIR600 host gene -2.49213 0.0178518
CXCR5 C-X-C motif chemokine receptor 5 -2.49828 0.0182383
CD72 CD72 molecule -2.53022 0.0110999
BANK1 B-cell scaffold protein with ankyrin repeats 1 -2.54048 0.008778
CD79A CD79a molecule -2.55884 0.0136311
HLA-DOB major histocompatibility complex, class II, DO beta -2.58171 0.0015646
MS4A1 membrane spanning 4-domains A1 -2.59812 0.027022
LGR6
leucine rich repeat containing G protein-coupled receptor 6 -2.60156 0.0438116
TSPAN13 tetraspanin 13 -2.61539 0.0053964 N4BP3 NEDD4 binding protein 3 -2.63737 0.0008537 LGALS4 galectin 4 -2.73789 2.483E-05
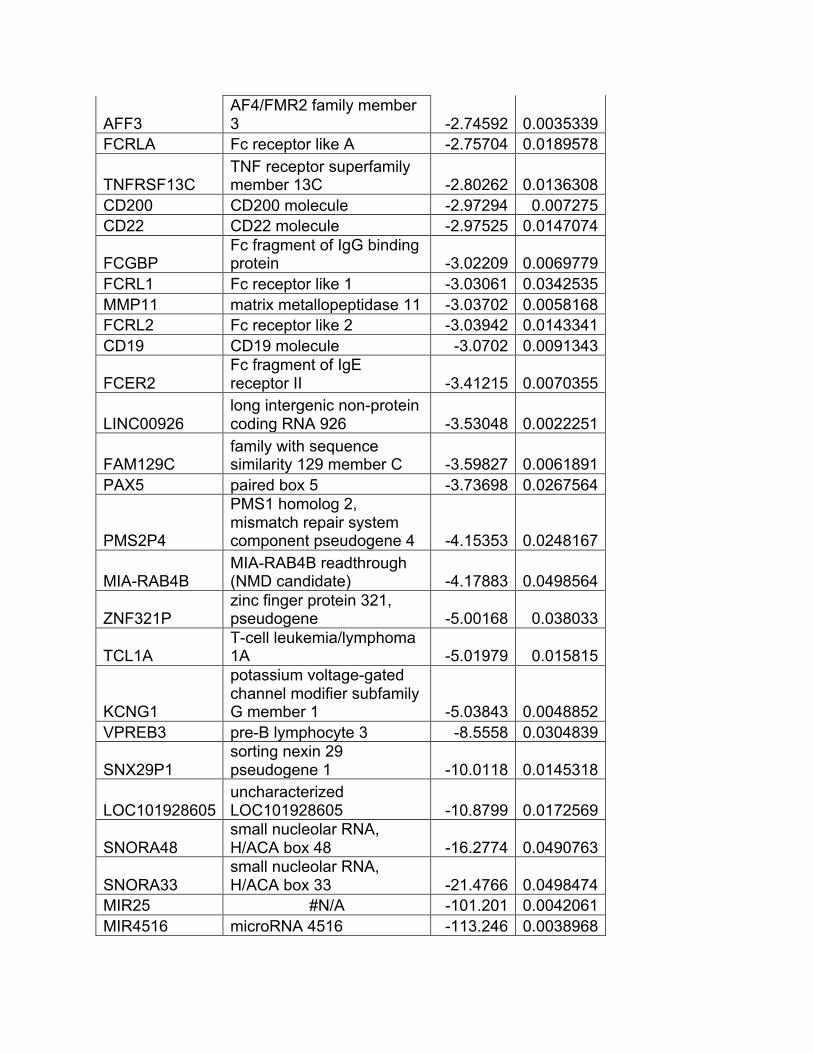
AFF3 AF4/FMR2 family member 3 -2.74592 0.0035339
FCRLA Fc receptor like A -2.75704 0.0189578
TNFRSF13C TNF receptor superfamily member 13C -2.80262 0.0136308
CD200 CD200 molecule -2.97294 0.007275 CD22 CD22 molecule -2.97525 0.0147074
FCGBP Fc fragment of IgG binding protein -3.02209 0.0069779
FCRL1 Fc receptor like 1 -3.03061 0.0342535 MMP11 matrix metallopeptidase 11 -3.03702 0.0058168 FCRL2 Fc receptor like 2 -3.03942 0.0143341 CD19 CD19 molecule -3.0702 0.0091343
FCER2 Fc fragment of IgE receptor II -3.41215 0.0070355
LINC00926 long intergenic non-protein coding RNA 926 -3.53048 0.0022251
FAM129C family with sequence similarity 129 member C -3.59827 0.0061891
PAX5 paired box 5 -3.73698 0.0267564
PMS2P4
PMS1 homolog 2, mismatch repair system component pseudogene 4 -4.15353 0.0248167
MIA-RAB4B MIA-RAB4B readthrough (NMD candidate) -4.17883 0.0498564
ZNF321P zinc finger protein 321, pseudogene -5.00168 0.038033
TCL1A T-cell leukemia/lymphoma 1A -5.01979 0.015815
KCNG1
potassium voltage-gated channel modifier subfamily G member 1 -5.03843 0.0048852
VPREB3 pre-B lymphocyte 3 -8.5558 0.0304839
SNX29P1 sorting nexin 29 pseudogene 1 -10.0118 0.0145318
LOC101928605 uncharacterized LOC101928605 -10.8799 0.0172569
SNORA48 small nucleolar RNA, H/ACA box 48 -16.2774 0.0490763
SNORA33 small nucleolar RNA, H/ACA box 33 -21.4766 0.0498474
MIR25 #N/A -101.201 0.0042061 MIR4516 microRNA 4516 -113.246 0.0038968
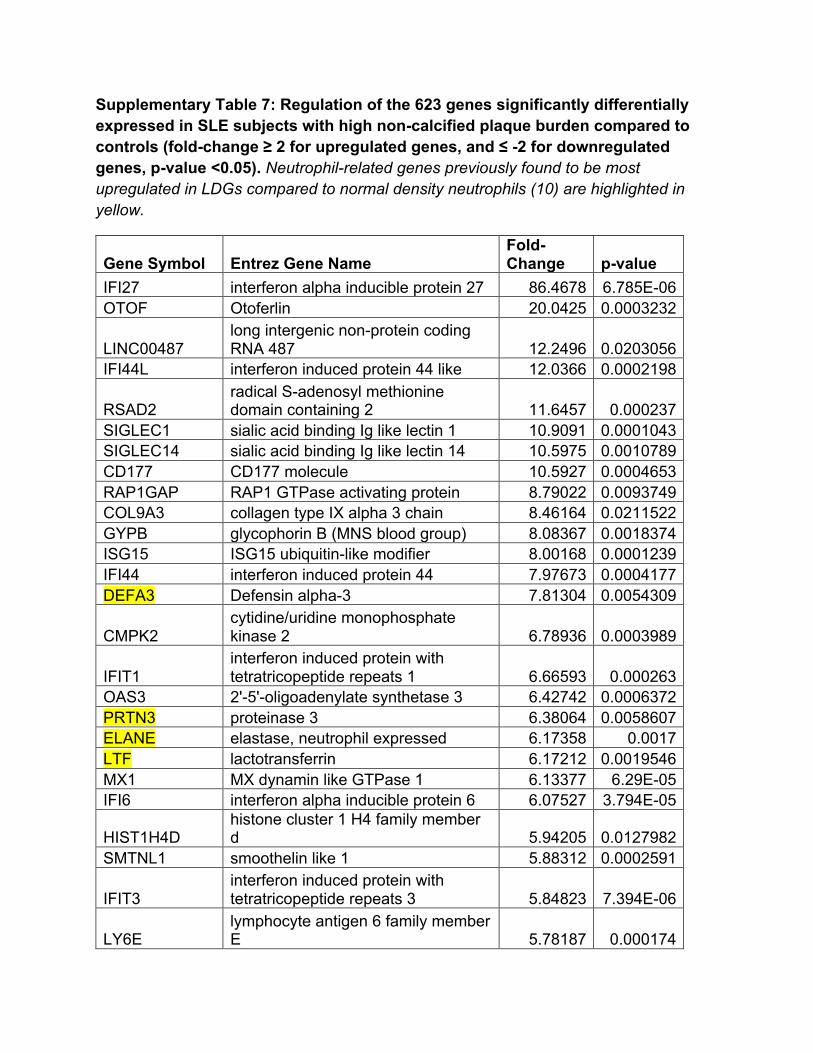
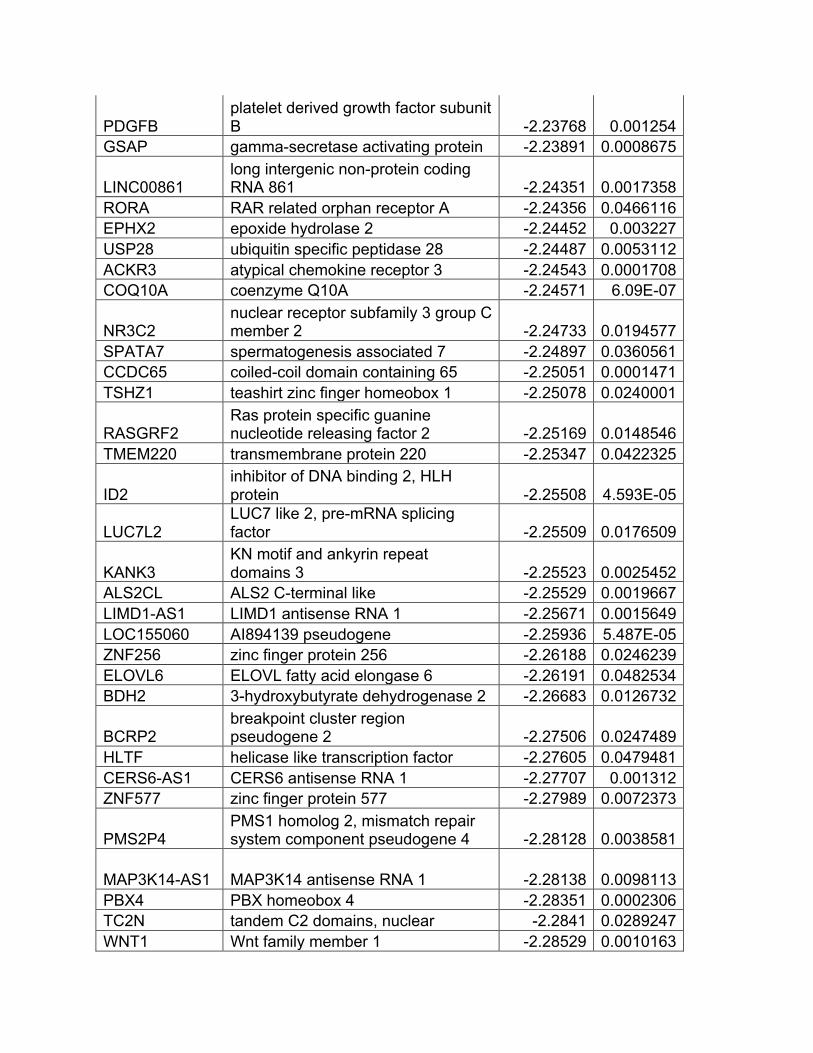
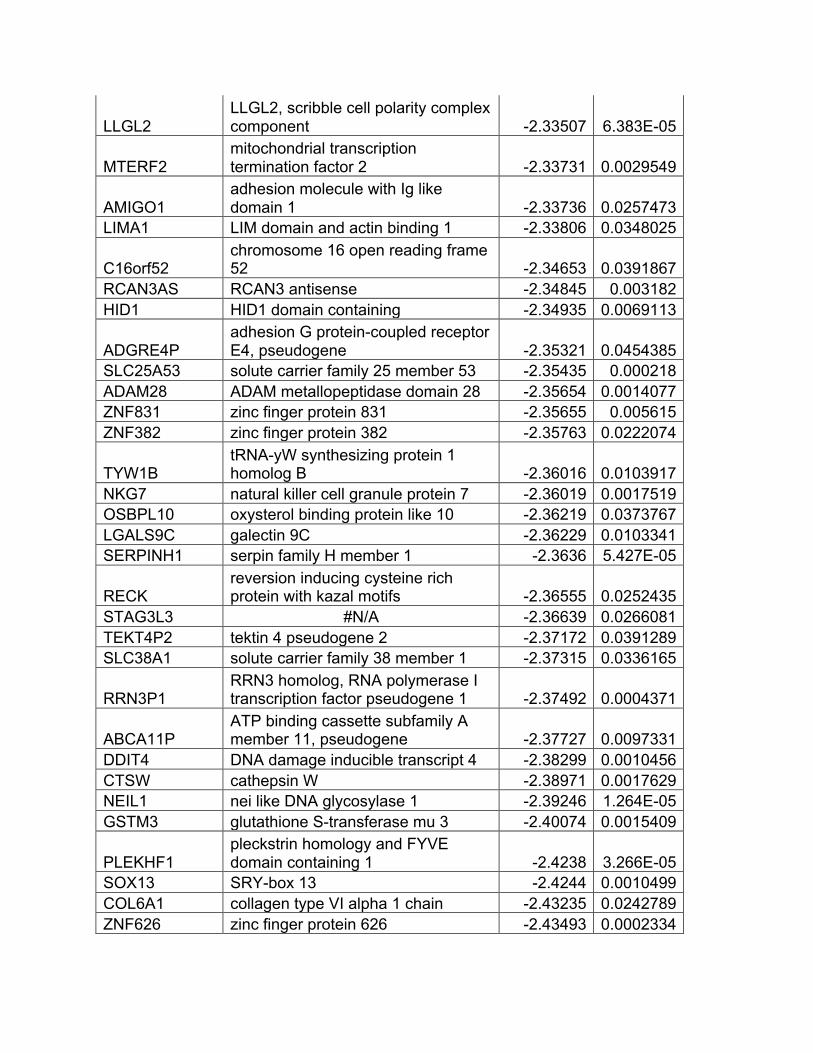
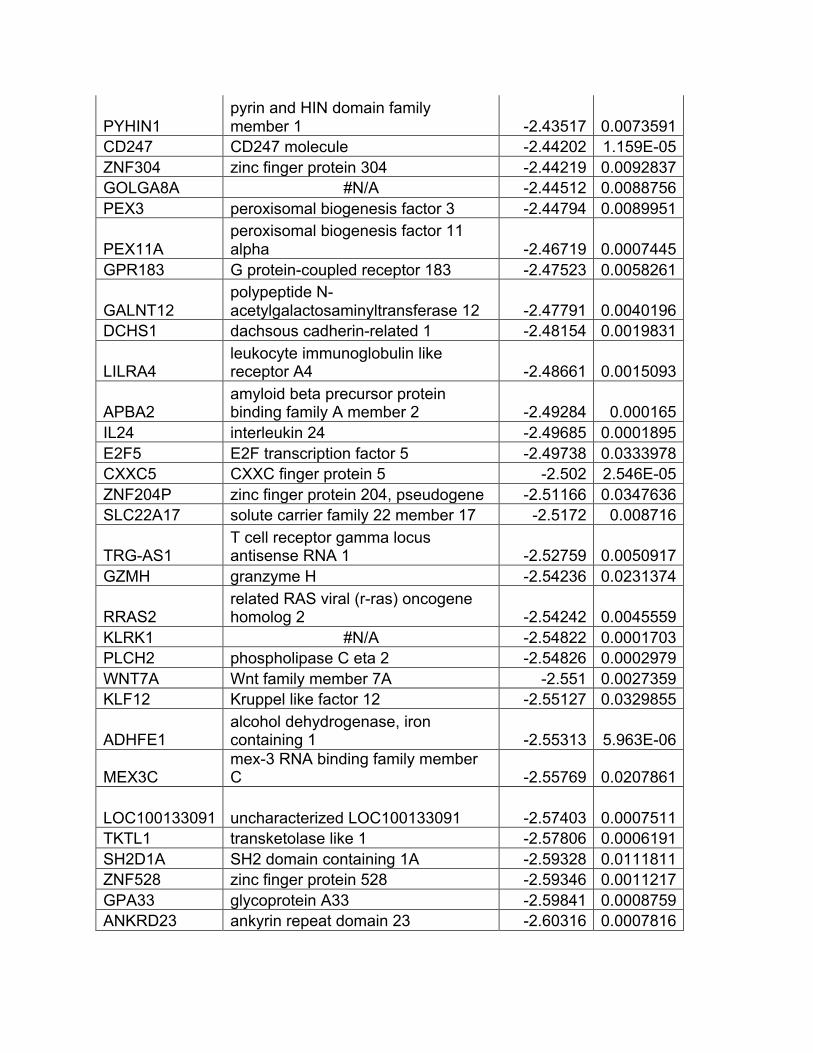
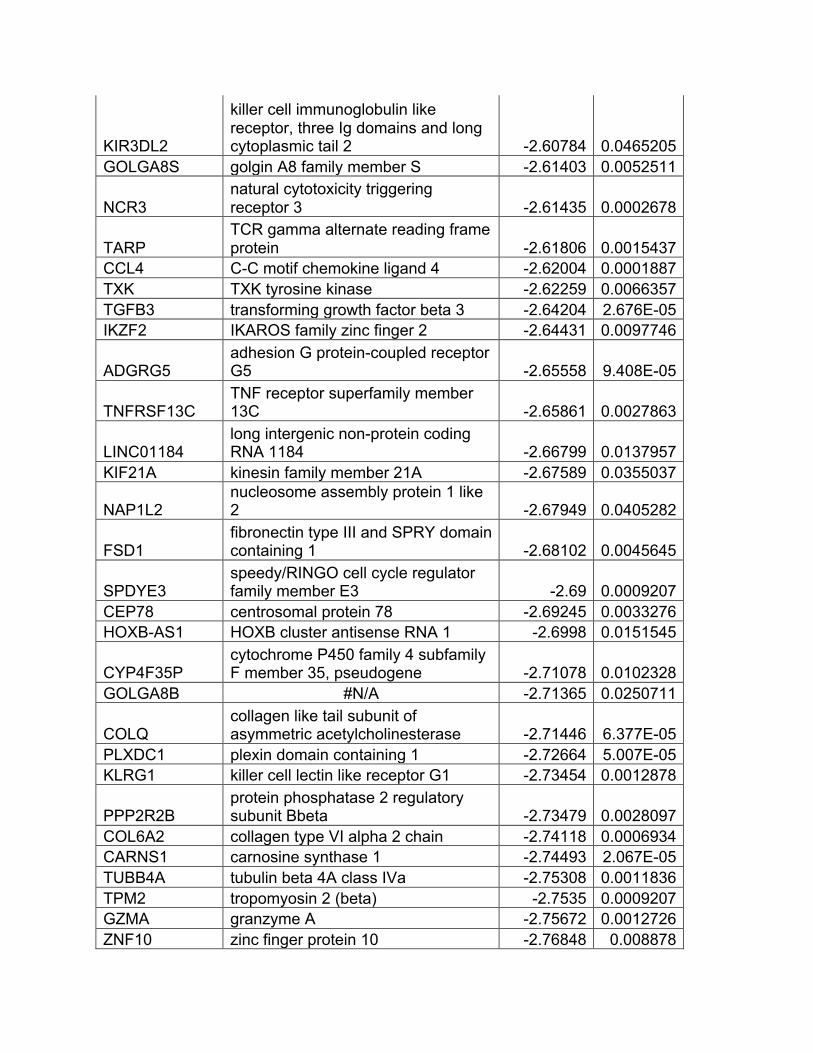
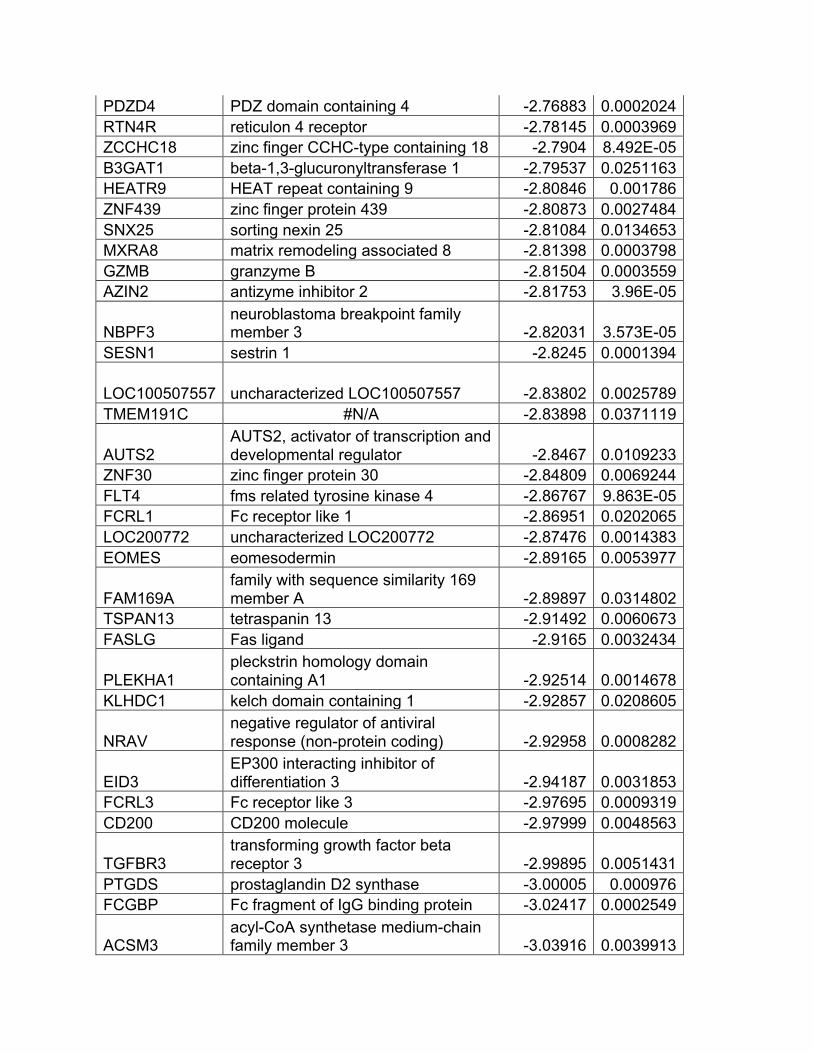
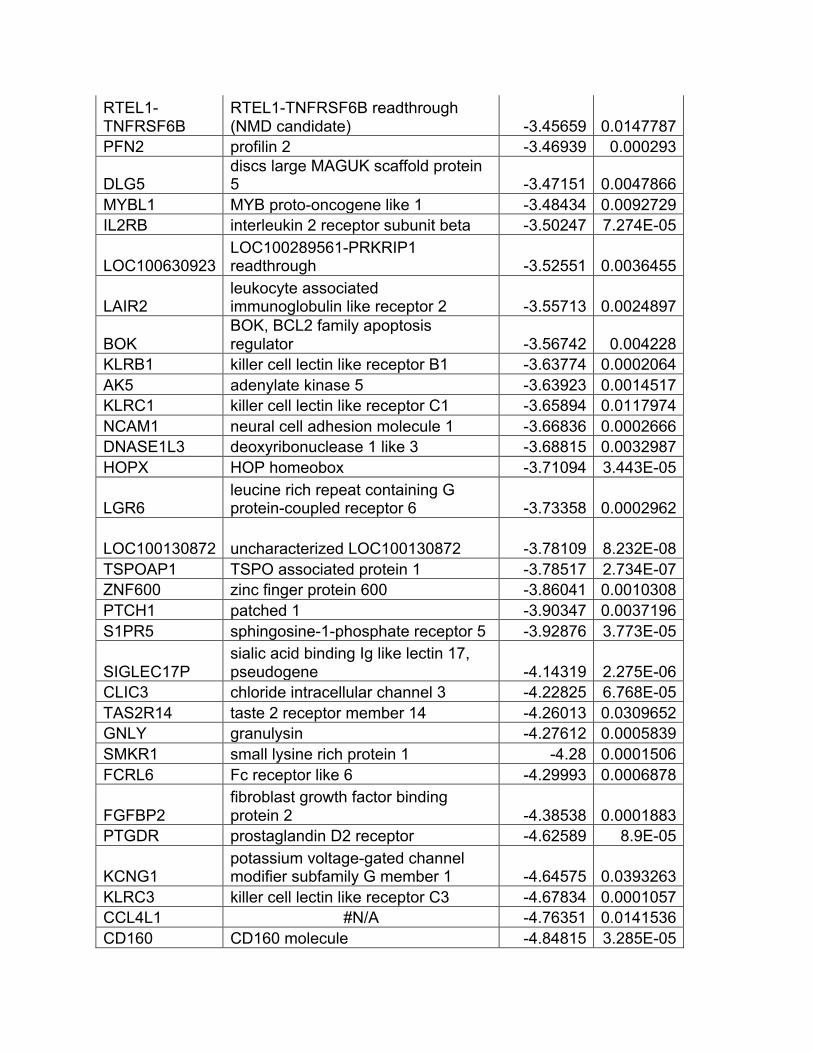
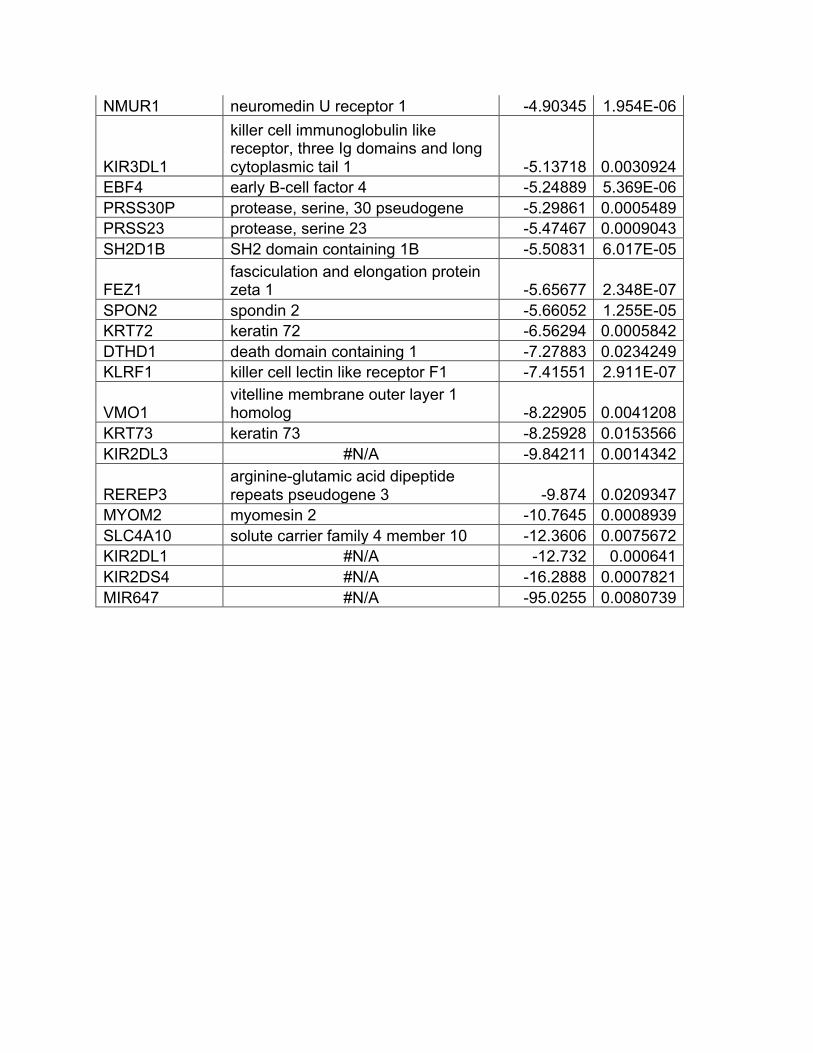
Supplementary Table 7: Regulation of the 623 genes significantly differentially expressed in SLE subjects with high non-calcified plaque burden compared to controls (fold-change ≥ 2 for upregulated genes, and ≤ -2 for downregulated genes, p-value <0.05). Neutrophil-related genes previously found to be most upregulated in LDGs compared to normal density neutrophils (10) are highlighted in yellow.
Gene Symbol Entrez Gene Name Fold-Change p-value
IFI27 interferon alpha inducible protein 27 86.4678 6.785E-06 OTOF Otoferlin 20.0425 0.0003232
LINC00487 long intergenic non-protein coding RNA 487 12.2496 0.0203056
IFI44L interferon induced protein 44 like 12.0366 0.0002198
RSAD2 radical S-adenosyl methionine domain containing 2 11.6457 0.000237
SIGLEC1 sialic acid binding Ig like lectin 1 10.9091 0.0001043 SIGLEC14 sialic acid binding Ig like lectin 14 10.5975 0.0010789 CD177 CD177 molecule 10.5927 0.0004653 RAP1GAP RAP1 GTPase activating protein 8.79022 0.0093749 COL9A3 collagen type IX alpha 3 chain 8.46164 0.0211522 GYPB glycophorin B (MNS blood group) 8.08367 0.0018374 ISG15 ISG15 ubiquitin-like modifier 8.00168 0.0001239 IFI44 interferon induced protein 44 7.97673 0.0004177 DEFA3 Defensin alpha-3 7.81304 0.0054309
CMPK2 cytidine/uridine monophosphate kinase 2 6.78936 0.0003989
IFIT1 interferon induced protein with tetratricopeptide repeats 1 6.66593 0.000263
OAS3 2'-5'-oligoadenylate synthetase 3 6.42742 0.0006372 PRTN3 proteinase 3 6.38064 0.0058607 ELANE elastase, neutrophil expressed 6.17358 0.0017 LTF lactotransferrin 6.17212 0.0019546 MX1 MX dynamin like GTPase 1 6.13377 6.29E-05 IFI6 interferon alpha inducible protein 6 6.07527 3.794E-05
HIST1H4D histone cluster 1 H4 family member d 5.94205 0.0127982
SMTNL1 smoothelin like 1 5.88312 0.0002591
IFIT3 interferon induced protein with tetratricopeptide repeats 3 5.84823 7.394E-06
LY6E lymphocyte antigen 6 family member E 5.78187 0.000174
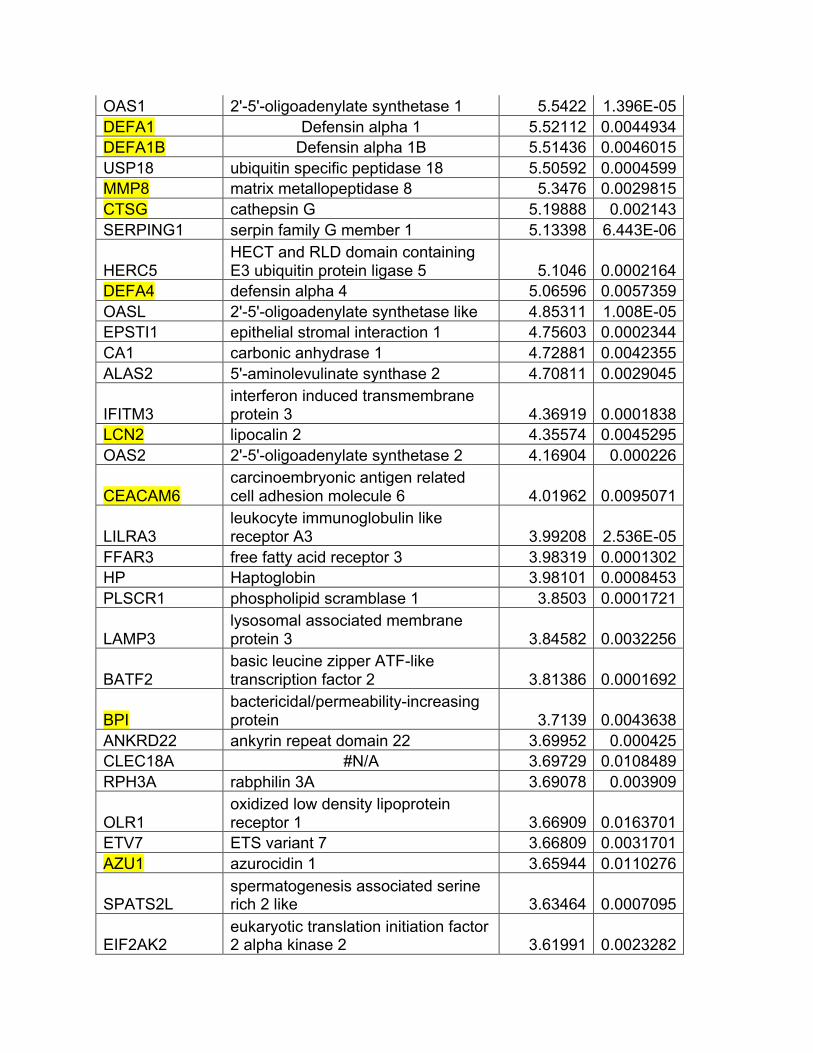
OAS1 2'-5'-oligoadenylate synthetase 1 5.5422 1.396E-05 DEFA1 Defensin alpha 1 5.52112 0.0044934 DEFA1B Defensin alpha 1B 5.51436 0.0046015 USP18 ubiquitin specific peptidase 18 5.50592 0.0004599 MMP8 matrix metallopeptidase 8 5.3476 0.0029815 CTSG cathepsin G 5.19888 0.002143 SERPING1 serpin family G member 1 5.13398 6.443E-06
HERC5 HECT and RLD domain containing E3 ubiquitin protein ligase 5 5.1046 0.0002164
DEFA4 defensin alpha 4 5.06596 0.0057359 OASL 2'-5'-oligoadenylate synthetase like 4.85311 1.008E-05 EPSTI1 epithelial stromal interaction 1 4.75603 0.0002344 CA1 carbonic anhydrase 1 4.72881 0.0042355 ALAS2 5'-aminolevulinate synthase 2 4.70811 0.0029045
IFITM3 interferon induced transmembrane protein 3 4.36919 0.0001838
LCN2 lipocalin 2 4.35574 0.0045295 OAS2 2'-5'-oligoadenylate synthetase 2 4.16904 0.000226
CEACAM6 carcinoembryonic antigen related cell adhesion molecule 6 4.01962 0.0095071
LILRA3 leukocyte immunoglobulin like receptor A3 3.99208 2.536E-05
FFAR3 free fatty acid receptor 3 3.98319 0.0001302 HP Haptoglobin 3.98101 0.0008453 PLSCR1 phospholipid scramblase 1 3.8503 0.0001721
LAMP3 lysosomal associated membrane protein 3 3.84582 0.0032256
BATF2 basic leucine zipper ATF-like transcription factor 2 3.81386 0.0001692
BPI bactericidal/permeability-increasing protein 3.7139 0.0043638
ANKRD22 ankyrin repeat domain 22 3.69952 0.000425 CLEC18A #N/A 3.69729 0.0108489 RPH3A rabphilin 3A 3.69078 0.003909
OLR1 oxidized low density lipoprotein receptor 1 3.66909 0.0163701
ETV7 ETS variant 7 3.66809 0.0031701 AZU1 azurocidin 1 3.65944 0.0110276
SPATS2L spermatogenesis associated serine rich 2 like 3.63464 0.0007095
EIF2AK2 eukaryotic translation initiation factor 2 alpha kinase 2 3.61991 0.0023282
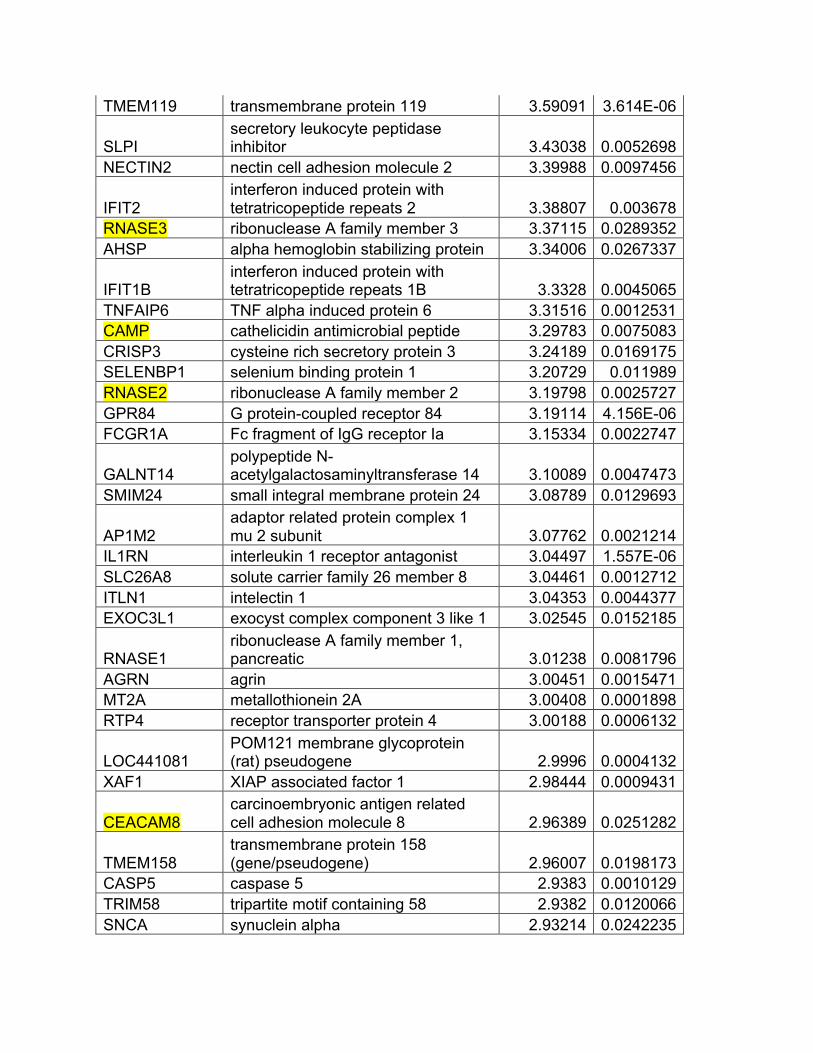
TMEM119 transmembrane protein 119 3.59091 3.614E-06
SLPI secretory leukocyte peptidase inhibitor 3.43038 0.0052698
NECTIN2 nectin cell adhesion molecule 2 3.39988 0.0097456
IFIT2 interferon induced protein with tetratricopeptide repeats 2 3.38807 0.003678
RNASE3 ribonuclease A family member 3 3.37115 0.0289352 AHSP alpha hemoglobin stabilizing protein 3.34006 0.0267337
IFIT1B interferon induced protein with tetratricopeptide repeats 1B 3.3328 0.0045065
TNFAIP6 TNF alpha induced protein 6 3.31516 0.0012531 CAMP cathelicidin antimicrobial peptide 3.29783 0.0075083 CRISP3 cysteine rich secretory protein 3 3.24189 0.0169175 SELENBP1 selenium binding protein 1 3.20729 0.011989 RNASE2 ribonuclease A family member 2 3.19798 0.0025727 GPR84 G protein-coupled receptor 84 3.19114 4.156E-06 FCGR1A Fc fragment of IgG receptor Ia 3.15334 0.0022747
GALNT14 polypeptide N-acetylgalactosaminyltransferase 14 3.10089 0.0047473
SMIM24 small integral membrane protein 24 3.08789 0.0129693
AP1M2 adaptor related protein complex 1 mu 2 subunit 3.07762 0.0021214
IL1RN interleukin 1 receptor antagonist 3.04497 1.557E-06 SLC26A8 solute carrier family 26 member 8 3.04461 0.0012712 ITLN1 intelectin 1 3.04353 0.0044377 EXOC3L1 exocyst complex component 3 like 1 3.02545 0.0152185
RNASE1 ribonuclease A family member 1, pancreatic 3.01238 0.0081796
AGRN agrin 3.00451 0.0015471 MT2A metallothionein 2A 3.00408 0.0001898 RTP4 receptor transporter protein 4 3.00188 0.0006132
LOC441081 POM121 membrane glycoprotein (rat) pseudogene 2.9996 0.0004132
XAF1 XIAP associated factor 1 2.98444 0.0009431
CEACAM8 carcinoembryonic antigen related cell adhesion molecule 8 2.96389 0.0251282
TMEM158 transmembrane protein 158 (gene/pseudogene) 2.96007 0.0198173
CASP5 caspase 5 2.9383 0.0010129 TRIM58 tripartite motif containing 58 2.9382 0.0120066 SNCA synuclein alpha 2.93214 0.0242235

SCO2 SCO2, cytochrome c oxidase assembly protein 2.93053 0.0003828
IRF7 interferon regulatory factor 7 2.92152 0.0003226
FCGR1CP Fc fragment of IgG receptor Ic, pseudogene 2.88796 0.0010167
TCN1 transcobalamin 1 2.88141 0.000365
ABCC13 ATP binding cassette subfamily C member 13 (pseudogene) 2.85352 0.0181359
MPO myeloperoxidase 2.82082 0.0143058 RSPH9 radial spoke head 9 homolog 2.80174 0.0034753 DOCK4 dedicator of cytokinesis 4 2.76542 0.0070168
GMPR guanosine monophosphate reductase 2.72972 0.0106872
ANXA3 annexin A3 2.67583 0.0028587 BPGM bisphosphoglycerate mutase 2.64359 0.0177055 RETN resistin 2.63087 0.0209774 SIGLEC5 sialic acid binding Ig like lectin 5 2.62165 8.557E-05
CEACAM1 carcinoembryonic antigen related cell adhesion molecule 1 2.61454 9.64E-05
IFIT5 interferon induced protein with tetratricopeptide repeats 5 2.59803 0.0040458
CCR1 C-C motif chemokine receptor 1 2.57176 0.00074
TIMM10 translocase of inner mitochondrial membrane 10 2.55971 0.0017361
NTNG2 netrin G2 2.55923 0.0010533 SERINC2 serine incorporator 2 2.55627 0.0146552
OR52K2 olfactory receptor family 52 subfamily K member 2 2.51329 0.0021954
ZCCHC2 zinc finger CCHC-type containing 2 2.49761 0.0099813 CD274 CD274 molecule 2.48586 0.0131843
SLC4A1 solute carrier family 4 member 1 (Diego blood group) 2.48388 0.036022
EPB42 erythrocyte membrane protein band 4.2 2.48026 0.0315473
ZBP1 Z-DNA binding protein 1 2.47389 0.0001438
MCEMP1 mast cell expressed membrane protein 1 2.46014 0.0003059
HEMGN hemogen 2.4499 0.0232942 ADM adrenomedullin 2.43742 0.000101 FCGR1B Fc fragment of IgG receptor Ib 2.43192 0.004138 THEM5 thioesterase superfamily member 5 2.38115 0.0077268 TGM2 transglutaminase 2 2.36595 0.0026732
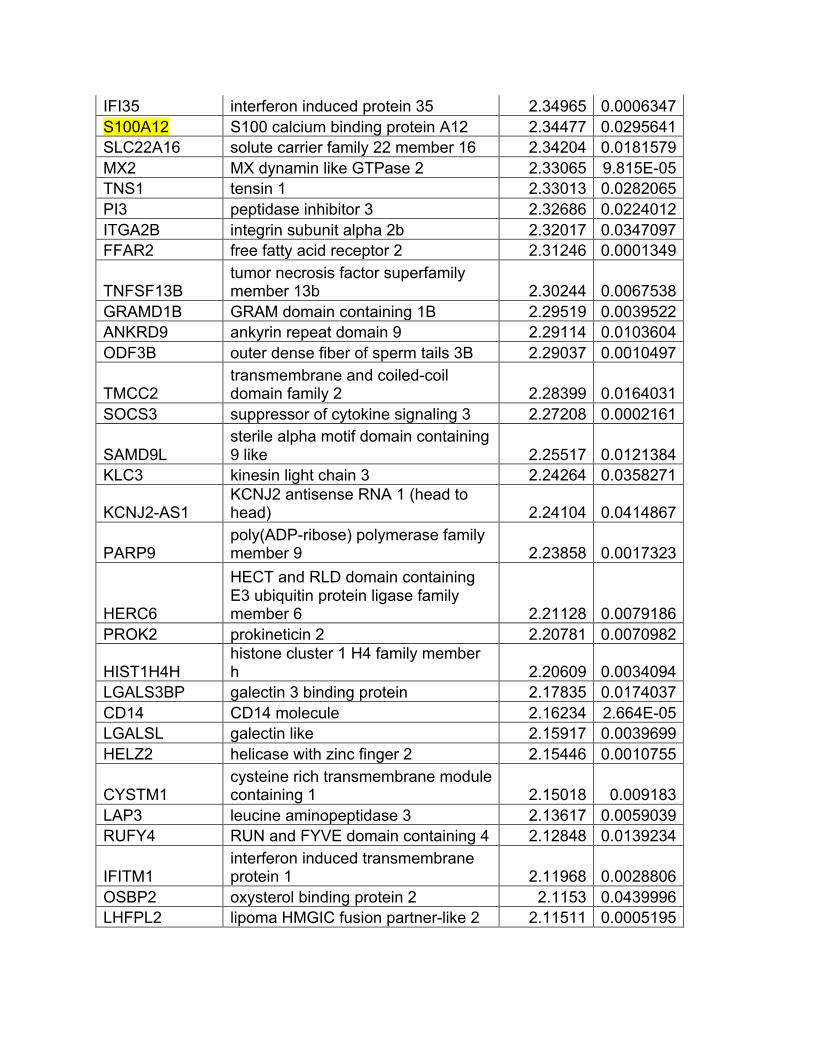
IFI35 interferon induced protein 35 2.34965 0.0006347 S100A12 S100 calcium binding protein A12 2.34477 0.0295641 SLC22A16 solute carrier family 22 member 16 2.34204 0.0181579 MX2 MX dynamin like GTPase 2 2.33065 9.815E-05 TNS1 tensin 1 2.33013 0.0282065 PI3 peptidase inhibitor 3 2.32686 0.0224012 ITGA2B integrin subunit alpha 2b 2.32017 0.0347097 FFAR2 free fatty acid receptor 2 2.31246 0.0001349
TNFSF13B tumor necrosis factor superfamily member 13b 2.30244 0.0067538
GRAMD1B GRAM domain containing 1B 2.29519 0.0039522 ANKRD9 ankyrin repeat domain 9 2.29114 0.0103604 ODF3B outer dense fiber of sperm tails 3B 2.29037 0.0010497
TMCC2 transmembrane and coiled-coil domain family 2 2.28399 0.0164031
SOCS3 suppressor of cytokine signaling 3 2.27208 0.0002161
SAMD9L sterile alpha motif domain containing 9 like 2.25517 0.0121384
KLC3 kinesin light chain 3 2.24264 0.0358271
KCNJ2-AS1 KCNJ2 antisense RNA 1 (head to head) 2.24104 0.0414867
PARP9 poly(ADP-ribose) polymerase family member 9 2.23858 0.0017323
HERC6
HECT and RLD domain containing E3 ubiquitin protein ligase family member 6 2.21128 0.0079186
PROK2 prokineticin 2 2.20781 0.0070982
HIST1H4H histone cluster 1 H4 family member h 2.20609 0.0034094
LGALS3BP galectin 3 binding protein 2.17835 0.0174037 CD14 CD14 molecule 2.16234 2.664E-05 LGALSL galectin like 2.15917 0.0039699 HELZ2 helicase with zinc finger 2 2.15446 0.0010755
CYSTM1 cysteine rich transmembrane module containing 1 2.15018 0.009183
LAP3 leucine aminopeptidase 3 2.13617 0.0059039 RUFY4 RUN and FYVE domain containing 4 2.12848 0.0139234
IFITM1 interferon induced transmembrane protein 1 2.11968 0.0028806
OSBP2 oxysterol binding protein 2 2.1153 0.0439996 LHFPL2 lipoma HMGIC fusion partner-like 2 2.11511 0.0005195
APOBEC3A apolipoprotein B mRNA editing enzyme catalytic subunit 3A 2.10561 0.0047018
ALPL alkaline phosphatase, liver/bone/kidney 2.10082 0.0120413
SMOX spermine oxidase 2.09473 0.0241998 TYMP thymidine phosphorylase 2.08309 0.0016588
CLEC5A C-type lectin domain family 5 member A 2.07686 0.0069445
PARP14 poly(ADP-ribose) polymerase family member 14 2.07141 0.0009125
S100A9 S100 calcium binding protein A9 2.06775 0.027841
SIPA1L2 signal induced proliferation associated 1 like 2 2.06434 0.0199095
HIST1H3D histone cluster 1 H3 family member d 2.05824 0.0060344
BCL2L1 BCL2 like 1 2.05612 0.0374692
LILRA6 leukocyte immunoglobulin like receptor A6 2.04763 0.0002917
TCN2 transcobalamin 2 2.03946 0.0072007
RAB20 RAB20, member RAS oncogene family 2.03903 0.0001693
CLEC4D C-type lectin domain family 4 member D 2.0387 0.005169
LILRA5 leukocyte immunoglobulin like receptor A5 2.03642 0.0009319
OPLAH 5-oxoprolinase (ATP-hydrolysing) 2.0318 0.0076086 SECTM1 secreted and transmembrane 1 2.02541 0.0003069 PML promyelocytic leukemia 2.02503 0.0001923 DDX58 DExD/H-box helicase 58 2.02116 0.0269976 DDX60L DEAD-box helicase 60-like 2.00864 0.0386408
MARCKS myristoylated alanine rich protein kinase C substrate 2.00271 0.0027309
CACNA1I calcium voltage-gated channel subunit alpha1 I -2.0002 0.0029376
DTX3 deltex E3 ubiquitin ligase 3 -2.00035 0.0008957
LOC440461 Rho GTPase activating protein 27 pseudogene -2.00035 0.0113227
DCAF17 DDB1 and CUL4 associated factor 17 -2.00146 0.0070355
FLT3 fms related tyrosine kinase 3 -2.0016 0.0339858
HKR1 HKR1, GLI-Kruppel zinc finger family member -2.00163 5.034E-06

FCRLA Fc receptor like A -2.0019 0.0318949 P2RY10 purinergic receptor P2Y10 -2.00297 0.0147502
OSGEPL1 O-sialoglycoprotein endopeptidase like 1 -2.00341 0.0008482
CAPN12 calpain 12 -2.00362 0.0345689 TTC22 tetratricopeptide repeat domain 22 -2.00522 0.0074217 ZNF607 zinc finger protein 607 -2.00531 0.0001818 DDHD2 DDHD domain containing 2 -2.00555 0.0120459
NAE1 NEDD8 activating enzyme E1 subunit 1 -2.00556 0.0124418
PRR5L proline rich 5 like -2.00603 0.003224 RTTN rotatin -2.00701 0.0127082
CDK5R1 cyclin dependent kinase 5 regulatory subunit 1 -2.0079 0.0201451
BMP8A bone morphogenetic protein 8a -2.00842 0.0031666 ZNF248 zinc finger protein 248 -2.00855 0.0037225
FRG1BP FSHD region gene 1 family member B, pseudogene -2.01044 0.0298178
ZNF37BP zinc finger protein 37B, pseudogene -2.01083 0.0114889
ETS1 ETS proto-oncogene 1, transcription factor -2.01186 0.0237868
FAM43A family with sequence similarity 43 member A -2.01304 0.0002538
PWARSN Prader Willi/Angelman region RNA, SNRPN neighbor -2.01431 0.0410187
FAM118A family with sequence similarity 118 member A -2.01478 0.0039824
JMY junction mediating and regulatory protein, p53 cofactor -2.01495 0.028165
ASB2 ankyrin repeat and SOCS box containing 2 -2.01698 0.0117331
AFF3 AF4/FMR2 family member 3 -2.01725 0.0111531 OVGP1 oviductal glycoprotein 1 -2.01731 0.0105981 IFT172 intraflagellar transport 172 -2.01746 0.000235
GOLGA8IP golgin A8 family member I, pseudogene -2.01754 0.0223539
LINC00526 long intergenic non-protein coding RNA 526 -2.01777 0.0058247
EIF3J-AS1 EIF3J antisense RNA 1 (head to head) -2.02007 1.406E-06
TTC39B tetratricopeptide repeat domain 39B -2.02044 0.045729

PPP1R13B protein phosphatase 1 regulatory subunit 13B -2.02149 0.0001158
FAM179A #N/A -2.02189 0.0005241 ZNF708 zinc finger protein 708 -2.02264 0.0464473 CDK20 cyclin dependent kinase 20 -2.02352 0.0109116
RFXAP regulatory factor X associated protein -2.02373 0.0204363
WDR35 WD repeat domain 35 -2.0238 0.0104084 THEM4 thioesterase superfamily member 4 -2.02397 0.0005917 FAIM Fas apoptotic inhibitory molecule -2.02465 0.0091233
ARHGEF9 Cdc42 guanine nucleotide exchange factor 9 -2.02506 0.0010096
MCF2L-AS1 MCF2L antisense RNA 1 -2.02758 0.0309291 IL7R interleukin 7 receptor -2.02824 0.0390053
FXYD2 FXYD domain containing ion transport regulator 2 -2.02979 0.0454406
ITGA6 integrin subunit alpha 6 -2.03066 0.0401657 LPAR5 lysophosphatidic acid receptor 5 -2.03274 0.000106 SMPD3 sphingomyelin phosphodiesterase 3 -2.03608 0.0059384
APBB1 amyloid beta precursor protein binding family B member 1 -2.0384 0.0003197
GNRH1 gonadotropin releasing hormone 1 -2.03887 2.911E-05 TMEM168 transmembrane protein 168 -2.03936 0.0276342 ZNF75A zinc finger protein 75a -2.03971 0.0094145 ME3 malic enzyme 3 -2.03995 0.0002086 LOC388692 uncharacterized LOC388692 -2.04051 0.0051858 TTC16 tetratricopeptide repeat domain 16 -2.04158 0.0058361
PRIMPOL primase and DNA directed polymerase -2.04169 0.0038374
SLAMF7 SLAM family member 7 -2.0417 0.0181317 TRNT1 tRNA nucleotidyl transferase 1 -2.04284 0.0394726 ZNF846 zinc finger protein 846 -2.043 0.0146422 UCP3 uncoupling protein 3 -2.04318 0.0001331
ERMP1 endoplasmic reticulum metallopeptidase 1 -2.04416 0.0194013
TMEM97 transmembrane protein 97 -2.04451 0.0019192
NAA16 N(alpha)-acetyltransferase 16, NatA auxiliary subunit -2.04455 0.0156074
ATL1 atlastin GTPase 1 -2.04678 0.0152188
LOC100128573 uncharacterized LOC100128573 -2.04735 0.0079971
F2R coagulation factor II thrombin receptor -2.04793 0.045932
HERC2P7 hect domain and RLD 2 pseudogene 7 -2.04932 0.0008226
FLJ42351 uncharacterized LOC400999 -2.0499 0.0163057
SIDT1 SID1 transmembrane family member 1 -2.05025 0.0028207
CD7 CD7 molecule -2.05156 0.0012403 HOXB3 homeobox B3 -2.05164 0.006816
PAFAH2 platelet activating factor acetylhydrolase 2 -2.05247 0.0001797
GSTM2 glutathione S-transferase mu 2 -2.05333 0.0050354 TPD52 tumor protein D52 -2.05342 0.011412
HIP1R huntingtin interacting protein 1 related -2.05447 0.0003911
CFL2 cofilin 2 -2.05516 0.0190428
IPW imprinted in Prader-Willi syndrome (non-protein coding) -2.05711 0.0136487
ARL4C ADP ribosylation factor like GTPase 4C -2.05783 0.0018063
ADSSL1 adenylosuccinate synthase like 1 -2.05821 0.0052617 ZNF773 zinc finger protein 773 -2.05825 0.000322 ZNF627 zinc finger protein 627 -2.05837 0.041523 ITK IL2 inducible T-cell kinase -2.05885 0.0357996
PRAG1 PEAK1 related kinase activating pseudokinase 1 -2.05895 0.0002099
TRAF5 TNF receptor associated factor 5 -2.05921 0.0036207 ZNF525 zinc finger protein 525 -2.05964 0.0124819 MRNIP MRN complex interacting protein -2.06046 0.001106
LOC100130950 uncharacterized LOC100130950 -2.06173 0.0124555 SH2D2A SH2 domain containing 2A -2.06217 0.0005672 FBXO2 F-box protein 2 -2.0637 0.0011348
ITPR1 inositol 1,4,5-trisphosphate receptor type 1 -2.06448 0.0393691
C10orf88 chromosome 10 open reading frame 88 -2.06606 0.0092436
IMMP1L inner mitochondrial membrane peptidase subunit 1 -2.06695 0.0465278
TMEM25 transmembrane protein 25 -2.06796 0.0027178
NAA30 N(alpha)-acetyltransferase 30, NatC catalytic subunit -2.06805 0.0435983
GTF2IRD2B #N/A -2.06962 2.42E-05 WDR89 WD repeat domain 89 -2.07027 0.0150031 FCMR Fc fragment of IgM receptor -2.07205 0.0001447
ZAP70 zeta chain of T cell receptor associated protein kinase 70 -2.07425 0.0001592
DUSP14 dual specificity phosphatase 14 -2.07528 0.0032528 DHRS3 dehydrogenase/reductase 3 -2.07573 0.0003803 RGPD5 #N/A -2.07609 0.0456814
MLC1
megalencephalic leukoencephalopathy with subcortical cysts 1 -2.0774 0.0030338
NPIPB5 #N/A -2.07794 0.0157801 UST uronyl 2-sulfotransferase -2.07802 0.0195678
WFS1 wolframin ER transmembrane glycoprotein -2.0783 9.873E-05
SERPINF1 serpin family F member 1 -2.07941 0.0002261
PIGL phosphatidylinositol glycan anchor biosynthesis class L -2.08036 0.0064861
EML2-AS1 EML2 antisense RNA 1 -2.08183 0.0072853 EPHA1 EPH receptor A1 -2.08196 0.0025194
STAT4 signal transducer and activator of transcription 4 -2.08211 0.0061063
ZNF347 zinc finger protein 347 -2.08517 0.0096116 WNT10B Wnt family member 10B -2.08578 0.0064047 TARBP1 TAR (HIV-1) RNA binding protein 1 -2.08719 0.0012099
RRN3P2 RRN3 homolog, RNA polymerase I transcription factor pseudogene 2 -2.08729 0.0084955
FAM213A family with sequence similarity 213 member A -2.0929 1.019E-05
GDPGP1 GDP-D-glucose phosphorylase 1 -2.09488 0.0010327
ANKS6 ankyrin repeat and sterile alpha motif domain containing 6 -2.09736 0.0004368
UBAP1L ubiquitin associated protein 1 like -2.09998 0.0154455 TMEM263 transmembrane protein 263 -2.10009 0.0263724 CNR2 cannabinoid receptor 2 -2.10061 0.0053658
FKBP1AP1 FK506 binding protein 1A pseudogene 1 -2.1017 0.0078915
LANCL1 LanC like 1 -2.10197 0.0278793
FAM3C family with sequence similarity 3 member C -2.10481 0.0139312
ROBO3 roundabout guidance receptor 3 -2.10577 0.0088264 HIC1 HIC ZBTB transcriptional repressor 1 -2.10863 0.018318

ZFP3 ZFP3 zinc finger protein -2.10975 0.013034
PTPN4 protein tyrosine phosphatase, non-receptor type 4 -2.11293 0.0249192
NR2C1 nuclear receptor subfamily 2 group C member 1 -2.11409 0.0036105
SLC6A16 solute carrier family 6 member 16 -2.11577 0.0003509 IGIP IgA inducing protein -2.11608 0.0175183 CEP76 centrosomal protein 76 -2.11644 0.0369392
FAHD2CP fumarylacetoacetate hydrolase domain containing 2C, pseudogene -2.11876 0.0034263
DYRK2 dual specificity tyrosine phosphorylation regulated kinase 2 -2.12347 0.0176885
FAM89A family with sequence similarity 89 member A -2.12358 0.003568
ADGRL1 adhesion G protein-coupled receptor L1 -2.12459 0.0001618
MATN1-AS1 MATN1 antisense RNA 1 -2.1281 0.0010219
LOC100506123 uncharacterized LOC100506123 -2.12813 0.0004769 FBXO4 F-box protein 4 -2.12832 0.0150487
UTP15 UTP15, small subunit processome component -2.12865 0.008932
HSF2 heat shock transcription factor 2 -2.1297 0.0063012 ZNF853 zinc finger protein 853 -2.13209 0.0004066
NLRC3 NLR family CARD domain containing 3 -2.13276 0.0024478
KDF1 keratinocyte differentiation factor 1 -2.1339 0.0100996
FAM135A family with sequence similarity 135 member A -2.13994 0.0470191
CHTF18 chromosome transmission fidelity factor 18 -2.143 0.0006015
N6AMT1 N-6 adenine-specific DNA methyltransferase 1 (putative) -2.14667 0.0051631
LINC01278 long intergenic non-protein coding RNA 1278 -2.14786 0.0001261
RNASEH1-AS1 RNASEH1 antisense RNA 1 -2.14919 0.008433 SH3YL1 SH3 and SYLF domain containing 1 -2.14929 0.0222314
PRKACB protein kinase cAMP-activated catalytic subunit beta -2.15173 0.0335424
MAGEE1 MAGE family member E1 -2.15193 0.0206063 GPR25 G protein-coupled receptor 25 -2.15484 0.0438623
NFATC2 nuclear factor of activated T-cells 2 -2.16278 0.0070237 ZWILCH zwilch kinetochore protein -2.16471 0.0272755 ZNF799 zinc finger protein 799 -2.16638 0.015244 ZNF485 zinc finger protein 485 -2.16652 0.0026424
GNPDA2 glucosamine-6-phosphate deaminase 2 -2.1669 0.0400138
LTK leukocyte receptor tyrosine kinase -2.1684 0.0201531 ZNF26 zinc finger protein 26 -2.1705 0.0157359 EVA1C eva-1 homolog C -2.17089 0.0001115 PRKCH protein kinase C eta -2.17183 0.003541 ZNF205-AS1 ZNF205 antisense RNA 1 -2.1757 0.0040474 ZNF41 zinc finger protein 41 -2.17978 0.0360926
HAUS6 HAUS augmin like complex subunit 6 -2.18099 0.0446521
L3HYPDH trans-L-3-hydroxyproline dehydratase -2.18201 0.0175975
RGS9 regulator of G-protein signaling 9 -2.18229 0.0069459 AXIN2 axin 2 -2.18713 0.007121
SCNN1D sodium channel epithelial 1 delta subunit -2.19028 0.0090206
SAMD3 sterile alpha motif domain containing 3 -2.19225 0.0070003
NAPEPLD N-acyl phosphatidylethanolamine phospholipase D -2.19262 0.0080272
USP53 ubiquitin specific peptidase 53 -2.1944 0.0290712
ZIK1 zinc finger protein interacting with K protein 1 -2.19551 0.0003921
SNED1 sushi, nidogen and EGF like domains 1 -2.20718 0.0038345
TBC1D4 TBC1 domain family member 4 -2.21003 0.022024 FCRL2 Fc receptor like 2 -2.21532 0.039219 CTSF cathepsin F -2.2191 0.0016914 PRMT6 protein arginine methyltransferase 6 -2.21974 0.0036998
BANK1 B-cell scaffold protein with ankyrin repeats 1 -2.22456 0.0172168
RHEBL1 Ras homolog enriched in brain like 1 -2.22472 0.0012005
B3GNT7 UDP-GlcNAc:betaGal beta-1,3-N-acetylglucosaminyltransferase 7 -2.22871 0.0011412
LOC284581 uncharacterized LOC284581 -2.23019 0.0050234
TMIGD2 transmembrane and immunoglobulin domain containing 2 -2.23461 0.0076079
ZNF84 zinc finger protein 84 -2.23558 0.0087017
PDGFB platelet derived growth factor subunit B -2.23768 0.001254
GSAP gamma-secretase activating protein -2.23891 0.0008675
LINC00861 long intergenic non-protein coding RNA 861 -2.24351 0.0017358
RORA RAR related orphan receptor A -2.24356 0.0466116 EPHX2 epoxide hydrolase 2 -2.24452 0.003227 USP28 ubiquitin specific peptidase 28 -2.24487 0.0053112 ACKR3 atypical chemokine receptor 3 -2.24543 0.0001708 COQ10A coenzyme Q10A -2.24571 6.09E-07
NR3C2 nuclear receptor subfamily 3 group C member 2 -2.24733 0.0194577
SPATA7 spermatogenesis associated 7 -2.24897 0.0360561 CCDC65 coiled-coil domain containing 65 -2.25051 0.0001471 TSHZ1 teashirt zinc finger homeobox 1 -2.25078 0.0240001
RASGRF2 Ras protein specific guanine nucleotide releasing factor 2 -2.25169 0.0148546
TMEM220 transmembrane protein 220 -2.25347 0.0422325
ID2 inhibitor of DNA binding 2, HLH protein -2.25508 4.593E-05
LUC7L2 LUC7 like 2, pre-mRNA splicing factor -2.25509 0.0176509
KANK3 KN motif and ankyrin repeat domains 3 -2.25523 0.0025452
ALS2CL ALS2 C-terminal like -2.25529 0.0019667 LIMD1-AS1 LIMD1 antisense RNA 1 -2.25671 0.0015649 LOC155060 AI894139 pseudogene -2.25936 5.487E-05 ZNF256 zinc finger protein 256 -2.26188 0.0246239 ELOVL6 ELOVL fatty acid elongase 6 -2.26191 0.0482534 BDH2 3-hydroxybutyrate dehydrogenase 2 -2.26683 0.0126732
BCRP2 breakpoint cluster region pseudogene 2 -2.27506 0.0247489
HLTF helicase like transcription factor -2.27605 0.0479481 CERS6-AS1 CERS6 antisense RNA 1 -2.27707 0.001312 ZNF577 zinc finger protein 577 -2.27989 0.0072373
PMS2P4 PMS1 homolog 2, mismatch repair system component pseudogene 4 -2.28128 0.0038581
MAP3K14-AS1 MAP3K14 antisense RNA 1 -2.28138 0.0098113 PBX4 PBX homeobox 4 -2.28351 0.0002306 TC2N tandem C2 domains, nuclear -2.2841 0.0289247 WNT1 Wnt family member 1 -2.28529 0.0010163

SEMA4C semaphorin 4C -2.292 0.0001856
LINC00926 long intergenic non-protein coding RNA 926 -2.29251 0.0284097
HLA-DQA1 major histocompatibility complex, class II, DQ alpha 1 -2.29616 0.0194394
GK5 glycerol kinase 5 (putative) -2.29719 0.0098587
MDS2 myelodysplastic syndrome 2 translocation associated -2.29793 0.0026292
CAMK2N1 calcium/calmodulin dependent protein kinase II inhibitor 1 -2.3007 0.0025275
MC1R melanocortin 1 receptor -2.30124 0.0006445 DUSP2 dual specificity phosphatase 2 -2.3017 0.004402 TMEM267 transmembrane protein 267 -2.30435 0.030887 FLYWCH1 FLYWCH-type zinc finger 1 -2.30444 0.0003742 TARSL2 threonyl-tRNA synthetase like 2 -2.3049 0.0047406
PRPF40B pre-mRNA processing factor 40 homolog B -2.30514 0.0001203
YPEL1 yippee like 1 -2.30563 6.803E-06 CCDC78 coiled-coil domain containing 78 -2.30647 0.0148543
LARGE2 LARGE xylosyl- and glucuronyltransferase 2 -2.30674 0.0080455
IL5RA interleukin 5 receptor subunit alpha -2.30704 0.0329908 MS4A1 membrane spanning 4-domains A1 -2.30806 0.0178471 NELL2 neural EGFL like 2 -2.309 0.0088089 SLC24A1 solute carrier family 24 member 1 -2.31207 0.0109988 LGALS4 galectin 4 -2.31228 0.0030165
EPB41L4A erythrocyte membrane protein band 4.1 like 4A -2.31275 0.0034679
BACH2 BTB domain and CNC homolog 2 -2.31442 0.0054076 TASP1 taspase 1 -2.31461 0.0067524 NCALD neurocalcin delta -2.3159 0.0002812 DNAAF2 dynein axonemal assembly factor 2 -2.31733 0.0019098 TLE1 transducin like enhancer of split 1 -2.31771 0.0012217
GPRASP1 G protein-coupled receptor associated sorting protein 1 -2.31864 0.0056373
TBC1D31 TBC1 domain family member 31 -2.32147 0.0081159 ZNF540 zinc finger protein 540 -2.32589 0.0127171 TLE2 transducin like enhancer of split 2 -2.32723 0.0004684 TGDS TDP-glucose 4,6-dehydratase -2.32821 0.0343651
C3orf33 chromosome 3 open reading frame 33 -2.33381 6.003E-06
LLGL2 LLGL2, scribble cell polarity complex component -2.33507 6.383E-05
MTERF2 mitochondrial transcription termination factor 2 -2.33731 0.0029549
AMIGO1 adhesion molecule with Ig like domain 1 -2.33736 0.0257473
LIMA1 LIM domain and actin binding 1 -2.33806 0.0348025
C16orf52 chromosome 16 open reading frame 52 -2.34653 0.0391867
RCAN3AS RCAN3 antisense -2.34845 0.003182 HID1 HID1 domain containing -2.34935 0.0069113
ADGRE4P adhesion G protein-coupled receptor E4, pseudogene -2.35321 0.0454385
SLC25A53 solute carrier family 25 member 53 -2.35435 0.000218 ADAM28 ADAM metallopeptidase domain 28 -2.35654 0.0014077 ZNF831 zinc finger protein 831 -2.35655 0.005615 ZNF382 zinc finger protein 382 -2.35763 0.0222074
TYW1B tRNA-yW synthesizing protein 1 homolog B -2.36016 0.0103917
NKG7 natural killer cell granule protein 7 -2.36019 0.0017519 OSBPL10 oxysterol binding protein like 10 -2.36219 0.0373767 LGALS9C galectin 9C -2.36229 0.0103341 SERPINH1 serpin family H member 1 -2.3636 5.427E-05
RECK reversion inducing cysteine rich protein with kazal motifs -2.36555 0.0252435
STAG3L3 #N/A -2.36639 0.0266081 TEKT4P2 tektin 4 pseudogene 2 -2.37172 0.0391289 SLC38A1 solute carrier family 38 member 1 -2.37315 0.0336165
RRN3P1 RRN3 homolog, RNA polymerase I transcription factor pseudogene 1 -2.37492 0.0004371
ABCA11P ATP binding cassette subfamily A member 11, pseudogene -2.37727 0.0097331
DDIT4 DNA damage inducible transcript 4 -2.38299 0.0010456 CTSW cathepsin W -2.38971 0.0017629 NEIL1 nei like DNA glycosylase 1 -2.39246 1.264E-05 GSTM3 glutathione S-transferase mu 3 -2.40074 0.0015409
PLEKHF1 pleckstrin homology and FYVE domain containing 1 -2.4238 3.266E-05
SOX13 SRY-box 13 -2.4244 0.0010499 COL6A1 collagen type VI alpha 1 chain -2.43235 0.0242789 ZNF626 zinc finger protein 626 -2.43493 0.0002334
PYHIN1 pyrin and HIN domain family member 1 -2.43517 0.0073591
CD247 CD247 molecule -2.44202 1.159E-05 ZNF304 zinc finger protein 304 -2.44219 0.0092837 GOLGA8A #N/A -2.44512 0.0088756 PEX3 peroxisomal biogenesis factor 3 -2.44794 0.0089951
PEX11A peroxisomal biogenesis factor 11 alpha -2.46719 0.0007445
GPR183 G protein-coupled receptor 183 -2.47523 0.0058261
GALNT12 polypeptide N-acetylgalactosaminyltransferase 12 -2.47791 0.0040196
DCHS1 dachsous cadherin-related 1 -2.48154 0.0019831
LILRA4 leukocyte immunoglobulin like receptor A4 -2.48661 0.0015093
APBA2 amyloid beta precursor protein binding family A member 2 -2.49284 0.000165
IL24 interleukin 24 -2.49685 0.0001895 E2F5 E2F transcription factor 5 -2.49738 0.0333978 CXXC5 CXXC finger protein 5 -2.502 2.546E-05 ZNF204P zinc finger protein 204, pseudogene -2.51166 0.0347636 SLC22A17 solute carrier family 22 member 17 -2.5172 0.008716
TRG-AS1 T cell receptor gamma locus antisense RNA 1 -2.52759 0.0050917
GZMH granzyme H -2.54236 0.0231374
RRAS2 related RAS viral (r-ras) oncogene homolog 2 -2.54242 0.0045559
KLRK1 #N/A -2.54822 0.0001703 PLCH2 phospholipase C eta 2 -2.54826 0.0002979 WNT7A Wnt family member 7A -2.551 0.0027359 KLF12 Kruppel like factor 12 -2.55127 0.0329855
ADHFE1 alcohol dehydrogenase, iron containing 1 -2.55313 5.963E-06
MEX3C mex-3 RNA binding family member C -2.55769 0.0207861
LOC100133091 uncharacterized LOC100133091 -2.57403 0.0007511 TKTL1 transketolase like 1 -2.57806 0.0006191 SH2D1A SH2 domain containing 1A -2.59328 0.0111811 ZNF528 zinc finger protein 528 -2.59346 0.0011217 GPA33 glycoprotein A33 -2.59841 0.0008759 ANKRD23 ankyrin repeat domain 23 -2.60316 0.0007816
KIR3DL2
killer cell immunoglobulin like receptor, three Ig domains and long cytoplasmic tail 2 -2.60784 0.0465205
GOLGA8S golgin A8 family member S -2.61403 0.0052511
NCR3 natural cytotoxicity triggering receptor 3 -2.61435 0.0002678
TARP TCR gamma alternate reading frame protein -2.61806 0.0015437
CCL4 C-C motif chemokine ligand 4 -2.62004 0.0001887 TXK TXK tyrosine kinase -2.62259 0.0066357 TGFB3 transforming growth factor beta 3 -2.64204 2.676E-05 IKZF2 IKAROS family zinc finger 2 -2.64431 0.0097746
ADGRG5 adhesion G protein-coupled receptor G5 -2.65558 9.408E-05
TNFRSF13C TNF receptor superfamily member 13C -2.65861 0.0027863
LINC01184 long intergenic non-protein coding RNA 1184 -2.66799 0.0137957
KIF21A kinesin family member 21A -2.67589 0.0355037
NAP1L2 nucleosome assembly protein 1 like 2 -2.67949 0.0405282
FSD1 fibronectin type III and SPRY domain containing 1 -2.68102 0.0045645
SPDYE3 speedy/RINGO cell cycle regulator family member E3 -2.69 0.0009207
CEP78 centrosomal protein 78 -2.69245 0.0033276 HOXB-AS1 HOXB cluster antisense RNA 1 -2.6998 0.0151545
CYP4F35P cytochrome P450 family 4 subfamily F member 35, pseudogene -2.71078 0.0102328
GOLGA8B #N/A -2.71365 0.0250711
COLQ collagen like tail subunit of asymmetric acetylcholinesterase -2.71446 6.377E-05
PLXDC1 plexin domain containing 1 -2.72664 5.007E-05 KLRG1 killer cell lectin like receptor G1 -2.73454 0.0012878
PPP2R2B protein phosphatase 2 regulatory subunit Bbeta -2.73479 0.0028097
COL6A2 collagen type VI alpha 2 chain -2.74118 0.0006934 CARNS1 carnosine synthase 1 -2.74493 2.067E-05 TUBB4A tubulin beta 4A class IVa -2.75308 0.0011836 TPM2 tropomyosin 2 (beta) -2.7535 0.0009207 GZMA granzyme A -2.75672 0.0012726 ZNF10 zinc finger protein 10 -2.76848 0.008878
PDZD4 PDZ domain containing 4 -2.76883 0.0002024 RTN4R reticulon 4 receptor -2.78145 0.0003969 ZCCHC18 zinc finger CCHC-type containing 18 -2.7904 8.492E-05 B3GAT1 beta-1,3-glucuronyltransferase 1 -2.79537 0.0251163 HEATR9 HEAT repeat containing 9 -2.80846 0.001786 ZNF439 zinc finger protein 439 -2.80873 0.0027484 SNX25 sorting nexin 25 -2.81084 0.0134653 MXRA8 matrix remodeling associated 8 -2.81398 0.0003798 GZMB granzyme B -2.81504 0.0003559 AZIN2 antizyme inhibitor 2 -2.81753 3.96E-05
NBPF3 neuroblastoma breakpoint family member 3 -2.82031 3.573E-05
SESN1 sestrin 1 -2.8245 0.0001394
LOC100507557 uncharacterized LOC100507557 -2.83802 0.0025789 TMEM191C #N/A -2.83898 0.0371119
AUTS2 AUTS2, activator of transcription and developmental regulator -2.8467 0.0109233
ZNF30 zinc finger protein 30 -2.84809 0.0069244 FLT4 fms related tyrosine kinase 4 -2.86767 9.863E-05 FCRL1 Fc receptor like 1 -2.86951 0.0202065 LOC200772 uncharacterized LOC200772 -2.87476 0.0014383 EOMES eomesodermin -2.89165 0.0053977
FAM169A family with sequence similarity 169 member A -2.89897 0.0314802
TSPAN13 tetraspanin 13 -2.91492 0.0060673 FASLG Fas ligand -2.9165 0.0032434
PLEKHA1 pleckstrin homology domain containing A1 -2.92514 0.0014678
KLHDC1 kelch domain containing 1 -2.92857 0.0208605
NRAV negative regulator of antiviral response (non-protein coding) -2.92958 0.0008282
EID3 EP300 interacting inhibitor of differentiation 3 -2.94187 0.0031853
FCRL3 Fc receptor like 3 -2.97695 0.0009319 CD200 CD200 molecule -2.97999 0.0048563
TGFBR3 transforming growth factor beta receptor 3 -2.99895 0.0051431
PTGDS prostaglandin D2 synthase -3.00005 0.000976 FCGBP Fc fragment of IgG binding protein -3.02417 0.0002549
ACSM3 acyl-CoA synthetase medium-chain family member 3 -3.03916 0.0039913

ARVCF armadillo repeat gene deleted in velocardiofacial syndrome -3.0742 0.0002926
PRF1 perforin 1 -3.08173 8.76E-05
AKR1C3 aldo-keto reductase family 1 member C3 -3.0982 0.0010762
MATK megakaryocyte-associated tyrosine kinase -3.10378 3.446E-05
RHOBTB3 Rho related BTB domain containing 3 -3.10381 0.0005223
ZNF595 zinc finger protein 595 -3.17083 0.000184
NCR1 natural cytotoxicity triggering receptor 1 -3.17442 0.000142
ERBB2 erb-b2 receptor tyrosine kinase 2 -3.20949 3.102E-05 NOG noggin -3.22297 0.0052694 TBX21 T-box 21 -3.25112 4.591E-05 CLDND2 claudin domain containing 2 -3.25597 0.0009833 KLRD1 killer cell lectin like receptor D1 -3.26602 0.0001756 LYPD2 LY6/PLAUR domain containing 2 -3.26909 0.0064208
MBLAC2 metallo-beta-lactamase domain containing 2 -3.27979 0.0286781
LOC100129083 uncharacterized LOC100129083 -3.28201 0.0024435 CXCR6 C-X-C motif chemokine receptor 6 -3.30048 0.0005914
ADAMTS10 ADAM metallopeptidase with thrombospondin type 1 motif 10 -3.31792 3.357E-07
ENPP5
ectonucleotide pyrophosphatase/phosphodiesterase 5 (putative) -3.31991 0.0135632
ITPRIPL1 inositol 1,4,5-trisphosphate receptor interacting protein-like 1 -3.32544 0.00062
CACNG6 calcium voltage-gated channel auxiliary subunit gamma 6 -3.34225 0.0322707
C1orf21 chromosome 1 open reading frame 21 -3.35482 0.0011529
ABCB1 ATP binding cassette subfamily B member 1 -3.35489 9.95E-05
CACNA2D2 calcium voltage-gated channel auxiliary subunit alpha2delta 2 -3.37821 0.0004488
SYTL2 synaptotagmin like 2 -3.39046 0.0020802
ADGRG1 adhesion G protein-coupled receptor G1 -3.44953 0.0002806
PDGFD platelet derived growth factor D -3.4551 0.0018721
RTEL1-TNFRSF6B
RTEL1-TNFRSF6B readthrough (NMD candidate) -3.45659 0.0147787
PFN2 profilin 2 -3.46939 0.000293
DLG5 discs large MAGUK scaffold protein 5 -3.47151 0.0047866
MYBL1 MYB proto-oncogene like 1 -3.48434 0.0092729 IL2RB interleukin 2 receptor subunit beta -3.50247 7.274E-05
LOC100630923 LOC100289561-PRKRIP1 readthrough -3.52551 0.0036455
LAIR2 leukocyte associated immunoglobulin like receptor 2 -3.55713 0.0024897
BOK BOK, BCL2 family apoptosis regulator -3.56742 0.004228
KLRB1 killer cell lectin like receptor B1 -3.63774 0.0002064 AK5 adenylate kinase 5 -3.63923 0.0014517 KLRC1 killer cell lectin like receptor C1 -3.65894 0.0117974 NCAM1 neural cell adhesion molecule 1 -3.66836 0.0002666 DNASE1L3 deoxyribonuclease 1 like 3 -3.68815 0.0032987 HOPX HOP homeobox -3.71094 3.443E-05
LGR6 leucine rich repeat containing G protein-coupled receptor 6 -3.73358 0.0002962
LOC100130872 uncharacterized LOC100130872 -3.78109 8.232E-08 TSPOAP1 TSPO associated protein 1 -3.78517 2.734E-07 ZNF600 zinc finger protein 600 -3.86041 0.0010308 PTCH1 patched 1 -3.90347 0.0037196 S1PR5 sphingosine-1-phosphate receptor 5 -3.92876 3.773E-05
SIGLEC17P sialic acid binding Ig like lectin 17, pseudogene -4.14319 2.275E-06
CLIC3 chloride intracellular channel 3 -4.22825 6.768E-05 TAS2R14 taste 2 receptor member 14 -4.26013 0.0309652 GNLY granulysin -4.27612 0.0005839 SMKR1 small lysine rich protein 1 -4.28 0.0001506 FCRL6 Fc receptor like 6 -4.29993 0.0006878
FGFBP2 fibroblast growth factor binding protein 2 -4.38538 0.0001883
PTGDR prostaglandin D2 receptor -4.62589 8.9E-05
KCNG1 potassium voltage-gated channel modifier subfamily G member 1 -4.64575 0.0393263
KLRC3 killer cell lectin like receptor C3 -4.67834 0.0001057 CCL4L1 #N/A -4.76351 0.0141536 CD160 CD160 molecule -4.84815 3.285E-05
NMUR1 neuromedin U receptor 1 -4.90345 1.954E-06
KIR3DL1
killer cell immunoglobulin like receptor, three Ig domains and long cytoplasmic tail 1 -5.13718 0.0030924
EBF4 early B-cell factor 4 -5.24889 5.369E-06 PRSS30P protease, serine, 30 pseudogene -5.29861 0.0005489 PRSS23 protease, serine 23 -5.47467 0.0009043 SH2D1B SH2 domain containing 1B -5.50831 6.017E-05
FEZ1 fasciculation and elongation protein zeta 1 -5.65677 2.348E-07
SPON2 spondin 2 -5.66052 1.255E-05 KRT72 keratin 72 -6.56294 0.0005842 DTHD1 death domain containing 1 -7.27883 0.0234249 KLRF1 killer cell lectin like receptor F1 -7.41551 2.911E-07
VMO1 vitelline membrane outer layer 1 homolog -8.22905 0.0041208
KRT73 keratin 73 -8.25928 0.0153566 KIR2DL3 #N/A -9.84211 0.0014342
REREP3 arginine-glutamic acid dipeptide repeats pseudogene 3 -9.874 0.0209347
MYOM2 myomesin 2 -10.7645 0.0008939 SLC4A10 solute carrier family 4 member 10 -12.3606 0.0075672 KIR2DL1 #N/A -12.732 0.000641 KIR2DS4 #N/A -16.2888 0.0007821 MIR647 #N/A -95.0255 0.0080739

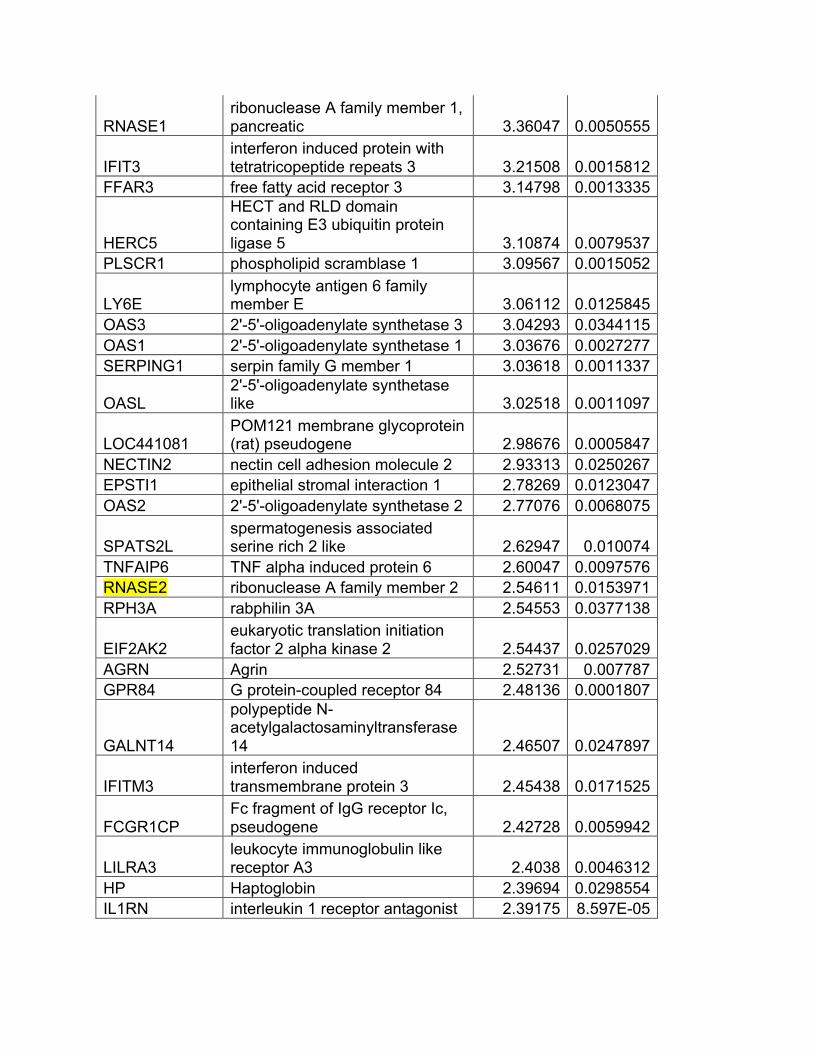
Supplementary Table 8: Regulation of the 163 genes significantly differentially expressed in SLE subjects with normal non-calcified plaque burden compared to controls (fold-change ≥ 2 for upregulated genes, and ≤ -2 for downregulated genes, p-value <0.05). Neutrophil-related genes previously found to be most upregulated in LDGs compared to normal density neutrophils (10) are highlighted in yellow.
Gene Symbol Entrez Gene Name Fold-Change p-value
IFI27 interferon alpha inducible protein 27 22.2919 0.0009182
PVALB Parvalbumin 11.5302 0.0445714 OTOF Otoferlin 10.6367 0.0040564 SIGLEC1 sialic acid binding Ig like lectin 1 8.26779 0.0005952 RAP1GAP RAP1 GTPase activating protein 8.20019 0.0139237 CCL2 C-C motif chemokine ligand 2 7.40118 0.043187 CD177 CD177 molecule 7.32008 0.0030793 IFI44L interferon induced protein 44 like 7.13225 0.0030508 COL9A3 collagen type IX alpha 3 chain 6.97845 0.039653
HIST1H4D histone cluster 1 H4 family member d 6.27657 0.012662
RSAD2 radical S-adenosyl methionine domain containing 2 5.94028 0.0062144
IFI44 interferon induced protein 44 5.49336 0.0035616
ACKR1 atypical chemokine receptor 1 (Duffy blood group) 5.35961 0.0426804
ISG15 ISG15 ubiquitin-like modifier 4.51267 0.0041588 SMTNL1 smoothelin like 1 4.08452 0.0032776 USP18 ubiquitin specific peptidase 18 3.93622 0.0045208
CMPK2 cytidine/uridine monophosphate kinase 2 3.7572 0.0119614
IFIT1 interferon induced protein with tetratricopeptide repeats 1 3.69105 0.0096071
MX1 MX dynamin like GTPase 1 3.63256 0.0031389
IFI6 interferon alpha inducible protein 6 3.58959 0.0023538
RNASE1 ribonuclease A family member 1, pancreatic 3.36047 0.0050555
IFIT3 interferon induced protein with tetratricopeptide repeats 3 3.21508 0.0015812
FFAR3 free fatty acid receptor 3 3.14798 0.0013335
HERC5
HECT and RLD domain containing E3 ubiquitin protein ligase 5 3.10874 0.0079537
PLSCR1 phospholipid scramblase 1 3.09567 0.0015052
LY6E lymphocyte antigen 6 family member E 3.06112 0.0125845
OAS3 2'-5'-oligoadenylate synthetase 3 3.04293 0.0344115 OAS1 2'-5'-oligoadenylate synthetase 1 3.03676 0.0027277 SERPING1 serpin family G member 1 3.03618 0.0011337
OASL 2'-5'-oligoadenylate synthetase like 3.02518 0.0011097
LOC441081 POM121 membrane glycoprotein (rat) pseudogene 2.98676 0.0005847
NECTIN2 nectin cell adhesion molecule 2 2.93313 0.0250267 EPSTI1 epithelial stromal interaction 1 2.78269 0.0123047 OAS2 2'-5'-oligoadenylate synthetase 2 2.77076 0.0068075
SPATS2L spermatogenesis associated serine rich 2 like 2.62947 0.010074
TNFAIP6 TNF alpha induced protein 6 2.60047 0.0097576 RNASE2 ribonuclease A family member 2 2.54611 0.0153971 RPH3A rabphilin 3A 2.54553 0.0377138
EIF2AK2 eukaryotic translation initiation factor 2 alpha kinase 2 2.54437 0.0257029
AGRN Agrin 2.52731 0.007787 GPR84 G protein-coupled receptor 84 2.48136 0.0001807
GALNT14
polypeptide N-acetylgalactosaminyltransferase 14 2.46507 0.0247897
IFITM3 interferon induced transmembrane protein 3 2.45438 0.0171525
FCGR1CP Fc fragment of IgG receptor Ic, pseudogene 2.42728 0.0059942
LILRA3 leukocyte immunoglobulin like receptor A3 2.4038 0.0046312
HP Haptoglobin 2.39694 0.0298554 IL1RN interleukin 1 receptor antagonist 2.39175 8.597E-05

SCO2 SCO2, cytochrome c oxidase assembly protein 2.34865 0.0043326
TCN2 transcobalamin 2 2.34515 0.0021823 ANKRD22 ankyrin repeat domain 22 2.34064 0.0180164 XAF1 XIAP associated factor 1 2.33986 0.0094974 PROK2 prokineticin 2 2.17162 0.0100066 CASP5 caspase 5 2.16017 0.0169485
OR52K2 olfactory receptor family 52 subfamily K member 2 2.15494 0.0109653
RTP4 receptor transporter protein 4 2.15427 0.0144472 FCGR1A Fc fragment of IgG receptor Ia 2.15293 0.038491 LGALSL galectin like 2.15285 0.0051102
TIMM10 translocase of inner mitochondrial membrane 10 2.13053 0.0115746
RSPH9 radial spoke head 9 homolog 2.12657 0.0313776 ASGR2 asialoglycoprotein receptor 2 2.1159 0.0002821 CCR1 C-C motif chemokine receptor 1 2.10879 0.0071925 ADM adrenomedullin 2.06458 0.0013219 IRF7 interferon regulatory factor 7 2.03485 0.0138153 FCGR1B Fc fragment of IgG receptor Ib 2.03381 0.0222902 FFAR2 free fatty acid receptor 2 2.01777 0.0012564 MX2 MX dynamin like GTPase 2 2.01447 0.0010986
MCEMP1 mast cell expressed membrane protein 1 2.00766 0.0045133
HERC6
HECT and RLD domain containing E3 ubiquitin protein ligase family member 6 2.00341 0.0217237
SLC26A8 solute carrier family 26 member 8 2.0005 0.0395291
NCAM1 neural cell adhesion molecule 1 -2.00451 0.0399495 MIR646HG MIR646 host gene -2.00545 0.0367103
NR2F6 nuclear receptor subfamily 2 group F member 6 -2.01236 0.0025477
SIGLEC10 sialic acid binding Ig like lectin 10 -2.01588 0.000133 TSPOAP1 TSPO associated protein 1 -2.02764 0.0019251 FCRLA Fc receptor like A -2.0278 0.0335462 ADSSL1 adenylosuccinate synthase like 1 -2.03683 0.0072274
MS4A1 membrane spanning 4-domains A1 -2.03705 0.0469516
ZNF595 zinc finger protein 595 -2.04622 0.0153426 AZIN2 antizyme inhibitor 2 -2.05811 0.0027841 SYNGR1 synaptogyrin 1 -2.07224 0.0150474
UST uronyl 2-sulfotransferase -2.07406 0.0232803
BANK1 B-cell scaffold protein with ankyrin repeats 1 -2.09213 0.031057
B3GNT7
UDP-GlcNAc:betaGal beta-1,3-N-acetylglucosaminyltransferase 7 -2.09454 0.0030397
FSD1 fibronectin type III and SPRY domain containing 1 -2.09534 0.0330302
TTC22 tetratricopeptide repeat domain 22 -2.1012 0.0056907
PEX11A peroxisomal biogenesis factor 11 alpha -2.10225 0.0053542
SCAMP5 secretory carrier membrane protein 5 -2.10388 0.0062355
RORC RAR related orphan receptor C -2.10516 0.0382479
ARVCF armadillo repeat gene deleted in velocardiofacial syndrome -2.10592 0.013023
LTK leukocyte receptor tyrosine kinase -2.10633 0.0288813
NEURL1 neuralized E3 ubiquitin protein ligase 1 -2.12112 0.013565
DCANP1 dendritic cell associated nuclear protein -2.12196 0.0160319
SNX29P2 sorting nexin 29 pseudogene 2 -2.12305 0.0459272
CDK5R1 cyclin dependent kinase 5 regulatory subunit 1 -2.14121 0.0141616
PLD4 phospholipase D family member 4 -2.14592 0.0099456
FCGBP Fc fragment of IgG binding protein -2.14621 0.0092739
TNFRSF13C TNF receptor superfamily member 13C -2.15304 0.0188292
BCRP2 breakpoint cluster region pseudogene 2 -2.17262 0.0381664
TAF1A
TATA-box binding protein associated factor, RNA polymerase I subunit A -2.1787 0.0312646
NEIL1 nei like DNA glycosylase 1 -2.1871 8.319E-05 MIR4461 microRNA 4461 -2.19443 0.0412807
TYW1B tRNA-yW synthesizing protein 1 homolog B -2.21106 0.0200958
FCRL3 Fc receptor like 3 -2.23046 0.0135241 CKB creatine kinase B -2.23182 0.0047437
SIGLEC17P sialic acid binding Ig like lectin 17, pseudogene -2.23726 0.0031811
COLQ collagen like tail subunit of asymmetric acetylcholinesterase -2.25817 0.0009115
PRSS57 protease, serine 57 -2.27308 0.0453359 CNR2 cannabinoid receptor 2 -2.29981 0.0026791
GUSBP1 glucuronidase, beta pseudogene 1 -2.31077 0.0205203
NR4A1 nuclear receptor subfamily 4 group A member 1 -2.32315 0.0059576
FLT4 fms related tyrosine kinase 4 -2.33189 0.0014582
ABCB1 ATP binding cassette subfamily B member 1 -2.339 0.004641
CXCR6 C-X-C motif chemokine receptor 6 -2.35231 0.0120273
PACSIN1 protein kinase C and casein kinase substrate in neurons 1 -2.35261 0.0051756
PTGDR prostaglandin D2 receptor -2.3552 0.0199258
MLC1
megalencephalic leukoencephalopathy with subcortical cysts 1 -2.365 0.0008875
EID3 EP300 interacting inhibitor of differentiation 3 -2.37459 0.0182229
GNLY granulysin -2.38501 0.0330034 TSPAN13 tetraspanin 13 -2.38786 0.0264464
PTPRS protein tyrosine phosphatase, receptor type S -2.39957 0.0053254
IL2RB interleukin 2 receptor subunit beta -2.40399 0.0039217
NPIPB13 nuclear pore complex interacting protein family, member B13 -2.42365 0.0328665
ZNF600 zinc finger protein 600 -2.44175 0.0264574
IL5RA interleukin 5 receptor subunit alpha -2.45461 0.0265161
SNX29P1 sorting nexin 29 pseudogene 1 -2.46522 0.049453
DDIT4 DNA damage inducible transcript 4 -2.46956 0.0009322
CLIC3 chloride intracellular channel 3 -2.47763 0.0082996
TLE1 transducin like enhancer of split 1 -2.47904 0.0007586
DLG5 discs large MAGUK scaffold protein 5 -2.49858 0.0373395
FEZ1 fasciculation and elongation protein zeta 1 -2.5656 0.0014376
RHOBTB3 Rho related BTB domain containing 3 -2.57373 0.0036657
KLRF1 killer cell lectin like receptor F1 -2.5835 0.0050963
CIB2 calcium and integrin binding family member 2 -2.59567 0.0052508
TKTL1 transketolase like 1 -2.63432 0.000659 KLRB1 killer cell lectin like receptor B1 -2.63477 0.0044181 CD160 CD160 molecule -2.6527 0.0064253
AKR1C3 aldo-keto reductase family 1 member C3 -2.71495 0.004121
CD200 CD200 molecule -2.71752 0.0111206 DNASE1L3 deoxyribonuclease 1 like 3 -2.73398 0.0232698
LOC100129083 uncharacterized LOC100129083 -2.74858 0.0103561 DGCR6 #N/A -2.76405 0.0011245
CDKN1C cyclin dependent kinase inhibitor 1C -2.7993 0.0002141
KRT72 keratin 72 -2.90727 0.0424502 SPON2 spondin 2 -2.93888 0.0036431
LILRA4 leukocyte immunoglobulin like receptor A4 -3.08886 0.000219
CACNG6 calcium voltage-gated channel auxiliary subunit gamma 6 -3.10357 0.0493918
BOK BOK, BCL2 family apoptosis regulator -3.35396 0.0075881
LYPD2 LY6/PLAUR domain containing 2 -3.44317 0.0057787
GRAPL GRB2 related adaptor protein like -3.57465 0.0207389
SUGT1P3
SGT1 homolog, MIS12 kinetochore complex assembly cochaperone pseudogene 3 -3.82197 0.0496225
SH2D1B SH2 domain containing 1B -4.2341 0.0006026
C1orf220 chromosome 1 open reading frame 220 -4.73395 0.022339
LOC200772 uncharacterized LOC200772 -4.745 2.142E-05
VMO1 vitelline membrane outer layer 1 homolog -4.97296 0.0287608
GSTA4 glutathione S-transferase alpha 4 -5.15902 0.0080917
ZBTB16 zinc finger and BTB domain containing 16 -5.51775 0.0170861
MYOM2 myomesin 2 -5.74507 0.0131296 KRT73 keratin 73 -6.50547 0.0344395
CLEC4F C-type lectin domain family 4 member F -7.08479 0.0296779
OR2A20P
olfactory receptor family 2 subfamily A member 20 pseudogene -9.50386 0.0144929
SLC4A10 solute carrier family 4 member 10 -17.8438 0.0033269
SNORD76 small nucleolar RNA, C/D box 76 -27.9807 0.0472888 MIR647 #N/A -48.4088 0.025591

Supplementary Table 9: Regulation of the 59 genes significantly differentially expressed in SLE subjects with high non-calcified plaque burden compared to SLE subjects with normal non-calcified plaque burden (fold-change ≥ 2 for upregulated genes, and ≤ -2 for downregulated genes, p-value <0.05). Neutrophil-related genes previously found to be most upregulated in LDGs compared to normal density neutrophils (10) are highlighted in yellow.
Gene Symbol Entrez Gene Name Fold-
Change p-value
TMEM252 transmembrane protein 252 7.03763 0.0193792
NKX3-1 NK3 homeobox 1 4.85207 0.0091273 DEFA3 Defensin alpha 3 4.38156 0.0394142
CRISP3 cysteine rich secretory protein 3 3.106 0.0209419
NOMO3 #N/A 2.76842 0.0043311 LCN2 lipocalin 2 2.73774 0.0442046 ITLN1 intelectin 1 2.60061 0.0129626
THEM5 thioesterase superfamily member 5 2.30281 0.0101144
MPO myeloperoxidase 2.29035 0.0463433 PI3 peptidase inhibitor 3 2.2054 0.0315877
HIST1H2BG histone cluster 1 H2B family member g 2.10122 0.0369405
BATF2 basic leucine zipper ATF-like transcription factor 2 2.05999 0.0274363
MS4A3 membrane spanning 4-domains A3 2.02882 0.0233631
TCN1 transcobalamin 1 2.00542 0.0130009
PPP2R2B protein phosphatase 2 regulatory subunit Bbeta -2.05886 0.0263394
OLFM1 olfactomedin 1 -2.07125 0.0446929 GZMA granzyme A -2.07693 0.0156346
TARP TCR gamma alternate reading frame protein -2.09007 0.0121822
HOPX HOP homeobox -2.12706 0.0088919
KLRD1 killer cell lectin like receptor D1 -2.1459 0.0097197
TBX21 T-box 21 -2.1606 0.0040793 FASLG Fas ligand -2.16751 0.0278078

LOC100240735 uncharacterized LOC100240735 -2.1714 0.0088825
CACNA2D2
calcium voltage-gated channel auxiliary subunit alpha2delta 2 -2.17489 0.0174763
APOBEC3H
apolipoprotein B mRNA editing enzyme catalytic subunit 3H -2.17757 0.0020464
LGR6
leucine rich repeat containing G protein-coupled receptor 6 -2.17888 0.0218264
PDGFD platelet derived growth factor D -2.18833 0.0393897
ME3 malic enzyme 3 -2.20867 5.597E-05
CLDND2 claudin domain containing 2 -2.23081 0.0188724
TTC16 tetratricopeptide repeat domain 16 -2.23966 0.0021738
PFN2 profilin 2 -2.24337 0.0124077
FKBP1AP1 FK506 binding protein 1A pseudogene 1 -2.28082 0.0035864
ITPRIPL1
inositol 1,4,5-trisphosphate receptor interacting protein-like 1 -2.28465 0.0133909
ADGRG1 adhesion G protein-coupled receptor G1 -2.30326 0.0095141
LAIR2
leukocyte associated immunoglobulin like receptor 2 -2.31431 0.036983
S1PR5 sphingosine-1-phosphate receptor 5 -2.32629 0.0056726
RGS9 regulator of G-protein signaling 9 -2.40654 0.0027602
LOC642846
DEAD/H (Asp-Glu-Ala-Asp/His) box polypeptide 11-like -2.41742 0.0390756
GOLGA8B #N/A -2.45194 0.0425053
CYP4F35P
cytochrome P450 family 4 subfamily F member 35, pseudogene -2.46568 0.0189729
C1orf21 chromosome 1 open reading frame 21 -2.49239 0.0109938
NMUR1 neuromedin U receptor 1 -2.59738 0.001365
KLRC3 killer cell lectin like receptor C3 -2.63174 0.0088791
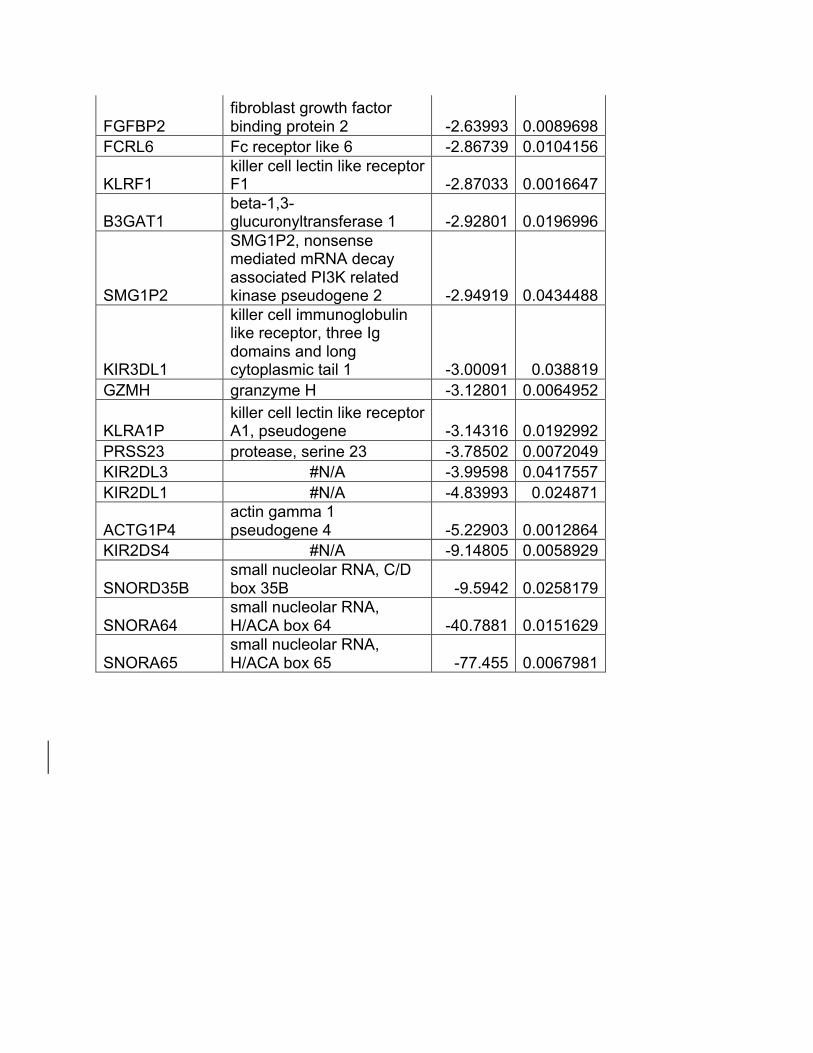
FGFBP2 fibroblast growth factor binding protein 2 -2.63993 0.0089698
FCRL6 Fc receptor like 6 -2.86739 0.0104156
KLRF1 killer cell lectin like receptor F1 -2.87033 0.0016647
B3GAT1 beta-1,3-glucuronyltransferase 1 -2.92801 0.0196996
SMG1P2
SMG1P2, nonsense mediated mRNA decay associated PI3K related kinase pseudogene 2 -2.94919 0.0434488
KIR3DL1
killer cell immunoglobulin like receptor, three Ig domains and long cytoplasmic tail 1 -3.00091 0.038819
GZMH granzyme H -3.12801 0.0064952
KLRA1P killer cell lectin like receptor A1, pseudogene -3.14316 0.0192992
PRSS23 protease, serine 23 -3.78502 0.0072049 KIR2DL3 #N/A -3.99598 0.0417557 KIR2DL1 #N/A -4.83993 0.024871
ACTG1P4 actin gamma 1 pseudogene 4 -5.22903 0.0012864
KIR2DS4 #N/A -9.14805 0.0058929
SNORD35B small nucleolar RNA, C/D box 35B -9.5942 0.0258179
SNORA64 small nucleolar RNA, H/ACA box 64 -40.7881 0.0151629
SNORA65 small nucleolar RNA, H/ACA box 65 -77.455 0.0067981