supplementary materials for - sciencescience.sciencemag.org/content/sci/suppl/2016/01/13/... ·...
TRANSCRIPT

www.sciencemag.org/cgi/content/full/science.aad8282/DC1
Supplementary Materials for
Structures of a CRISPR-Cas9 R-loop complex primed for DNA cleavage
Fuguo Jiang, David W. Taylor, Janice S. Chen, Jack E. Kornfeld, Kaihong Zhou, Aubri J. Thompson, Eva Nogales,* Jennifer A. Doudna*
*Corresponding author. E-mail: [email protected] (J.A.D.); [email protected] (E.N.)
Published 14 January 2016 on Science First Release DOI: 10.1126/science.aad8282
This PDF file includes:
Materials and Methods Figs. S1 to S11 Tables S1 and S2 References
Other Supplementary Material for this manuscript includes the following: (available at www.sciencemag.org/cgi/content/full/science.aad8282/DC1)
Movies S1 to S3

2
Materials and Methods
SpyCas9 expression and purification
Recombinant wild-type Streptococcus pyogenes Cas9 (SpyCas9) was expressed in
Escherichia coli strain BL21 (DE3) (Novagen) and purified as described previously (14).
Briefly, WT-SpyCas9 protein expression was induced by addition of isopropyl β-D-1-
thiogalactopyranoside (IPTG) to 0.2 mM for 20 h at 18°C. The harvested cells (~ ten-
gram cell pellets) were resuspended in 100 mL immobilized metal affinity
chromatography (IMAC) buffer containing 25 mM sodium phosphate pH 8.0, 600 mM
NaCl, 5 mM imidazole and 5% glycerol. The cell suspension was sonicated on ice and
further clarified by centrifugation at 20,000g for 45 min. The soluble fraction of His-
SUMO-tagged SpyCas9 fusion protein was then loaded onto a Nickel-charged
nitrilotriacetic acid (NTA) agarose resin (Qiagen) and eluted from NTA resin with IMAC
buffer supplemented with 150 mM imidazole, pH 7.5. After removing the 6xHis-SUMO-
tag by overnight proteolysis at 4°C in 50 mM HEPES pH 7.5, 200 mM NaCl, 5 mM DTT
and 5% glycerol, the protein solution was adjusted to 100 mM NaCl before loading onto
a prepacked SP Sepharose High Performance strong cation exchange column (HiTrap SP
HP, GE Healthcare). The tag-free SpyCas9 was then eluted with a linear NaCl gradient of
100-600 mM over 30 column volumes, followed by heparin-Sepharose chromatography
(HiTrap Heparin HP, GE Healthcare) and gel filtration chromatography (HiLoad 16/60
Superdex200, GE Healthcare). The purified WT-SpyCas9 protein was dialyzed into 50
mM Tris-HCl pH 8.0, 150 mM NaCl, 5 mM DTT, 10% glycerol and 20 mM EDTA, and
further concentrated to 10.5 mg ml-1
before flash-frozen in liquid nitrogen and stored at -
80°C. UV absorption at 280 nm was used to estimate the final SpyCas9 protein
concentration.
Selenomethionine (SeMet)-labeled WT-SpyCas9 was overexpressed in Rosetta
(DE3) cells grown in M9 minimal medium supplemented with 60 mg ml-1
L-SeMet
(Sigma-Aldrich) and specific amino acids (lysine, phenylalanine and threonine at 100 mg
ml-1
; leucine, isoleucine and valine at 50 mg ml-1
) to inhibit endogenous methionine
biosynthesis. The SeMet-modified proteins were purified identically to the native
SpyCas9 protein.
RNA transcription and purification
Large-scale in vitro transcription was used to synthesize the single-guide RNA
used in this study, with the recombinant T7 RNA polymerase and linearized plasmid
DNA as template (Integrated DNA Technologies). Briefly, 20-mL transcription reactions
were conducted in the transcription buffer containing 50 mM Tris-HCl pH 8.1, 40 mM
MgCl2, 2 mM spermidine, 10 mM DTT, 0.1% Triton X-100, 4 mM each NTP, 100 μg
mL-1
His-tagged T7 RNA polymerase, and ∼500 μg linearized DNA template. After
transcription at 37°C for 4-8 h, the target RNA was separated from abortive transcripts
and n+1 additions by 8~10% denaturing urea polyacrylamide gel electrophoresis
(PAGE). The target RNA was then passively diffused into DEPC-treated water overnight
at 4°C. The eluted RNA was concentrated and buffer exchanged into RNase-free water
using a spin concentrator with a 10-kDa cutoff (Millipore). The purified in vitro
transcribed sgRNA was refolded immediately after concentration by heating the RNA to
95°C for 5 min and cooling it slowly to room temperature. RNA concentrations were

3
measured by UV absorbance at 260 nm using a NanoDrop Spectrophotometer (Thermo
Scientific).
Reconstitution of the SpyCas9–sgRNA–dsDNA ternary complex
Reconstitution of the Cas9–sgRNA–dsDNA complex was carried out by mixing
purified SpyCas9, in vitro transcribed sgRNA and target duplex DNA in a 1:1.5:2.0
molar ratio at room temperature for at least 30 min. Notably, 20 mM
ethylenediaminetetraacetic acid (EDTA) was used to chelate metal ions (Mg2+
in
particular) in order to prevent DNA cleavage during complex reconstitution and
subsequent crystallization. The ternary complex was further purified by analytical size-
exclusion chromatography through a Superdex 200 Increase 10/300 GL column (GE
Healthcare) equilibrated with the buffer containing 30 mM Tris-HCl pH 7.5, 200 mM
NaCl, 5 mM DTT, and 20 mM EDTA. Eluates were simultaneously monitored by
ultraviolet absorbance at 260 nm and 280 nm. The eluted ternary complex was
concentrated with a spin concentrator (10-kDa cutoff) to 6.0 mg ml-1
prior to
crystallization. Noticeably, the Seleno-methionine (SeMet)-substituted Cas9–sgRNA–
dsDNA complex was assembled similarly, except that 2 mM Tris(2-
carboxyethyl)phosphine hydrochloride (TCEP) was used instead of 5 mM DTT. The
concentration of the Cas9–sgRNA–dsDNA ternary complex was estimated by UV
absorption, with the sum of SpyCas9 and sgRNA extinction coefficients at 260 nm.
Crystallization and data collection
Crystallization conditions for the purified Cas9–sgRNA–dsDNA complex were
identified with a Mosquito high-throughput crystallization robot (TTP Labtech). The
ternary complex was crystallized in both native and SeMet-derivative forms by the
sitting-drop vapour-diffusion method at 18°C using ammonium sulfate as a precipitant.
Crystals of the SpyCas9–sgRNA–dsDNA ternary complexes were further optimized by
the hanging drop vapor diffusion method at room temperature (~22°C). Aliquots (3.0 μl)
of 6.0 mg ml-1
Cas9–sgRNA–dsDNA complex were mixed with 3.0 μl of reservoir
solutions containing 1.8 M ammonium sulfate, 100 mM Tris-HCl pH8.0 and 10 mM
EDTA. Rod-like crystals appeared after 1-2 days, and reached to a maximum size of 0.10
× 0.15 × 0.30 mm over the course of 4 days. Both SeMet-labeling and 5-
iododeoxyuridines (5-IdU) substituted SpyCas9–sgRNA–dsDNA crystals were grown in
the similar conditions of the native. For cryoprotection, crystals were transferred into
either a 4.5 M saturated ammonium sulfate solution for 10 s or a well solution containing
10% glycerol and 10% xylitol for 30-45 s before flash-frozen in liquid nitrogen.
Diffraction data were collected at 100 K on beamline 8.3.1 at the Advanced Light Source
(ALS). All diffraction data were indexed and integrated using Mosflm (22) and further
scaled in SCALA with anisotropy correction (23). The crystals belong to space group
F222 and contain one Cas9–sgRNA–dsDNA complex per asymmetric unit, with a
corresponding Matthews coefficient of 4.20 Å3
Da-1
and a solvent content of 70.71%.
This high solvent content may explain the limited resolution of the crystals.
Structure determination and refinement
Two-wavelength MAD (multi-wavelength anomalous dispersion) phasing method
was used to determine the crystal structure of Cas9–sgRNA–dsDNA ternary complex
(catalytically-active unwound but pre-cleavage state). The initial MAD density map was

4
obtained by locating 22 selenium atoms in datasets PEAK and HREM (high energy
remote) using the HySS (24) routine implemented in the Phenix graphical user interface
(25). Individual protein domains derived from PAM-containing partial duplex DNA-
bound structure (PDB ID 4UN3) including RuvC domain, helical domain 1, CTD
domain, and the sgRNA in the ssDNA-bound structure (PDB ID 4OO8) were
sequentially positioned using MOLREP (26) or manually into the interpretable MAD
electron density map that is calculated at 3.8 Å resolution by SOLVE (27), followed by
solvent flattening with RESOLVE (28). After rigid body refinement and one subsequent
round of simulated annealing refinement in Phenix, nearly the entire unwound DNA
substrate (except the most 5 end of the non-target DNA, nucleotides from position -20 to
-10) and the rest of the protein domains, including the highly flexible helical domain 2
and 3 in the REC lobe and the most mobile HNH domain from the NUC lobe, could be
discerned unambiguously. Manual model building was performed in COOT (29) with the
guidance from the (2Fo − Fc), (Fo − Fc), B-factor sharpened (2Fo −Fc) and simulated
annealing omit |Fo − Fc| electron density maps, and further judged successfully by a
decrease in Rwork and Rfree during refinement. A near-complete model of the Cas9–
sgRNA–dsDNA ternary complex was then used for rigid body refinement with the
program Phaser (30) in Phenix against the 3.4 Å-resolution native dsDNA-bound data set.
Five cycles of simulated annealing refinement were conducted in Phenix to remove
model bias. Subsequent iterative rounds of structure refinement (grouped and restrained
coordinate refinement, restrained individual isotropic atomic displacement refinement, as
well as translation-libration-screw refinement) were performed using the program
Phenix.refine (25) and Refmac5 (31) in the CCP4 suite. The final refined model has Rwork
and Rfree values of 23.1% and 29.6%, respectively. Model validation with MolProbity
(32) showed 92.0% of the residues in the most favored and 6.4% in the allowed regions
of the Ramachandran plot. Data collection and refinement statistics for Cas9–sgRNA–
dsDNA structure are summarized in Supplementary Table S1. Structural analysis was
performed in Coot (29) and all structure figures were prepared using PyMOL
(Schrodinger LLC), except for for the cryo-EM figures, which were generated with
Chimera (UCSF, Computer Graphics Lab).
Fluorescence-based thermal shift assays
Thermal shift assays were performed using the Applied Biosystems 7900HT Fast
Real-Time PCR machine with 10 µM of SpyCas9 diluted in 20 mM Tris-HCl pH 7.5, 150
mM NaCl, 10 mM EDTA, 5 mM DTT, and assayed with the appropriate concentration of
ligand in a total reaction volume of 50 μl as previously described (33, 34). A 5x dilution
of SYPRO Orange dye (Invitrogen) was used as a probe with fluorescence recorded at
530 nm while the temperature was increased from 25 to 80°C with a ramp of 0.2 °C over
the course of 60 min. Control experiments were carried out in the absence of SpyCas9
protein or nucleic acids (sgRNA and DNA substrates) to check that no fluorescence
signal was recorded. The protein melting temperature (Tm) corresponding to the midpoint
for the protein unfolding transition was calculated by fitting to a Boltzmann sigmoidal
curve using the software Prism 6 (GraphPad Software, Inc.). Changes in the unfolding
transition temperature relative to the protein (SpyCas9 alone) control curve (ΔTm) were
further calculated for each ligand to estimate the protein stability upon sgRNA and target
DNA binding.

5
Cryo-electron microscopy
Target-bound Cas9 complexes in a buffer containing 30mM Tris 8.0, 150mM
NaCl, 20mM EDTA, 5mM DTT and 0.1% glycerol were frozen in vitreous ice.
Immediately after glow-discharging for 8 seconds using a Solaris plasma cleaner, 4 μl
droplets of the sample (~0.25 mg ml-1
) were placed onto C-flat grids containing 4 μm
holes with 2 μm spacing between holes (Protochips Inc.) with a thin layer of carbon over
the holes. The grids were rapidly plunged into liquid ethane using an FEI Vitrobot
MarkIV maintained at 4 °C and 100% humidity after being blotted for 5 seconds with a
blot force of 20. Data were acquired using a FEI Titan Krios transmission electron
microscope (at the HHMI Cryo-EM Shared Resource at Janelia Research Campus)
operating at 300 keV at a nominal magnification of ×29,000 (1.01 A at the specimen
level) with defocus ranging from −2.0 to −4.5 μm. A total of ~5,600 micrographs were
automatically recorded on a Gatan K2 Summit direct electron detector operated in
counting mode using the MSI-Template application within the automated
macromolecular microscopy software LEGINON (35). We collected a 6 s exposure
fractionated into 20, 300 ms frames with a dose of 8 e
-A
-2s
-1.
3D reconstruction and analysis
All image pre-processing was performed in Appion (36). The contrast transfer
function (CTF) of each micrograph was estimated using CTFFind3 (37). Particles were
selected concurrently with data collection with a template-based particle picker using
reference-free 2D class averages of negatively stained Cas9 complexes as templates (13).
We selected ~425,000 particles using this approach.
Individual movie frames were aligned and averaged using ‘dosef_gpu_driftcorr’
drift-correction software from UCSF. These drift-corrected micrographs were binned by
8, and bad micrographs and bad regions of micrographs were removed using the ‘manual
masking’ command within Appion (36). Reference-free 2D alignment and classification
was performed in RELION (38) using 100 classes to remove junk, leaving a starting
stack of ~320,000 particles. Using the negative stain DNA-bound Cas9 structure (EMD-
5860) (13) low-pass filtered to 60-A as a reference, we performed 3D classification with
3 classes within RELION and selected the best model with the largest number of particles
(~215,000) for further processing. The other two classes likely represented unassembled
complexes and junk. We performed a second round of 3D classification using 3 classes
within RELION and selected particles from the two most abundant classes corresponding
to RNA-bound Cas9 and target DNA-bound Cas9 for further processing. We performed
3D autorefine in RELION on ~160,000 and ~50,000 particles of RNA-bound Cas9 and
DNA-bound Cas9 complexes, respectively, using the corresponding class model low-pass
filtered to 60-A as a starting model to produce structures at 4.6 and 6.7-A resolution after
post processing.
In order to improve the accuracy of the alignment of individual particle images of
both RNA- and DNA target-bound datasets, we performed alignparts_lmbfgs on movies
(39) to correct for beam-induced motion. We used a local standard deviation of 500
pixels to group the particles for this alignment. We performed exposure weighting using
the curve derived by Grant et al. (40). For the DNA-bound dataset, these “shiny
particles” were then used for another round of 3D autorefine. For the RNA-bound Cas9
dataset, these “shiny particles” were subjected to a final round of 3D classification. We

6
performed 3D autorefine on the most abundant class of ~135,000 shiny particles to obtain
a final model of RNA-bound Cas9. This protocol yielded final RNA- and DNA-bound
Cas9 reconstructions at 4.47 and 6.06-A resolution, respectively. The local resolution was
calculated using the “blocres” function in the Bsoft package (41). We used RELION to
automatically calculate B-factors and apply them to the post-processed maps. The applied
B-factors were between –160- and –200-A2. All reported resolutions are based on the
gold standard 0.143 FSC criterion using two independent half-maps. While we calculated
the local resolution of both maps, the volumes were filtered according to their global
resolution estimate.
Docking and analysis
The final reconstructions were segmented using Segger in Chimera (42) based on
inspection of the maps and available crystal structures (13-16) rigidly docked into the
maps using Fit in Map (42) in Chimera. All cryo-EM figures and movies were generated
using UCSF Chimera.
Psuedoatomic models of regions missing from the crystal structure were
generated using docking of models into the cryo-EM density. To model the PAM-distal
DNA duplex in the dsDNA-bound Cas9 structure, we first docked the crystal structure of
the Cas9–sgRNA–dsDNA complex (from this study) into the cryo-EM density using Fit
in Map (42). We then docked a 10-bp B-form DNA duplex in the density in our structure
to create an R-loop model. To model the ten 5-most nucleotides (nt 1-10) of the sgRNA
in the RNA-bound Cas9 EM structure, we docked the crystal structure of Cas9–sgRNA
binary (PDB 4ZT0) into the cryo-EM density using Fit in Map (42). Next, we modeled
the backbone of single-stranded RNA using COOT (29) by tracing the EM density of the
5-end of the guide RNA. The electrostatic potential surface for the dsDNA-bound Cas9
crystal structure (Fig. S11) was calculated using the Adaptive Poisson-Boltzmann Solver
(APBS) software package (43). Briefly, the PDB file for DNA-bound Cas9 was
converted to a PQR file using PDB2PQR (44). The PQR file was analyzed through APBS
using the default settings to generate the surface potential map.

7
Fig. S1
Visualization of the wide central channel formed between the NUC and REC lobes,
and the narrow side tunnel located within the NUC lobe. The molecular surface is
shown in the same orientation as in Fig. 1D. (A) Surface representation of the Cas9–
sgRNA–dsDNA ternary complex, with target DNA colored dark blue, non-target DNA in
purple and sgRNA in orange. For clarity, the HNH domain is not shown. (B) Electrostatic
potential surface representation of the ternary complex, calculated using the PyMOL
APBS plugin. The HNH nuclease domain is omitted for clarity. (C) Surface
representation of the Cas9 protein with the HNH domain depicted as ribbon diagram,
showing that the non-target DNA strand runs across the side tunnel formed between the
HNH and RuvC nuclease domains.

8
Fig. S2
Evidence for correct sequence register of the crystallographic model using 5-
iododeoxyuridines (5-IdU) in place of three thymidines on the non-target strand. (A)
Nucleotide sequences of the target dsDNA and sgRNA used in this study, where X
indicates the 5-IdU in the non-target DNA strand. (B) The sequence register of non-target
DNA strand in our crystallographic model was confirmed by carrying out molecular
replacement against the 5-IdU derivative dataset (4.2 Å resolution) with the refined
model from the 3.4 Å-resolution native dataset as the search model. Anomalous
difference Fourier map showed an electron density feature (green mesh) with a peak
height of 8.0 standard deviations above mean peak height (σ) adjacent to the 5 position of
residues IdU(+1) and IdU(-8). Analysis of dissolved crystals on 7 M Urea-denaturing
PAGE gel demonstrated that the dsDNA substrate in the crystalline state is intact (data
not shown). Therefore, the lack of electron density for residues IdU(-13) indicates
crystallographic disorder of the 5 end of the non-target DNA strand, but not DNA
scission.
9
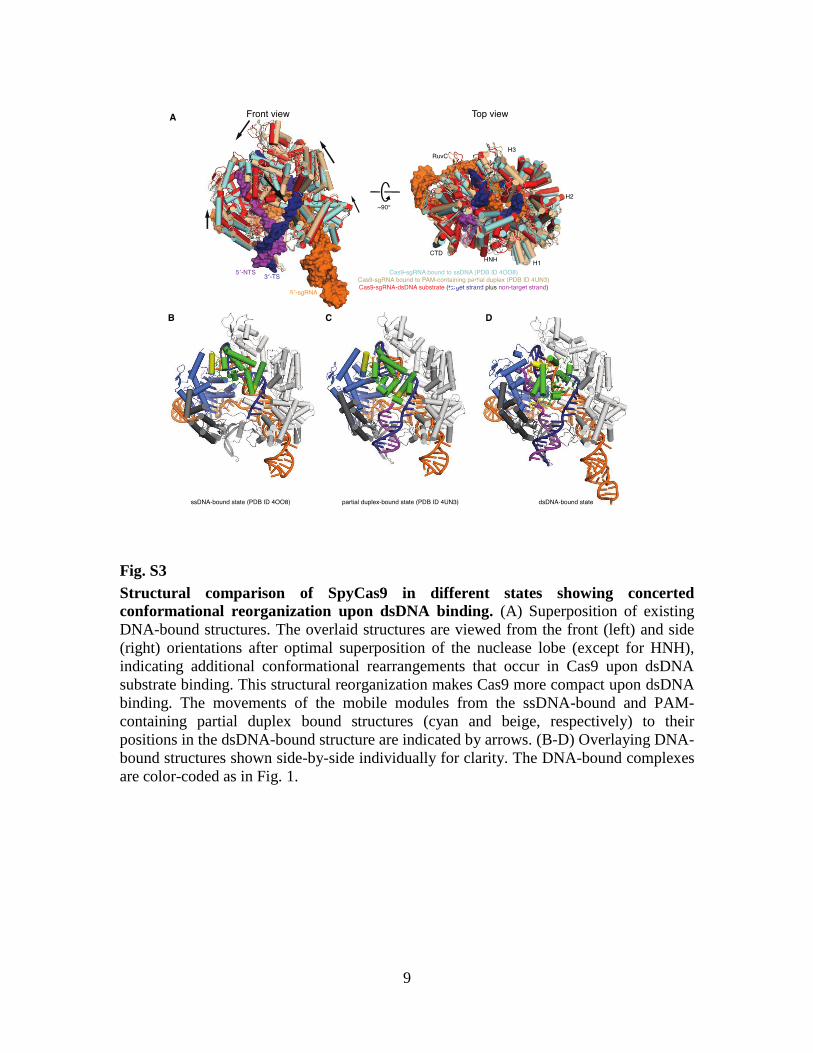
Fig. S3
Structural comparison of SpyCas9 in different states showing concerted
conformational reorganization upon dsDNA binding. (A) Superposition of existing
DNA-bound structures. The overlaid structures are viewed from the front (left) and side
(right) orientations after optimal superposition of the nuclease lobe (except for HNH),
indicating additional conformational rearrangements that occur in Cas9 upon dsDNA
substrate binding. This structural reorganization makes Cas9 more compact upon dsDNA
binding. The movements of the mobile modules from the ssDNA-bound and PAM-
containing partial duplex bound structures (cyan and beige, respectively) to their
positions in the dsDNA-bound structure are indicated by arrows. (B-D) Overlaying DNA-
bound structures shown side-by-side individually for clarity. The DNA-bound complexes
are color-coded as in Fig. 1.

10
Fig. S4
Comparison of the Cas9 enzyme structure in the R-loop complex with prior nucleic
acid-bound complexes indicates that the closing of the Cas9 conformation upon
dsDNA-substrate binding drives the helical domain 2 to directly contact the target
strand. For clarity, only Cas9’s HNH and helical domain 2 are shown. Notably, the
helical domain 2 in the REC lobe does not make contacts with RNA-DNA heteroduplex
in previously reported structures, including Cas9–sgRNA pre-targeting complex (A, PDB
ID 4ZT0), ssDNA-bound (B, PDB ID 4OO8) and PAM-containing partial duplex-bound
(C, PDB ID 4UN3) structures. However, this domain makes hydrogen-bonding
interactions with the deoxyribose-phosphate backbone in the target DNA strand through
residues Ser267
and Asp269
in the dsDNA-bound structure (D). Indeed, deletion of this
domain resulted in markedly decreased Cas9 activity (~50% loss). It is also worth noting
that the HNH makes very few contacts with the rest of the Cas9 protein in prior
structures, while it forms extensive interactions with the helical domain 2 upon binding to
dsDNA. These newly formed intra-domain interactions appear to play an important role
in locking the HNH domain in an activated conformation for subsequent DNA strand
scission.

11
Fig. S5
Thermal stability assays of SpyCas9 in the absence or presence of sgRNA and/or
DNA substrates. (A) Representative raw fluorescence data collected from a quantitative
real-time thermocycler. SYPRO Orange fluorescence is used as reporter of protein
thermal stability. Protein melting temperature (Tm) was determined by fitting a
Boltzmann sigmoid curve to the fluorescence intensity data. (B) The bar graph shows the
mean melting temperature difference (ΔTm) compared with the protein alone and the error
bars represent the standard deviation from three independent measurements.
12
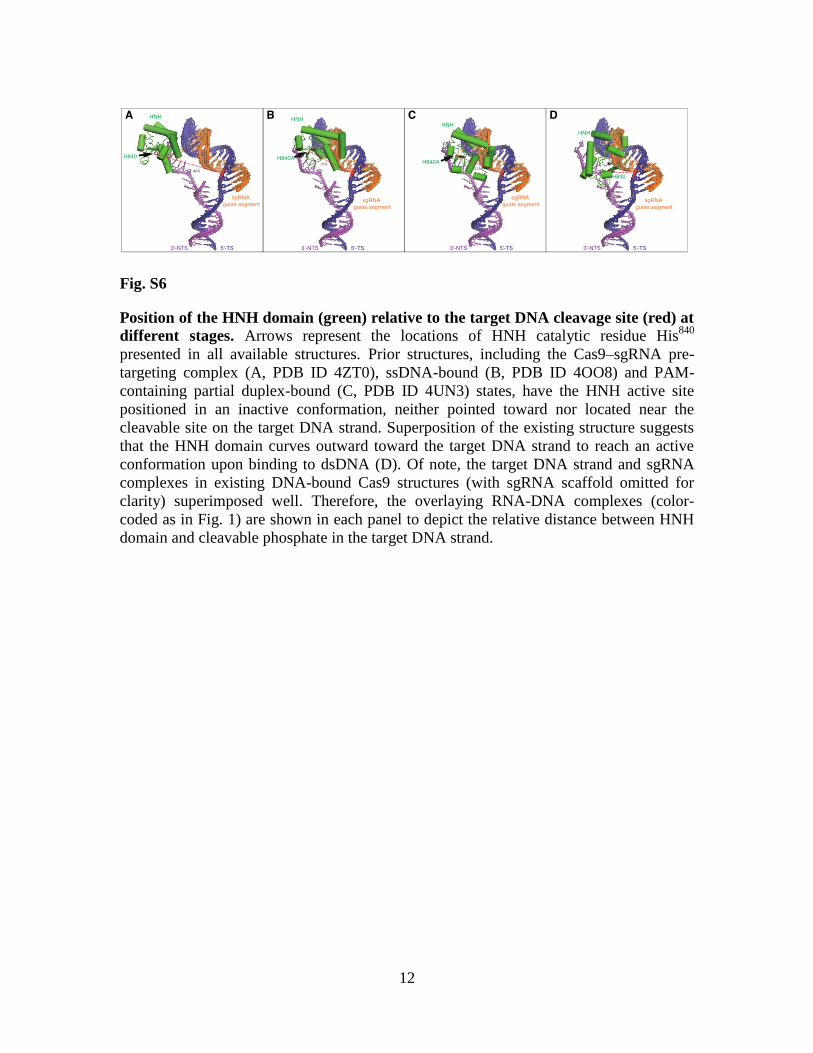
Fig. S6
Position of the HNH domain (green) relative to the target DNA cleavage site (red) at
different stages. Arrows represent the locations of HNH catalytic residue His840
presented in all available structures. Prior structures, including the Cas9–sgRNA pre-
targeting complex (A, PDB ID 4ZT0), ssDNA-bound (B, PDB ID 4OO8) and PAM-
containing partial duplex-bound (C, PDB ID 4UN3) states, have the HNH active site
positioned in an inactive conformation, neither pointed toward nor located near the
cleavable site on the target DNA strand. Superposition of the existing structure suggests
that the HNH domain curves outward toward the target DNA strand to reach an active
conformation upon binding to dsDNA (D). Of note, the target DNA strand and sgRNA
complexes in existing DNA-bound Cas9 structures (with sgRNA scaffold omitted for
clarity) superimposed well. Therefore, the overlaying RNA-DNA complexes (color-
coded as in Fig. 1) are shown in each panel to depict the relative distance between HNH
domain and cleavable phosphate in the target DNA strand.
13
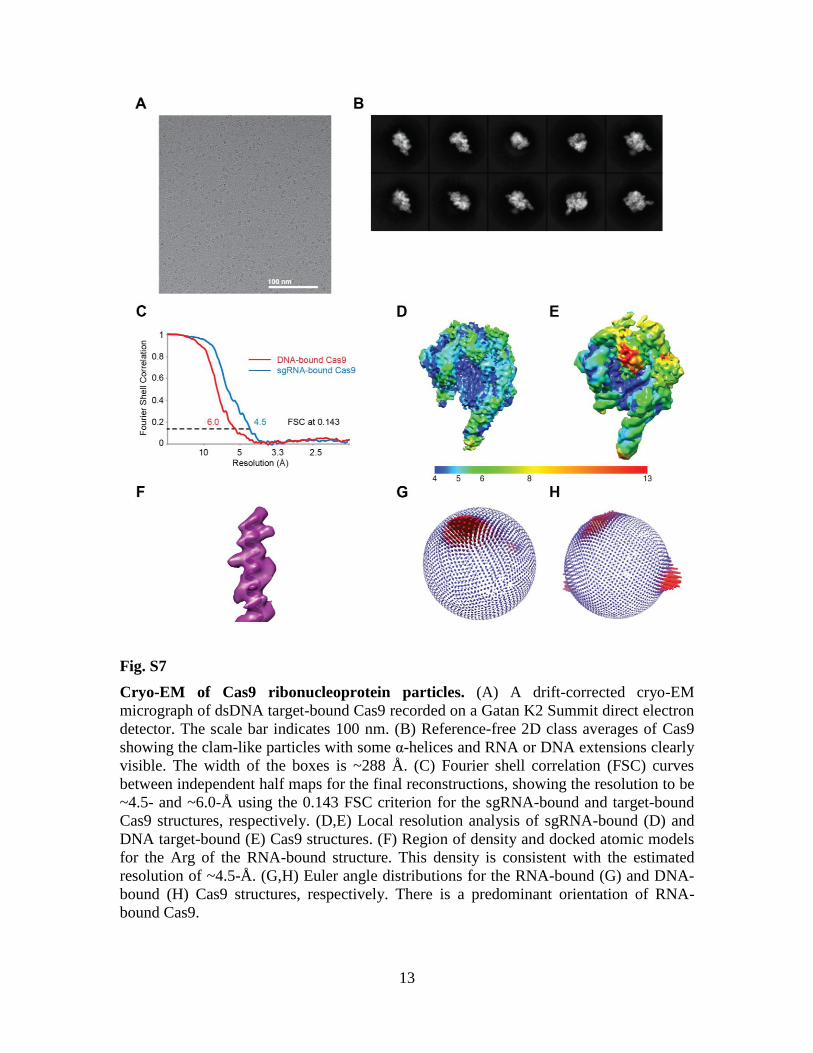
Fig. S7
Cryo-EM of Cas9 ribonucleoprotein particles. (A) A drift-corrected cryo-EM
micrograph of dsDNA target-bound Cas9 recorded on a Gatan K2 Summit direct electron
detector. The scale bar indicates 100 nm. (B) Reference-free 2D class averages of Cas9
showing the clam-like particles with some α-helices and RNA or DNA extensions clearly
visible. The width of the boxes is ~288 Å. (C) Fourier shell correlation (FSC) curves
between independent half maps for the final reconstructions, showing the resolution to be
~4.5- and ~6.0-Å using the 0.143 FSC criterion for the sgRNA-bound and target-bound
Cas9 structures, respectively. (D,E) Local resolution analysis of sgRNA-bound (D) and
DNA target-bound (E) Cas9 structures. (F) Region of density and docked atomic models
for the Arg of the RNA-bound structure. This density is consistent with the estimated
resolution of ~4.5-Å. (G,H) Euler angle distributions for the RNA-bound (G) and DNA-
bound (H) Cas9 structures, respectively. There is a predominant orientation of RNA-
bound Cas9.

14
Fig. S8
Classification and refinement workflow used in this study. A total starting stack of
~425,00 particles were subjected to 2D reference-free alignment and classification. A
subset of ~320,000 particles from good 2D classes were selected for 3D classification
using 3 classes and the negative stain DNA-bound Cas9 structure (EMD-5860) low-pass
filtered to 60-A as a reference. The class with the most particles (~215,000) was
subjected to an additional round of 3D classification using its model as a reference. This
yielded a DNA-bound Cas9 dataset, which was subsequently refined to 6.7-A resolution
and an RNA-bound Cas9 dataset, which was subsequently refined to 4.6-A resolution. To

15
further improve the reconstruction, both the RNA- and DNA-bound datasets were
subjected to “particle polishing” using alignparts_lmbfgs from John Rubinstein’s lab on
movies (39). The “polished” DNA-bound Cas9 dataset was subjected to a final round of
3D autorefine yielding a 6.06 A reconstruction. The “polished” RNA-bound Cas9 dataset
was subjected to another 3D classification. A final dataset of ~135,000 “polished” RNA-
bound Cas9 particles was subjected to 3D autorefine yielding a 4.47 A reconstruction. All
steps were performed in RELION (38), with the exception of particle polishing.

16
Fig. S9
Beam-induced motion correction for Cas9 RNPs. Representative 5-fold exaggerated
per-particle movements (rainbow lines) from a cryo-EM micrograph of DNA-bound Cas9
complexes. The x-axis and y-axis show the x dimension of the movie and the y
dimension of the movie in pixels, respectively. The far right y-axis shows the color code
corresponding to each of the 20 frames of the movie.

17
Fig. S10
Architecture of the Cas9-R loop complex. (A, C) Cryo-EM reconstructions of sgRNA-
bound Cas9 (A) and Cas9-sgRNA bound to a 40-bp target dsDNA (C) at 4.5- and 6.0-Å
resolution (using the 0.143 gold standard Fourier Shell Correlation criterion),
respectively. Subunits are segmented and colored as indicated. (B, D) Docking of the
Cas9-sgRNA crystal structure (PDB 4ZT0) into our sgRNA-bound Cas9 cryo-EM
reconstruction (B) and our pseudo-atomic Cas9-R loop structure created by docking the
crystal structure of Cas9–sgRNA bound to a 30-bp target dsDNA (Fig. 1) and modeling
the PAM-distal 10-bp of dsDNA into the target-bound cryo-EM structure (D) using
COOT (29).

18
Fig. S11
Surface features of DNA-bound Cas9 based on electrostatic potential. The molecular
surface of Cas9 colored according to electrostatic potential. Red and blue indicate
negatively charged and positively charged surface features, respectively. The black
dashed line indicates the un-modeled region of the non-target DNA strand. The inset
shows an enlarged view of this region.

19
Table S1. Crystallographic data and refinement statistics
Dataset Native Se-MAD (peak) Se-MAD (remote) 5-IdU
X-ray source ALS 8.3.1 ALS 8.3.1 ALS 8.3.1 ALS 8.3.1
Space group F2 2 2 F2 2 2 F2 2 2 F2 2 2
Cell dimensions
a, b, c (Å) 147.9, 230.1, 417.6 147.6, 231.8, 418.1 147.6, 231.8, 418.1 149.8, 233.4, 420.5
(o) 90, 90, 90 90, 90, 90 90, 90, 90 90, 90, 90
Wavelength (Å) 1.116 0.980 0.957 1.115
Resolution (Å)* 119.2-3.4 (3.6-3.4) 119.2-3.6 (3.8-3.6) 92.9-3.8 (4.0-3.8) 93.7-4.2 (4.4-4.2)
Rmerge (%)* a 0.096 (0.520) 0.232 (1.207) 0.175 (1.116) 0.162 (0.952)
Rpim (%)* b 0.056 (0.314) 0.050 (0.453) 0.02 (0.245) 0.07 (0.459)
I/I* 6.7(1.9) 10.0 (2.1) 10.9 (2.3) 10.6 (1.8)
CC1/2* c
0.99 (0.97) 0.98 (0.62) 0.99 (0.60) 0.99 (0.65)
Completeness (%)* 99.9 (99.7) 98.9 (98.5) 99.8 (98.7) 99.9 (100.0)
Redundancy* 3.8 (3.6) 8.6 (8.0) 8.2 (7.8) 4.2 (4.0)
Wilson B factor (Å2) 114 120.5 137.9 154.8
Figure of merit d 0.42
Refinement
Resolution (Å) 69.7-3.4
No. reflections 182405
Unique reflections 48447
Rwork / Rfree e 0.231/0.296
No. atoms
Protein 10146
Nucleic Acid 3491
Ligands 15
B-factors (Å2)
mean 131
Protein 129
Nucleic Acid 135
Ligands 132
R.m.s. deviations
Bond lengths (Å) 0.01
Bond angles (o) 1.49
Ramachandran plot
% favoured 92.00
% allowed 6.40
% outliers 1.60
Molprobity
Clashscore 14

20
* Highest resolution shell is shown in parentheses.
a. Rmerge = Σhkl|I - <I>|/ΣIhkl, where I is the observed intensity for a reflection and <I> is the
average intensity of a unique reflection obtained from symmetry-related and multiple
measurements. b.
Rpim is the precision-indicating (multiplicity-weighted) Rmerge. c.
CC1/2 is the percentage of correlation between intensities from random half-datasets. d.
Figure of merit = <|ΣP(α)eiα
/ ΣP(α)|>, where α is the phase and P(α) is the phase
probability distribution. e.R
= hkl||Fobs| - |Fcalc||/hkl|Fobs|, where Fcalc and Fobs are calculated and observed structure
factor amplitudes, respectively. Rfree was calculated as Rwork using 5% of reflections
excluded in refinement. Rwork is calculated for the remaining reflections.

21
Table S2. List of nucleic acid reagents used in this study
Description DNA substrates used in this study
λ1 DNA sequence
(Top: non-target strand;
Bottom: target strand;
PAM colored red)
5’-GGCGCATAAAGATGAGACGCTGG-3’
|||||||||||||||||||||||
3’-CCGCGTATTTCTACTCTGCGACC-5’
λ1 target DNA duplex
(30bp) used in
crystallization and
thermal shift assay
5’-GGCGCATAAAGATGAGACGCTGGCGATTAG
||||||||||||||||||||||||||||||
CCGCGTATTTCTACTCTGCGACCGCTAATC-3’
λ1 target DNA duplex
(40bp) used in cryo-EM
studies
5’-GCACAACTACGGCGCATAAAGATGAGACGCTGGCGATTAG
||||||||||||||||||||||||||||||||||||||||
CGTGTTGATGCCGCGTATTTCTACTCTGCGACCGCTAATC-3’
λ1 target DNA strand
(20 nt)
5’-GCGTCTCATCTTTATGCGCC-3’
λ1 PAM-containing
partial duplex DNA
5’-TGGCGATTAG
||||||||||
CCGCGTATTTCTACTCTGCGACCGCTAATC-3’
λ1 target DNA duplex
(30 bp) with a mutated
PAM sequence
(highlighted in green)
5’-GGCGCATAAAGATGAGACGCTCACGATTAG
||||||||||||||||||||||||||||||
CCGCGTATTTCTACTCTGCGAGTGCTAATC-3’
λ4 DNA duplex (30 bp,
lacking a λ1 target
sequence, colored
purple)
5’-GAGATATAGCCTGGTGGTTCTGGCGATTAG
||||||||||||||||||||||||||||||
CTCTATATCGGACCACCAAGACCGCTAATC-3’
22
Movie S1
Architecture of the sgRNA-bound Cas9. This movie shows 360° rotations of the
sgRNA-bound Cas9 reconstruction with and without the crystal structure (PDB 4ZT0)
(14) docked into the structure. First, the sgRNA is shown with the 5-most ten nucleotides
(nts. 1–10) of the guide region of the RNA built into the EM density. Second, the Hel I–
III, Arg and CTD domains are added; third, the RuvC and HNH domains are added to
show the architecture of the entire complex. The crystal structure for sgRNA-bound Cas9
is docked as in Fig. S10B.
Movie S2
Architecture of the dsDNA target-bound Cas9. This movie shows 360° rotations of the
DNA-bound Cas9 reconstruction with and without the crystal structure (this study)
docked into the structure. First, the sgRNA is shown, excluding the 20 nts of the guide
region; second, the sgRNA:target-strand DNA heteroduplex, PAM duplex, non-target
DNA strand and PAM-distal duplex are added; third, the Hel I–III, Arg and CTD
domains are added; fourth the RuvC and HNH domains are added to show the
architecture of the entire complex. The crystal structure for DNA-bound Cas9 is docked
as in Fig. S10D.
Movie S3
Conformational rearrangements of RNA-bound Cas9 upon target-DNA binding and
R-loop formation. This movie shows a morph between the RNA-bound Cas9 and DNA-
bound Cas9. First, RNA-bound Cas9 is shown. Next, to emphasize the conformational
rearrangements required for binding target DNA and formation of an R-loop, the domains
of Cas9 from the RNA-bound structure are morphed from their RNA- to DNA-bound
position. Once in the DNA-bound state, the sgRNA:target-strand DNA heteroduplex,
PAM duplex, non-target DNA strand and PAM-distal DNA duplex density are shown in
medium blue. The movie then repeats in reverse (from DNA-bound to the RNA-bound
state). The morph was generated using the morph map function in UCSF Chimera. The
two maps were aligned based on the sgRNA density, and morph maps were generated for
each individual domain.
References 1. B. Wiedenheft, S. H. Sternberg, J. A. Doudna, RNA-guided genetic silencing systems in
bacteria and archaea. Nature 482, 331–338 (2012). Medline doi:10.1038/nature10886
2. R. Sorek, C. M. Lawrence, B. Wiedenheft, CRISPR-mediated adaptive immune systems in bacteria and archaea. Annu. Rev. Biochem. 82, 237–266 (2013). Medline doi:10.1146/annurev-biochem-072911-172315
3. R. Barrangou, L. A. Marraffini, CRISPR-Cas systems: Prokaryotes upgrade to adaptive immunity. Mol. Cell 54, 234–244 (2014). Medline doi:10.1016/j.molcel.2014.03.011
4. L. A. Marraffini, CRISPR-Cas immunity in prokaryotes. Nature 526, 55–61 (2015). Medline doi:10.1038/nature15386
5. J. van der Oost, E. R. Westra, R. N. Jackson, B. Wiedenheft, Unravelling the structural and mechanistic basis of CRISPR-Cas systems. Nat. Rev. Microbiol. 12, 479–492 (2014). Medline doi:10.1038/nrmicro3279
6. F. Jiang, J. A. Doudna, The structural biology of CRISPR-Cas systems. Curr. Opin. Struct. Biol. 30, 100–111 (2015). Medline doi:10.1016/j.sbi.2015.02.002
7. M. M. Jore, M. Lundgren, E. van Duijn, J. B. Bultema, E. R. Westra, S. P. Waghmare, B. Wiedenheft, U. Pul, R. Wurm, R. Wagner, M. R. Beijer, A. Barendregt, K. Zhou, A. P. Snijders, M. J. Dickman, J. A. Doudna, E. J. Boekema, A. J. Heck, J. van der Oost, S. J. Brouns, Structural basis for CRISPR RNA-guided DNA recognition by Cascade. Nat. Struct. Mol. Biol. 18, 529–536 (2011). Medline doi:10.1038/nsmb.2019
8. M. D. Szczelkun, M. S. Tikhomirova, T. Sinkunas, G. Gasiunas, T. Karvelis, P. Pschera, V. Siksnys, R. Seidel, Direct observation of R-loop formation by single RNA-guided Cas9 and Cascade effector complexes. Proc. Natl. Acad. Sci. U.S.A. 111, 9798–9803 (2014). Medline doi:10.1073/pnas.1402597111
9. M. Rutkauskas, T. Sinkunas, I. Songailiene, M. S. Tikhomirova, V. Siksnys, R. Seidel, Directional R-Loop Formation by the CRISPR-Cas Surveillance Complex Cascade Provides Efficient Off-Target Site Rejection. Cell Reports 10, 1534–1543 (2015). doi:10.1016/j.celrep.2015.01.067
10. T. R. Blosser, L. Loeff, E. R. Westra, M. Vlot, T. Künne, M. Sobota, C. Dekker, S. J. Brouns, C. Joo, Two distinct DNA binding modes guide dual roles of a CRISPR-Cas protein complex. Mol. Cell 58, 60–70 (2015). Medline doi:10.1016/j.molcel.2015.01.028
11. M. Jinek, K. Chylinski, I. Fonfara, M. Hauer, J. A. Doudna, E. Charpentier, A programmable dual-RNA-guided DNA endonuclease in adaptive bacterial immunity. Science 337, 816–821 (2012). Medline
12. G. Gasiunas, R. Barrangou, P. Horvath, V. Siksnys, Cas9-crRNA ribonucleoprotein complex mediates specific DNA cleavage for adaptive immunity in bacteria. Proc. Natl. Acad. Sci. U.S.A. 109, E2579–E2586 (2012). Medline doi:10.1073/pnas.1208507109
13. M. Jinek, F. Jiang, D. W. Taylor, S. H. Sternberg, E. Kaya, E. Ma, C. Anders, M. Hauer, K. Zhou, S. Lin, M. Kaplan, A. T. Iavarone, E. Charpentier, E. Nogales, J. A. Doudna,
23
Structures of Cas9 endonucleases reveal RNA-mediated conformational activation. Science 343, 1247997 (2014). Medline doi:10.1126/science.1247997
14. F. Jiang, K. Zhou, L. Ma, S. Gressel, J. A. Doudna, A Cas9-guide RNA complex preorganized for target DNA recognition. Science 348, 1477–1481 (2015). Medline doi:10.1126/science.aab1452
15. H. Nishimasu, F. A. Ran, P. D. Hsu, S. Konermann, S. I. Shehata, N. Dohmae, R. Ishitani, F. Zhang, O. Nureki, Crystal structure of Cas9 in complex with guide RNA and target DNA. Cell 156, 935–949 (2014). Medline doi:10.1016/j.cell.2014.02.001
16. C. Anders, O. Niewoehner, A. Duerst, M. Jinek, Structural basis of PAM-dependent target DNA recognition by the Cas9 endonuclease. Nature 513, 569–573 (2014). Medline doi:10.1038/nature13579
17. H. Nishimasu, L. Cong, W. X. Yan, F. A. Ran, B. Zetsche, Y. Li, A. Kurabayashi, R. Ishitani, F. Zhang, O. Nureki, Crystal Structure of Staphylococcus aureus Cas9. Cell 162, 1113–1126 (2015). Medline doi:10.1016/j.cell.2015.08.007
18. F. J. M. Mojica, C. Díez-Villaseñor, J. García-Martínez, C. Almendros, Short motif sequences determine the targets of the prokaryotic CRISPR defence system. Microbiology 155, 733–740 (2009). Medline doi:10.1099/mic.0.023960-0
19. S. H. Sternberg, B. LaFrance, M. Kaplan, J. A. Doudna, Conformational control of DNA target cleavage by CRISPR-Cas9. Nature 527, 110–113 (2015). Medline doi:10.1038/nature15544
20. M. Newman, T. Strzelecka, L. F. Dorner, I. Schildkraut, A. K. Aggarwal, Structure of Bam HI endonuclease bound to DNA: Partial folding and unfolding on DNA binding. Science 269, 656–663 (1995). Medline doi:10.1126/science.7624794
21. Y. W. Yin, T. A. Steitz, Structural basis for the transition from initiation to elongation transcription in T7 RNA polymerase. Science 298, 1387–1395 (2002). Medline doi:10.1126/science.1077464
22. T. G. G. Battye, L. Kontogiannis, O. Johnson, H. R. Powell, A. G. W. Leslie, iMOSFLM: A new graphical interface for diffraction-image processing with MOSFLM. Acta Crystallogr. D Biol. Crystallogr. 67, 271–281 (2011). Medline doi:10.1107/S0907444910048675
23. M. D. Winn, C. C. Ballard, K. D. Cowtan, E. J. Dodson, P. Emsley, P. R. Evans, R. M. Keegan, E. B. Krissinel, A. G. Leslie, A. McCoy, S. J. McNicholas, G. N. Murshudov, N. S. Pannu, E. A. Potterton, H. R. Powell, R. J. Read, A. Vagin, K. S. Wilson, Overview of the CCP4 suite and current developments. Acta Crystallogr. D Biol. Crystallogr. 67, 235–242 (2011). Medline doi:10.1107/S0907444910045749
24. R. W. Grosse-Kunstleve, P. D. Adams, Substructure search procedures for macromolecular structures. Acta Crystallogr. D Biol. Crystallogr. 59, 1966–1973 (2003). Medline doi:10.1107/S0907444903018043
25. P. D. Adams, P. V. Afonine, G. Bunkóczi, V. B. Chen, I. W. Davis, N. Echols, J. J. Headd, L. W. Hung, G. J. Kapral, R. W. Grosse-Kunstleve, A. J. McCoy, N. W. Moriarty, R. Oeffner, R. J. Read, D. C. Richardson, J. S. Richardson, T. C. Terwilliger, P. H. Zwart,
24

PHENIX: A comprehensive Python-based system for macromolecular structure solution. Acta Crystallogr. D Biol. Crystallogr. 66, 213–221 (2010). Medline doi:10.1107/S0907444909052925
26. A. Vagin, A. Teplyakov, Molecular replacement with MOLREP. Acta Crystallogr. D Biol. Crystallogr. 66, 22–25 (2010). Medline doi:10.1107/S0907444909042589
27. T. Terwilliger, SOLVE and RESOLVE: Automated structure solution, density modification and model building. J. Synchrotron Radiat. 11, 49–52 (2004). Medline doi:10.1107/S0909049503023938
28. T. C. Terwilliger, Maximum-likelihood density modification. Acta Crystallogr. D Biol. Crystallogr. 56, 965–972 (2000). Medline doi:10.1107/S0907444900005072
29. P. Emsley, K. Cowtan, Coot: Model-building tools for molecular graphics. Acta Crystallogr. D Biol. Crystallogr. 60, 2126–2132 (2004). Medline doi:10.1107/S0907444904019158
30. A. J. McCoy, R. W. Grosse-Kunstleve, P. D. Adams, M. D. Winn, L. C. Storoni, R. J. Read, Phaser crystallographic software. J. Appl. Cryst. 40, 658–674 (2007). doi:10.1107/S0021889807021206
31. G. N. Murshudov, P. Skubák, A. A. Lebedev, N. S. Pannu, R. A. Steiner, R. A. Nicholls, M. D. Winn, F. Long, A. A. Vagin, REFMAC5 for the refinement of macromolecular crystal structures. Acta Crystallogr. D Biol. Crystallogr. 67, 355–367 (2011). Medline doi:10.1107/S0907444911001314
32. V. B. Chen, W. B. Arendall 3rd, J. J. Headd, D. A. Keedy, R. M. Immormino, G. J. Kapral, L. W. Murray, J. S. Richardson, D. C. Richardson, MolProbity: All-atom structure validation for macromolecular crystallography. Acta Crystallogr. D Biol. Crystallogr. 66, 12–21 (2010). Medline doi:10.1107/S0907444909042073
33. F. H. Niesen, H. Berglund, M. Vedadi, The use of differential scanning fluorimetry to detect ligand interactions that promote protein stability. Nat. Protoc. 2, 2212–2221 (2007). Medline doi:10.1038/nprot.2007.321
34. F. Jiang, A. Ramanathan, M. T. Miller, G. Q. Tang, M. Gale Jr., S. S. Patel, J. Marcotrigiano, Structural basis of RNA recognition and activation by innate immune receptor RIG-I. Nature 479, 423–427 (2011). Medline doi:10.1038/nature10537
35. C. Suloway, J. Pulokas, D. Fellmann, A. Cheng, F. Guerra, J. Quispe, S. Stagg, C. S. Potter, B. Carragher, Automated molecular microscopy: The new Leginon system. J. Struct. Biol. 151, 41–60 (2005). Medline doi:10.1016/j.jsb.2005.03.010
36. G. C. Lander, S. M. Stagg, N. R. Voss, A. Cheng, D. Fellmann, J. Pulokas, C. Yoshioka, C. Irving, A. Mulder, P. W. Lau, D. Lyumkis, C. S. Potter, B. Carragher, Appion: An integrated, database-driven pipeline to facilitate EM image processing. J. Struct. Biol. 166, 95–102 (2009). Medline doi:10.1016/j.jsb.2009.01.002
37. J. A. Mindell, N. Grigorieff, Accurate determination of local defocus and specimen tilt in electron microscopy. J. Struct. Biol. 142, 334–347 (2003). Medline doi:10.1016/S1047-8477(03)00069-8
25
38. S. H. W. Scheres, RELION: Implementation of a Bayesian approach to cryo-EM structure determination. J. Struct. Biol. 180, 519–530 (2012). Medline doi:10.1016/j.jsb.2012.09.006
39. J. L. Rubinstein, M. A. Brubaker, Alignment of cryo-EM movies of individual particles by optimization of image translations. J. Struct. Biol. 192, 188–195 (2015). Medline doi:10.1016/j.jsb.2015.08.007
40. T. Grant, N. Grigorieff, Measuring the optimal exposure for single particle cryo-EM using a 2.6 Å reconstruction of rotavirus VP6. eLife 4, e06980 (2015). Medline doi:10.7554/eLife.06980
41. J. B. Heymann, D. M. Belnap, Bsoft: Image processing and molecular modeling for electron microscopy. J. Struct. Biol. 157, 3–18 (2007). Medline doi:10.1016/j.jsb.2006.06.006
42. E. F. Pettersen, T. D. Goddard, C. C. Huang, G. S. Couch, D. M. Greenblatt, E. C. Meng, T. E. Ferrin, UCSF Chimera—a visualization system for exploratory research and analysis. J. Comput. Chem. 25, 1605–1612 (2004). Medline doi:10.1002/jcc.20084
43. N. A. Baker, D. Sept, S. Joseph, M. J. Holst, J. A. McCammon, Electrostatics of nanosystems: Application to microtubules and the ribosome. Proc. Natl. Acad. Sci. U.S.A. 98, 10037–10041 (2001). Medline doi:10.1073/pnas.181342398
44. T. J. Dolinsky, P. Czodrowski, H. Li, J. E. Nielsen, J. H. Jensen, G. Klebe, N. A. Baker, PDB2PQR: Expanding and upgrading automated preparation of biomolecular structures for molecular simulations. Nucleic Acids Res. 35 (Web Server), W522–W525 (2007). Medline doi:10.1093/nar/gkm276
26