supplementary methods, figures 1-10
TRANSCRIPT

1
Supplementary Methods MTT Proliferation Assay: 1x10³ cells were plated in triplicate and were treated with
DMSO vehicle control or increasing concentrations of U0126 (0.1 µM, 1 µM, 10 µM,
and 20 µM from Promega). After 24 or 48 hours of incubation, the Vybrant MTT cell
Proliferation Assay Kit (Invitrogen) was used per the manufacturer’s protocol. For
assessment of effects of CD44 knockdown on MOC2 and 10 cells, 6000 cells of each
specific cell line were plated in 96-well plates and incubated for 72 hours. Data shown
are representative of 3 different experiments. Viable cells were detected by measuring
absorbance at 540 nm using a Syngery HT microplate reader (BioTek).
Matrigel Invasion Assay: BD Biocoat invasion chambers (8 µm pore size, BD
Biosciences) were used per the manufacturer’s instructions with 1x10⁶ cells in serum free
media placed into the upper chamber. Media with 5% fetal calf serum was used as the
chemoattractant in the lower chamber. After incubation for 24 hours at 37°C, cells in
the upper chamber were removed with cotton swab. Cells on the undersurface of the
filter were processed and counted in a blinded fashion as for the Transwell assay.
CXCR3 Assays: Because MOC2 was derived from a CXCR3-/- mouse, all cell lines were
analyzed by FACS for cell surface CXCR3 and none expressed CXCR3 (data not
shown). Despite this, to further confirm that CXCR3 absence did not play a role in the
growth phenotype of MOC2, we enforced expression of CXCR3 into MOC2

2
RV-mCXCR3-GFP was created by inserting mouse CXCR3 into GFP-RV (Ranganath et
al., J Immunol. (1998) 161:3822-6.). Constructs were then retrovirally transduced into
MOC2 tumor cells.
RAS sequencing: All three ras isoforms and the relevant B-Raf regions were sequenced
from tumor cell line cDNA as described by Dam et al. (BMC Cancer. 2006;6:177).
RAS activation assays: Activated RAS was detected using the Ras Activation Assay Kit
(Cell Biolabs). Briefly, total cell lysates were incubated with Raf1 RBD agarose beads to
pull down activated GTP bound RAS. Lysates were also independently treated with GDP
(negative) or GTPγS (positive) for controls. The Raf1 RBD bound protein was then
analyzed by Western blot and probed with antibody to either total RAS (Cell Signaling)
or K-RAS (Santa Cruz Biotechnology).
FACS Analysis: Scramble or shRNA transduced mouse tumors were harvested at the end
of tumor growth experiments and single cell suspensions were generated by chopping and
collagenase IA (Sigma-Aldrich) digestion. Cells were blocked with Fc Block
(Biolegend) and stained with CD45 FITC (Biolegend), CD44 PE (Biolegend) and 7-AAD
(BD Biosciences). A FACSCalibur was used to collect 10,000 CD45-/7-AAD- events and
data were analyzed with FloJo (Tree Star). Human tumors were collected under an IRB
approved protocol at Stanford University. Tumors were processed with modifications of
the protocol of Boiko et al. (Nature, 466:133-7). Briefly, tumors were minced and
digested overnight in 300 U/mL collagenase and 100 U/mL hyaluronidase (STEMCELL

3
Technologies). This suspension was then pelleted and briefly trypsinized (3 minutes) and
then treated with a Dispase/DNAse I solution (Roche). Cell were filtered, treated with
Ack RBC lysis buffer (Lonza), washed and used for staining. Single cell suspensions
were then blocked and surface stained with CD45-FITC and CD31-FITC. Phospho-flow
was performed as decribed by Nolan and colleagues using p-ERK1/2-PE and CD44-APC
(Zampieri et al. (2007) J of Virology, 81:1230-1240). We used the “fluorescence minus
one (FMO)” approach as described by Herzenberg et al. (Nature Immunology (2006),
7:681-685) to set thresholds and events were collected and data analyzed using FloJo
(Tree Star).
Supplementary Figures
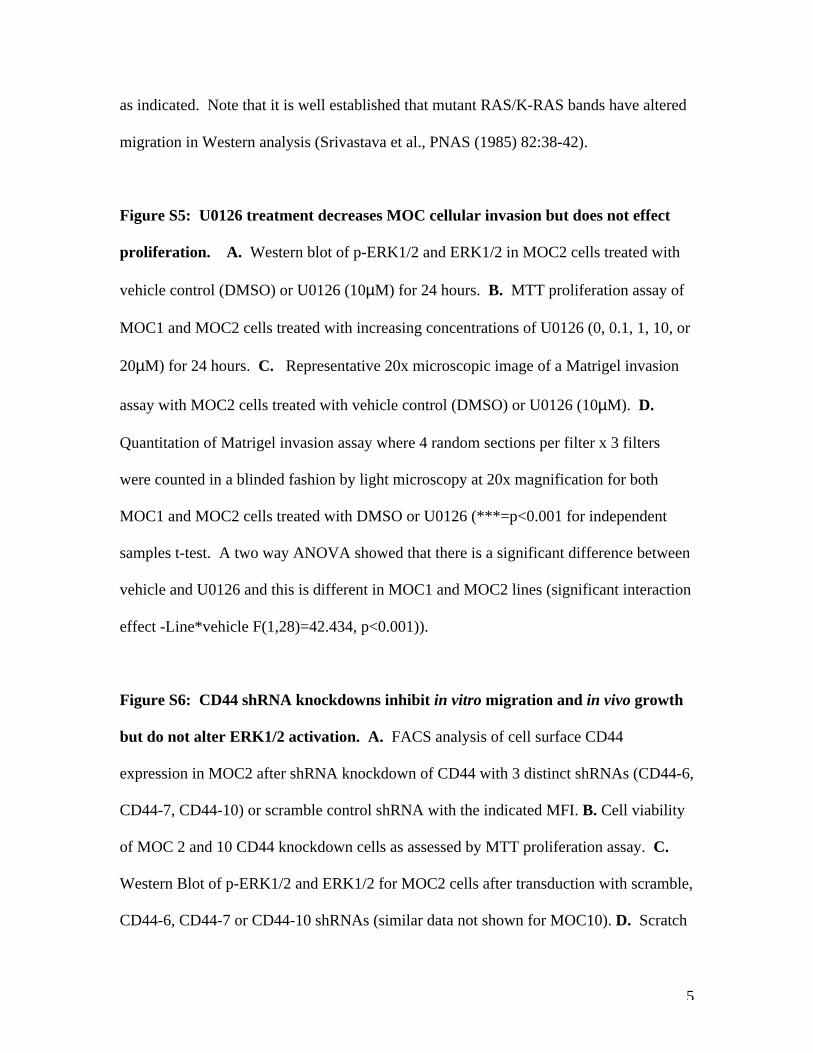
Figure S1: Primary MOC Tumors and corresponding histology. A. Primary oral
cavity parental tumors for MOC1, 2, 7. B. H&E histology of primary parental tumors
showing moderately differentiated squamous cell carcinomas (40X magnification). C.
Immunofluorescence of MOC cell lines and control fibrosarcoma (H31m1) showing that
MOC cell lines have an epithelial phenotype with positive cytokeratin staining (green)
and H31m1 fibrosarcoma has negative cytokeratin staining (green) (40X magnification).
All cell lines have nuclear staining with DAPI.
Figure S2: Flank injection of MOC tumor cell lines, orthotopic injection of MOC2
and lung metastases of MOC10 A. Tumor growth curves of indicated 5 MOC cell lines
with each line on graph representing an individual mouse (n=4-5 mice per cell line).
Note that MOC22 demonstrated a cystic growth pattern thus gross tumor volume is likely

4
overestimated by external measurements (indicated by asterisk). B. MOC2 (30,000
cells) were injected in a 30 µl volume into the right buccal/floor of mouth region and a
representative image of a day 14 mouse shows rapid, locally invasive growth (black
arrow). C. Representative image of cervical metastases (black arrow) with primary
tumor in buccal/floor of mouth region (white arrow). D. MOC10 lung metastases from
flank injection of tumor cells (1X10⁴)—multiple white nodules (black arrows) were seen
studding the lung surface and are shown magnified in the inset. E. H&E staining of
MOC10 lung metastases (20X magnification).
Figure S3: CXCR3 expression does not affect MOC2 growth in vivo. A. 1x10⁵
MOC2 cells transduced with GFP or CXCR3-GFP were transplanted into the right flank
of C57BL/6 WT or C57BL/6 RAG2-/- mice and monitored for growth.
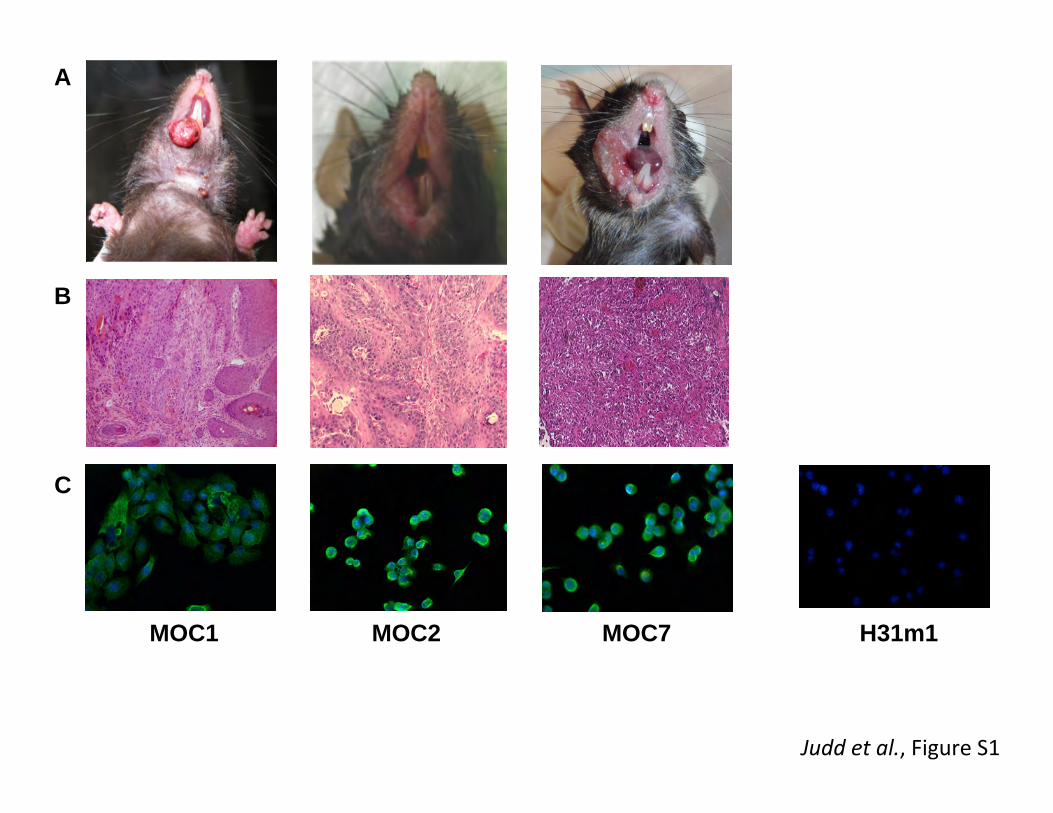
Figure S4: RAS mutation and activation status of MOC cell lines A. RAS isoforms
(data not shown for N-RAS) were sequenced and revealed that H-RAS mutations were
restricted to MOC1 and 22 and K-RAS mutations were present in MOC2, 7 and 10. B.
RAS activation assay with negative and positive controls (input protein was 1 mg of
lysate), manufacturer’s K-RAS control, total RAS (active and inactive) in 30 µg of lysate
from each cell line (10 µg for MOC23) and Raf1 RBD bound active RAS (pull down
from 2.5 mg of total protein for all cell lines except MOC23 which had 200 µg—
indicated by asterisk). Blot was probed with anti-total RAS (upper) and anti-K-RAS
(bottom). The K-RAS bands were quantitated using the Li-cor Odyssey (Li-Cor) and are
5
as indicated. Note that it is well established that mutant RAS/K-RAS bands have altered
migration in Western analysis (Srivastava et al., PNAS (1985) 82:38-42).
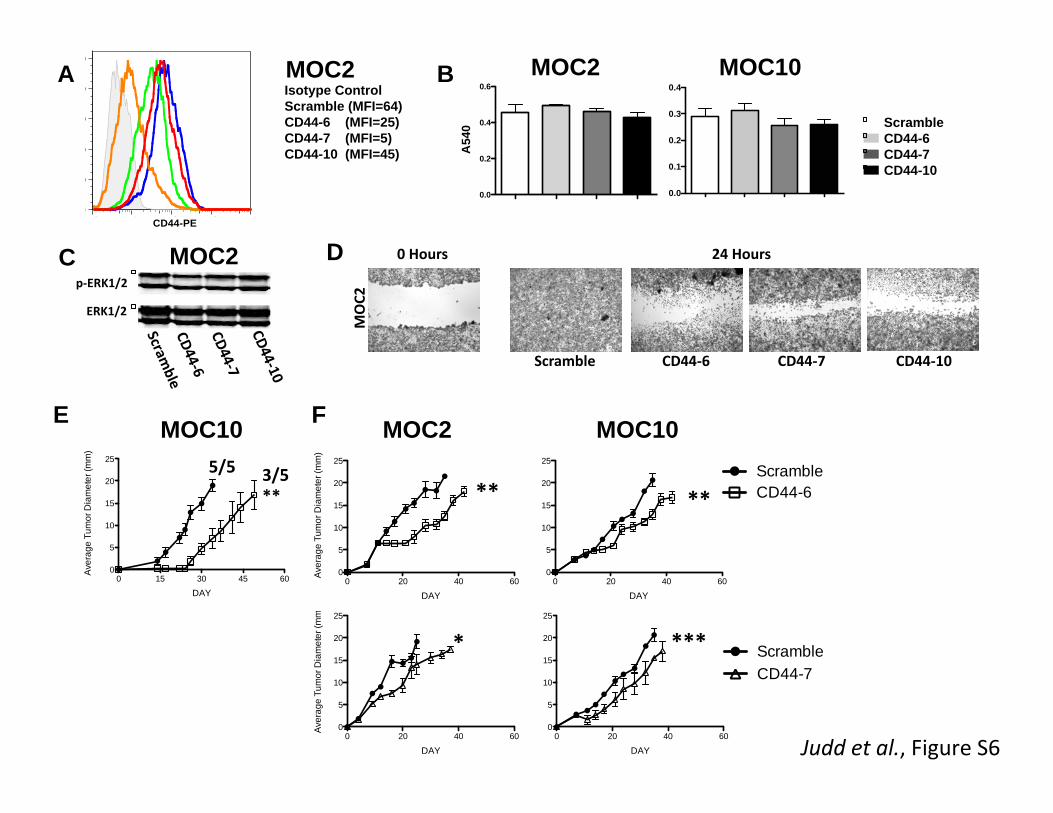
Figure S5: U0126 treatment decreases MOC cellular invasion but does not effect
proliferation. A. Western blot of p-ERK1/2 and ERK1/2 in MOC2 cells treated with
vehicle control (DMSO) or U0126 (10µM) for 24 hours. B. MTT proliferation assay of
MOC1 and MOC2 cells treated with increasing concentrations of U0126 (0, 0.1, 1, 10, or
20µM) for 24 hours. C. Representative 20x microscopic image of a Matrigel invasion
assay with MOC2 cells treated with vehicle control (DMSO) or U0126 (10µM). D.
Quantitation of Matrigel invasion assay where 4 random sections per filter x 3 filters
were counted in a blinded fashion by light microscopy at 20x magnification for both
MOC1 and MOC2 cells treated with DMSO or U0126 (***=p<0.001 for independent
samples t-test. A two way ANOVA showed that there is a significant difference between
vehicle and U0126 and this is different in MOC1 and MOC2 lines (significant interaction
effect -Line*vehicle F(1,28)=42.434, p<0.001)).
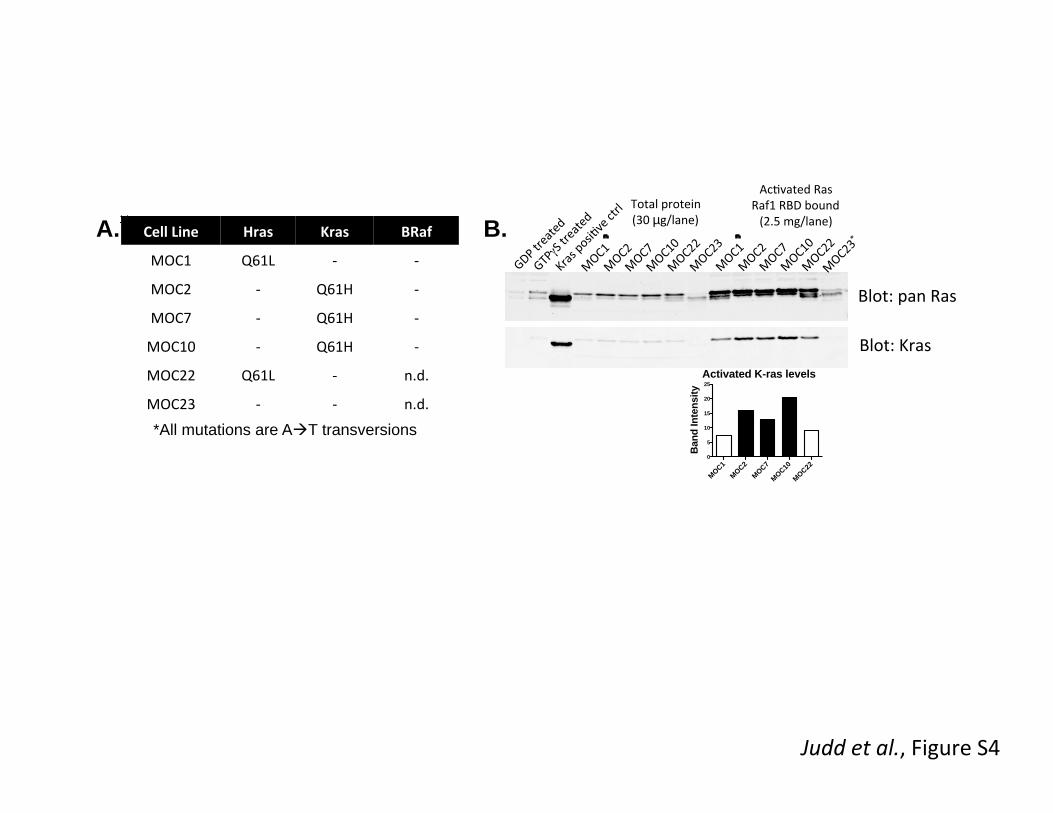
Figure S6: CD44 shRNA knockdowns inhibit in vitro migration and in vivo growth
but do not alter ERK1/2 activation. A. FACS analysis of cell surface CD44
expression in MOC2 after shRNA knockdown of CD44 with 3 distinct shRNAs (CD44-6,
CD44-7, CD44-10) or scramble control shRNA with the indicated MFI. B. Cell viability
of MOC 2 and 10 CD44 knockdown cells as assessed by MTT proliferation assay. C.
Western Blot of p-ERK1/2 and ERK1/2 for MOC2 cells after transduction with scramble,
CD44-6, CD44-7 or CD44-10 shRNAs (similar data not shown for MOC10). D. Scratch

6
Test of MOC2 after transduction with indicated CD44 or scramble shRNAs. E. MOC10
cells (1x10⁴) transduced with scramble or CD44-6 shRNA were injected into the right
flank of C57BL/6 WT mice and monitored for growth. Growth curves only represent
average tumor diameter of transplanted tumors that grew out. F. MOC2 and MOC10
cells (1x10⁵) transduced with scramble, CD44-6, or CD44-7 shRNA were injected into
the right flank of C57BL/6 WT mice and monitored for growth. For both E and F, a
mixed between-within subjects analysis of variance comparing scramble with the
indicated CD44 knockdown showed significant differences in tumor growth (*=p<0.05,
**=p<0.01, and ***=p<0.001).
Figure S7: In vivo escape of CD44 shRNA expressing tumors A. Gating strategy for
analysis of CD44 levels on transplanted tumors—single cell suspensions of flank
transplanted MOC10-scramble cells were first gated by forward and side scatter,
hematopoietic (CD45+) and dead (7-AAD+) cells were excluded and the remaining tumor
cells were analyzed for isotype control or CD44. B. Composite histograms of three
representative tumors from individual mice (of 2-3 mice per group) shows that both
MOC10-6 and MOC10-10 tumors had recovered CD44 to MOC10-scramble levels. For
starting CD44 levels, see Figure 3C
Figure S8: Immunofluorescence staining of transplanted MOC1 and MOC2 lines
for CD44 and p-ERK1/2 Individual panels of merged image shown in Figure 4A (all
images are at 20X). Scale bar in MOC1 DAPI stain represents 100 µM—the same scale

7
applies to all images. Individual panels between MOC1 and MOC2 were all captured at
the same microscope settings.
Figure S9: U0126 treatment decreases CD44 expression on MOC2, 7, 10 and UPCI:
SCC029B and tamoxifen does not induce CD44 on MOC1. A. FACS analysis of cell
surface CD44 expression after MOC2 cells were treated with vehicle control (DMSO,
gray line) or U0126 (10µM, black line) for 24 hours with the indicated MFI. B. FACS
analysis of cell surface CD44 expression after MOC7 and MOC10 cells were treated with
vehicle control (DMSO, gray line) or U0126 (10µM, black line) for 48 hours with the
indicated MFI. C. FACS analysis of cell surface CD44 expression after MOC1 cells
were treated with (black line) or without (gray line) tamoxifen for 48 hours. Isotype
control is represented by the gray shaded curve and MFIs are as indicated. D. FACS
analysis of cell surface CD44 expression after human OSCC cell line UPCI: SCC029B
was treated with vehicle control (DMSO, gray line) or U0126 (10µM, black line) for 48
hours with the indicated MFI.
Figure S10: Gating strategy for freshly resected human oral carcinomas. From left
to right are shown the specific gates used to analyze p-ERK1/2 staining in CD44high
versus CD44low tumor cells for the 7131 primary human tumor. The fluorescence minus
zero (FMO) and p–ERK1/2 stains are shown. The left three panels utilized forward and
side scatter gates to select the initial populations. Subsequently, hematopoietic and
endothelial markers were used to select tumor cell populations which were finally

8
analyzed for CD44 and p-ERK1/2. The CD45-/CD31- gating and dot plots of human
tumors 7132 and 7133, the latter is also in main figures, are also shown below.
Judd et al., Figure S1
A
B
MOC1 MOC2 MOC7
A
B
MOC1 MOC2 MOC7
OSCC10
C
H31m1

0 20 40 60
0
5
10
15
20
25
0 20 40 60
0
5
10
15
20
25
0 20 40 60
0
5
10
15
20
25
0 20 40 60
0
5
10
15
20
25
0 20 40 60
0
5
10
15
20
25
Avg
Tum
or D
iam
eter
(mm
)
MOC1 MOC2 MOC7 MOC10 MOC22* A.
SCC#
B. MOC2 FOM
D. MOC10 Lung
C. Neck LN Met
Judd et al., Figure S2
E. Lung H&E
DAY

A
0 10 20 30
0
5
10
15
20WT CXCR3 GFP
WT GFP
RAG2-/- CXCR3 GFP
RAG2-/- GFP
DAY
Ave
rage
Tum
or D
iam
eter
(mm
)
Judd et al., Figure S3
0 10 20 30
0
5
10
15
20WT CXCR3 GFP
WT GFP
RAG2-/- CXCR3 GFP
RAG2-/- GFP
DAY
Ave
rage
Tum
or D
iam
eter
(mm
)
Blot: pan Ras
Blot: Kras
Total protein (30 µg/lane)
Ac?vated Ras Raf1 RBD bound (2.5 mg/lane)
Cell Line Hras Kras BRaf
MOC1 Q61L -‐ -‐
MOC2 -‐ Q61H -‐
MOC7 -‐ Q61H -‐
MOC10 -‐ Q61H -‐
MOC22 Q61L -‐ n.d.
MOC23 -‐ -‐ n.d.
A. B.
Judd et al., Figure S4
*All mutations are AàT transversions
Activated K-ras levels
MOC1MOC2
MOC7
MOC10
MOC220
5
10
15
20
25
Ban
d In
tens
ity

vehicl
e
0.1uM U
0126
1uM U
0126
10uM U
0126
20uM U
0126
0.0
0.2
0.4
0.6
0.8
Ave
rage
Abs
orba
nce
at 5
40nm
vehicl
e
0.1uM U
0126
1uM U
0126
10uM U
0126
20uM U
0126
0.0
0.1
0.2
0.3
0.4
Ave
rage
Abs
orba
nce
at 5
40nm
MOC2 veh
icle
MOC2 U01
26
MOC1 veh
icle
MOC1 U01
260
50
100
150
Ave
rag
e N
um
be
r o
f C
ells P
er
20
x F
ield
A
MOC1
MOC2
B
MOC2
vehicle U0126
C
D
***
***
MOC2 p-‐ERK1/2 ERK1/2
vehicle
U0126
Judd et al., Figure S5
0 20 40 60
0
5
10
15
20
25
DAY
Ave
rag
e T
um
or D
iam
ete
r (m
m)
0 20 40 60
0
5
10
15
20
25
DAY
Ave
rag
e T
um
or D
iam
ete
r (m
m)
0 15 30 45 60
0
5
10
15
20
25
DAY
Ave
rag
e T
um
or D
iam
ete
r (m
m)
0Hours 24Hours
MOC2Scramble CD44‐6 CD44‐7 CD44‐10
100
101
102
103
104
CD44-PE
0
20
40
60
80
100
% o
f Max
A Isotype
Scramble(MFI=64.3)
CD44‐6(MFI=24.8)
CD44‐7(MFI=4.8)
CD44‐10(MFI=45.4)
Isotype Control Scramble (MFI=64) CD44-6 (MFI=25) CD44-7 (MFI=5) CD44-10 (MFI=45)
MOC2
C D
0 20 40 60
0
5
10
15
20
25
DAY
Ave
rag
e T
um
or D
iam
ete
r (m
m)
MOC10 MOC2
0 20 40 60
0
5
10
15
20
25
CD44-7
Scramble
DAY
Ave
rag
e T
um
or D
iam
ete
r (m
m)
0 15 30 45 60
0
5
10
15
20
25
CD44-6
Scramble
DAY
Ave
rag
e T
um
or D
iam
ete
r (m
m)
F
**
***
0 20 40 60
0
5
10
15
20
25
DAY
Ave
rag
e T
um
or D
iam
ete
r (m
m)
**
*
E MOC10
3/5 **
5/5
ERK1/2
p-‐ERK1/2
MOC2
100
101
102
103
104
CD44-PE
0
20
40
60
80
100
% o
f Max
Judd et al., Figure S6
0.0
0.1
0.2
0.3
0.4B MOC2 MOC10
0.0
0.2
0.4
0.6
A54
0 Scramble CD44-6 CD44-7 CD44-10

A. Ga?ng strategy (shown for MOC10-‐scramble)
B. Composite representa?ve data of in vivo CD44 shRNA loss
Judd et al., Figure S7
Forward Scatter
Side
Sca
tter
76.5
CD45 FITC7-
AA
D
48.4
Isotype PE
CD44 PE
Isotype
MOC10 Scramble
MOC10-6
MOC10-10

MOC1
MOC2
DAPI CD44 P-‐ERK1/2 MERGE
Judd et al., Figure S8

MOC2-24 Hours MOC7 MOC10 A B
C D
Isotype Control MOC1 (MFI=11.6) MOC1+T (MFI=11.1)
100
101
102
103
104
CD44-PE
0
20
40
60
80
100
% o
f Max
UPCI: SCC029B MOC1
CD44-PE CD44-PE CD44-PE
CD44-PE10
010
110
210
310
4
CD44-PE
0
20
40
60
80
100
% o
f Max
vehicle (MFI=121) U0126 (MFI=83)
vehicle (MFI=113) U0126 (MFI=84)
vehicle (MFI=113) U0126 (MFI=80)
vehicle (MFI=588) U0126 (MFI=433)
Judd et al., Figure S9

FSC-A
SSC-
A
79.6
FSC-H
FSC-
W
78.4
SSC-H
SSC-
W
94.5
<FITC-A>: CD45/CD31
# Ce
lls
45.5
<PE-A>: pERK12
<APC
-A>:
CD
44
26.2 23.1
4.4846.2
FMO pERK1/2 Exclusion of doublets in FSC and SSC Exclusion of CD45+/CD31+
Ga?ng Strategy for p-‐ERK1/2 staining on primary human oral cancers
Judd et al., Figure S10
7131
7132
7133
CD44