supplementary mri coma forward stepwise variable selection was performed with akaike information...
TRANSCRIPT
Supplementary appendixThis appendix formed part of the original submission and has been peer reviewed. We post it as supplied by the authors.
Supplement to: Velly L, Perlbarg V, Boulier T, et al, for the MRI-COMA Investigators. Use of brain diffusion tensor imaging for the prediction of long-term neurological outcomes in patients after cardiac arrest: a multicentre, international, prospective, observational, cohort study. Lancet Neurol 2018; published online Feb 27. http://dx.doi.org/10.1016/S1474-4422(18)30027-9.

1
WEB APPENDIX
TABLE OF CONTENTS
Trial personnel, funding and acknowledgments ................................................................................................................................. 2
Inclusion and exclusion criteria ............................................................................................................................................................ 5
Data transparency .................................................................................................................................................................................. 6
Details of conventional MR imaging acquisition ................................................................................................................................. 7
Diffusion tensor imaging (DTI) acquisition and processing ............................................................................................................... 8
Proton magnetic resonance spectroscopy (1H-MRS) data acquisition and processing ................................................................. 10
Calculation of odds ratios .................................................................................................................................................................... 11
Multivariate logistic-regression models ............................................................................................................................................. 12
Figure S1. Maps of fluid-attenuated inversion recovery (FLAIR) magnetic resonance imaging (MRI) and color-coded raw values of whole white matter fractional anisotropy (WWM-FA) map of a 60-year-old healthy control and three cardiac arrest (CA) patients, performed with the same scanner. ................................................................................................... 13
Figure S2. Scatter Plot of Whole White Matter Fractional Anisotropy (FA) versus Whole Brain Average Diffusion Coefficient (aDC) for All Patients in the Derivation Cohort and Healthy Volunteers .......................................................................... 15
Figure S3. Receiver-Operating-Characteristic Curves for Standard (Panel A), Qualitative MRI (Panel B), and Quantitative MRI (Panel C) Predictors For Unfavorable Outcome In The Subpopulation Of Patients Without A Limitation Or Withdrawal Of Care in the Derivation Cohort ................................................................................................................ 16
Figure S4: Probability of unfavorable outcome according to whole white matter fractional anisotropy (WWM-FA) in the derivation cohort. ......................................................................................................................................................................... 17
Figure S5: Maps of fluid-attenuated inversion recovery (FLAIR) magnetic resonance imaging (MRI) and color-coded raw values of whole white matter fractional anisotropy (WWM-FA) map of the 12 patients that had favourable outcome despite mild-to-severe signal abnormalities in basal ganglia or cortex ................................................................. 18
Table S1. Acquisition Parameters for each MR Scanner ...................................................................................................................... 20
Table S2. Diffusion Tensor Imaging Healthy Volunteer Results for each MR Scanner ....................................................................... 21
Table S3. Outcomes in the Derivation and Validation Cohort .............................................................................................................. 23
Table S4. Reasons for Withdrawal or Limitation of Life Sustaining Therapy in the Derivation Cohort ............................................. 25
Table S5. Criteria of poor outcome fulfilled or not by the 33 patients with favourable outcome. ........................................................ 26
Table S6. Prognostic Values of Significant Variables of the Patients Without a Limitation or Withdrawal of Care Decision in the Derivation Cohort ......................................................................................................................................................... 27
Table S7. Multivariate Analysis in the Derivation Cohort .................................................................................................................... 28
Table S8. Multivariate Analysis of the Patients Without Withdrawal or Limitation of Life Sustaining Therapy in the Derivation Cohort ................................................................................................................................................................................... 29
Additional file 1: Glasgow Coma Scale (GCS) .................................................................................................................................... 30
Additional file 2: Equation for the OHCA cardiac arrest score ............................................................................................................ 31
Additional file 3: EEG pattern according to the Synek classification system ...................................................................................... 32
Additional file 4: Qualitative brain FLAIR and DWI MRI scoring system ......................................................................................... 33
Additional file 5: Glasgow-Pittsburgh Cerebral Performance Categories (CPC) ................................................................................ 34
Additional file 6: Modified Rankin Scale ............................................................................................................................................. 35
Additional file 7: Fazekas visual scale score ........................................................................................................................................ 36
REFERENCES ..................................................................................................................................................................................... 37

2
TRIAL PERSONNEL, FUNDING AND ACKNOWLEDGMENTS
Coordinating hospital
Groupe Hospitalier Pitié–Salpêtrière, Paris, France
Chief investigator and contact
Louis Puybasset, M.D., Ph.D., Sorbonne Université, CNRS, INSERM, Laboratoire d’Imagerie
Biomédicale (LIB), AP-HP, Groupe Hospitalier Pitié-Salpêtrière, 47-83 Bd de l'hôpital; 75013
Paris, France. [email protected].
Follow-up coordinators
Paola Sanchez, M.D. and Blandine Lesimple, Department of Anesthesiology and Intensive Care,
Groupe Hospitalier Pitié–Salpêtrière, AP-HP, Paris, France.
Trial coordinators
Gregory Torkomian, Groupe Hospitalier Pitié–Salpêtrière, AP-HP, Paris, France.
Sites, principal investigators (PI) and investigators
Belgium: GIGA, GIGA-Consciousness, Coma Science Group, University of Liège: Steven Laureys
(PI), Carol Di Perri, Andrea Soddu, Audrey Vanhaudenhuyse.
France: University Hospital Pellegrin, Bordeaux, Department of Neuroradiology: Sandrine
Molinier (PI), Thomas Tourdias and Department of Anesthesiology and Critical Care: Olivier
Verdonck (PI), Vincent Cottenceau, François Sztark; University Hospital of Clermont-Ferrand,
Department of Neuroradiology: Betty Jean (PI) and Department of Anesthesiology and Critical
3
Care: Russel Chabanne (PI), Jean-Michel Constantin; University Hospital Timone Adultes,
Marseille, Department of Neuroradiology: Nadine Girard (PI) and Department of Anesthesiology
and Critical Care, University Hospital Timone Adultes, Marseille: Nicolas Bruder (PI); Groupe
Hospitalier Pitié–Salpêtrière, Paris: Department of Neuroradiology, Pavillon Babinski, Damien
Galanaud (PI) and Department of Medical Intensive Care, Institut de cardiologie: Charles-Edouard
Luyt (PI), Jean Chastre and Department of Anesthesiology and Critical Care, Institut de cardiologie:
Julien Amour (PI) and Department of Intensive Care, Pavillon Husson Mourier: Charlotte Arbelot
(PI), Corine Vezinet, Jean-Jacques Rouby and Department of Anesthesiology and Critical Care,
Pavillon Gaston Cordier: Mathieu Raux (PI), Olivier Langeron and Department of Neuro Critical
Care, Pavillon Babinski, Paris: Louis Puybasset (PI), Vincent Degos and Neurological Intensive
Care Unit, Institut de Neurosciences: Francis Bolgert (PI), Nicolas Weiss, Benjamin Rohaut and
Department of Respiratory and Critical Care Medicine: Thomas Similowski (PI), Alexandre
Demoule, Alexandre Duguet; University Hospital Charles Nicolle, Rouen, Department of
Neuroradiology: Eleonore Tollard and Department of Anesthesiology and Critical Care: Benoit
Veber (PI); Neuro-Campus Baudot, Institut des Sciences du Cerveau, Toulouse: Jean-Albert
Lotterie and Department of Anesthesiology and Critical Care, University Hospital Purpan,
Toulouse: Stein Silva (PI), Michèle Génestal.
Italy: Hospital San Gerardo, Monza, Department of Neuroradiology: Mirko Patassini and
Department of Anesthesia and Critical Care: Giuseppe Citerio (PI), Alessia Vargioglu.
Acknowledgements
We would like to thank patients, relatives, and clinical and research staff at all trial sites.
4
FUNDING
The MRI-COMA-trial was funded by independent research grants from non-profit or governmental
agencies: French Ministry of Health, Paris, France (Programme Hospitalier de Recherche Clinique
2005 #051061), and the French National Agency for Research (ANR) for the program
"Investissements d'avenir" ANR-10-IAIHU-06 (to the Brain and Spine Institute); Italian Ministry of
health and Regione Lombardia (Ricerca Finalizzata 2010 - RF-2010-2319503). There was no
commercial funding.
5
INCLUSION AND EXCLUSION CRITERIA
Inclusion criteria
All of the following 4 criteria must be satisfied for trial eligibility:
1. Age ≥18 years.
2. Cardiac arrest in the last 7 days.
3. Admission to an intensive care unit.
4. Persisting unconsciousness at day 7 defined as the inability to obey verbal commands not
attributed to sedation or aphasia.
Exclusion criteria
1. Obvious or suspected pregnancy.
2. Coma explained by sedation
3. MRI contraindication (e.g., pace maker, medical device incompatible with MRI,
intraocular or cerebral metallic cluster).
4. Cardiac arrest caused by trauma.
5. Previous or additional neurological history (e.g., intracranial bleeding, stroke, tumor)
susceptible to interference with the clinical outcome.
6. Severe hemodynamic failure precluding transport and MR scanning.
7. Severe respiratory failure precluding transport and MR scanning.
8. Confluent leukoaraiosis (defined on Fazekas scale ≥ grade 4; see the Web Appendix additional
files 7 pp 31).
9. Patient with severe impairment of vital functions and/or potentially life-threatening with a
handicap prior to the event.
10. Refusal of the family.
11. Patient protected by the law (under supervision or trusteeship).

6
DATA TRANSPARENCY
Fifty patients examined with multimodal magnetic resonance imagery by Luyt et al1 and van der
Eerden et al2 were part of the derivation cohort of this study. Analysis process was different and
data recomputed in the present paper with a different methodology.
7
DETAILS OF CONVENTIONAL MR IMAGING ACQUISITION
The following conventional MR sequences were performed:
(i) 3D inversion recovery fast spoiled gradient recalled echo (FSPGR) or magnetization-
prepared rapid acquisition gradient echo (MP RAGE) T1-weighted images;
(ii) Axial T2-weighted fluid-attenuated inversion recovery (FLAIR) images;
(iii) Axial T2*-weighted gradient-recalled echo (GRE) or susceptibility-weighted imaging
(SWI);
(iv) Diffusion-weighted imaging (DWI).
The protocol for the MR varied slightly by institution, reflecting a pragmatic approach to
acquisition of imaging data. The precise parameters of each sequence were adapted to the individual
scanner type, field strength, coil used, and departmental protocol (Table S1; appendix pp18).

8
DIFFUSION TENSOR IMAGING (DTI) ACQUISITION AND PROCESSING
There were minimum requirements for diffusion tensor imaging (DTI) acquisition. Whole-brain
DTI was acquired in an axial plane perpendicular to the main field B0 using diffusion-encoding
gradient pulses (b ranges from 700 to 1000 sec/mm2) applied along at least 11 orientations (range
11 to 64; Table S1) isotropically distributed over the surface of a sphere with electrostatic
repulsion, a maximum slice thickness of 3 mm (range 2 to 3 mm) with no gap between slices, a 96
x 96 matrix, and a field of view (FOV) of 300 mm. At least two additional volumes (range 2 to 4)
were acquired with b = 0 sec/mm2. Parallel imaging was employed with a maximal acceleration
factor of 2.
All DTI image-processing steps were performed in a fully automated processing pipeline. The
pipeline involved:
(i) Correction for motion and distortions caused by Eddy currents using the Functional MRI
of the Brain (FMRIB) software library package 5.0 (www.fmrib.ox.ac.uk/fsl/);3
(ii) Computing the fractional anisotropy (FA) and the average diffusion coefficient (aDC)
maps4 using the diffusion tensor model with the FMRIB’s DTIFIT algorithm;5
(iii) Linear and nonlinear registration of the FA and aDC maps on the T1 with the University
College London’s NiftyREG tool (cmictig.cs.ucl.ac.uk/research/software/22-niftyreg);6
(iv) Masking of the white and gray matter using segmented anatomical MRI of the subject
with the Freesurfer image analysis suite (http://surfer.nmr.mgh.harvard.edu/);7
(v) Averaging FA and aDC values within segmented whole brain (WB), white matter
(WWM) and gray matter (WGM) masks (see next figure).
9
Brainsegmentationsof3DT1-weightedMRItemplate.WholeBrainmask,ingreen;WholeWhiteMattermask,inyellow;andWholeGreyMattermaskinred.
Given the variability in FA and aDC of healthy volunteers values between centers (Table S2;
appendix pp19), which arises because of differences in scanner types and acquisition parameters, a
normalization procedure was performed. That is, the raw value of each derived diffusion measure
was divided by the mean of this measure across control subjects acquired in the same scanner with
the same sequence.
WholeWhiteMatter WholeGreyMatterWholeBrain
10
PROTON MAGNETIC RESONANCE SPECTROSCOPY (1H-MRS) DATA ACQUISITION
AND PROCESSING
Proton magnetic resonance spectroscopy (1H-MRS), was acquired on all MR scanners using the
point-resolved proton spectroscopy sequence (PRESS) with TR=1500 ms, TE=135 ms. Single-
voxel spectroscopy was acquired in the posterior two-thirds of the pons (matrix, 1x1; voxel
thickness, 15 mm; frequency direction, S/I; 96 averages with water suppression). The axial
chemical shift imaging (CSI) was performed at the level of the two thalami (matrix, 18 x 18; field
of view, 24 x 24 cm; slice thickness, 10 to 20 mm; number of excitation, 1).
1H-MRS data processing was performed by expert neuroradiologists using standard manufacturer
software dedicated to MR spectroscopy post-processing (Advantage Windows for General Electric;
Spectra, Syngo MR for Siemens; and Achieva software for Philips). For CSI data, the volume of
interest in the thalamus was placed on non-angled FLAIR images after coregistration of
spectroscopic data and FLAIR volume. The quality of the selected spectra was inspected by experts
(N.A., and D.G.) and was considered acceptable only if choline (Cho) and creatine (Cr) signals
were clearly separated. The spectra were analyzed for the concentration of metabolites in the
thalamus and pons: N-acetylaspartate (NAA; at 2 ppm), choline (Cho; at 3.2 ppm), creatine and
phosphocreatine (Cr; at 3 ppm). For pons, the voxel was positioned on the 2/3 posterior part of the
pons, covering all its height. For thalami, the NAA/Cr ratio was computed as (NAA left thalamus +
NAA right thalamus)/(Cr left thalamus + Cr right thalamus), except in cases where some voxels
were not interpretable. In this case, only the side with spectra of good quality was taken into
account.
11
CALCULATION OF ODDS RATIOS
Because there were categorical and continuous variables with different units, odds ratios (with 95%
CI) were computed by taking the exponent of the absolute value of the estimated parameters (and
95% CI), thelatterbeingmultipliedby a factor that accounts for the unit used (i.e., 0.1 in the case
of 1H-MRS parameters). We tested the null hypothesis of an estimated parameter being equal to
zero with the use of Wald’s test with one degree of freedom. This corresponds to the null hypothesis
of an odds ratio being equal to 1, i.e., no predictive value. Hence, a variable was considered to be
predictive if P<0.05.

12
MULTIVARIATE LOGISTIC-REGRESSION MODELS
A forward stepwise variable selection was performed with Akaike information criterion, alpha-to-
enter equal to 0.10 and alpha-to-exit equal to 0.20, as described by Hosmer and Lemeshow.8
First model
In the first model, only the following were considered: standard predictive variables (i.e., motor
response no better than extensor at MRI day), OHCA score, and the predictive EEG variables (i.e.,
the Synek score and the absence of reactivity).
Second model
In the second model, qualitative MRI variables (FLAIR, DWI) were added to those in the first
model.
Third model
In the third model, predictive quantitative MRI variables (WWM-FA, whole brain FA, gray matter
aDC, thalamus and pons NAA/Cr ratio) were added to the second model.
13
SUPPLEMENTARY FIGURES AND TABLES
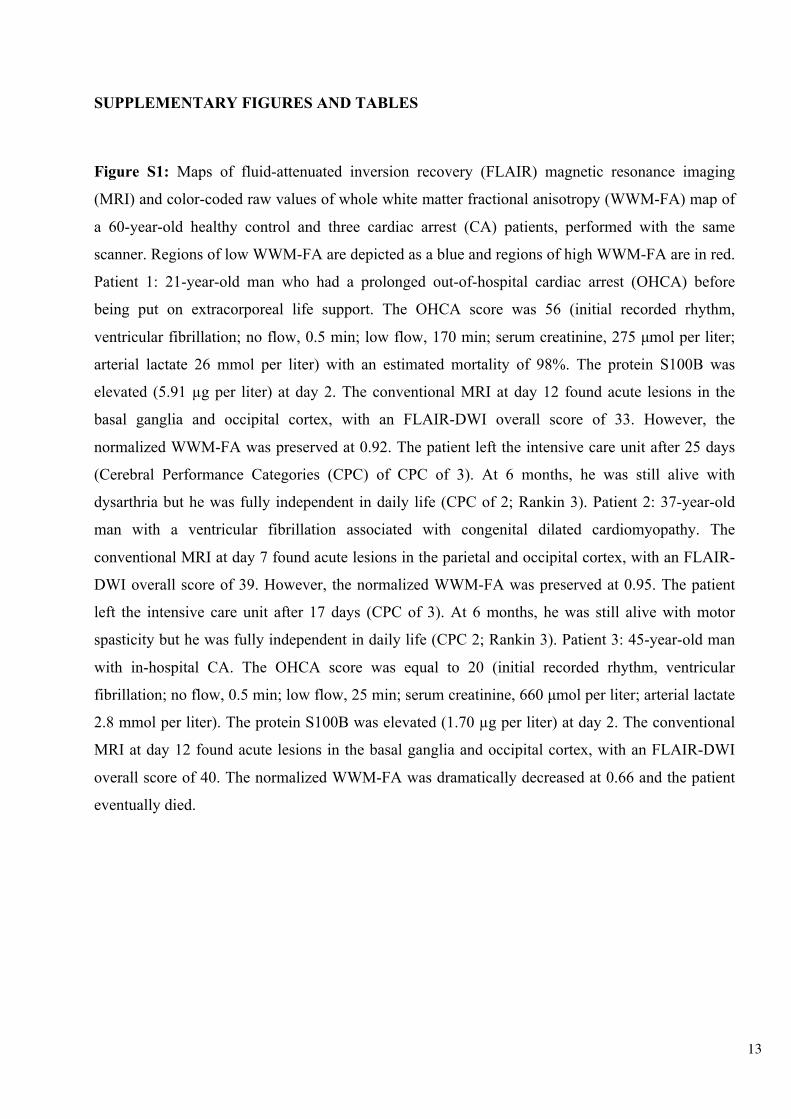
Figure S1: Maps of fluid-attenuated inversion recovery (FLAIR) magnetic resonance imaging
(MRI) and color-coded raw values of whole white matter fractional anisotropy (WWM-FA) map of
a 60-year-old healthy control and three cardiac arrest (CA) patients, performed with the same
scanner. Regions of low WWM-FA are depicted as a blue and regions of high WWM-FA are in red.
Patient 1: 21-year-old man who had a prolonged out-of-hospital cardiac arrest (OHCA) before
being put on extracorporeal life support. The OHCA score was 56 (initial recorded rhythm,
ventricular fibrillation; no flow, 0.5 min; low flow, 170 min; serum creatinine, 275 µmol per liter;
arterial lactate 26 mmol per liter) with an estimated mortality of 98%. The protein S100B was
elevated (5.91 µg per liter) at day 2. The conventional MRI at day 12 found acute lesions in the
basal ganglia and occipital cortex, with an FLAIR-DWI overall score of 33. However, the
normalized WWM-FA was preserved at 0.92. The patient left the intensive care unit after 25 days
(Cerebral Performance Categories (CPC) of CPC of 3). At 6 months, he was still alive with
dysarthria but he was fully independent in daily life (CPC of 2; Rankin 3). Patient 2: 37-year-old
man with a ventricular fibrillation associated with congenital dilated cardiomyopathy. The
conventional MRI at day 7 found acute lesions in the parietal and occipital cortex, with an FLAIR-
DWI overall score of 39. However, the normalized WWM-FA was preserved at 0.95. The patient
left the intensive care unit after 17 days (CPC of 3). At 6 months, he was still alive with motor
spasticity but he was fully independent in daily life (CPC 2; Rankin 3). Patient 3: 45-year-old man
with in-hospital CA. The OHCA score was equal to 20 (initial recorded rhythm, ventricular
fibrillation; no flow, 0.5 min; low flow, 25 min; serum creatinine, 660 µmol per liter; arterial lactate
2.8 mmol per liter). The protein S100B was elevated (1.70 µg per liter) at day 2. The conventional
MRI at day 12 found acute lesions in the basal ganglia and occipital cortex, with an FLAIR-DWI
overall score of 40. The normalized WWM-FA was dramatically decreased at 0.66 and the patient
eventually died.

14

15
Figure S2: Scatter plot of whole white matter fractional anisotropy (FA) versus whole brain
average diffusion coefficient (aDC) for all patients in the derivation cohort and healthy volunteers.
Subjects status are in color, MRI delays are represented by symbols.
16
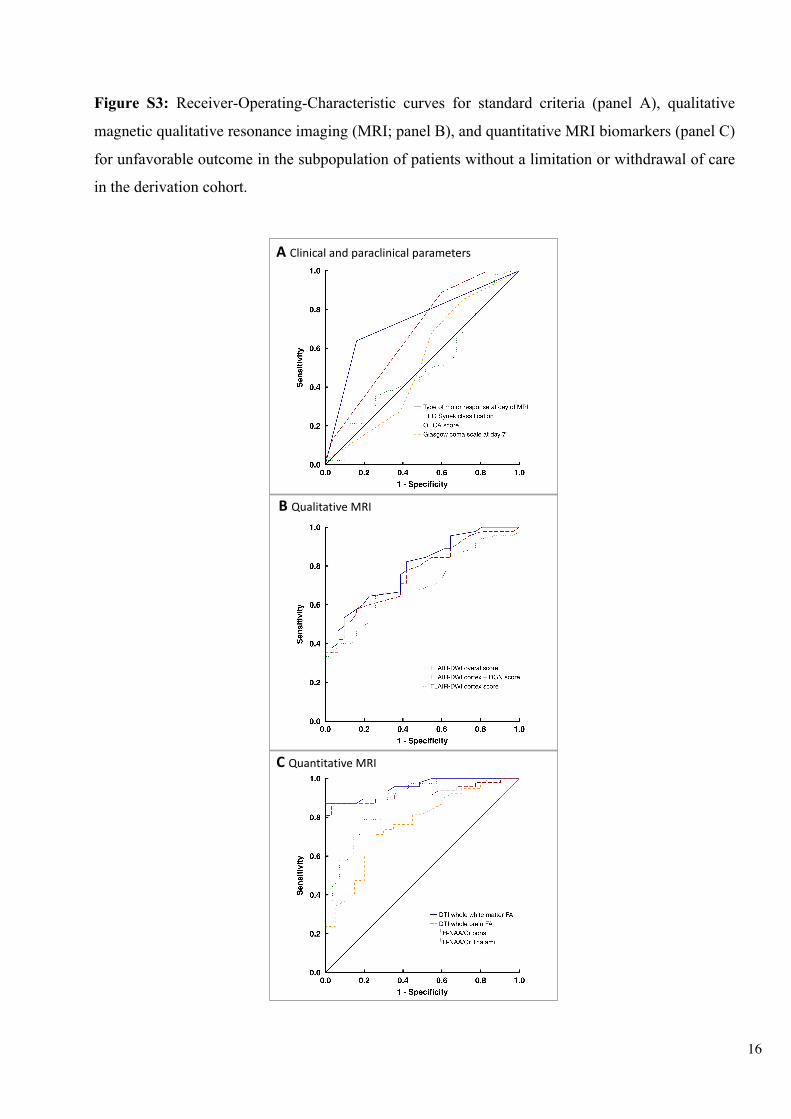
Figure S3: Receiver-Operating-Characteristic curves for standard criteria (panel A), qualitative
magnetic qualitative resonance imaging (MRI; panel B), and quantitative MRI biomarkers (panel C)
for unfavorable outcome in the subpopulation of patients without a limitation or withdrawal of care
in the derivation cohort.
A Clinicalandparaclinical parameters
B QualitativeMRI
C QuantitativeMRI
1
1

17
Figure S4: Probability of unfavorable outcome according to whole white matter fractional anisotropy
(WWM-FA) in the derivation cohort. Estimate of the probability of unfavorable outcome at a given
value of WWM-FA. Fitted logistic function over the patients without low average diffusion
coefficient (aDC). The gray zone corresponds to the 95% confidence interval of the estimated
probability. The dots represent the patients, being placed at y-axis equal to 1 if the outcome is
unfavorable, and 0 on the contrary.
18
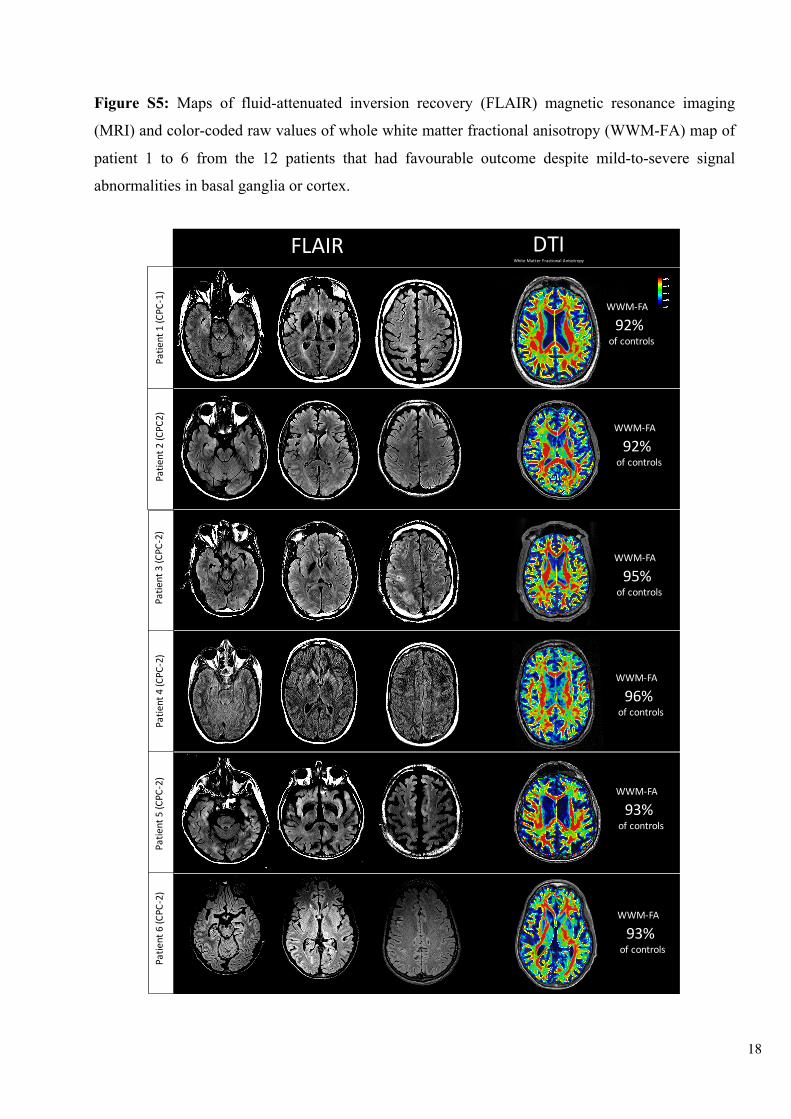
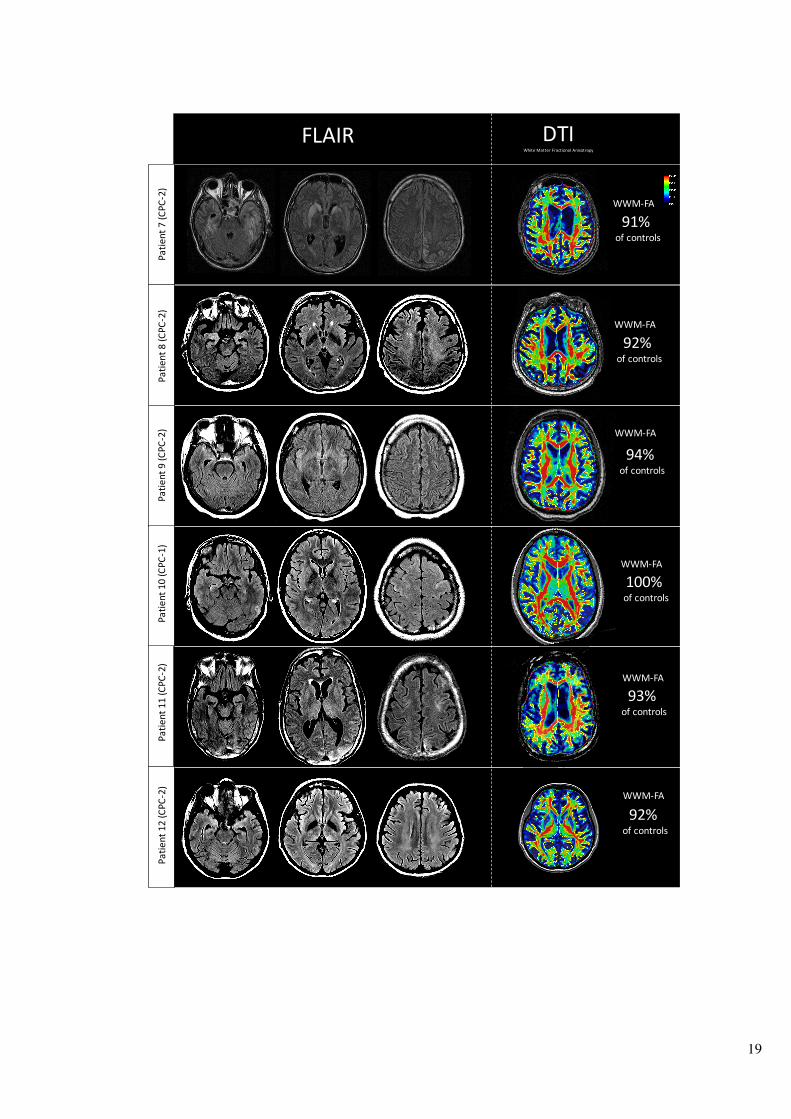
Figure S5: Maps of fluid-attenuated inversion recovery (FLAIR) magnetic resonance imaging
(MRI) and color-coded raw values of whole white matter fractional anisotropy (WWM-FA) map of
patient 1 to 6 from the 12 patients that had favourable outcome despite mild-to-severe signal
abnormalities in basal ganglia or cortex.
FLAIR
92%ofcontrols
DTIWhiteMatter Fractional Anisotropy
WWM-FA
92%ofcontrols
WWM-FA
95%ofcontrols
WWM-FA
96%ofcontrols
WWM-FA
93%ofcontrols
WWM-FA
93%ofcontrols
WWM-FA
Patie
nt1(C
PC-1)
Patie
nt2(C
PC2)
Patie
nt3(C
PC-2)
Patie
nt4(C
PC-2)
Patie
nt5(C
PC-2)
Patie
nt6(C
PC-2)
19
FLAIR DTIWhiteMatter Fractional Anisotropy
91%ofcontrols
WWM-FA
92%ofcontrols
WWM-FA
94%ofcontrols
100%ofcontrols
93%ofcontrols
92%ofcontrols
WWM-FA
WWM-FA
WWM-FA
WWM-FA
Patie
nt8(C
PC-2)
Patie
nt9(C
PC-2)
Patie
nt10(CPC
-1)
Patie
nt11(CPC
-2)
Patie
nt12(CPC
-2)
Patie
nt7(C
PC-2)
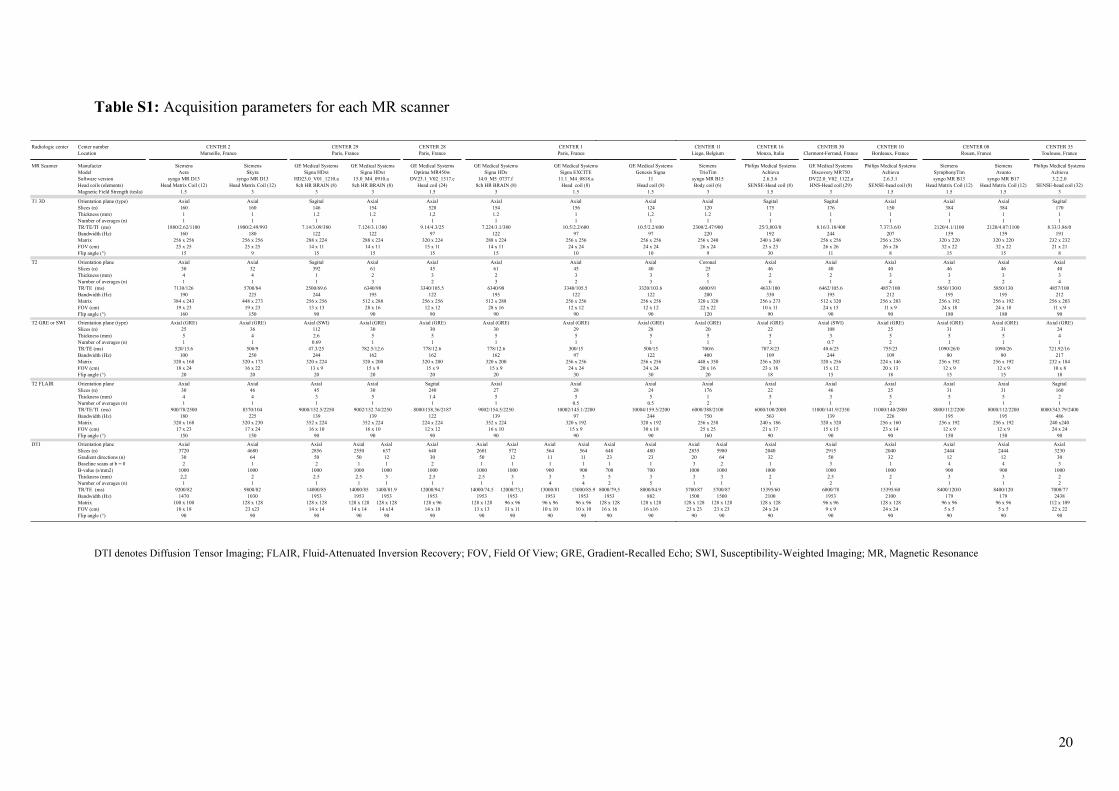
Table S1: Acquisition parameters for each MR scanner
DTI denotes Diffusion Tensor Imaging; FLAIR, Fluid-Attenuated Inversion Recovery; FOV, Field Of View; GRE, Gradient-Recalled Echo; SWI, Susceptibility-Weighted Imaging; MR, Magnetic Resonance
Radiologic center Center number CENTER 28Location Paris, France
MR Scanner Manufacter Siemens Siemens GE Medical Systems GE Medical SystemsModel Aera Skyra Signa HDxt Optima MR450wSoftware version syngo MR D13 syngo MR D13 HD23.0_V01_1210.a DV23.1_V02_1317.cHead coils (elements) Head Matrix Coil (12) Head Matrix Coil (12) 8ch HR BRAIN (8) Head coil (24)Magnetic Field Strength (tesla) 1.5 3 3 1.5
T1 3D Orientation plane (type) Axial Axial Sagital AxialSlices (n) 160 160 146 528Thickness (mm) 1 1 1.2 1,2Number of averages (n) 1 1 1 1TR/TE/TI (ms) 1880/2.62/1100 1900/2.49/993 7.14/3.09/380 9.14/4.3/25Bandwidth (Hz) 160 180 122 97Matrix 256 x 256 256 x 256 288 x 224 320 x 224FOV (cm) 25 x 25 25 x 25 14 x 11 15 x 11Flip angle (°) 15 9 15 15
T2 Orientation plane Axial Axial Sagital AxialSlices (n) 30 32 392 45Thickness (mm) 4 4 1 3Number of averages (n) 1 1 1 2TR/TE (ms) 7130/126 5700/84 2500/69.6 3340/105.5Bandwidth (Hz) 190 225 244 122Matrix 384 x 243 448 x 273 256 x 256 256 x 256FOV (cm) 19 x 23 19 x 23 13 x 13 12 x 12Flip angle (°) 160 150 90 90
T2 GRE or SWI Orientation plane (type) Axial (GRE) Axial (GRE) Axial (SWI) Axial (GRE)Slices (n) 25 36 112 30Thickness (mm) 5 4 2.6 5Number of averages (n) 1 1 0.69 1TR/TE (ms) 520/13.6 500/9 47.3/25 778/12.6Bandwidth (Hz) 100 250 244 162Matrix 320 x 168 320 x 173 320 x 224 320 x 200FOV (cm) 18 x 24 16 x 22 13 x 9 15 x 9Flip angle (°) 20 20 20 20
T2 FLAIR Orientation plane Axial Axial Axial SagitalSlices (n) 30 46 45 240Thickness (mm) 4 4 3 1.4Number of averages (n) 1 1 1 1TR/TE/TI (ms) 900/78/2500 8370/104 9000/152.5/2250 8000/158.36/2187Bandwidth (Hz) 180 225 139 122Matrix 320 x 168 320 x 230 352 x 224 224 x 224FOV (cm) 17 x 23 17 x 24 16 x 10 12 x 12Flip angle (°) 150 150 90 90
DTI Orientation plane Axial Axial Axial Axial Axial Axial Axial Axial Axial AxialSlices (n) 3720 4680 2856 2550 637 648 2601 572 564 564Gradient directions (n) 30 64 50 50 12 30 50 12 11 11Baseline scans at b = 0 2 1 2 1 1 2 1 1 1 1B-value (s/mm2) 1000 1000 1000 1000 1000 1000 1000 1000 900 900Thickness (mm) 2,2 2 2.5 2.5 3 2.5 2.5 3 3 3Number of averages (n) 1 1 1 1 1 1 1 1 4 4TR/TE (ms) 9200/82 9800/82 14000/85 14000/85 1400/81.9 12000/94.7 14000/74.5 12000/73,1 13000/81 13000/85.9Bandwidth (Hz) 1470 1030 1953 1953 1953 1953 1953 1953 1953 1953Matrix 100 x 100 128 x 128 128 x 128 128 x 128 128 x 128 128 x 96 128 x 128 96 x 96 96 x 96 96 x 96FOV (cm) 18 x 18 23 x23 14 x 14 14 x 14 14 x14 14 x 10 13 x 13 11 x 11 10 x 10 10 x 10Flip angle (°) 90 90 90 90 90 90 90 90 90 90
16 x 10 16 x 10 15 x 990 90 90
139 139 97352 x 224 352 x 224 320 x 192
1 1 0.59002/152.74/2250 9002/154.5/2250 10002/145.1/2200
30 27 285 5 5
Axial Axial Axial
15 x 9 15 x 9 24 x 2420 20 30
162 162 97320 x 200 320 x 200 256 x 256
1 1 1782.5/12.6 778/12.6 300/15
30 30 295 5 5
Axial (GRE) Axial (GRE) Axial (GRE)
90 90 90
512 x 288 512 x 288 256 x 25628 x 16 28 x 16 12 x 12
6340/98 6340/98 3340/105.5195 195 122
2 2 33 3 2
Axial Axial Axial61 61 45
15 15 10
288 x 224 288 x 224 256 x 25614 x 11 14 x 11 24 x 24
7.124/3.1/380 7.224/3.1/380 10.5/2.2/600122 122 97
1.2 1.2 11 1 1
Axial Axial Axial154 154 156
3 3 1.5
15.0_M4_0910.a 14.0_M5_0737.f 11.1_M4_0818.a8ch HR BRAIN (8) 8ch HR BRAIN (8) Head coil (8)
GE Medical Systems GE Medical Systems GE Medical SystemsSigna HDxt Signa HDx Signa EXCITE
Marseille, France Paris, France Paris, FranceCENTER 2 CENTER 29 CENTER 1
GE Medical SystemsGenesis Signa
11Head coil (8)
1.5
Axial1241,21
10.5/2.2/60097
256 x 25624 x 24
10
Axial4033
3320/103.6122
256 x 25612 x 12
90
Axial (GRE)2851
500/15122
256 x 25624 x 24
30
Axial245
0.510004/159.5/2200
244320 x 192
30 x 1890
Axial Axial648 48023 231 1
700 7005 32 5
8000/79,5 8000/84.91953 882
128 x 128 128 x 12816 x 16 16 x16
90 90
15 x 990
97320 x 192
0.510002/145.1/2200
285
Axial
24 x 2430
97256 x 256
1300/15
295
Axial (GRE)
90
256 x 25612 x 12
3340/105.5122
32
Axial45
10
256 x 25624 x 24
10.5/2.2/60097
11
Axial156
1.5
11.1_M4_0818.aHead coil (8)
GE Medical SystemsSigna EXCITE
Paris, FranceCENTER 1 CENTER 16 CENTER 30 CENTER 10 CENTER 35
Monza, Italia Clermont-Ferrand, France Bordeaux, France Toulouse, France
Philips Medical Systems GE Medical Systems Philips Medical Systems Siemens Siemens Philips Medical SystemsAchieva Discovery MR750 Achieva SymphonyTim Avanto Achieva2.6.3.6 DV22.0_V02_1122.a 2.6.3.1 syngo MR B13 syngo MR B17 3.2.2.0
SENSE-Head coil (8) HNS-Head coil (29) SENSE-head coil (8) Head Matrix Coil (12) Head Matrix Coil (12) SENSE-head coil (32)1.5 3 1.5 1.5 1.5 3
Sagital Sagital Axial Axial Axial Sagital175 176 150 384 384 170
1 1 1 1 1 11 1 1 1 1 1
25/3,803/0 8.16/3.18/400 7.37/3.6/0 2120/4.1/1100 2120/4.07/1100 8.33/3.86/0192 244 207 159 159 191
240 x 240 256 x 256 256 x 256 320 x 220 320 x 220 232 x 23223 x 23 26 x 26 26 x 26 32 x 22 32 x 22 21 x 21
30 11 8 15 15 8
Axial Axial Axial Axial Axial Axial46 40 40 46 46 402 2 3 3 3 36 1 4 2 2 4
4633/100 6462/105.6 4857/100 5850/130/0 5850/130 4857/100330 195 212 195 195 212
256 x 273 512 x 320 256 x 203 256 x 192 256 x 192 256 x 20310 x 11 24 x 15 11 x 9 24 x 18 24 x 18 11 x 9
90 90 90 180 180 90
Axial (GRE) Axial (SWI) Axial (GRE) Axial (GRE)22 108 25 31 31 245 3 5 5 5 42 0.7 2 1 1 1
707.8/23 40.6/25 755/23 1090/26/0 1090/26 721.92/16109 244 109 80 80 217
256 x 205 320 x 256 224 x 146 256 x 192 256 x 192 232 x 18423 x 18 15 x 12 20 x 13 12 x 9 12 x 9 10 x 8
18 15 18 15 15 18
Axial Axial Axial Axial Axial Sagital22 46 25 31 31 1605 3 5 5 5 21 1 2 1 1 1
6000/100/2000 11000/141.9/2350 11000/140/2800 8000/112/2200 8000/112/2200 8000/343.79/2400563 139 226 195 195 486
240 x 186 320 x 320 256 x 160 256 x 192 256 x 192 240 x24021 x 17 15 x 15 23 x 14 12 x 9 12 x 9 24 x 24
90 90 90 150 150 90
Axial Axial Axial Axial Axial Axial Axial Axial2835 5980 2040 2915 2040 2444 2444 3230
20 64 32 50 32 12 12 303 2 1 3 1 4 4 3
1000 1000 1000 1000 1000 900 900 10003 3 2 2.5 2 3 3 21 1 1 2 1 1 1 2
5700/87 5700/87 15395/60 6000/78 15395/60 8400/120/0 8400/120 7000/771500 1500 2100 1953 2100 179 179 2438
128 x 128 128 x 128 128 x 128 96 x 96 128 x 128 96 x 96 96 x 96 112 x 10923 x 23 23 x 23 24 x 24 9 x 9 24 x 24 5 x 5 5 x 5 22 x 22
90 90 90 90 90 90 90 90
25 x 25160
750256 x 258
26000/388/2100
1761
Axial
20 x 1620
400448 x 350
1700/6
205
Axial (GRE) Axial (GRE) Axial (GRE)
120
320 x 32022 x 22
6000/91200
51
Coronal25
9
256 x 24026 x 24
2300/2.47/900220
1.21
Axial120
3
syngo MR B15Body coil (6)
SiemensTrioTim
Liege, Belgium Rouen, FranceCENTER 11 CENTER 08
20
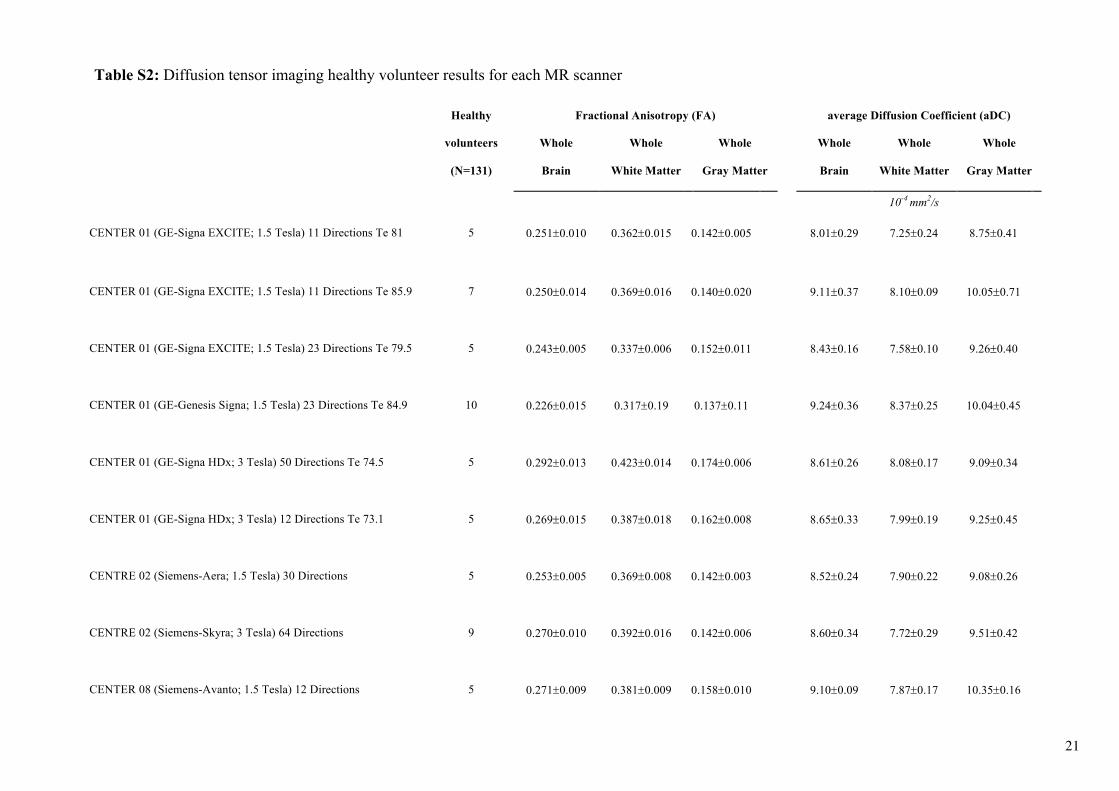
Table S2: Diffusion tensor imaging healthy volunteer results for each MR scanner
Healthy Fractional Anisotropy (FA) average Diffusion Coefficient (aDC)
volunteers
(N=131)
Whole
Brain
Whole
White Matter
Whole
Gray Matter
Whole
Brain
Whole
White Matter
Whole
Gray Matter
10-4 mm2/s
CENTER 01 (GE-Signa EXCITE; 1.5 Tesla) 11 Directions Te 81 5 0.251±0.010 0.362±0.015
0.142±0.005
8.01±0.29
7.25±0.24 8.75±0.41
CENTER 01 (GE-Signa EXCITE; 1.5 Tesla) 11 Directions Te 85.9 7 0.250±0.014
0.369±0.016
0.140±0.020
9.11±0.37
8.10±0.09
10.05±0.71
CENTER 01 (GE-Signa EXCITE; 1.5 Tesla) 23 Directions Te 79.5 5 0.243±0.005
0.337±0.006
0.152±0.011
8.43±0.16
7.58±0.10
9.26±0.40
CENTER 01 (GE-Genesis Signa; 1.5 Tesla) 23 Directions Te 84.9 10 0.226±0.015
0.317±0.19
0.137±0.11
9.24±0.36
8.37±0.25
10.04±0.45
CENTER 01 (GE-Signa HDx; 3 Tesla) 50 Directions Te 74.5 5 0.292±0.013
0.423±0.014
0.174±0.006
8.61±0.26
8.08±0.17
9.09±0.34
CENTER 01 (GE-Signa HDx; 3 Tesla) 12 Directions Te 73.1 5 0.269±0.015
0.387±0.018
0.162±0.008
8.65±0.33
7.99±0.19
9.25±0.45
CENTRE 02 (Siemens-Aera; 1.5 Tesla) 30 Directions 5 0.253±0.005
0.369±0.008
0.142±0.003
8.52±0.24
7.90±0.22
9.08±0.26
CENTRE 02 (Siemens-Skyra; 3 Tesla) 64 Directions 9 0.270±0.010
0.392±0.016
0.142±0.006
8.60±0.34
7.72±0.29
9.51±0.42
CENTER 08 (Siemens-Avanto; 1.5 Tesla) 12 Directions 5 0.271±0.009
0.381±0.009
0.158±0.010
9.10±0.09
7.87±0.17
10.35±0.16
21
CENTER 08 (Siemens-Symphonytim; 1.5 Tesla) 12 Directions 7 0.291±0.011
0.401±0.12
0.187±0.10
8.91±0.25
7.73±0.22
10.00±0.32
CENTER 10 (Philips-Achieva; 1.5 Tesla) 32 Directions 7 0.260±0.016
0.348±0.028
0.164±0.008 8.73±0.32
8.07±0.32
9.41±0.34
CENTER 11 (Siemens-TrioTim; 3 Tesla) 20 Directions 5 0.279±0.008
0.398±0.010
0.154±0.014 8.40±0.27
7.49±0.27
9.37±0.33
CENTER 11 (Siemens-TrioTim; 3 Tesla) 64 Directions 9 0.267±0.018
0.380±0.030
0.146±0.007
8.36±0.36
7.63±0.32
9.15±0.47
CENTER 16 (Philips-Achieva; 1.5 Tesla) 32 Directions 6 0.276±0.009
0.393±0.105
0.170±0.004
8.42±0.20
7.79±0.13
8.98±0.27
CENTRE 28 (GE-Optima MR450w; 3 Tesla) 30 Directions Te 94 5 0.269±0.015
0.387±0.108
0.162±0.008
8.65±0.33
7.99±0.19
9.25±0.45
CENTRE 29 (GE-Signa HDxt; 3 Tesla) 12 Directions Te 81.9 5 0.238±0.015
0.357±0.007
0.124±0.005
8.95±0.15
8.25±0.18
9.64±0.16
CENTER 29 (GE-Signa HDxt; 3 Tesla) 50 Directions Te 85 16 0.274±0.009
0.403±0.012
0.149±0.007
8.90±0.24
8.20±0.22
9.57±0.38
CENTER 30 (GE-Discovery MR750; 3 Tesla) 50 Directions 9 0.253±0.010
0.384±0.10
0.135±0.008
8.93±0.53
7.99±0.32
9.79±0.77
CENTER 35 (Philips-Achieva; 3 Tesla) 30 Directions
GE, General Electric. Results are means ±SD.
6 0.300±0.004
0.434±0.005
0.174±0.005
8.18±0.17
7.45±0.10
8.82±0.22
22

Table S3: Outcomes in the derivation and validation cohorts
Developmental cohort Validation cohort
All patients
Favorable outcome
(CPC 1-2)Unfavorable
outcome (CPC 3-5)
All
patientsFavorable outcome
(CPC 1-2)
Unfavorable outcome
(CPC 3-5)
(N = 150) (N = 33) (N = 117) (N = 50) (N = 11) (N = 39) Variables
Best numerical, Cerebral Performance Categories (CPC) during trial
Category — no. (%)
1 12 (8) 12 (36) 0 (0) 1 (2) 1 (9) 0 (0) 2 21 (14) 21 (64) 0 (0) 10 (20) 10 (91) 0 (0) 3 11 (7) 0 (0) 11 (9) 7 (14) 0 (0) 7 (18) 4 106 (71) 0 (0) 106 (91) 32 (64) 0 (0) 32 (82) 5 NA NA NA NA NA NA CPC at follow-up*
Category — no. (%)
1 12 (8) 12 (36) 0 (0) 1 (2) 1 (9) 0 (0) 2 16 (11) 16 (49) 0 (0) 9 (18) 9 (82) 0 (0) 3 6 (4) 1 (3) 5 (4) 4 (8) 0 (0) 4 (10) 4 10 (7) 0 (0) 10 (9) 6 (12) 0 (0) 6 (15) 5 106 (71) 4 (12) 102 (87) 30 (60) 1 (9) 29 (75) Modified Rankin scale score at follow-up*
Score — no. (%)
0 2 (1) 2 (6) 0 (0) 1 (2) 1 (9) 0 (0) 1 8 (5) 8 (24) 0 (0) 0 (0) 0 (0) 0 (0)
23
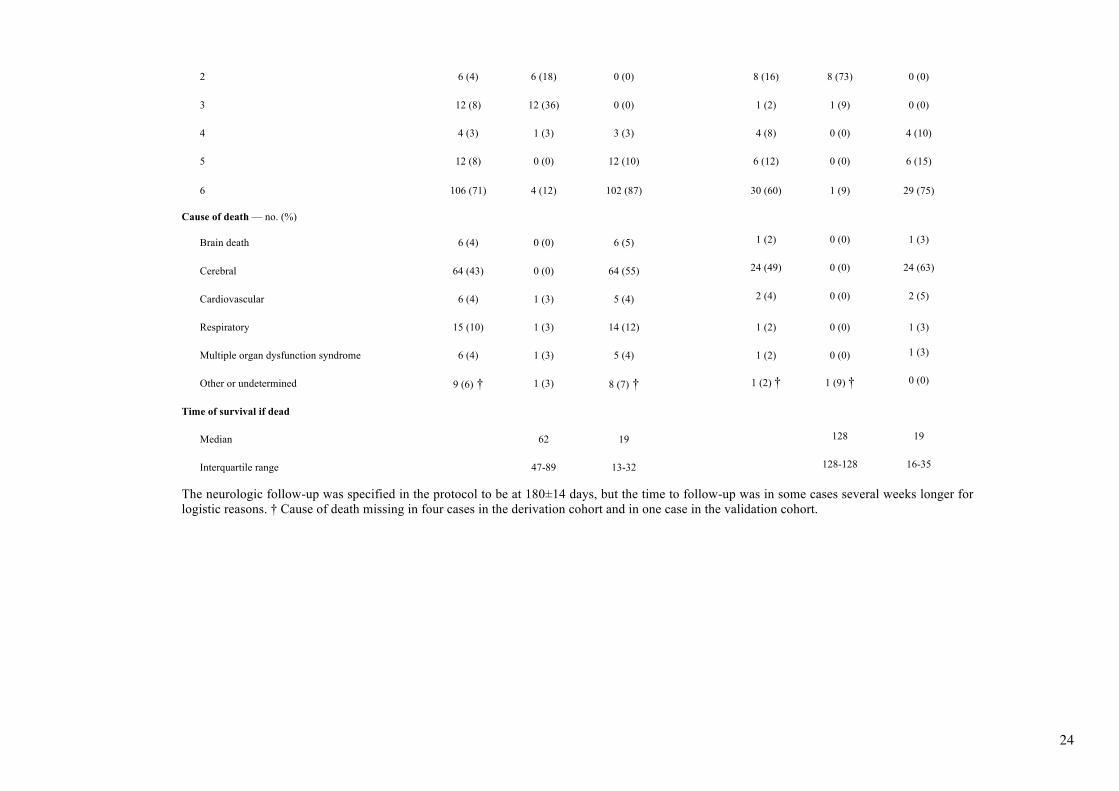
2 6 (4) 6 (18) 0 (0) 8 (16) 8 (73) 0 (0) 3 12 (8) 12 (36) 0 (0) 1 (2) 1 (9) 0 (0) 4 4 (3) 1 (3) 3 (3) 4 (8) 0 (0) 4 (10) 5 12 (8) 0 (0) 12 (10) 6 (12) 0 (0) 6 (15) 6 106 (71) 4 (12) 102 (87) 30 (60) 1 (9) 29 (75) Cause of death — no. (%)
Brain death 6 (4) 0 (0) 6 (5) 1 (2) 0 (0) 1 (3) Cerebral 64 (43) 0 (0) 64 (55) 24 (49) 0 (0) 24 (63) Cardiovascular 6 (4) 1 (3) 5 (4) 2 (4) 0 (0) 2 (5) Respiratory 15 (10) 1 (3) 14 (12) 1 (2) 0 (0) 1 (3) Multiple organ dysfunction syndrome 6 (4) 1 (3) 5 (4) 1 (2) 0 (0) 1 (3) Other or undetermined 9 (6) † 1 (3) 8 (7) † 1 (2) † 1 (9) † 0 (0) Time of survival if dead Median 62 19 128 19 Interquartile range 47-89 13-32 128-128 16-35 The neurologic follow-up was specified in the protocol to be at 180±14 days, but the time to follow-up was in some cases several weeks longer for logistic reasons. † Cause of death missing in four cases in the derivation cohort and in one case in the validation cohort.
24
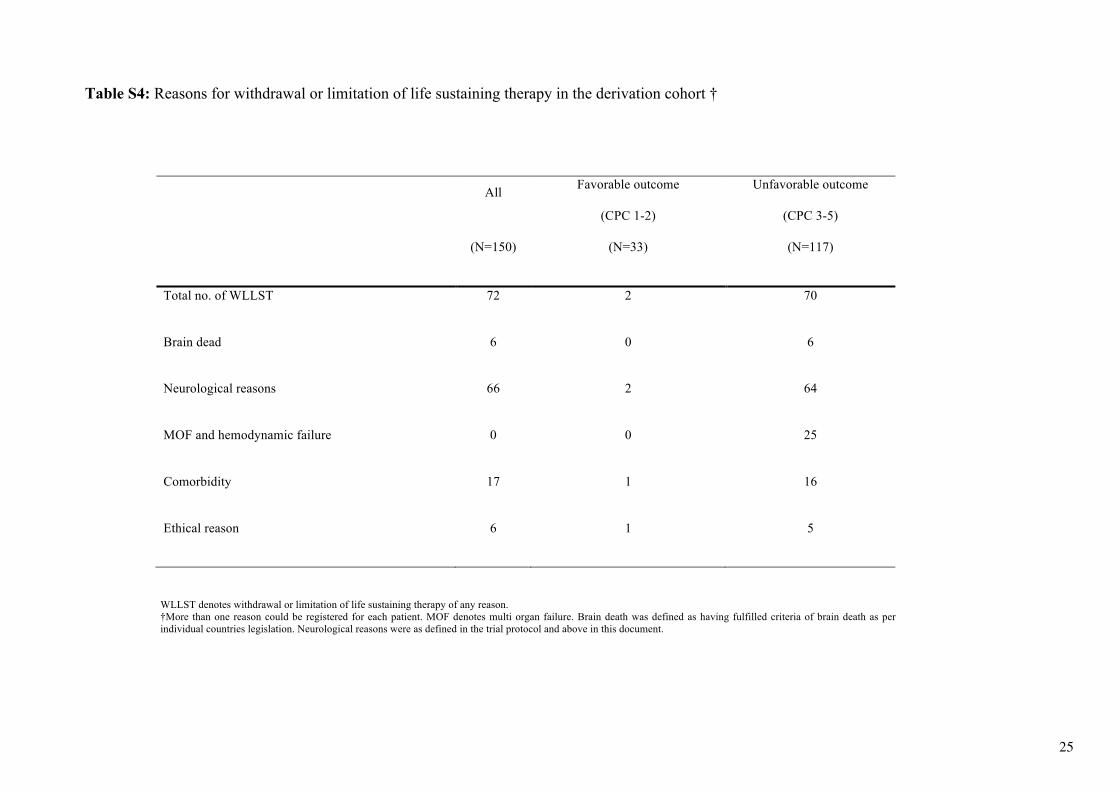
Table S4: Reasons for withdrawal or limitation of life sustaining therapy in the derivation cohort †
All Favorable outcome
(CPC 1-2)
Unfavorable outcome
(CPC 3-5)
(N=150) (N=33) (N=117)
Total no. of WLLST 72 2 70
Brain dead 6 0 6
Neurological reasons 66 2 64
MOF and hemodynamic failure 0 0 25
Comorbidity 17 1 16
Ethical reason 6 1 5
WLLST denotes withdrawal or limitation of life sustaining therapy of any reason. †More than one reason could be registered for each patient. MOF denotes multi organ failure. Brain death was defined as having fulfilled criteria of brain death as per individual countries legislation. Neurological reasons were as defined in the trial protocol and above in this document.
25

Table S5: Criteria of poor outcome fulfilled or not by the 33 patients with favourable outcome.
Motor response <3 at day 7
No pupillary or corneal reflexes
High NSE or S100B levels †
Status myoclonus
Unreactive burst-suppression on EEG
Status epilepticus on EEG
Diffuse anoxic injury on MRI
Patient 1 - -
- - - - Patient 2 - -
- - - -
Patient 3 - -
-
- Patient 4 + - - -
-
Patient 5 + -
- - - - Patient 6 - -
- - - -
Patient 7 - -
- - - - Patient 8 - -
- - - -
Patient 9 + - - - + - - Patient 10 + -
- - - -
Patient 11 - - - - - - - Patient 12 - -
- - - -
Patient 13 + -
- - - - Patient 14 + -
- - - -
Patient 15 + -
- - - - Patient 16 - - - - - - - Patient 17 - -
-
-
Patient 18 - - + (S100B) - - - + Patient 19 + -
- - - -
Patient 20 - - - - - - - Patient 21 - - - -
-
Patient 22 - - - - - - + Patient 23 - -
-
+
Patient 24 - -
- - - - Patient 25 + -
- - + +
Patient 26 - -
- - - + Patient 27 - -
- - - +
Patient 28 + - + (NSE) - - - + Patient 29 - - - - - - + Patient 30 + -
- - - +
Patient 31 - - - - - - + Patient 32 + - + (S100B) - - - + Patient 33 + + - + EEG denotes electroencephalography; MRI, magnetic resonance imaging; NSE, neuron specific enolase and S100B, protein S-100B. ‘‘+’’ indicates the criterion was present, “-“ it was absent and a blank cell indicates the test was not performed. † Only high NSE levels are considered as a biological criterion of poor outcome according to the ERC/ESICM guidelines9
26
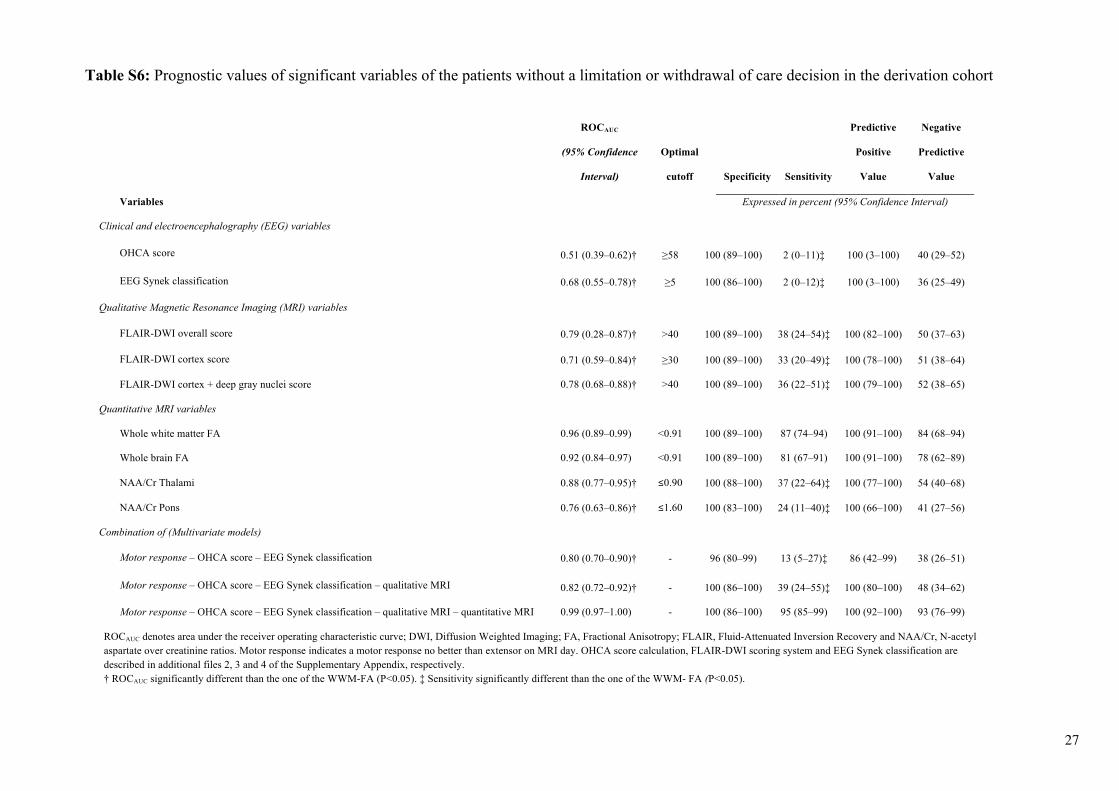
Table S6: Prognostic values of significant variables of the patients without a limitation or withdrawal of care decision in the derivation cohort
ROCAUC
(95% Confidence
Interval)
Optimal
cutoff Specificity Sensitivity
Predictive
Positive
Value
Negative
Predictive
Value
Variables
Expressed in percent (95% Confidence Interval)
Clinical and electroencephalography (EEG) variables
OHCA score 0.51 (0.39–0.62)† ≥58 100 (89–100) 2 (0–11)‡ 100 (3–100) 40 (29–52)
EEG Synek classification 0.68 (0.55–0.78)† ≥5 100 (86–100) 2 (0–12)‡ 100 (3–100) 36 (25–49)
Qualitative Magnetic Resonance Imaging (MRI) variables
FLAIR-DWI overall score 0.79 (0.28–0.87)† >40 100 (89–100) 38 (24–54)‡ 100 (82–100) 50 (37–63)
FLAIR-DWI cortex score 0.71 (0.59–0.84)† ≥30 100 (89–100) 33 (20–49)‡ 100 (78–100) 51 (38–64)
FLAIR-DWI cortex + deep gray nuclei score 0.78 (0.68–0.88)† >40 100 (89–100) 36 (22–51)‡ 100 (79–100) 52 (38–65)
Quantitative MRI variables
Whole white matter FA 0.96 (0.89–0.99) <0.91 100 (89–100) 87 (74–94) 100 (91–100) 84 (68–94)
Whole brain FA 0.92 (0.84–0.97) <0.91 100 (89–100) 81 (67–91) 100 (91–100) 78 (62–89)
NAA/Cr Thalami 0.88 (0.77–0.95)† ≤0.90 100 (88–100) 37 (22–64)‡ 100 (77–100) 54 (40–68)
NAA/Cr Pons 0.76 (0.63–0.86)† ≤1.60 100 (83–100) 24 (11–40)‡ 100 (66–100) 41 (27–56)
Combination of (Multivariate models)
Motor response – OHCA score – EEG Synek classification 0.80 (0.70–0.90)† - 96 (80–99) 13 (5–27)‡ 86 (42–99) 38 (26–51)
Motor response – OHCA score – EEG Synek classification – qualitative MRI 0.82 (0.72–0.92)† - 100 (86–100) 39 (24–55)‡ 100 (80–100) 48 (34–62)
Motor response – OHCA score – EEG Synek classification – qualitative MRI – quantitative MRI 0.99 (0.97–1.00) - 100 (86–100) 95 (85–99) 100 (92–100) 93 (76–99)
ROCAUC denotes area under the receiver operating characteristic curve; DWI, Diffusion Weighted Imaging; FA, Fractional Anisotropy; FLAIR, Fluid-Attenuated Inversion Recovery and NAA/Cr, N-acetyl aspartate over creatinine ratios. Motor response indicates a motor response no better than extensor on MRI day. OHCA score calculation, FLAIR-DWI scoring system and EEG Synek classification are described in additional files 2, 3 and 4 of the Supplementary Appendix, respectively. † ROCAUC significantly different than the one of the WWM-FA (P<0.05). ‡ Sensitivity significantly different than the one of the WWM- FA (P<0.05).
27
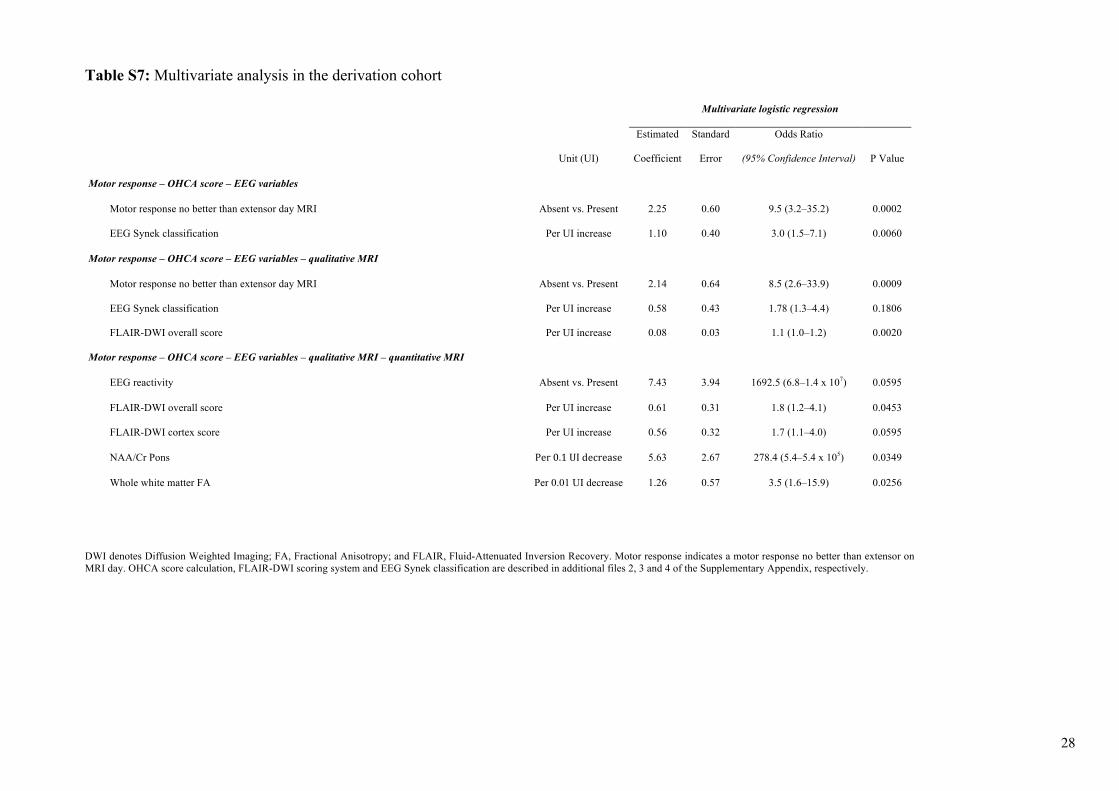
Table S7: Multivariate analysis in the derivation cohort
Multivariate logistic regression
Unit (UI)
Estimated
Coefficient
Standard
Error
Odds Ratio
(95% Confidence Interval) P Value
Motor response – OHCA score – EEG variables
Motor response no better than extensor day MRI Absent vs. Present 2.25 0.60 9.5 (3.2–35.2) 0.0002
EEG Synek classification Per UI increase 1.10 0.40 3.0 (1.5–7.1) 0.0060
Motor response – OHCA score – EEG variables – qualitative MRI
Motor response no better than extensor day MRI Absent vs. Present 2.14 0.64 8.5 (2.6–33.9) 0.0009
EEG Synek classification Per UI increase 0.58 0.43 1.78 (1.3–4.4) 0.1806
FLAIR-DWI overall score Per UI increase 0.08 0.03 1.1 (1.0–1.2) 0.0020
Motor response – OHCA score – EEG variables – qualitative MRI – quantitative MRI
EEG reactivity Absent vs. Present 7.43 3.94 1692.5 (6.8–1.4 x 10⁷) 0.0595
FLAIR-DWI overall score Per UI increase 0.61 0.31 1.8 (1.2–4.1) 0.0453
FLAIR-DWI cortex score Per UI increase 0.56 0.32 1.7 (1.1–4.0) 0.0595
NAA/Cr Pons Per0.1UIdecrease 5.63 2.67 278.4 (5.4–5.4 x 10⁵) 0.0349
Whole white matter FA Per 0.01 UI decrease 1.26 0.57 3.5 (1.6–15.9) 0.0256
DWI denotes Diffusion Weighted Imaging; FA, Fractional Anisotropy; and FLAIR, Fluid-Attenuated Inversion Recovery. Motor response indicates a motor response no better than extensor on MRI day. OHCA score calculation, FLAIR-DWI scoring system and EEG Synek classification are described in additional files 2, 3 and 4 of the Supplementary Appendix, respectively.
28
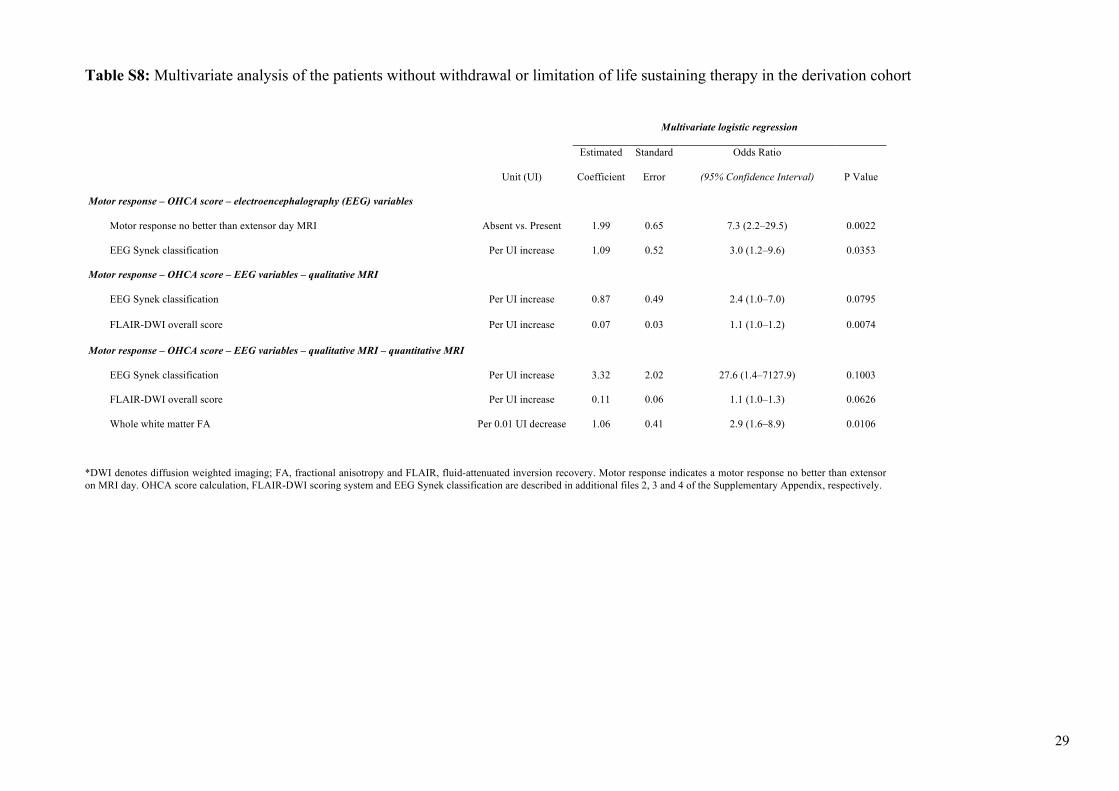
Table S8: Multivariate analysis of the patients without withdrawal or limitation of life sustaining therapy in the derivation cohort
Multivariate logistic regression
Unit (UI)
Estimated
Coefficient
Standard
Error
Odds Ratio
(95% Confidence Interval) P Value
Motor response – OHCA score – electroencephalography (EEG) variables
Motor response no better than extensor day MRI Absent vs. Present 1.99 0.65 7.3 (2.2–29.5) 0.0022
EEG Synek classification Per UI increase 1.09 0.52 3.0 (1.2–9.6) 0.0353
Motor response – OHCA score – EEG variables – qualitative MRI
EEG Synek classification Per UI increase 0.87 0.49 2.4 (1.0–7.0) 0.0795
FLAIR-DWI overall score Per UI increase 0.07 0.03 1.1 (1.0–1.2) 0.0074
Motor response – OHCA score – EEG variables – qualitative MRI – quantitative MRI
EEG Synek classification Per UI increase 3.32 2.02 27.6 (1.4–7127.9) 0.1003
FLAIR-DWI overall score Per UI increase 0.11 0.06 1.1 (1.0–1.3) 0.0626
Whole white matter FA Per 0.01 UI decrease 1.06 0.41 2.9 (1.6–8.9) 0.0106
*DWI denotes diffusion weighted imaging; FA, fractional anisotropy and FLAIR, fluid-attenuated inversion recovery. Motor response indicates a motor response no better than extensor on MRI day. OHCA score calculation, FLAIR-DWI scoring system and EEG Synek classification are described in additional files 2, 3 and 4 of the Supplementary Appendix, respectively.
29
30
SUPPLEMENTARY ADDITIONAL FILES
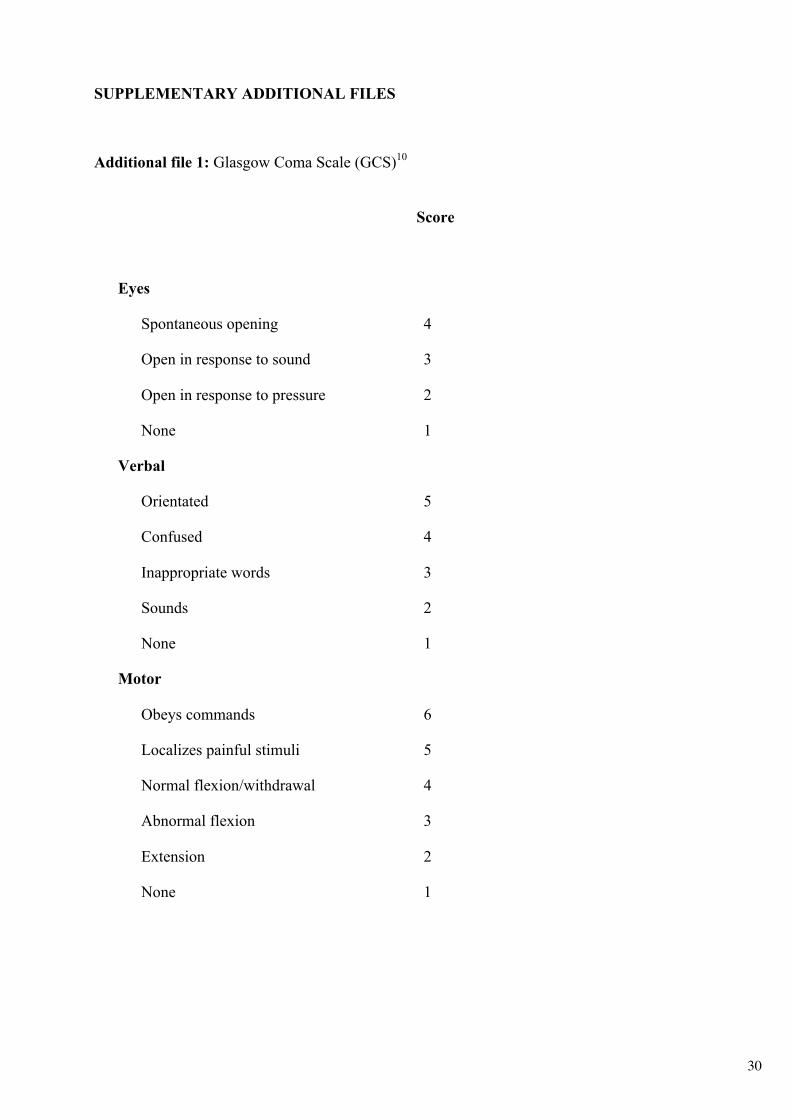
Additional file 1: Glasgow Coma Scale (GCS)10
Score
Eyes
Spontaneous opening 4
Open in response to sound 3
Open in response to pressure 2
None 1
Verbal
Orientated 5
Confused 4
Inappropriate words 3
Sounds 2
None 1
Motor
Obeys commands 6
Localizes painful stimuli 5
Normal flexion/withdrawal 4
Abnormal flexion 3
Extension 2
None 1
31
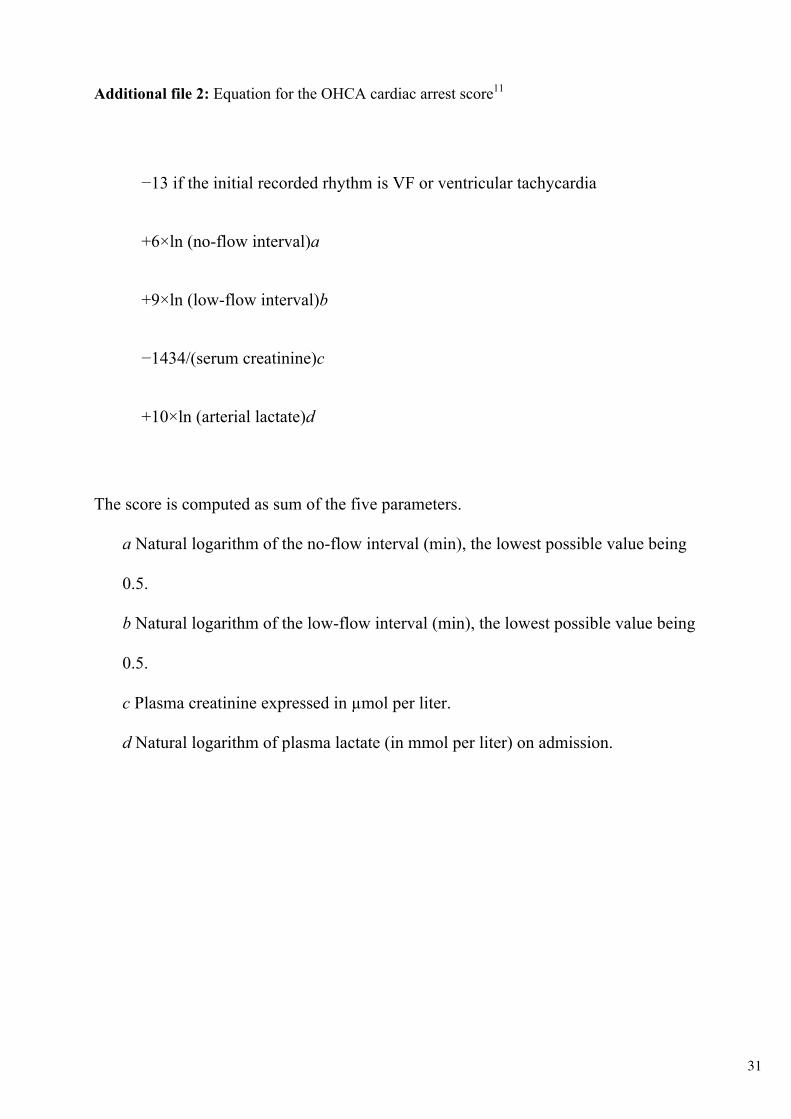
Additional file 2: Equation for the OHCA cardiac arrest score11
−13 if the initial recorded rhythm is VF or ventricular tachycardia
+6×ln (no-flow interval)a
+9×ln (low-flow interval)b
−1434/(serum creatinine)c
+10×ln (arterial lactate)d
The score is computed as sum of the five parameters.
a Natural logarithm of the no-flow interval (min), the lowest possible value being
0.5.
b Natural logarithm of the low-flow interval (min), the lowest possible value being
0.5.
c Plasma creatinine expressed in µmol per liter.
d Natural logarithm of plasma lactate (in mmol per liter) on admission.
32
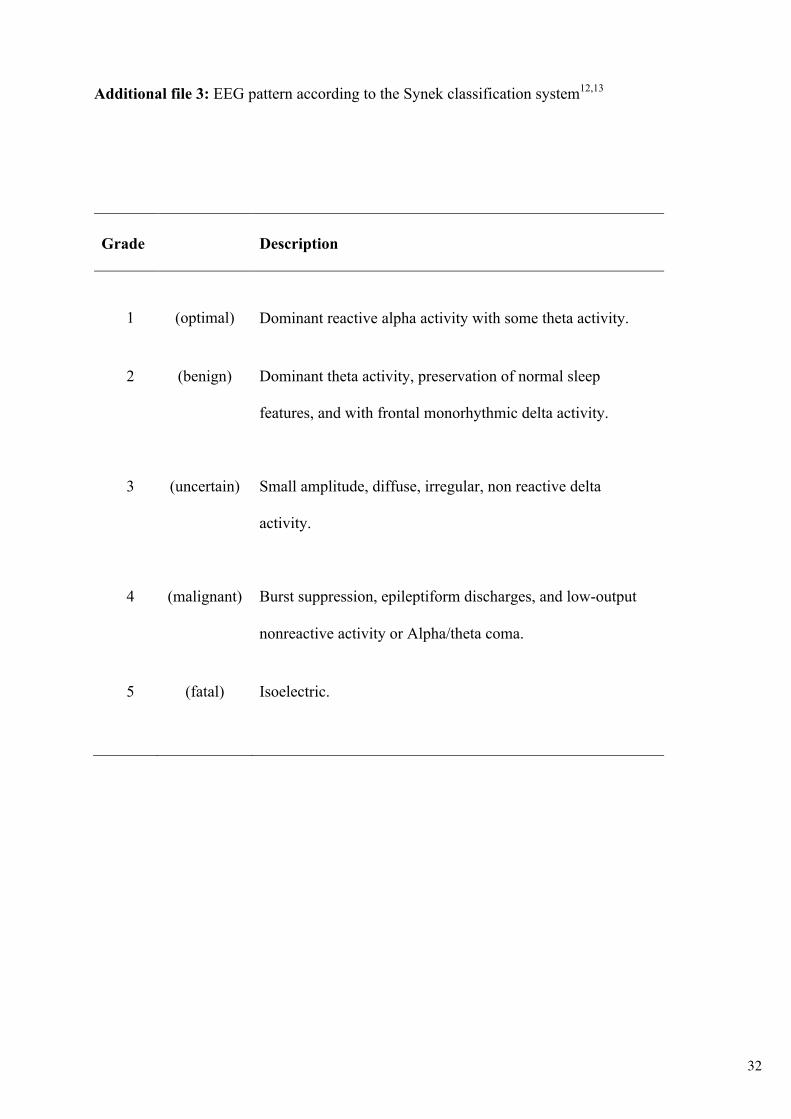
Additional file 3: EEG pattern according to the Synek classification system12,13
Grade Description
1 (optimal) Dominant reactive alpha activity with some theta activity.
2 (benign) Dominant theta activity, preservation of normal sleep
features, and with frontal monorhythmic delta activity.
3 (uncertain) Small amplitude, diffuse, irregular, non reactive delta
activity.
4 (malignant) Burst suppression, epileptiform discharges, and low-output
nonreactive activity or Alpha/theta coma.
5 (fatal) Isoelectric.

33
Additional file 4: Qualitative brain FLAIR and DWI MRI scoring system14
FLAIR DWI
signal signal Supratentorial
Gray matter Cortex Frontal
Parietal
Temporal
Occipital
Insula
Hippocampus
Deep gray nuclei Caudate
Putamen
Globus pallidus
Thalamus
White matter Frontal
Parietal
Temporal
Occipital Corpus Callosum Infratentorial Brainstem Midbrain
Pons
Medulla
Cerebellum Cortex
White matter Dentate nuclei Total
All 21 brain regions were scored using fluid-attenuated inversion recovery (FLAIR) and
diffusion-weighted imaging (DWI) sequences according to the severity of signal abnormality
on a 5-point scale:
0: no abnormality
1: possibly abnormal
2: mildly abnormal
3: moderately abnormal
4: severely abnormal
The overall score, used for analyses, consisted of all points given to all brain regions on FLAIR
and DWI.

34
Additional file 5: Glasgow-Pittsburgh Cerebral Performance Categories (CPC)15, 16
Score Description
1 (Good Cerebral
Performance)
Conscious. Alert, able to work and lead a normal life. May have minor
psychological or neurological deficits (mild dysphasia, non-
incapacitating hemiparesis, or minor cranial nerve abnormalities).
2 (Moderate
Cerebral
Disability)
Conscious. Sufficient cerebral function for part-time work in sheltered
environment or independent activities of daily life (dressing, traveling
by public transportation, and preparing food). May have hemiplegia,
seizures, ataxia, dysarthria, dysphasia, or permanent memory or mental
changes.
3 (Severe Cerebral
Disability)
Conscious. Dependent on others for daily support because of impaired
brain function (in an institution or at home with exceptional family
effort). At least limited cognition. Includes a wide range of cerebral
abnormalities from ambulatory with severe memory disturbance or
dementia precluding independent existence to paralytic and able to
communicate only with eyes, as in the locked-in syndrome.
4 (Coma,
Vegetative State)
Not conscious. Unaware of surroundings, no cognition. No verbal or
psychological interactions with environment.
5 (Death) Certified brain dead or dead by traditional criteria.
35
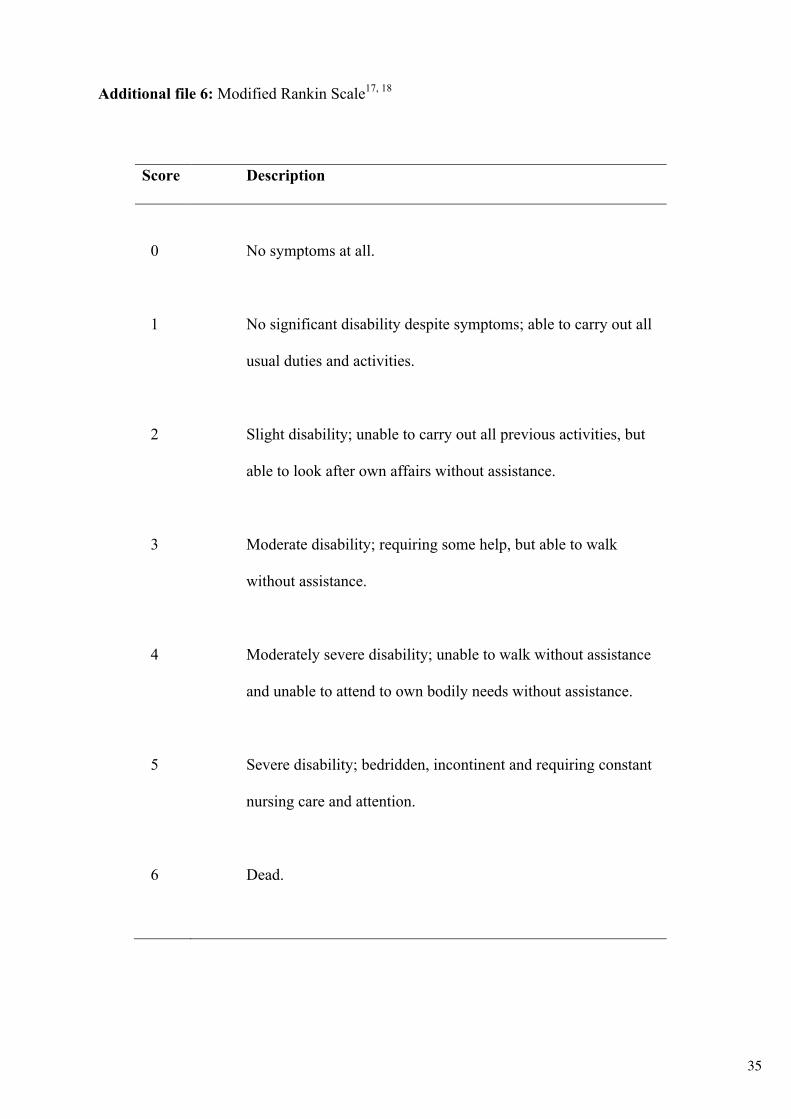
Additional file 6: Modified Rankin Scale17, 18
Score Description
0 No symptoms at all.
1 No significant disability despite symptoms; able to carry out all
usual duties and activities.
2 Slight disability; unable to carry out all previous activities, but
able to look after own affairs without assistance.
3 Moderate disability; requiring some help, but able to walk
without assistance.
4 Moderately severe disability; unable to walk without assistance
and unable to attend to own bodily needs without assistance.
5 Severe disability; bedridden, incontinent and requiring constant
nursing care and attention.
6 Dead.
36
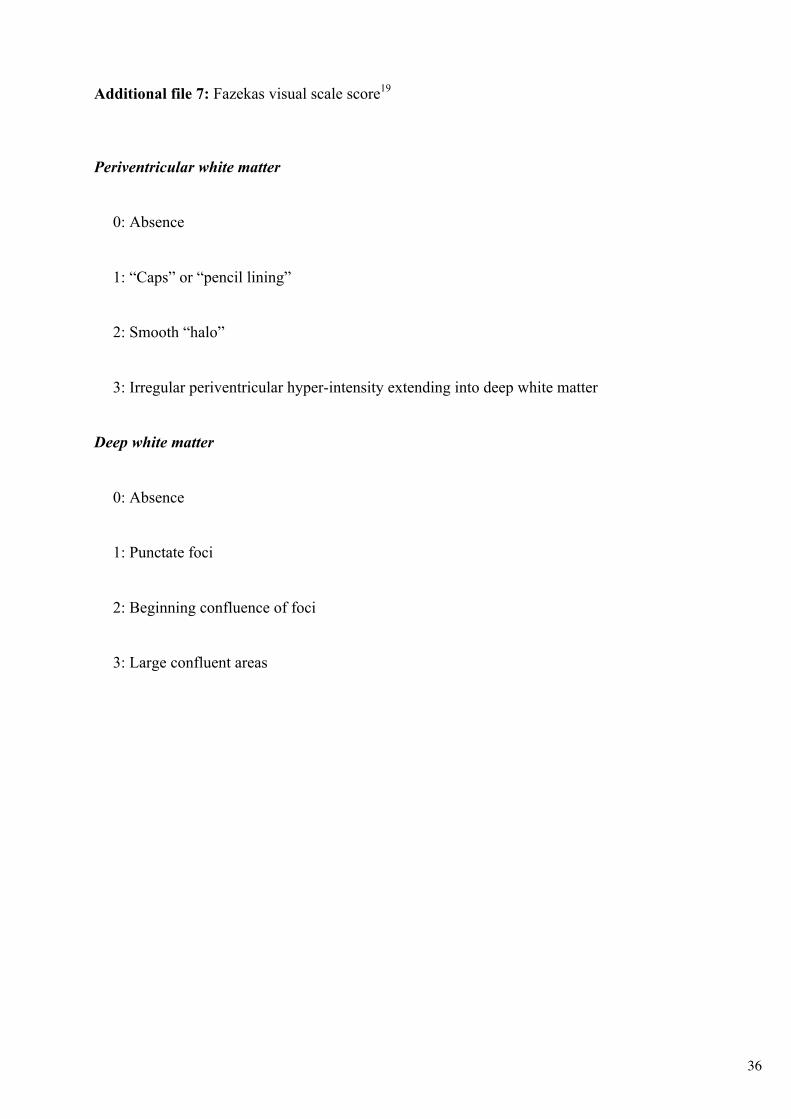
Additional file 7: Fazekas visual scale score19
Periventricular white matter
0: Absence
1: “Caps” or “pencil lining”
2: Smooth “halo”
3: Irregular periventricular hyper-intensity extending into deep white matter
Deep white matter
0: Absence
1: Punctate foci
2: Beginning confluence of foci
3: Large confluent areas
37
REFERENCES
1. Luyt CE, Galanaud D, Perlbarg V, et al. Diffusion tensor imaging to predict long-term outcome after cardiac arrest: a bicentric pilot study. Anesthesiology 2012; 117:1311-21.
2. van der Eerden AW, Khalilzadeh O, Perlbarg V, et al. White matter changes in comatose survivors of anoxic ischemic encephalopathy and traumatic brain injury: comparative diffusion-tensor imaging study. Radiology 2014; 270:506-16.
3. Smith SM, Zhang Y, Jenkinson M, et al. Accurate, robust, and automated longitudinal and cross-sectional brain change analysis. Neuroimage 2002; 17:479-89.
4. Basser PJ, Mattiello J, LeBihan D. Estimation of the effective self-diffusion tensor from the NMR spin echo. J Magn Reson B 1994;103:247-54.
5. Smith SM, Jenkinson M, Woolrich MW, et al. Advances in functional and structural MR image analysis and implementation as FSL. Neuroimage 2004; 23 Suppl 1:S208-S219.
6. Modat M, Ridgway GR, Taylor ZA, et al. Fast free-form deformation using graphics processing units. Comput Methods Programs Biomed 2010; 98:278-84.
7. Dale, A.M., Fischl, B., Sereno, M.I., Cortical surface-based analysis. I. Segmentation and surface reconstruction. Neuroimage 1999; 9:179-94.
8. Hosmer DW, Jr., Lemeshow S, Sturdivant RX. Applied Logistic Regression. 3rd Edition ed. Hoboken, NJ, USA: John Wiley & Sons; 2013.
9. Nolan JP, Soar J, Cariou A, et al. European Resuscitation Council and European Society of Intensive Care Medicine 2015 guidelines for post-resuscitation care. Intensive care medicine 2015; 41: 2039-56.
10. Teasdale G, Gentleman D. The description of 'conscious level': a case for the Glasgow Coma Scale. Scott Med J 1982; 27:7-9.
11. Adrie C, Cariou A, Mourvillier B, et al. Predicting survival with good neurological recovery at hospital admission after successful resuscitation of out-of-hospital cardiac arrest: the OHCA score. Eur Heart J 2006; 27:2840-5.
12. Synek VM. EEG abnormality grades and subdivisions of prognostic importance in traumatic and anoxic coma in adults. Clin Electroencephalogr 1988; 19:160-6.
13. Synek VM. Prognostically important EEG coma patterns in diffuse anoxic and traumatic encephalopathies in adults. J Clin Neurophysiol; 1988; 5:161-74.
14. Hirsch KG, Mlynash M, Jansen S, et al. Prognostic value of a qualitative brain MRI scoring system after cardiac arrest. J Neuroimaging 2015; 25:430-7.
15. Randomized clinical study of thiopental loading in comatose survivors of cardiac arrest. Brain Resuscitation Clinical Trial I Study Group. N Engl J Med 1986; 314:397-403.
16. Jennett B, Bond M. Assessment of outcome after severe brain damage. Lancet 1975; 1:480-4.
17. Rankin J. Cerebral vascular accidents in patients over the age of 60. II. Prognosis. Scott Med J 1957; 2:200-15.
18. van Swieten JC, Koudstaal PJ, Visser MC, Schouten HJ, van GJ. Interobserver agreement for the assessment of handicap in stroke patients. Stroke 1988; 19:604-7.
18. Fazekas F, Chawluk JB, Alavi A, Hurtig HI, Zimmerman RA. MR signal abnormalities at 1.5 T in Alzheimer's dementia and normal aging. AJR Am J Roentgenol 1987; 149:351-6.