supplementary online content - jama · supplementary online content angermann ce, gelbrich g,...
TRANSCRIPT

© 2016 American Medical Association. All rights reserved.
Supplementary Online Content
Angermann CE, Gelbrich G, Störk S, et al; for the MOOD-HF Investigators and Committee Members. Effect of escitalopram on all-cause mortality and hospitalization in patients with heart failure and depression: the MOOD-HF randomized clinical trial. JAMA. doi:10.1001/jama.2016.7635
MOOD-HF Investigators and Committee Members eMethods eFigure 1. Study flow of the MOOD-HF trial eFigure 2. Subgroup analysis for the primary endpoint eFigure 3. Analysis of primary endpoint by changes in MADRS sum-score eFigure 4. Risk of primary endpoint event by baseline MADRS sum-score eFigure 5. Incident primary endpoint events by baseline MADRS sum-score eTable 1. Disposition and characteristics of patients qualifying for the SCID eTable 2. Change from baseline in depression, anxiety, symptoms, functional status and quality of life eTable 3. Escitalopram serum levels eTable 4. Heart failure medication after up-titration eTable 5. Changes in heart failure severity and cardiac status eTable 6. Study participation, discontinuation of study medication, open-label antidepressant use and unscheduled psychiatric consultations eTable 7. Changes in safety parameters eTable 8. Serious adverse events eAcknowledgments eReferences
This supplementary material has been provided by the authors to give readers additional information about their work.
Downloaded From: on 06/01/2018

© 2016 American Medical Association. All rights reserved.
MOOD-HF Investigators and Committee Members The following 16 centers and cardiology and psychiatric or psychosomatic investigators participated in the MOOD-HF trial (listed in descending order according to number of enrolled patients beginning with the highest recruiting center, and by internal center number for centers with equal enrollment): INVESTIGATORS 1. University of Würzburg, Würzburg, Germany. Comprehensive Heart Failure Center and
Department of Medicine I, Cardiology: Angermann CE, Ertl G, Störk S, Schupfner E. Psychiatry/Psychosomatic Medicine: Deckert J, Faller H, Hamann B, Richard M, Warrings B.
2. University of Leipzig, Leipzig, Germany. Heart Center, Cardiology: Gunold H, Jozwiak-Nozdrzykowska J, Ulrich S. Psychiatry/Psychosomatic Medicine (HELIOS Park Hospital Leipzig): Bienert J, Kraus O.
3. University of Göttingen, Göttingen, Germany and German Center for Cardiovascular Research (DZHK), Partner Site Göttingen. Cardiology: Edelmann F, Wachter R, Linn B. Psychosomatic Medicine: Herrmann-Lingen C, Bosbach A.
4. University Hospital Lübeck, Lübeck, Germany. Cardiology: Graf T, Baulmann J, Schunkert H. Psychiatry/Psychosomatic Medicine: Jantschek G, Jantschek I.
5. Saarland University Hospital, Homburg/Saar, Germany. Cardiology: Kindermann I, Böhm M. Psychosomatic Medicine: Bunz M, Lenski D.
6. University of Heidelberg, Site Mannheim, Germany. Cardiology: Haass M, Walter S, Hagloch-Mitzkewitsch K. Psychiatry (Central Institute of Mental Health, Mannheim): Lederbogen F.
7. University Heart Center Hamburg, Hamburg, Germany. Cardiology: Costard-Jaeckle A, Müllerleile K, Meyer S, Blankenberg S. Psychosomatic Medicine: Ziegler K.
8. University Hospital Giessen and Marburg, Marburg, Germany. Cardiology: Pankuweit S, Richter A, Maisch B. Psychosomatic Medicine: Kolb-Niemann B.
9. University Hospital Magdeburg, Magdeburg, Germany. Cardiology: Braun-Dullaeus R, Wenzel D, Förster A. Psychiatry: Walter M.
10. University of Bonn, Bonn, Germany. Cardiology: Werner N, Twelker K, Mittmann-Braun, E. Psychiatry/Medical Psychology: Bewersdorff M, Hurlemann R.
11. Kerckhoff-Klinik Forschungsgesellschaft mbH, Bad Nauheim, Germany. Cardiology: Mitrovic V, Peregrinova L, Peil A. Psychosomatic Medicine: Jordan J.
12. University Hospital Essen, West German Heart and Angiology Center Essen, Germany. Department of Cardiology: Erbel R. Psychosomatic Medicine: Yesim E.
13. Paracelsus Medical Private University, Nürnberg, Germany. Cardiology: Pauschinger M, Scheffler, U. Psychosomatic Medicine: Söllner, W.
14. University Hospital Rostock, Rostock, Germany. Cardiology: Rauchhaus M. Psychosomatic Medicine/Psychology: Vogel M.
15. Hannover Medical School, Hannover, Germany. Cardiology: Schieffer B, Bavendiek U. Psychiatry: Kahl KG.
16. University of Düsseldorf, Düsseldorf, Germany. Cardiology: Westenfeld R. Psychosomatic Medicine: Karger A.
COMMITTEES Steering Committee: Angermann CE, Würzburg, Germany (Principal Investigator); Böhm M, Homburg/Saar, Germany (Co-Chair); Deckert J, Würzburg, Germany; Ertl G, Würzburg, Germany (Co-Chair); Faller H, Würzburg, Germany; Gelbrich G, Würzburg, Germany (formerly: Leipzig, Germany); Maisch B, Marburg, Germany: Pieske B, Berlin, Germany (formerly: Graz, Austria and Göttingen, Germany); Schunkert H, München, Germany (formerly: Lübeck, Germany). Data and Safety Monitoring Committee: Breithardt G, Münster, Germany; Gottwik M, Nürnberg, Germany (Chair); Hense HW, Münster, Germany; Laederach K, Bern, Switzerland; Löwe B, Hamburg, Germany. Independent Endpoint Adjudication Committee: Erdmann E, Köln, Germany (Chair); Hombach V, Ulm, Germany; Meinertz T, Hamburg, Germany.
Downloaded From: on 06/01/2018

© 2016 American Medical Association. All rights reserved.
CORE LABORATORIES Psychiatric Core Laboratory: Deckert J, Würzburg, Germany (Chair); Faller H, Glatter N, Hamann B, Richard M, Warrings B (all Würzburg, Germany). Therapeutic Drug Monitoring Laboratory, Department of Psychiatry, Psychosomatics and Psychotherapy, University Hospital of Würzburg (Escitalopram levels): Unterecker S, Deckert J, Würzburg, Germany. BIOMETRY AND STATISTICS Gelbrich G, Würzburg, Germany. TRIAL COORDINATION AND MANAGEMENT Clinical Trial Center Leipzig, University of Leipzig, Leipzig, Germany: Prettin C. Comprehensive Heart Failure Center, University and University Hospital Würzburg, Würzburg, Germany: Hanke M, Sauer J.
Downloaded From: on 06/01/2018
© 2016 American Medical Association. All rights reserved.
eMETHODS
Funding and organization The MOOD-HF trial was funded by the German Federal Ministry of Education and Research (BMBF), grant 01 KG0702; Competence Network Heart Failure Germany (BMBF grants 01GI0205 / 01GI1202A), and by the Comprehensive Heart Failure Center Würzburg (BMBF grant 01EO1004). Additional financial support for patient recruitment and the study drug were provided by H. Lundbeck A/S, Denmark. The study database was administered by the Clinical Trial Center at Leipzig University.
A psychiatric core laboratory was responsible for patient safety and for centralized training in the standardized application of all psychometric instruments employed during the study. Prior to participating in MOOD-HF, all psychiatrists and psychosomatic specialists underwent standardized Structured Clinical Interview (SCID) training and all cardiologists underwent standardized Montgomery–Åsberg Depression Rating Scale (MADRS) training at the MOOD-HF psychiatric core laboratory. Furthermore, specialized nurses received centralized standardized training in the monitoring of depressive symptoms by telephone (especially the discrimination between suicidal ideation and mere tiredness of life) and in the supervision of cardiac status, up-titration of heart failure medications (in collaboration with the patients’ cardiologist and primary care physician) and patient empowerment. Study results were analyzed at the Institute of Clinical Epidemiology and Biometry of Würzburg University, Würzburg, Germany.
Inclusion and exclusion criteria Patients were eligible for inclusion in the MOOD-HF trial if they met all of the following inclusion criteria: Age ≥18 years. Chronic systolic heart failure of any etiology (current New York Heart Association [NYHA] class II-IV)
and at least one left ventricular ejection fraction (LVEF) measurement of less than 45% obtained by echocardiography, levocardiography or cardiac magnet resonance imaging within the preceding three months.
Diagnostic and Statistical Manual of Mental Disorders-IV diagnosis of current major depression based on the Structured Clinical Interview for DSM-IV performed by a certified psychiatric/psychosomatic specialist.
Provision of written informed consent. Patients with any of the following were excluded from the MOOD-HF trial: Recent history of acute myocardial infarction (<3 months). Acute cardiac decompensation. Recent (<3 months) or planned major cardiac surgery (<12 months). Advanced renal failure (Modification of Diet in Renal Disease [MDRD] <30 mL/min/1.73m²). Moderate or severe hepatic insufficiency (plasma level of serum transaminases more than three times
the upper limit of normal) or manifest hepatic failure. Thyrotoxicosis. Other medical contraindications to treatment with selective serotonin re-uptake inhibitors (SSRIs). Significantly reduced life expectancy due to other comorbidity (e.g. malignancy). Use of any antidepressants including SSRIs, lithium or anticonvulsants for mood disorder in adequate
dosage (according to evidence-based recommendations for clinical effectiveness), with sufficiently long duration (at least 8 weeks) of antidepressant treatment and positive clinical outcome*.
Currently undergoing any form of psychotherapy. Absence of response to a previous adequate trial of escitalopram treatment. Lifetime history of early termination (<8 weeks) of escitalopram treatment because of adverse events or
side effects. Lifetime history of early termination (<8 weeks) of other SSRI (e.g. sertraline, citalopram) treatment
because of adverse events or side effects. Bipolar affective disorder documented by Structured Clinical Interview (SCID).
Downloaded From: on 06/01/2018

© 2016 American Medical Association. All rights reserved.
Severe depressive episode with psychotic features. Evidence of substance abuse or dependency during the previous 12 months. Moderate or severe dementia (Mini-Mental State Examination [MMSE] score <18). Serious risk of imminent suicide based on clinical judgment. Participation in another clinical trial. Inability to comply with nine-item Patient Health Questionnaire (PHQ-9) and/or SCID testing and/or
telephone monitoring for mental or linguistic reasons or lack of access to a telephone. Pregnancy or nursing period. Women of child-bearing potential without effective contraception during the trial. Expected low compliance with the visit schedule or telephone monitoring (e.g. due to comorbidity or
travel distance to the trial site). Patients with normal ventricular activation (no bundle branch block [total or incomplete], no other
intraventricular conduction delay, and no pacemaker) and known QTc** prolongation ≥500 msec or known long QT syndrome***
Current treatment with drugs inducing QT prolongation, such as class IA and class III antiarrhythmic drugs, anti-psychotics, and tricyclic antidepressants.
*Patients already on antidepressants were assessed carefully because the “use of any antidepressants” was only an exclusion criterion in cases who (a) followed a treatment regimen initiated by a psychiatrist, and (b) who had been receiving an antidepressant(s) for at least 8 weeks and at sufficient dosages (according to evidence-based recommendations for clinical effectiveness) to justify anticipation of a beneficial clinical effect. It is not uncommon that patients receive antidepressants for a prolonged period of time, but continue to show depressive symptoms even at adequate drug dosages. Non-response to treatment might be the result of insufficient dosage, lack of response to the antidepressant or lack of adequate psychiatric care. For example, a patient with symptomatic heart failure received 20 mg/day amitriptyline over a period of two years. No clinical benefit was observed. The patient had never been seen by a psychiatrist. When evaluated for MOOD-HF the patient scored >11 on the PHQ-9 assessment. In this case the dosage of the tricyclic antidepressant amitriptyline could not be increased because of potential cardiotoxicity, and the under-dosed, ineffective amitriptyline therapy could be stopped. Under these circumstances, “use of any antidepressants” did no longer represent an exclusion criterion. This patient could be included in MOOD-HF, and receive optimal heart failure therapy plus potentially effective antidepressant treatment. In unclear cases, a member of the Psychiatric Core Lab needed to be contacted before a patient was denied study participation or open-label antidepressant therapy was started. **QTc is defined as QT interval/square root RR interval (QTc = QT-time/√RR-Interval) according to Bazett. ***Patients with prolonged QRS duration due to bundle branch block or other intraventricular conduction delay or with a pacemaker could be enrolled into MOOD-HF with QTc intervals >500 msec. Randomization and stratification Randomization was 1:1 to either escitalopram or placebo. The randomization routine used Pocock’s minimization algorithm.1 Stratification was performed for the following factors: Gender (male/female) Age (<70 years versus ≥70 years) Severity of depression (PHQ score ≤16 versus >16). Time elapsed since the last hospital discharge (≤4 weeks versus >4 weeks). Sample size calculation According to a previous study,2 and based on data available to the authors in the frame of the Competence Network Heart Failure3 from recently completed or ongoing clinical studies at the time MOOD-HF was designed, a 45% annual event rate for the composite endpoint of morbidity and mortality was assumed during the natural clinical course in our target population, which we expected to consist of a heterogeneous sample of patients with chronic heart failure, with or without recent previous hospitalization for heart failure.
Downloaded From: on 06/01/2018

© 2016 American Medical Association. All rights reserved.
We pragmatically assumed a 20% relative reduction of the composite primary outcome by study participation per se (due to enhanced heart failure care leading to optimization of heart failure therapy and improved medication adherence). Thus, in the placebo group the expected event rate was 36%. Given that the event rate in depressed versus non-depressed patients has been reported to be >2-fold higher,2,4,5 it was estimated that 18% of primary endpoint events could potentially be attributable to depression. We assumed that escitalopram might (by reducing depression) reduce the annual depression-related event rate by 50% in the intervention group, assuming that at least half of all patients would respond to the treatment. Observation periods for the first and last patients were planned to be 24 and 12 months, respectively. The annual dropout rate was assumed to be 15%. Thus, the assumption for effect size was a cumulative event rate of 27% in the escitalopram group versus 36% in the placebo group, corresponding to a hazard ratio of ln(0.73)/ln(0.64) = 0.705. Accordingly, setting the type I error level at 5% and the power to detect a difference in event rates at 80%, a total of [2 x (1.96+0.84)/ln(0.705)] 2 = 257 endpoint events confirmed by the independent endpoint committee were needed. A sample size of 700 patients (350 per study arm) was assumed to be sufficient to provide this number of primary outcome events (all-cause death or all-cause hospitalization with the exception of pre-planned hospital admission for non-cardiac reasons). After recruitment of 240 patients who, by January 31, 2012, had spent 138 patient-years at risk and under observation in the study, a total of 115 primary outcome events had been recorded, and the Kaplan-Meier estimate of the overall annual event rate amounted to 60% (higher than the anticipated average event rate of 31.5%). Taking into account the remaining time under observation and the dropout rate for patients already recruited, it could be expected that these patients would contribute another 55 events. In accordance with the assumption (based on the rates observed so far) that 50% of newly recruited patients observed for 12 months would contribute a primary outcome event, we calculated that another 174 patients would be sufficient to achieve the remaining 87 events required to complete the MOOD-HF trial.
No interim analysis was carried out for this recalculation of sample size, which was solely based on the total number of events regardless of group assignment. No changes were applied to the effect size in terms of hazard ratio or statistical power. The only change was the switch to an event-driven design including a correction of the anticipated patient number. The following revised stopping rules were defined and included in the study protocol by protocol
amendment of 6 August 2012: The study duration will be event-driven. The target is to achieve 257 adjudicated primary
outcome events. Recruitment of 414 patients is planned at this time. However, calculation will be updated every 3
months and immediately before termination of recruitment. Based on the observed total number of primary outcome events the Steering Committee will
decide to terminate recruitment when the anticipated number of events after observation of the last patient for 12 months is at least 257.
The preceding rule that 700 patients need to be recruited in the MOOD-HF trial is herewith obsolete.
The last patient will be observed for 12 months. If the target of 257 events is not reached by this time, observation will continued until 257 events have occurred, but no longer than 24 months per patient.
When 257 events have occurred, the final visit will be scheduled within 2 weeks for all patients still under observation.
Echocardiography Serial echocardiographic imaging was accomplished within the frame of routine patient care in all trial centers, but examinations followed a pre-specified acquisition protocol, and were performed by experienced technicians based on recommendations of the American Society and the European Association of Echocardiography. Echo technicians were unaware of patients’ randomization status. The left ventricular end-diastolic diameter was measured perpendicularly to the main axis of the left ventricular chamber at the mitral chordae level in the parasternal long axis view.6 The LVEF was derived from apical two- and four-chamber views using Simpson’s biplane or single plane method.7 Particular care was taken to precisely reproduce the cross sections in serial examinations, on which previous assessments were based, and to always use the same method for the measurements.
Downloaded From: on 06/01/2018
© 2016 American Medical Association. All rights reserved.
PHQ-9 screening cut-off values Various cut-off values are being used in the literature. We initially chose the cut-off of >11, because own research ongoing at that time had demonstrated that, even after multivariable adjustment, this sum-score is associated with impaired survival in patients with heart failure (in contrast with values ranging from 9 to 11).8 For that research, we had based our decision for this cut-off based on a publication of Löwe et al, who recommended a cut-off of ≥12 because in their work it yielded “a balanced trade-off between sensitivity and specificity", achieving the highest Youden Index (sensitivity + specificity - 1).9 Several authors, e.g. Kendrick et al,10 found better diagnostic performance using cut-off values of 11 and 12 compared with the more commonly used value of 10, thus confirming the appropriateness of our choice. We changed to the cut-off value of 9 because, despite intensive efforts, our screening and, in particular, recruitment rates remained relatively low and we wanted to increase the number of patients undergoing SCID. Meta-analysis demonstrated more recently that that the PHQ-9 has acceptable diagnostic properties at a range of cut-off scores (i.e. from 8 to 11), with no significant differences in sensitivity or specificity at a cut-off value of 10 compared with other cut-off scores within the 8–11 range.11 Determination of escitalopram serum levels Escitalopram serum concentrations were determined by analysis of serial biomaterial samples. Samples were collected in the morning before the first study drug intake to measure trough levels. Serum was obtained by centrifugation at 1,800G for 10 minutes, and immediately stored at –80oC for later analysis. After database closure, all serial serum samples from escitalopram-treated patients were analyzed for determination of serum escitalopram concentrations using an isocratic reversed-phase high performance liquid chromatography (HPLC) method with UV-absorbance detection in the therapeutic drug monitoring laboratory of the Department of Psychiatry, Psychosomatics and Psychotherapy, University Hospital of Würzburg. Adsorption of the drug on the extraction column (MZ-PerfectBond CN 20µm, MZ-Analysentechnik, Mainz, Germany) was followed by purification by solid phase extraction and subsequent chromatographic separation on the analytical column (MN-EC 150/4.6 Nucleodur 100-3 CN-RP Macherey-Nagel, Düren, Germany). The laboratory participates in a quality control program (Cardiff Bioanalytical Services, The Cardiff Medic Center, Cardiff, UK) with external control samples being analyzed monthly. Using this methodology, accuracy, precision and limits of quantification were 5.0%, 4.8% and 6.3-316 ng/mL, respectively, and the therapeutic range was 15-80 ng/mL.12
Downloaded From: on 06/01/2018

© 2016 American Medical Association. All rights reserved.
eFigure 1. Study Flow of the MOOD-HF Trial
Abbreviations: PHQ-9, Nine-item Patient Health Questionnaire for self-assessment of depression;5 SCID, Structured Clinical Interview;6 QoL, health-related quality of life as assessed with the Kansas City Cardiomyopathy Questionnaire;7 GAD-7, Seven-item self-assessment Generalized Anxiety Disorder Questionnaire;8 MADRS, Ten-item Montgomery-Åsberg Depression Rating Scale for assessment of depression;9 MMSE, Mini-Mental State Examination for assessment of cognitive function;10
Downloaded From: on 06/01/2018

© 2016 American Medical Association. All rights reserved.
eFigure 2. Subgroup analysis for the primary endpoint (all-cause death or all-cause hospitalization)
Subgroups are based on median values for patient baseline demographic and clinical characteristics (exploratory analysis). Shown are hazard ratios (HRs) and 95% confidence intervals (CIs) for the primary composite outcome (time to all-cause death or all-cause hospitalization) in patient subgroups. For each variable, the number of patients receiving escitalopram (E) and placebo (P) and the P-values for interaction are displayed. For each test, the binary subgroup variable and the subgroup-by-treatment interaction term were added to the Cox model used in primary analysis. Subgroup hazard ratios are reported from these models where the respective subgroup category was the reference category in the model. P-values for the interaction terms refer to null hypothesis of equal hazard ratios in the subgroups. Abbreviations: CI, confidence interval; E, escitalopram; GAD-7, seven-item Generalized Anxiety Disorder Questionnaire; P, placebo; PHQ, Patient Health Questionnaire.
Downloaded From: on 06/01/2018

© 2016 American Medical Association. All rights reserved.
eFigure 3. Analysis of the primary endpoint (all-cause death and hospitalization), according to changes in the Ten-item Montgomery-Åsberg Depression Rating Scale (MADRS) sum-score observed at 6 weeks after study enrollment (exploratory analysis)
Left panel: Patients with remission/marked improvement; Right panel: patients with no/small improvement. For the purpose of this analysis, “Remission/marked improvement” in depression was defined as a MADRS sum-score of ≤12 or a decrease in the MADRS sum-score of ≥10 points; 86 patients in the escitalopram group and 68 in the placebo group were included in this category. Patients not fulfilling these criteria (48 in the escitalopram group and 56 in the placebo group) were allocated to the “no/small improvement group”. No significant treatment effects with escitalopram vs. placebo were found in either subgroup (see HRs displayed in the figure panels). In Cox regression with the two factors “treatment” and “6-week change in depression” and their interaction, the interaction term was not significant (which means that the hazard ratios shown in both panels of the figure were not significantly different from each other). In Cox regression with two factors without interaction, hazard ratio values (95% confidence interval [CI]) were 1.23 (0.90-1.70), p=0.20 for escitalopram versus placebo and 1.18 (0.86-1.62), p=0.32 for the remission/marked improvement group versus the no/small improvement group. Patients reaching an endpoint or dropping out before the 6-week assessment (46 patients in the escitalopram group and 55 in the placebo group) or not undergoing MADRS at 6 weeks (5 escitalopram recipients and 8 placebo recipients) were not included in this analysis.
Downloaded From: on 06/01/2018
© 2016 American Medical Association. All rights reserved.
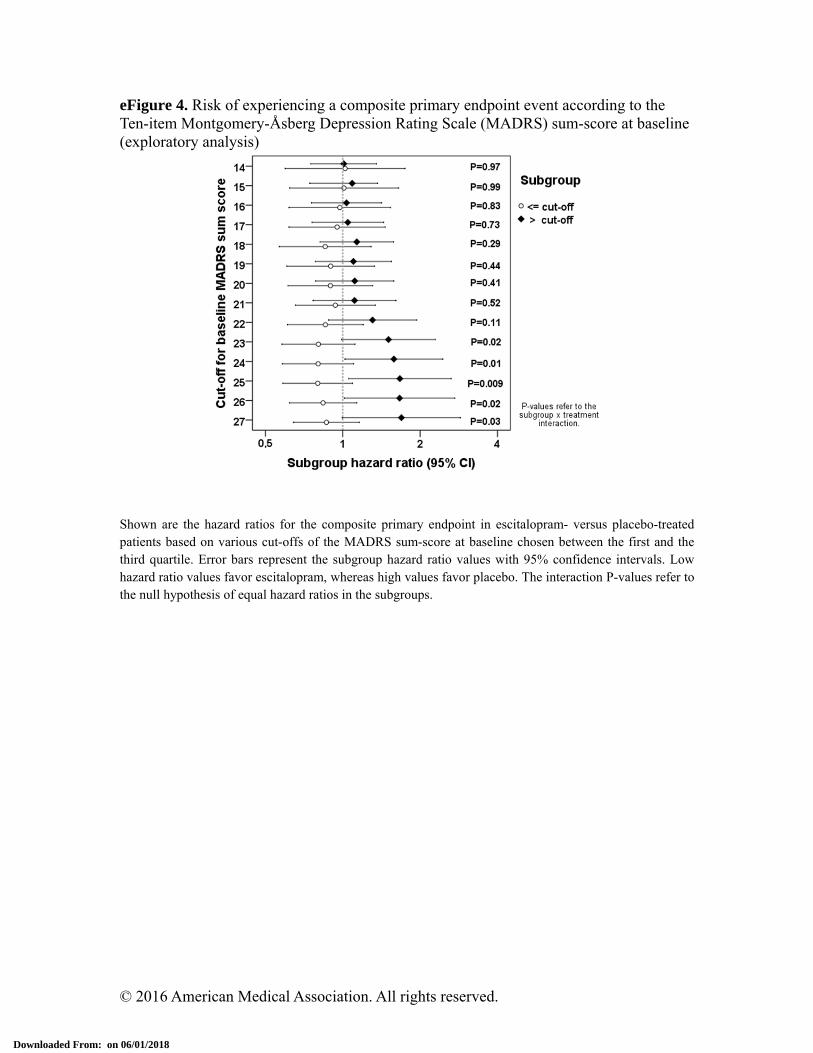
eFigure 4. Risk of experiencing a composite primary endpoint event according to the Ten-item Montgomery-Åsberg Depression Rating Scale (MADRS) sum-score at baseline (exploratory analysis)
Shown are the hazard ratios for the composite primary endpoint in escitalopram- versus placebo-treated patients based on various cut-offs of the MADRS sum-score at baseline chosen between the first and the third quartile. Error bars represent the subgroup hazard ratio values with 95% confidence intervals. Low hazard ratio values favor escitalopram, whereas high values favor placebo. The interaction P-values refer to the null hypothesis of equal hazard ratios in the subgroups.
Downloaded From: on 06/01/2018

© 2016 American Medical Association. All rights reserved.
eFigure 5. Incident primary endpoint events according to Ten-item Montgomery-Åsberg Depression Rating Scale (MADRS) sum-score at baseline, choosing the MADRS cut-off value with the strongest interaction term according to the analysis depicted in eFigure 4 (exploratory analysis)
Shown are Kaplan-Meier curves for the incidence of the primary composite endpoint (all-cause death or all-cause hospitalization) with a baseline MADRS sum-score of ≤25 (left panel, 69% of total study population) versus >25 (right panel, 31% of total study population) in escitalopram- versus placebo-treated groups.
Downloaded From: on 06/01/2018

© 2016 American Medical Association. All rights reserved.
eTable 1. Disposition and Characteristics of Patients who Qualified for the SCID*
Variable SCID not performed
SCID negative
SCID positive, not included
Included in trial
P-value
Number of patients 2100 265 132 376 –
Screening data available† 2100 240 120 346 –
Female sex – no. (%) 506 (24) 47 (20) 35 (30) 84 (25) 0.18
Age, years – mean (SD) 67 (13) 64 (12) 63 (14) 62 (12) <0.001
NYHA class III-IV – no. (%) 1244 (62) 131 (58) 76 (65) 176 (55) 0.09
History of depression – no. (%) 175 (8) 31 (13) 25 (21) 44 (13) <0.001
PHQ-9 sum-score –mean (SD) 13.1 (4.1) 12.6 (3.8) 14.8 (4.8) 14.1 (4.1) <0.001
Repeat screening** – no. (%) 281 (13) 47 (20) 30 (25) 66 (19) <0.001 Abbreviations: NYHA, New York Heart Association; PHQ-9, Nine-item Patient Health Questionnaire; SCID, Structured Clinical Interview; SD, standard deviation. *n=2873 patients who qualified for the SCID based on PHQ-9 screening results. There were 2100 patients (PHQ-9 sum score 9-11/12 points: n=693/1407) who did not undergo SCID, and n=773 patients (PHQ-9 sum score 9-11/12 points: n=201/572), who underwent SCID. †This table displays data obtained when patients underwent PHQ-9 screening, and documented on the PHQ-9 form. Ethics Committees approved analysis of this screening information (age, sex, NYHA class, history of depression and PHQ-9 sum-score) without informed consent of the patients but requested that their identity be untraceable. Therefore, monitoring of these data was not permitted, and the screening data of 67 (9%) of the patients, who underwent the SCID interview, could not be matched to the SCID results. For the same reason, we did not record whether patients did not undergo SCID because of exclusion criteria, or because they refused the SCID or participation in the study. **Attendees at heart failure outpatient clinics not qualifying for SCID on a first PHQ-9 screening were eligible for repeat evaluation during a later routine follow-up visit.
Downloaded From: on 06/01/2018

© 2016 American Medical Association. All rights reserved.
eTable 2. Changes From Baseline in Depressive Symptoms, Anxiety, Symptom Burden, Functional Status and Health-Related Quality of Life in Escitalopram- versus Placebo-Treated Patients Over 12 Months’ Treatment 6 Months 12 Months
Escitalopram – change from
baseline (95% CI)
Placebo – change from
baseline (95% CI)
ANCOVA difference E–P
(95% CI)
P-value Escitalopram – change from
baseline (95% CI)
Placebo – change from
baseline (95% CI)
ANCOVA difference E–P
(95% CI)
P-value
PHQ-9 Sum-Score*
(n=140) –3.3 (–4.1, –2.4)
(n=144) –3.3 (–4.1, –
2.5)
–0.1 (–1.2, 0.9)
0.83
(n=109) –3.5 (–4.5, –2.4)
(n=119) –3.3 (–4.3, –
2.3)
–0.2 (–1.4, 1.0)
0.75
KCCQ§ Symptoms Score
(n=140) 5.9 (2.9, 8.9)
(n=144) 6.1 (3.1, 9.1)
0.6 (–3.2, 4.5)
0.74
(n=106) 2.4 (–1.4, 6.2)
(n=120) 8.9 (5.6, 12.3)
–5.8 (–10.4, –
1.2)
0.01
KCCQ Clinical Summary Score
(n=140) 5.9 (3.0, 8.7)
(n=144) 5.5 (2.8, 8.2)
0.9 (–2.8, 4.6)
0.63
(n=106) 3.1 (–0.3, 6.5)
(n=120) 7.9 (4.7, 11.0)
–4.0 (–8.5, 0.4)
0.07
KCCQ Overall Summary Score
(n=140) 10.9 (8.0, 13.8)
(n=144) 9.5 (6.6, 12.4)
1.9 (–1.8, 5.7)
0.31
(n=106) 8.6 (5.0, 12.2)
(n=120) 12.7 (9.3, 16.1)
–3.2 (–7.9, 1.5)
0.18
GAD-7† Sum-Score
(n=141) –4.3 (–5.4, –3.3)
(n=142) –4.2 (–5.3, –
3.1)
–0.4 (–1.7, 0.9)
0.53
(n=107) –5.0 (–6.3, –3.7)
(n=120) –4.9 (–6.1, –
3.7)
–0.7 (–2.1, 0.7)
0.33
MMSE# Sum-Score
(n=138) 0.2 (–0.2, 0.5)
(n=142) –0.6 (–1.4, 0.2)
0.6 (–0.3, 1.4)
0.18
(n=106) 0.4 (0.0, 0.9)
(n=120) 0.0 (–0.6, 0.7)
0.4 (–0.3, 1.1)
0.26
Abbreviations: ANCOVA, analysis of covariance; CI, confidence interval; E, escitalopram; KCCQ, Kansas City Cardiomyopathy Questionnaire; PHQ-9, Nine-item Patient Health Questionnaire; P, placebo; GAD-7, seven-item Generalized Anxiety Disorder Questionnaire. *Each item of the PHQ-9 yields a score of 0-3 resulting in an overall score from 0-27, with higher values indicating more severe depression. Usual cutoff points are: 0-5, normal; 6-10, mild depression; 11-15, moderate depression; 16-20, moderately severe depression; >20, severe depression. Compared with SCID and using DSM-IV diagnostic criteria, a sum-score of >9 had a sensitivity (specificity) of 88% (88%) for the diagnosis of major depressive disorder (likelihood ratio 7.1). Corresponding values for a sum-score >11 were 83% (92%), likelihood ratio 10.2.13 In a previous study, an effect size of PHQ-9 change scores of –1.33 for improved depression status was reported (effect size = measurement1 – measurement 2/standard deviation of measurement 1).13,14
Downloaded From: on 06/01/2018

© 2016 American Medical Association. All rights reserved.
§The KCCQ is a 23-item self-assessment questionnaire developed to measure self-reported health status in patients with heart failure, and quantifies physical limitations, symptoms, self-efficacy, social interference and quality of life domains. Scores range from 0-100, with higher scores indicating better health-related quality of life. The Clinical Summary Score is the mean of the physical limitation and total symptoms domain scores; the Overall Summary Score includes the Clinical Summary Score plus the quality of life and social limitation scores.4 Scores ≤75 have been associated with significant heart failure symptoms, limited functional status, poor quality of life and worse outcomes.15 A mean difference between groups of patients and an intra-individual change over time of ≥5 points is considered clinically significant.16 In a prospective study, a 5-point change was associated with an 11% change in the multivariable-adjusted hazard ratio for hospitalization and cardiovascular death.17 †Each item of the GAD-7 yields a score of 0-3 resulting in an overall score from 0-21, with higher values indicating more severe anxiety. Usual cutoff points are: 0-5, normal; 6-10, mild anxiety; 11-15, moderate anxiety; >15, severe anxiety.18 Using a threshold score of 10, the GAD-7 has a sensitivity of 89% and a specificity of 82% for diagnosing generalized anxiety disorder. GAD sum-scores of ≥10 required further diagnostic evaluation. #The MMSE is an 11-item instrument to assess cognitive function and to document changes over time. Usual cutoff points to classify the severity of cognitive impairment are: 24-30, no cognitive impairment; 18-23, mild cognitive impairment; 0-17, severe cognitive impairment.19
Downloaded From: on 06/01/2018

© 2016 American Medical Association. All rights reserved.
eTable 3. Escitalopram Serum Levels*
Visit 6 weeks 12 weeks 6 months 12 months
Measurement available, n (%)
Patients alive in study 164 157 147 118
Patients with measurement 150 (91) 146 (93) 141 (96) 104 (88)
Patients with serum level ≥6.3 ng/mL 141 (86) 138 (88) 125 (85) 86 (73)
Escitalopram serum level, ng/mL
Median 27.3 40.7 33.7 35.1
Inter-quartile range 15.4–39.9 23.3–61.3 20.3–57.7 16.3–60.8 *Shown are data on serial escitalopram serum levels (measured in the escitalopram-treated group only). The number of patients alive and under observation, the number and proportion of those who had an escitalopram serum level determined and the number and proportion of those with a serum level above the lower detection limit of the assay are given, along with the median and interquartile range for values for each time point. Numbers contain also patients of the escitalopram group who were off study medication and/or on open antidepressant therapy, for which (as a rule) escitalopram was recommended as first-line treatment by the Psychiatric Core Laboratory
Downloaded From: on 06/01/2018
© 2016 American Medical Association. All rights reserved.
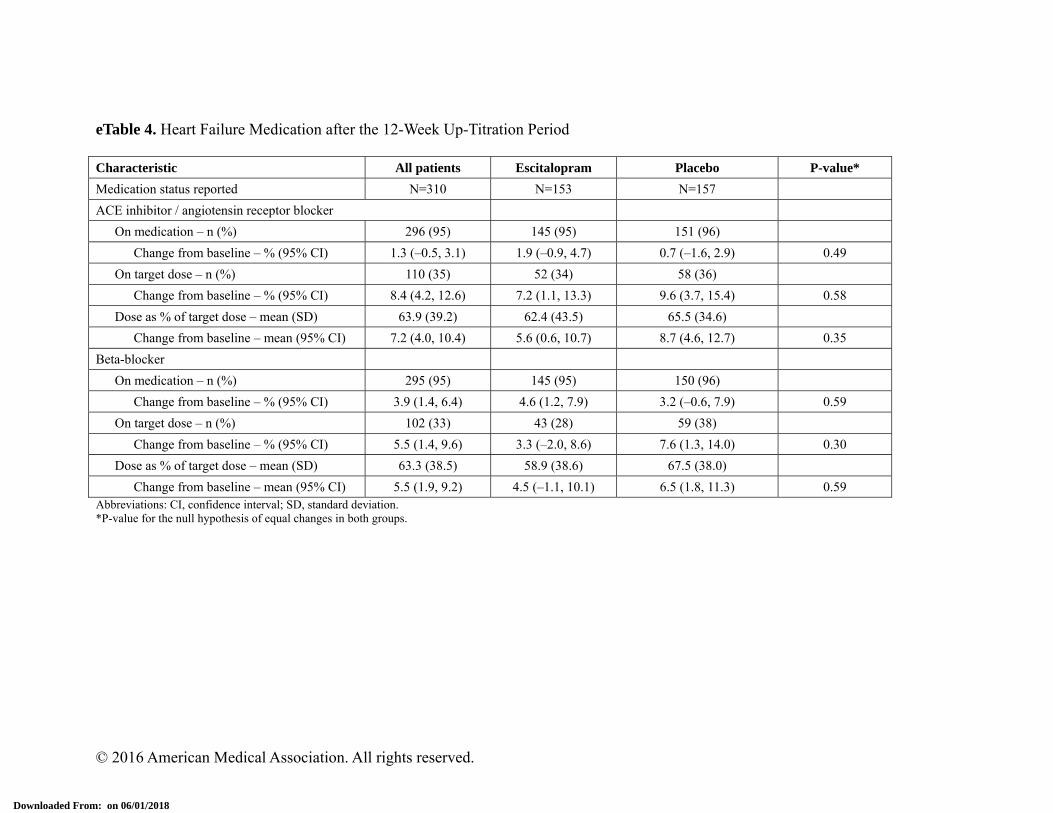
eTable 4. Heart Failure Medication after the 12-Week Up-Titration Period Characteristic All patients Escitalopram Placebo P-value*
Medication status reported N=310 N=153 N=157
ACE inhibitor / angiotensin receptor blocker
On medication – n (%) 296 (95) 145 (95) 151 (96)
Change from baseline – % (95% CI) 1.3 (–0.5, 3.1) 1.9 (–0.9, 4.7) 0.7 (–1.6, 2.9) 0.49
On target dose – n (%) 110 (35) 52 (34) 58 (36)
Change from baseline – % (95% CI) 8.4 (4.2, 12.6) 7.2 (1.1, 13.3) 9.6 (3.7, 15.4) 0.58
Dose as % of target dose – mean (SD) 63.9 (39.2) 62.4 (43.5) 65.5 (34.6)
Change from baseline – mean (95% CI) 7.2 (4.0, 10.4) 5.6 (0.6, 10.7) 8.7 (4.6, 12.7) 0.35
Beta-blocker
On medication – n (%) 295 (95) 145 (95) 150 (96)
Change from baseline – % (95% CI) 3.9 (1.4, 6.4) 4.6 (1.2, 7.9) 3.2 (–0.6, 7.9) 0.59
On target dose – n (%) 102 (33) 43 (28) 59 (38)
Change from baseline – % (95% CI) 5.5 (1.4, 9.6) 3.3 (–2.0, 8.6) 7.6 (1.3, 14.0) 0.30
Dose as % of target dose – mean (SD) 63.3 (38.5) 58.9 (38.6) 67.5 (38.0)
Change from baseline – mean (95% CI) 5.5 (1.9, 9.2) 4.5 (–1.1, 10.1) 6.5 (1.8, 11.3) 0.59 Abbreviations: CI, confidence interval; SD, standard deviation. *P-value for the null hypothesis of equal changes in both groups.
Downloaded From: on 06/01/2018

© 2016 American Medical Association. All rights reserved.
eTable 5. Changes within 12 months in Variables Describing Heart Failure Severity and Cardiac Status in Escitalopram- versus Placebo-Treated Patients Variable Escitalopram (E) Placebo (P) P-value
NYHA class (change from baseline)*
6-month follow-up – no. (% of available) (n=143) (n=151)
Worsened 11 (8) 13 (9)
Unchanged 103 (72) 102 (68) 0.91
Improved 29 (20) 35 (24)
12-month follow-up – no. (% of available) (n=112) (n=124)
Worsened 11 (10) 18 (15)
Unchanged 74 (66) 73 (59) 0.27
Improved 27 (24) 33 (27)
Six-minute walk distance – m†
6-month follow-up (n=116) (n=127)
Mean (SD) 370 (133) 351 (136)
Change from baseline (95% CI) 11 (–6, 0) 6 (–13, 25)
ANCOVA difference E–P (95% CI) 10 (–13, 33) 0.38
12-month follow-up (n=83) (n=105)
Mean (SD) 387 (145) 354 (136)
Change from baseline (95% CI) 17 (–2, 37) 6 (–15, 27)
ANCOVA difference E–P (95% CI) 14 (–15, 43) 0.35
Left-ventricular ejection fraction [%]†
6-month follow-up (n=136) (n=149)
Mean (SD) 38.7 (11.4) 39.5 (10.6)
Change from baseline (95% CI) 3.6 (2.1, 5.1) 4.3 (2.9, 5.7)
ANCOVA difference E–P (95% CI) –0.6 (–2.4, 1.3) 0.54
12-month follow-up (n=107) (n=117)
Mean (SD) 39.7 (11.4) 41.1 (10.6)
Change from baseline (95% CI) 3.7 (2.1, 5.3) 5.6 (3.9, 7.4)
ANCOVA difference E–P (95% CI) –1.8 (–4.1, 0.6) 0.14
Left-ventricular end-diastolic diameter [mm]†
6-month follow-up (n=133) (n=140)
Mean (SD) 59.8 (11.0) 58.4 (8.2)
Change from baseline (95% CI) –0.4 (–2.6, 1.8) –1.4 (–2.7, –0.2)§
ANCOVA difference E–P (95% CI) +1.5 (–0.3, 3.3) 0.11
Downloaded From: on 06/01/2018

© 2016 American Medical Association. All rights reserved.
Variable Escitalopram (E) Placebo (P) P-value
12-month follow-up (n=99) (n=112)
Mean (SD) 59.9 (10.4) 58.5 (9.1)
Change from baseline (95% CI) 0.2 (–0.9, 1.4) –2.1 (–4.0, –0.3)
ANCOVA difference E–P (95% CI) 2.1 (0.1, 4.2) 0.04
NT-proBNP –pg/mL‡
3-month follow-up (n=141) (n=144)
Median (quartiles) 617 (248–1565) 570 (300–1340)
Change from baseline, ratio (95% CI) 0.96 (0.80, 1.14) 0.78 (0.69, 0.88)
Geometric mean ratio E:P (95% CI) 1.16 (0.99, 1.35) 0.06
6-month follow-up (n=130) (n=137)
Median (quartiles) 639 (248–1920) 538 (257–1315)
Change from baseline, ratio (95% CI) 0.94 (0.77, 1.14) 0.70 (0.61, 0.81)
Geometric mean ratio E:P (95% CI) 1.36 (1.14, 1.64) 0.001
12-month follow-up (n=102) (n=113)
Median (quartiles) 499 (227–1417) 494 (230–1393)
Change from baseline, ratio (95% CI) 0.84 (0.67, 1.05) 0.74 (0.61, 0.90)
Geometric mean ratio E:P (95% CI) 1.16 (0.90, 1.49) 0.24
Abbreviations: ANCOVA, analysis of covariance; CI, confidence interval; SD, standard deviation. *P-values were computed by ordinal logistic regression, including baseline NYHA class as co-factor. †The differences between groups in changes from baseline, their 95% CI and p-values were computed by analysis of covariance, including the baseline values as covariate. Note that the ANCOVA estimates adjust for the baseline values and are, therefore, not equal to the simple differences of changes within groups. ‡The differences between groups in changes from baseline, their 95% CI and p-values were computed by analysis of covariance, including the baseline values as covariate. Computations of changes within groups and differences between groups were carried out with logarithmic NT-proBNP values. Geometric mean ratios within and between groups were obtained applying the exponential function to the respective differences on the logarithmic scale. Ratios <1 within groups indicate lowering of NT-proBNP. Ratios >1 between groups indicate more favorable changes in the placebo group.
Downloaded From: on 06/01/2018

© 2016 American Medical Association. All rights reserved.
eTable 6. Study Participation, Discontinuation of Study Medication, Open-Label Antidepressant Use and Unscheduled Psychiatric Consultations over 24 Months
Variable Escitalopram Placebo P-value*
Randomized and not excluded 185 187 –
Alive and under observation in the study – no. (%)
3 weeks (day 21) 174 (94) 181 (97) 0.23
6 weeks (day 42) 164 (89) 177 (95) 0.04
3 months (day 90) 157 (85) 173 (93) 0.02
6 months (day 183) 147 (79) 157 (84) 0.28
12 months (day 366) 118 (64) 131 (70) 0.23
18 months (day 549) 94 (51) 102 (55) 0.53
24 months (day 732) 75 (41) 82 (44) 0.53
HR (95% CI) for withdrawal from study 1.16 (0.82-1.64) 1 (reference) 0.40
On study medication – no. (%)
3 weeks (day 21) 167 (90) 174 (93) 0.35
6 weeks (day 42) 155 (84) 159 (85) 0.78
3 months (day 90) 135 (73) 140 (75) 0.72
6 months (day 183) 115 (62) 126 (67) 0.33
12 months (day 366) 92 (50) 109 (58) 0.12
18 months (day 549) 77 (42) 82 (44) 0.68
24 months (day 732) 60 (32) 64 (34) 0.74
HR (95% CI) for discontinuation of study medication
1.17 (0.88-1.54) 1 (reference) 0.28
Open antidepressant therapy – cumulative no. (%)
3 weeks (day 21) 5 (3) 3 (2) 0.50
6 weeks (day 42) 7 (4) 5 (3) 0.57
3 months (day 90) 15 (8) 11 (6) 0.42
6 months (day 183) 19 (10) 16 (9) 0.60
12 months (day 366) 22 (12) 23 (12) >0.99
18 months (day 549) 23 (12) 31 (17) 0.30
24 months (day 732) 24 (13) 37 (20) 0.09
HR (95% CI) for open antidepressant therapy 0.72 (0.43-1.20) 1 (reference) 0.21
Unscheduled psychiatric consultations – no. (%)
None 129 (70) 115 (61)
One 27 (15) 33 (18)
Two or more 29 (16) 39 (21)
OR (95% CI) for unscheduled consultation 0.73 (0.48-1.13) 1 (reference) 0.16
Downloaded From: on 06/01/2018

© 2016 American Medical Association. All rights reserved.
Abbreviations: CI, confidence interval; HR, hazard ratio; OR, odds ratio. *Comparisons of rates between study arms at each time point were carried out by Fisher’s exact test. Hazard ratios for drop out from the study, discontinuation of the study medication or introduction of open antidepressant therapy were computed from Cox regression; death or discontinuation due to end of study were classified as censoring. The odds ratio for unscheduled psychiatric consultations was computed from ordinal logistic regression, including time under observation in the study as a covariate.
Downloaded From: on 06/01/2018
© 2016 American Medical Association. All rights reserved.
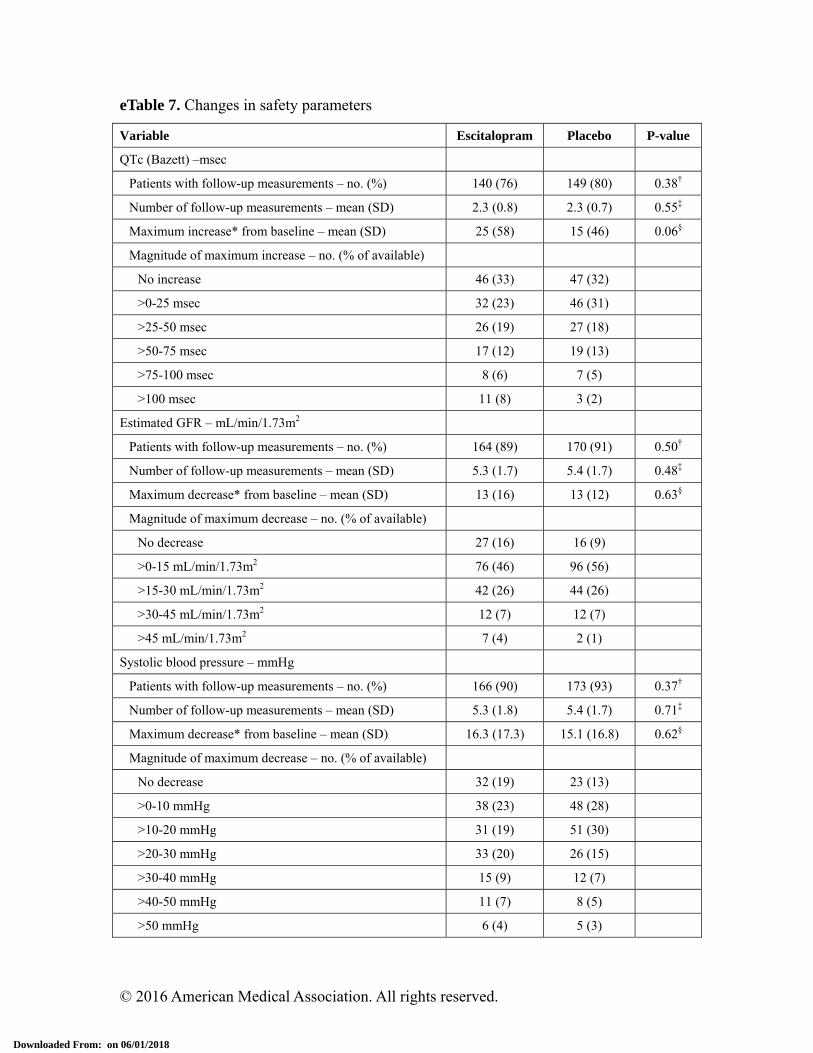
eTable 7. Changes in safety parameters
Variable Escitalopram Placebo P-value
QTc (Bazett) –msec
Patients with follow-up measurements – no. (%) 140 (76) 149 (80) 0.38†
Number of follow-up measurements – mean (SD) 2.3 (0.8) 2.3 (0.7) 0.55‡
Maximum increase* from baseline – mean (SD) 25 (58) 15 (46) 0.06§
Magnitude of maximum increase – no. (% of available)
No increase 46 (33) 47 (32)
>0-25 msec 32 (23) 46 (31)
>25-50 msec 26 (19) 27 (18)
>50-75 msec 17 (12) 19 (13)
>75-100 msec 8 (6) 7 (5)
>100 msec 11 (8) 3 (2)
Estimated GFR – mL/min/1.73m2
Patients with follow-up measurements – no. (%) 164 (89) 170 (91) 0.50†
Number of follow-up measurements – mean (SD) 5.3 (1.7) 5.4 (1.7) 0.48‡
Maximum decrease* from baseline – mean (SD) 13 (16) 13 (12) 0.63§
Magnitude of maximum decrease – no. (% of available)
No decrease 27 (16) 16 (9)
>0-15 mL/min/1.73m2 76 (46) 96 (56)
>15-30 mL/min/1.73m2 42 (26) 44 (26)
>30-45 mL/min/1.73m2 12 (7) 12 (7)
>45 mL/min/1.73m2 7 (4) 2 (1)
Systolic blood pressure – mmHg
Patients with follow-up measurements – no. (%) 166 (90) 173 (93) 0.37†
Number of follow-up measurements – mean (SD) 5.3 (1.8) 5.4 (1.7) 0.71‡
Maximum decrease* from baseline – mean (SD) 16.3 (17.3) 15.1 (16.8) 0.62§
Magnitude of maximum decrease – no. (% of available)
No decrease 32 (19) 23 (13)
>0-10 mmHg 38 (23) 48 (28)
>10-20 mmHg 31 (19) 51 (30)
>20-30 mmHg 33 (20) 26 (15)
>30-40 mmHg 15 (9) 12 (7)
>40-50 mmHg 11 (7) 8 (5)
>50 mmHg 6 (4) 5 (3)
Downloaded From: on 06/01/2018

© 2016 American Medical Association. All rights reserved.
Variable Escitalopram Placebo P-value
Diastolic blood pressure – mmHg
Patients with follow-up measurements – no. (%) 166 (90) 173 (93) 0.37†
Number of follow-up measurements – mean (SD) 5.3 (1.8) 5.4 (1.7) 0.71‡
Maximum decrease* from baseline – mean (SD) 11.8 (11.5) 11.0 (10.9) 0.49§
Magnitude of maximum decrease – no. (% of available)
No decrease 29 (17) 23 (13)
>0-10 mmHg 54 (33) 67 (39)
>10-20 mmHg 45 (27) 56 (32)
>20-30 mmHg 30 (18) 21 (12)
>30 mmHg 8 (5) 6 (3)
Heart rate from the electrocardiogram – bpm
Patients with follow-up measurements – no. (%) 141 (76) 150 (80) 0.38†
Number of follow-up measurements – mean (SD) 2.3 (0.8) 2.3 (0.7) 0.51‡
Maximum decrease* from baseline – mean (SD) 6.0 (12.8) 6.6 (12.0) 0.77§
Magnitude of maximum decrease – no. (% of available)
No decrease 47 (33) 47 (31)
>0-10 bpm 54 (38) 65 (43)
>10-20 bpm 21 (15) 21 (10)
>20-30 bpm 14 (10) 10 (7)
>30 bpm 5 (4) 7 (5)
Abbreviations: bpm, beats/minute; GFR, glomerular filtration rate; QTc (Bazett), corrected QT time according to Bazett’s formula (QT time in milliseconds divided by the square root of the duration of the R-R interval in seconds); SD, standard deviation. *Maximum increase or decrease refers to the largest change from baseline observed at any follow-up visit. †P-values from Fisher’s exact test. ‡P-values were computed from test for Kendall’s tau. §P-values for maximum changes were computed from analysis of covariance, including the baseline value as covariate and adjusting for number of follow-up measurements as a co-factor.
Downloaded From: on 06/01/2018
© 2016 American Medical Association. All rights reserved.
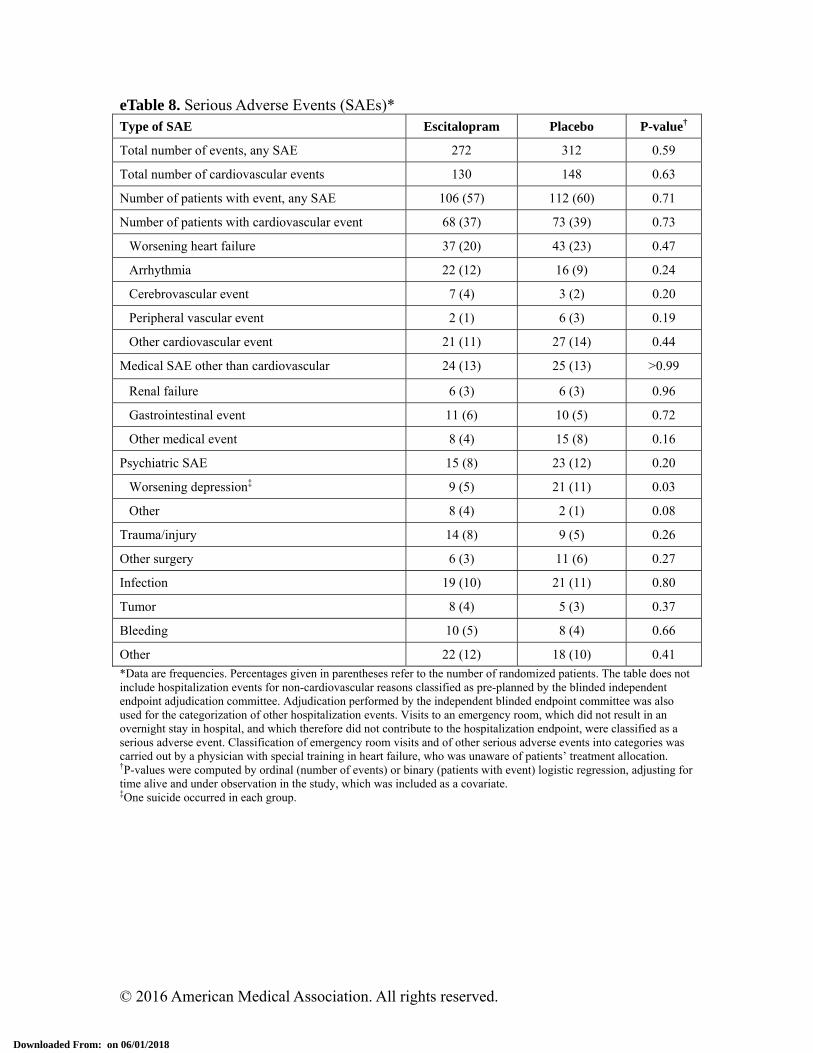
eTable 8. Serious Adverse Events (SAEs)* Type of SAE Escitalopram Placebo P-value†
Total number of events, any SAE 272 312 0.59
Total number of cardiovascular events 130 148 0.63
Number of patients with event, any SAE 106 (57) 112 (60) 0.71
Number of patients with cardiovascular event 68 (37) 73 (39) 0.73
Worsening heart failure 37 (20) 43 (23) 0.47
Arrhythmia 22 (12) 16 (9) 0.24
Cerebrovascular event 7 (4) 3 (2) 0.20
Peripheral vascular event 2 (1) 6 (3) 0.19
Other cardiovascular event 21 (11) 27 (14) 0.44
Medical SAE other than cardiovascular 24 (13) 25 (13) >0.99
Renal failure 6 (3) 6 (3) 0.96
Gastrointestinal event 11 (6) 10 (5) 0.72
Other medical event 8 (4) 15 (8) 0.16
Psychiatric SAE 15 (8) 23 (12) 0.20
Worsening depression‡ 9 (5) 21 (11) 0.03
Other 8 (4) 2 (1) 0.08
Trauma/injury 14 (8) 9 (5) 0.26
Other surgery 6 (3) 11 (6) 0.27
Infection 19 (10) 21 (11) 0.80
Tumor 8 (4) 5 (3) 0.37
Bleeding 10 (5) 8 (4) 0.66
Other 22 (12) 18 (10) 0.41
*Data are frequencies. Percentages given in parentheses refer to the number of randomized patients. The table does not include hospitalization events for non-cardiovascular reasons classified as pre-planned by the blinded independent endpoint adjudication committee. Adjudication performed by the independent blinded endpoint committee was also used for the categorization of other hospitalization events. Visits to an emergency room, which did not result in an overnight stay in hospital, and which therefore did not contribute to the hospitalization endpoint, were classified as a serious adverse event. Classification of emergency room visits and of other serious adverse events into categories was carried out by a physician with special training in heart failure, who was unaware of patients’ treatment allocation. †P-values were computed by ordinal (number of events) or binary (patients with event) logistic regression, adjusting for time alive and under observation in the study, which was included as a covariate. ‡One suicide occurred in each group.
Downloaded From: on 06/01/2018

© 2016 American Medical Association. All rights reserved.
eAcknowledgments
MOOD-HF would not have been possible without the financial support of the German Ministry of Education and Research. We are further indebted to H. Lundbeck A/S, Denmark. Without ever interfering with any aspect of the trial, this Company provided the study medication and financially supported the screening process for MOOD-HF.
Downloaded From: on 06/01/2018

© 2016 American Medical Association. All rights reserved.
eReferences
1. Pocock SJ, Simon R. Sequential treatment assignment with balancing for prognostic factors in the controlled clinical trial. Biometrics. 1975; 31: 103-15.
2. Rutledge T, Reis VA, Linke SE, Greenberg BH, Mills PJ. Depression in heart failure a meta-analytic review of prevalence, intervention effects, and associations with clinical outcomes. J Am Coll Cardiol. 2006; 48: 1527-37.
3. Mehrhof F, Loffler M, Gelbrich G, et al. A network against failing hearts--introducing the German "Competence Network Heart Failure". Int J Cardiol. 2010; 145: 135-8.
4. Faller H, Steinbuchel T, Schowalter M, Spertus JA, Stork S, Angermann CE. [The Kansas City Cardiomyopathy Questionnaire (KCCQ) -- a new disease-specific quality of life measure for patients with chronic heart failure]. Psychother Psychosom Med Psychol. 2005; 55: 200-8.
5. Jiang W, Alexander J, Christopher E, et al. Relationship of depression to increased risk of mortality and rehospitalization in patients with congestive heart failure. Arch Intern Med. 2001; 161: 1849-56.
6. Lang RM, Bierig M, Devereux RB, et al. Recommendations for chamber quantification: a report from the American Society of Echocardiography's Guidelines and Standards Committee and the Chamber Quantification Writing Group, developed in conjunction with the European Association of Echocardiography, a branch of the European Society of Cardiology. J Am Soc Echocardiogr. 2005; 18: 1440-63.
7. Otterstad JE. Measuring left ventricular volume and ejection fraction with the biplane Simpson's method. Heart. 2002; 88: 559-60.
8. Faller H, Stork S, Schowalter M, et al. Depression and survival in chronic heart failure: does gender play a role? Eur J Heart Fail. 2007; 9: 1018-23.
9. Lowe B, Spitzer RL, Grafe K, et al. Comparative validity of three screening questionnaires for DSM-IV depressive disorders and physicians' diagnoses. J Affect Disord. 2004; 78: 131-40.
10. Kendrick T, Dowrick C, McBride A, et al. Management of depression in UK general practice in relation to scores on depression severity questionnaires: analysis of medical record data. BMJ. 2009; 338: b750.
11. Manea L, Gilbody S, McMillan D. Optimal cut-off score for diagnosing depression with the Patient Health Questionnaire (PHQ-9): a meta-analysis. CMAJ. 2012; 184: E191-6.
12. Hiemke C, Baumann P, Bergemann N, et al. AGNP Consensus Guidelines for Therapeutic Drug Monitoring in Psychiatry: Update 2011. Pharmacopsychiatry. 2011; 44: 195-235.
13. Spitzer RL, Williams JB, Gibbon M, First MB. The Structured Clinical Interview for DSM-III-R (SCID). I: History, rationale, and description. Arch Gen Psychiatry. 1992; 49: 624-9.
14. Lowe B, Kroenke K, Herzog W, Grafe K. Measuring depression outcome with a brief self-report instrument: sensitivity to change of the Patient Health Questionnaire (PHQ-9). J Affect Disord. 2004; 81: 61-6.
15. Heidenreich PA, Spertus JA, Jones PG, et al. Health status identifies heart failure outpatients at risk for hospitalization or death. J Am Coll Cardiol. 2006; 47: 752-
Downloaded From: on 06/01/2018
© 2016 American Medical Association. All rights reserved.
6. 16. Spertus JA, Jones PG, Kim J, Globe D. Validity, reliability, and responsiveness of
the Kansas City Cardiomyopathy Questionnaire in anemic heart failure patients. Qual Life Res. 2008; 17: 291-8.
17. Kosiborod M, Soto GE, Jones PG, et al. Identifying heart failure patients at high risk for near-term cardiovascular events with serial health status assessments. Circulation. 2007; 115: 1975-81.
18. Spitzer RL, Kroenke K, Williams JB, Lowe B. A brief measure for assessing generalized anxiety disorder: the GAD-7. Arch Intern Med. 2006; 166: 1092-7.
19. Folstein MF, Folstein SE, McHugh PR. "Mini-mental state". A practical method for grading the cognitive state of patients for the clinician. J Psychiatr Res. 1975; 12: 189-98.
Downloaded From: on 06/01/2018