supplementary information · s1 supplementary information organic field effect transistors based on...
TRANSCRIPT

S1
Supplementary Information
Organic Field Effect Transistors Based on Self-Assembling Core-
Modified Peptidic Polymers
Sameer Dhawan,a Akshay Moudgil,
b Hanuman Singh,
a Soniya Gahlawat,
a Jisha Babu,
a Pravin P
Ingole,a Samaresh Das,*
b and V. Haridas*
a
aDepartment of Chemistry, Indian Institute of Technology Delhi, Hauz Khas, New Delhi-110016,
India.
bCentre for Applied Research in Electronics, Indian Institute of Technology Delhi, Hauz Khas,
New Delhi-110016, India.
.
*Corresponding Authors:
V. Haridas, E-mail: [email protected]
Samaresh Das, E-mail: [email protected]
Electronic Supplementary Material (ESI) for Molecular Systems Design & Engineering.This journal is © The Royal Society of Chemistry 2020

S2
Scheme S1: Synthetic route of diacetylene monomers F1 and F2.
Scheme S2: Synthesis of Phe-appended polydiacetylenes PF and PFF.

S3
Table S1: Details of the band structure parameters of polymers.
Polymer HOMO
vs.
Vacuum
LUMO
vs.
Vacuum
Band Gap (From CV)
(eV)
Band Gap (From UV)
(eV)
PFF -6.82 -4.50 2.32 2.24
PF -6.75 -4.31 2.44 2.28

S4
Figure S1: Concentration-dependent 1H NMR (300 MHz, CDCl3) of F1. (Concentration-
dependent 1H NMR spectra of F2 was not recorded due to its immediate polymerization)

S5
Figure S2: Normalized Raman spectra of diacetylenes and corresponding polydiacetylenes. Blue
dotted line is diacetylene before UV exposure and black solid line is after the formation of
polymers. (Raman spectrum of F2 was not recorded due to its immediate polymerization)
Figure S3: UV-Vis absorption spectra of diacetylene monomers and corresponding polymers.
(UV-Vis absorption spectrum of F2 was not recorded due to its immediate polymerization)

S6
Figure S4: Powder X-ray diffraction pattern of polymer PFF. (PXRD data of PF was not
recorded due to its sticky nature)

S7
Figure S5: FET measurements on polymer PF (a) Output characteristics, (b) Transfer
characteristics.
Figure S6: Variation of mobility with VGS at room temperature under ambient conditions in the
case of PFF.

S8
Figure S7: 1H NMR (300 MHz, CDCl3) spectrum of M1.
Figure S8: 13
C NMR (75 MHz, CDCl3) spectrum of M1.
S9
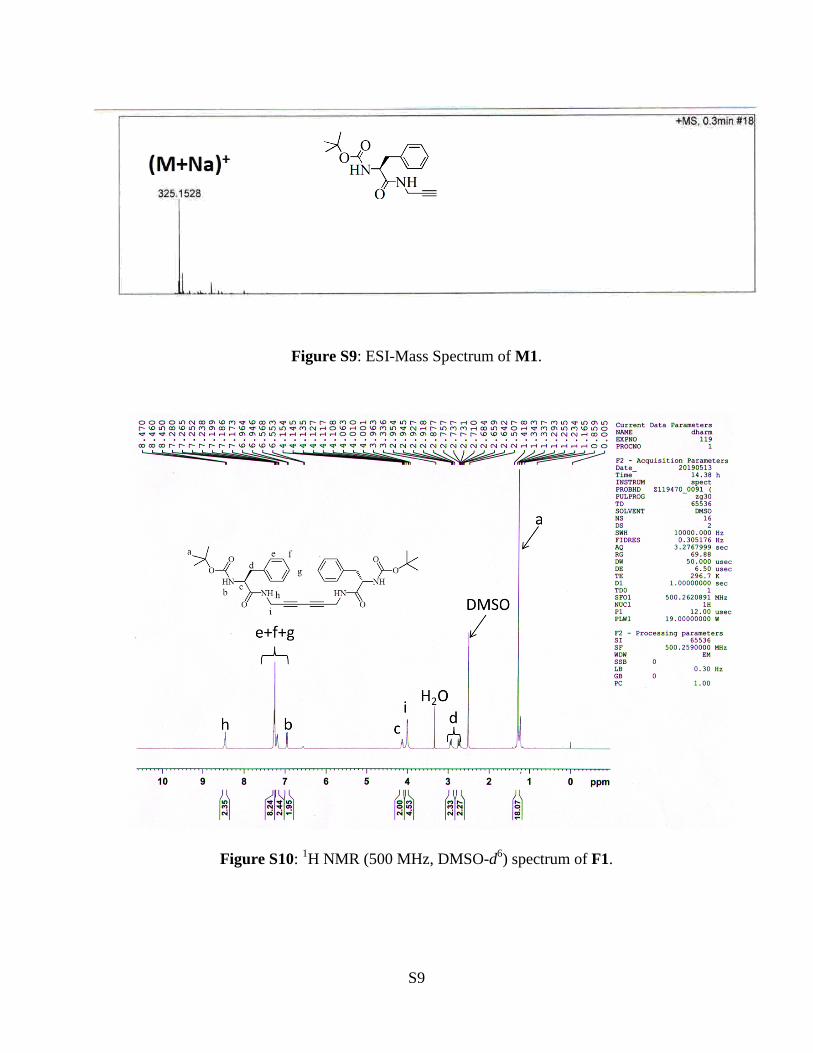
Figure S9: ESI-Mass Spectrum of M1.
Figure S10: 1H NMR (500 MHz, DMSO-d
6) spectrum of F1.

S10
Figure S11: 13
C NMR (125 MHz, DMSO-d6) spectrum of F1.
Figure S12: ESI-Mass Spectrum of F1.

S11
Figure S13: 1H NMR (300 MHz, CDCl3) spectrum of M2.
Figure S14: 13
C NMR (75 MHz, CDCl3) spectrum of M2.
S12
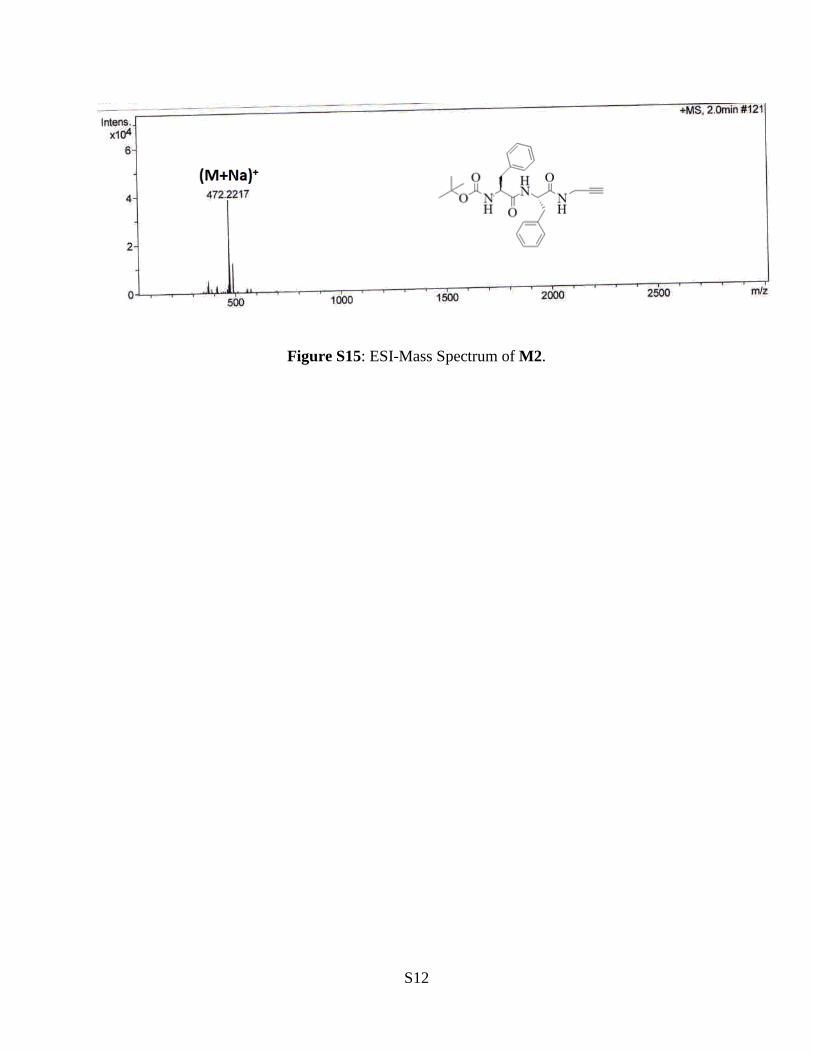
Figure S15: ESI-Mass Spectrum of M2.