supplementary webappendix - thelancet.com supplementary file 1. baseline survey questionnaire the...
TRANSCRIPT

Supplementary webappendixThis webappendix formed part of the original submission and has been peer reviewed. We post it as supplied by the authors.
Supplement to: Gao L, Li X, Liu J, et al, for the LATENTTB-NSTM study team. Incidence of active tuberculosis in individuals with latent tuberculosis infection in rural China: follow-up results of a population-based, multicentre, prospective cohort study. Lancet Infect Dis 2017; published online July 14. http://dx.doi.org/10.1016/S1473-3099(17)30402-4.
1
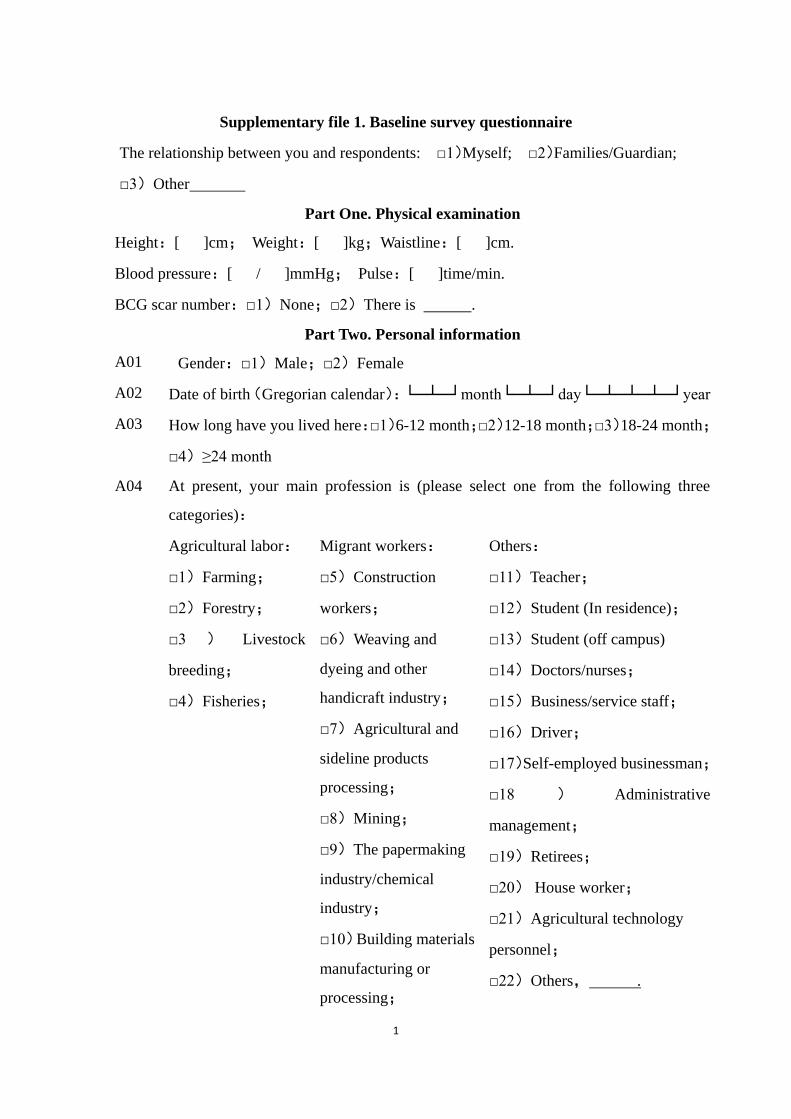
Supplementary file 1. Baseline survey questionnaire
The relationship between you and respondents: □1)Myself; □2)Families/Guardian;
□3)Other
Part One. Physical examination
Height:[ ]cm; Weight:[ ]kg;Waistline:[ ]cm.
Blood pressure:[ / ]mmHg; Pulse:[ ]time/min.
BCG scar number:□1)None;□2)There is .
Part Two. Personal information
A01 Gender:□1)Male;□2)Female
A02 Date of birth(Gregorian calendar):└─┴─┘month└─┴─┘day└─┴─┴─┴─┘year
A03 How long have you lived here:□1)6-12 month;□2)12-18 month;□3)18-24 month;
□4)≥24 month
A04 At present, your main profession is (please select one from the following three
categories):
Agricultural labor:
□1)Farming;
□2)Forestry;
□3 ) Livestock
breeding;
□4)Fisheries;
Migrant workers:
□5)Construction
workers;
□6)Weaving and
dyeing and other
handicraft industry;
□7)Agricultural and
sideline products
processing;
□8)Mining;
□9)The papermaking
industry/chemical
industry;
□10)Building materials
manufacturing or
processing;
Others:
□11)Teacher;
□12)Student (In residence);
□13)Student (off campus)
□14)Doctors/nurses;
□15)Business/service staff;
□16)Driver;
□17)Self-employed businessman;
□18 ) Administrative
management;
□19)Retirees;
□20) House worker;
□21)Agricultural technology
personnel;
□22)Others, .
2
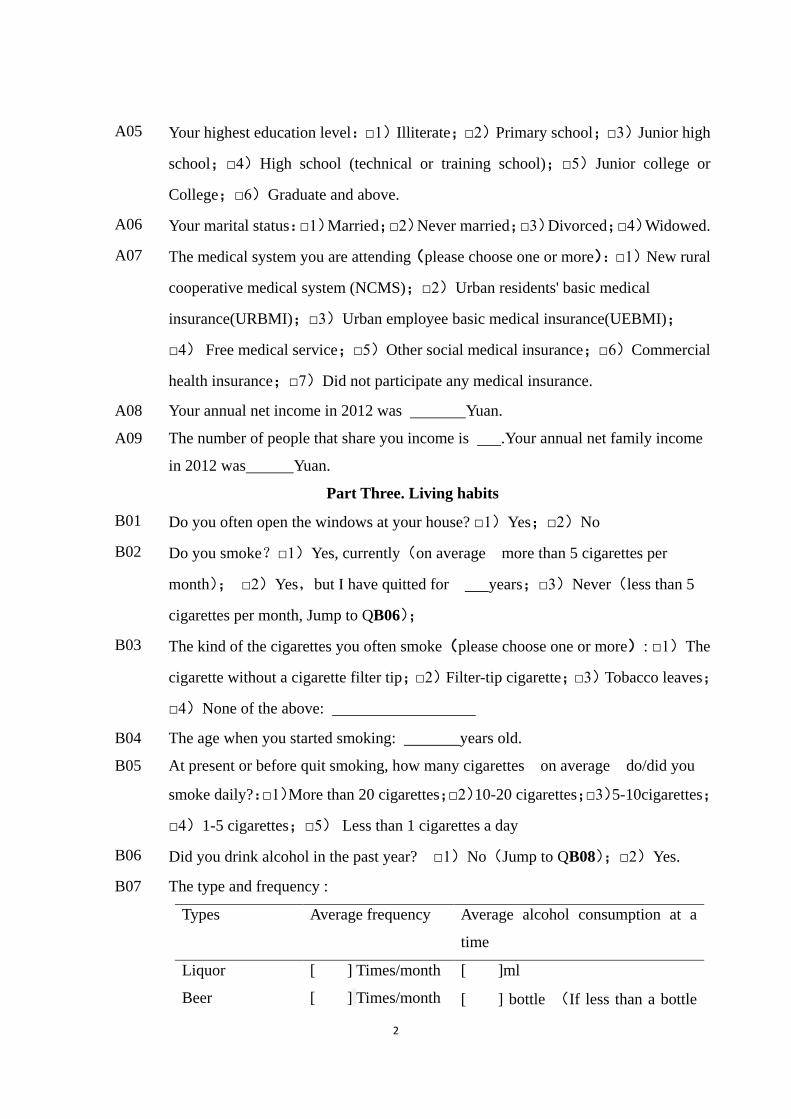
A05 Your highest education level:□1)Illiterate;□2)Primary school;□3)Junior high
school;□4)High school (technical or training school);□5)Junior college or
College;□6)Graduate and above.
A06 Your marital status:□1)Married;□2)Never married;□3)Divorced;□4)Widowed.
A07 The medical system you are attending(please choose one or more):□1)New rural
cooperative medical system (NCMS);□2)Urban residents' basic medical
insurance(URBMI);□3)Urban employee basic medical insurance(UEBMI);
□4) Free medical service;□5)Other social medical insurance;□6)Commercial
health insurance;□7)Did not participate any medical insurance.
A08 Your annual net income in 2012 was Yuan.
A09 The number of people that share you income is .Your annual net family income
in 2012 was Yuan.
Part Three. Living habits
B01 Do you often open the windows at your house? □1)Yes;□2)No
B02 Do you smoke?□1)Yes, currently(on average more than 5 cigarettes per
month); □2)Yes,but I have quitted for years;□3)Never(less than 5
cigarettes per month, Jump to QB06);
B03 The kind of the cigarettes you often smoke(please choose one or more): □1)The
cigarette without a cigarette filter tip;□2)Filter-tip cigarette;□3)Tobacco leaves;
□4)None of the above:
B04 The age when you started smoking: years old.
B05 At present or before quit smoking, how many cigarettes on average do/did you
smoke daily?:□1)More than 20 cigarettes;□2)10-20 cigarettes;□3)5-10cigarettes;
□4)1-5 cigarettes;□5) Less than 1 cigarettes a day
B06 Did you drink alcohol in the past year? □1)No(Jump to QB08);□2)Yes.
B07 The type and frequency :
Types Average frequency Average alcohol consumption at a
time
Liquor [ ] Times/month [ ]ml
Beer [ ] Times/month [ ] bottle (If less than a bottle
3
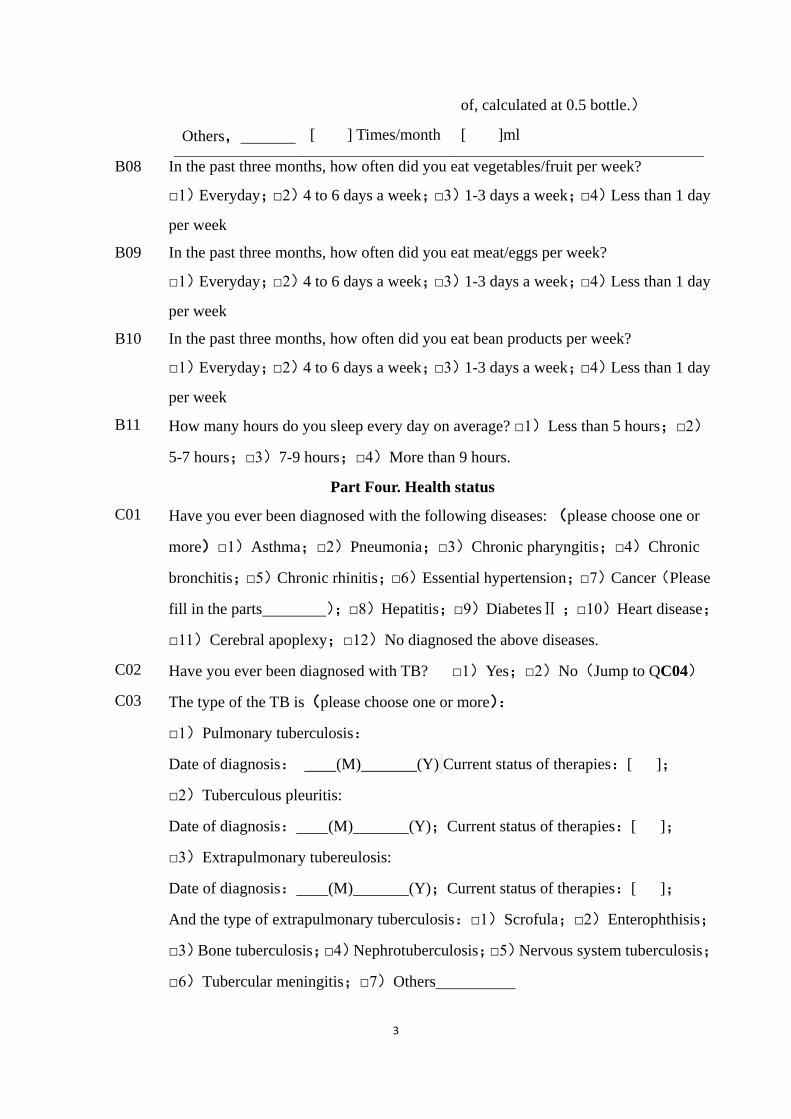
of, calculated at 0.5 bottle.)
Others, [ ] Times/month [ ]ml
B08 In the past three months, how often did you eat vegetables/fruit per week?
□1)Everyday;□2)4 to 6 days a week;□3)1-3 days a week;□4)Less than 1 day
per week
B09 In the past three months, how often did you eat meat/eggs per week?
□1)Everyday;□2)4 to 6 days a week;□3)1-3 days a week;□4)Less than 1 day
per week
B10 In the past three months, how often did you eat bean products per week?
□1)Everyday;□2)4 to 6 days a week;□3)1-3 days a week;□4)Less than 1 day
per week
B11 How many hours do you sleep every day on average? □1)Less than 5 hours;□2)
5-7 hours;□3)7-9 hours;□4)More than 9 hours.
Part Four. Health status
C01 Have you ever been diagnosed with the following diseases: (please choose one or
more)□1)Asthma;□2)Pneumonia;□3)Chronic pharyngitis;□4)Chronic
bronchitis;□5)Chronic rhinitis;□6)Essential hypertension;□7)Cancer(Please
fill in the parts );□8)Hepatitis;□9)DiabetesⅡ ;□10)Heart disease;
□11)Cerebral apoplexy;□12)No diagnosed the above diseases.
C02 Have you ever been diagnosed with TB? □1)Yes;□2)No(Jump to QC04)
C03 The type of the TB is(please choose one or more):
□1)Pulmonary tuberculosis:
Date of diagnosis: (M) (Y) Current status of therapies:[ ];
□2)Tuberculous pleuritis:
Date of diagnosis: (M) (Y);Current status of therapies:[ ];
□3)Extrapulmonary tubereulosis:
Date of diagnosis: (M) (Y);Current status of therapies:[ ];
And the type of extrapulmonary tuberculosis:□1)Scrofula;□2)Enterophthisis;
□3)Bone tuberculosis;□4)Nephrotuberculosis;□5)Nervous system tuberculosis;
□6)Tubercular meningitis;□7)Others
4
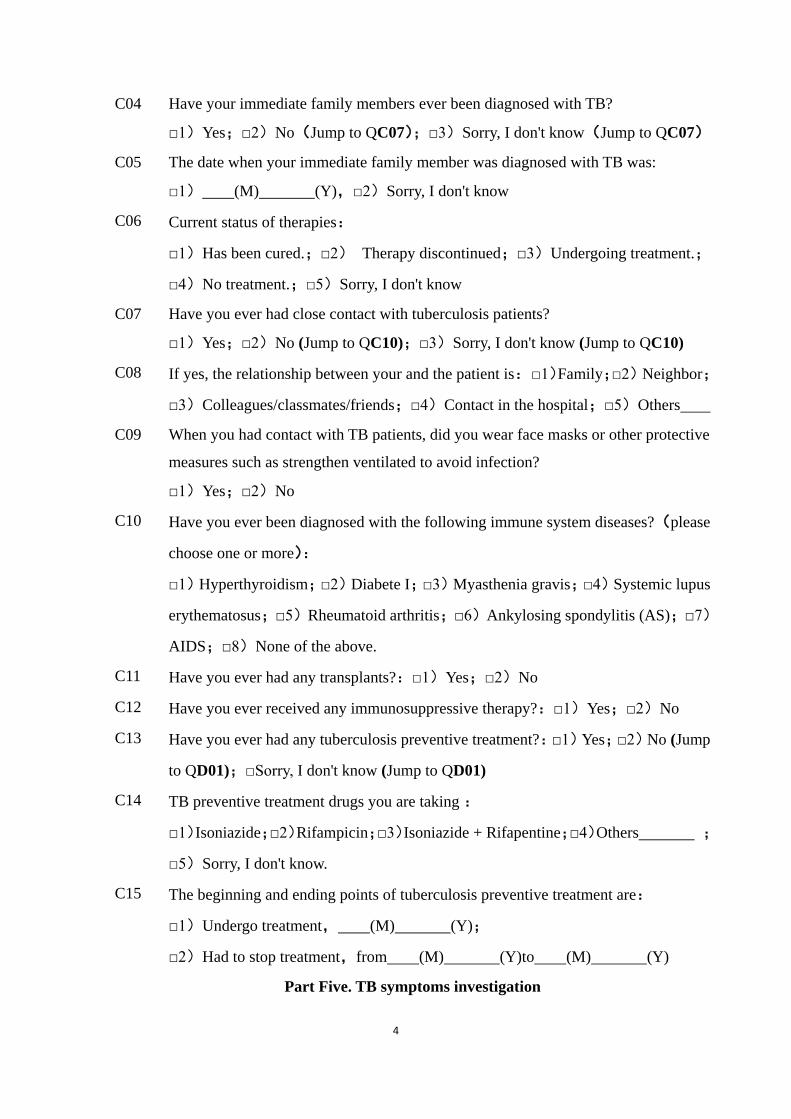
C04 Have your immediate family members ever been diagnosed with TB?
□1)Yes;□2)No(Jump to QC07);□3)Sorry, I don't know(Jump to QC07)
C05 The date when your immediate family member was diagnosed with TB was:
□1) (M) (Y),□2)Sorry, I don't know
C06 Current status of therapies:
□1)Has been cured.;□2) Therapy discontinued;□3)Undergoing treatment.;
□4)No treatment.;□5)Sorry, I don't know
C07 Have you ever had close contact with tuberculosis patients?
□1)Yes;□2)No (Jump to QC10);□3)Sorry, I don't know (Jump to QC10)
C08 If yes, the relationship between your and the patient is: □1)Family;□2) Neighbor;
□3)Colleagues/classmates/friends;□4)Contact in the hospital;□5)Others
C09 When you had contact with TB patients, did you wear face masks or other protective
measures such as strengthen ventilated to avoid infection?
□1)Yes;□2)No
C10 Have you ever been diagnosed with the following immune system diseases?(please
choose one or more):
□1)Hyperthyroidism;□2)Diabete I;□3)Myasthenia gravis;□4)Systemic lupus
erythematosus;□5)Rheumatoid arthritis;□6)Ankylosing spondylitis (AS);□7)
AIDS;□8)None of the above.
C11 Have you ever had any transplants?:□1)Yes;□2)No
C12 Have you ever received any immunosuppressive therapy?:□1)Yes;□2)No
C13 Have you ever had any tuberculosis preventive treatment?:□1)Yes;□2)No (Jump
to QD01);□Sorry, I don't know (Jump to QD01)
C14 TB preventive treatment drugs you are taking :
□1)Isoniazide;□2)Rifampicin;□3)Isoniazide + Rifapentine;□4)Others ;
□5)Sorry, I don't know.
C15 The beginning and ending points of tuberculosis preventive treatment are:
□1)Undergo treatment, (M) (Y);
□2)Had to stop treatment,from (M) (Y)to (M) (Y)
Part Five. TB symptoms investigation
5
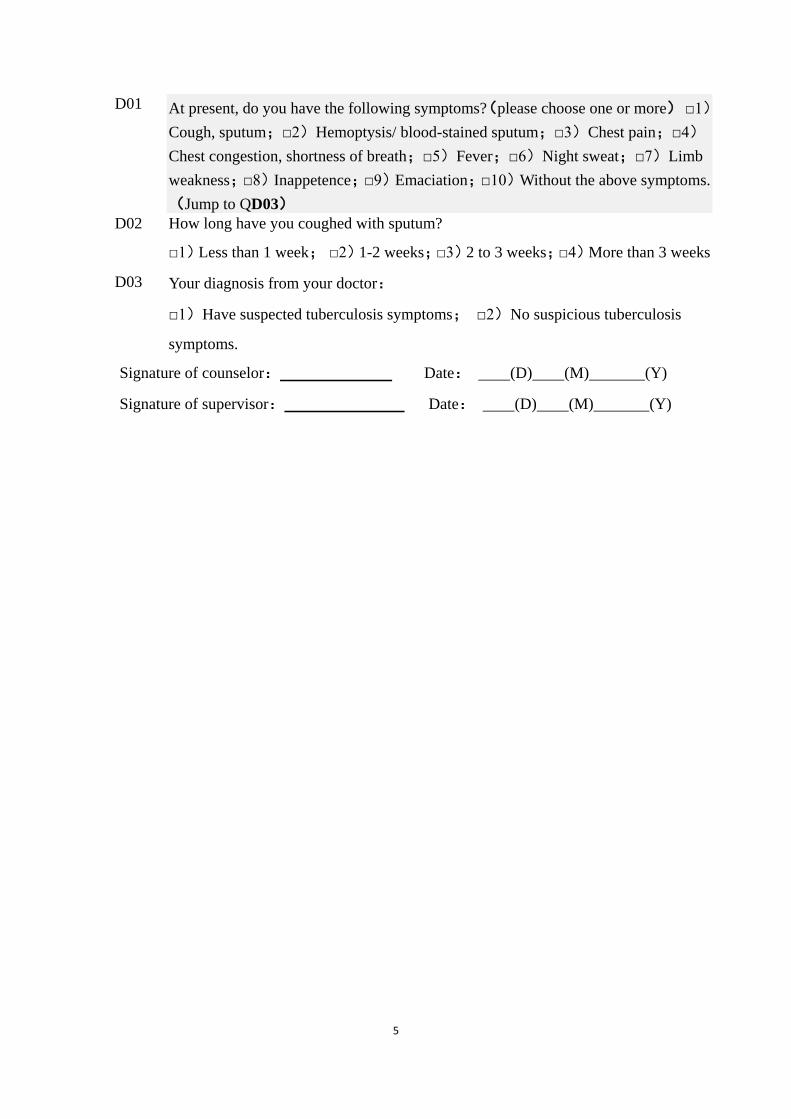
D01 At present, do you have the following symptoms?(please choose one or more) □1)
Cough, sputum;□2)Hemoptysis/ blood-stained sputum;□3)Chest pain;□4)
Chest congestion, shortness of breath;□5)Fever;□6)Night sweat;□7)Limb
weakness;□8)Inappetence;□9)Emaciation;□10)Without the above symptoms.
(Jump to QD03)
D02 How long have you coughed with sputum?
□1)Less than 1 week; □2)1-2 weeks;□3)2 to 3 weeks;□4)More than 3 weeks
D03 Your diagnosis from your doctor:
□1)Have suspected tuberculosis symptoms; □2)No suspicious tuberculosis
symptoms.
Signature of counselor: Date: (D) (M) (Y)
Signature of supervisor: Date: (D) (M) (Y)
6
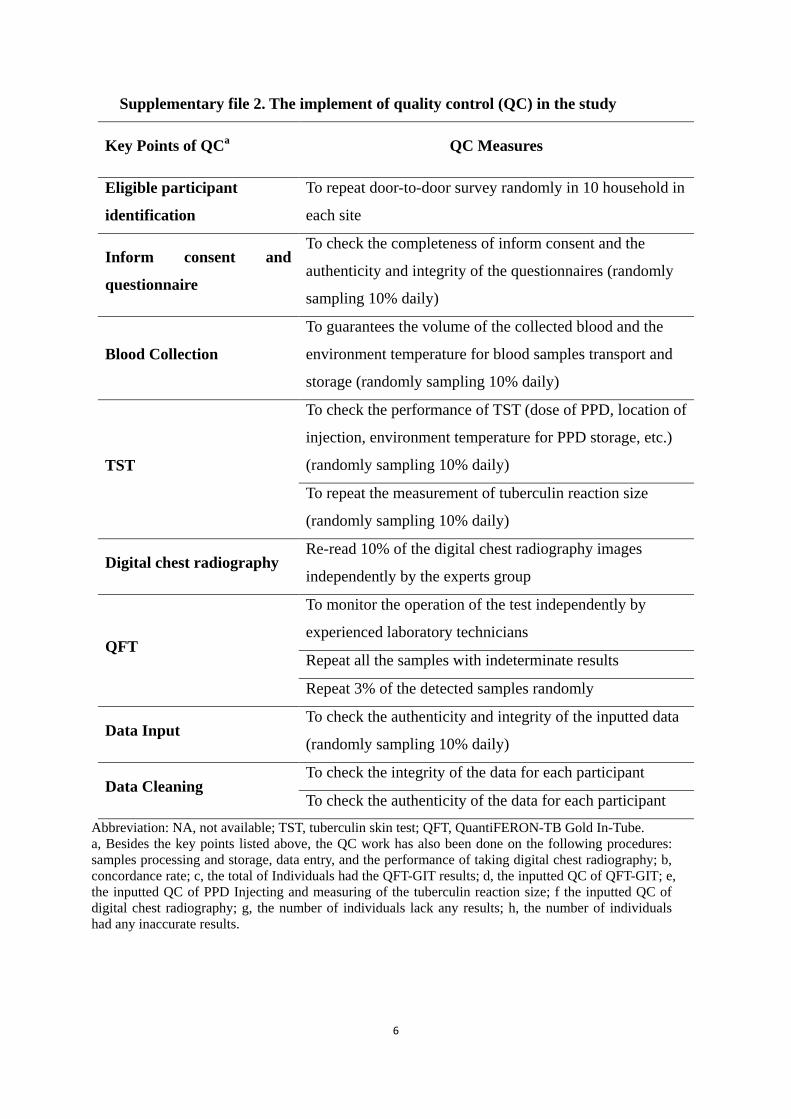
Supplementary file 2. The implement of quality control (QC) in the study
Key Points of QCa QC Measures
Eligible participant
identification
To repeat door-to-door survey randomly in 10 household in
each site
Inform consent and
questionnaire
To check the completeness of inform consent and the
authenticity and integrity of the questionnaires (randomly
sampling 10% daily)
Blood Collection
To guarantees the volume of the collected blood and the
environment temperature for blood samples transport and
storage (randomly sampling 10% daily)
TST
To check the performance of TST (dose of PPD, location of
injection, environment temperature for PPD storage, etc.)
(randomly sampling 10% daily)
To repeat the measurement of tuberculin reaction size
(randomly sampling 10% daily)
Digital chest radiography Re-read 10% of the digital chest radiography images
independently by the experts group
QFT
To monitor the operation of the test independently by
experienced laboratory technicians
Repeat all the samples with indeterminate results
Repeat 3% of the detected samples randomly
Data Input To check the authenticity and integrity of the inputted data
(randomly sampling 10% daily)
Data Cleaning To check the integrity of the data for each participant
To check the authenticity of the data for each participant
Abbreviation: NA, not available; TST, tuberculin skin test; QFT, QuantiFERON-TB Gold In-Tube.
a, Besides the key points listed above, the QC work has also been done on the following procedures:
samples processing and storage, data entry, and the performance of taking digital chest radiography; b,
concordance rate; c, the total of Individuals had the QFT-GIT results; d, the inputted QC of QFT-GIT; e,
the inputted QC of PPD Injecting and measuring of the tuberculin reaction size; f the inputted QC of
digital chest radiography; g, the number of individuals lack any results; h, the number of individuals
had any inaccurate results.
7
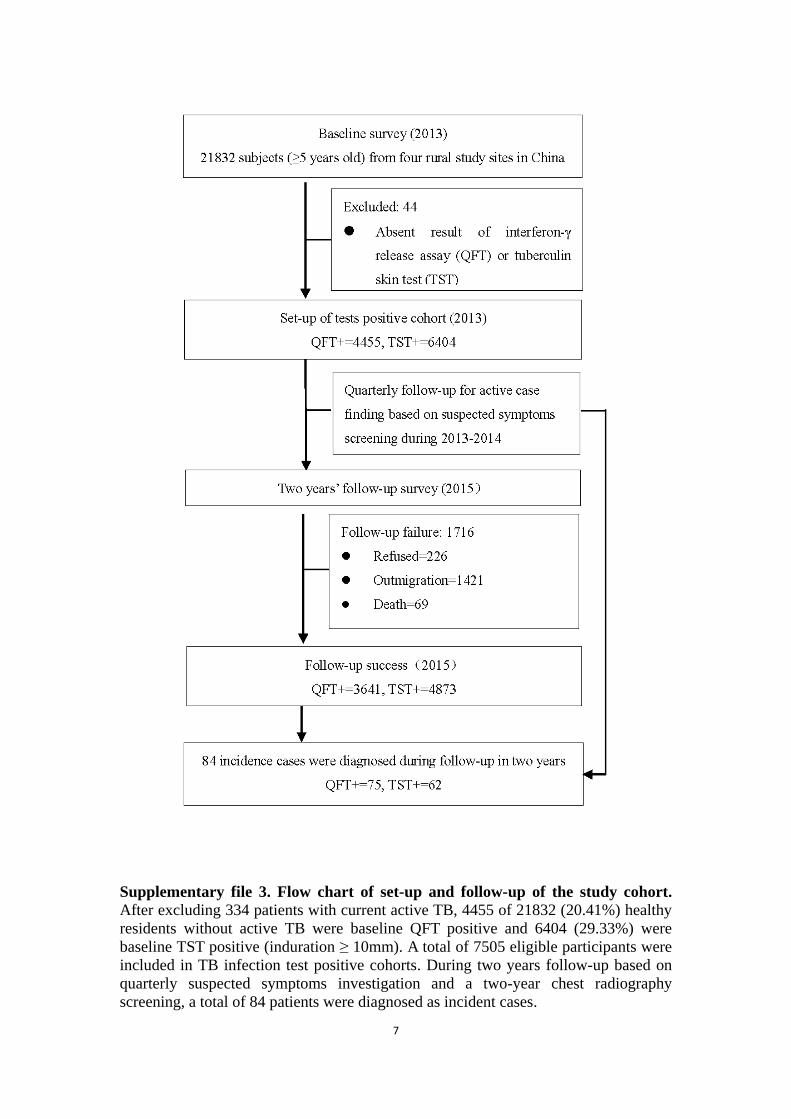
Supplementary file 3. Flow chart of set-up and follow-up of the study cohort.
After excluding 334 patients with current active TB, 4455 of 21832 (20.41%) healthy
residents without active TB were baseline QFT positive and 6404 (29.33%) were
baseline TST positive (induration ≥ 10mm). A total of 7505 eligible participants were
included in TB infection test positive cohorts. During two years follow-up based on
quarterly suspected symptoms investigation and a two-year chest radiography
screening, a total of 84 patients were diagnosed as incident cases.
8
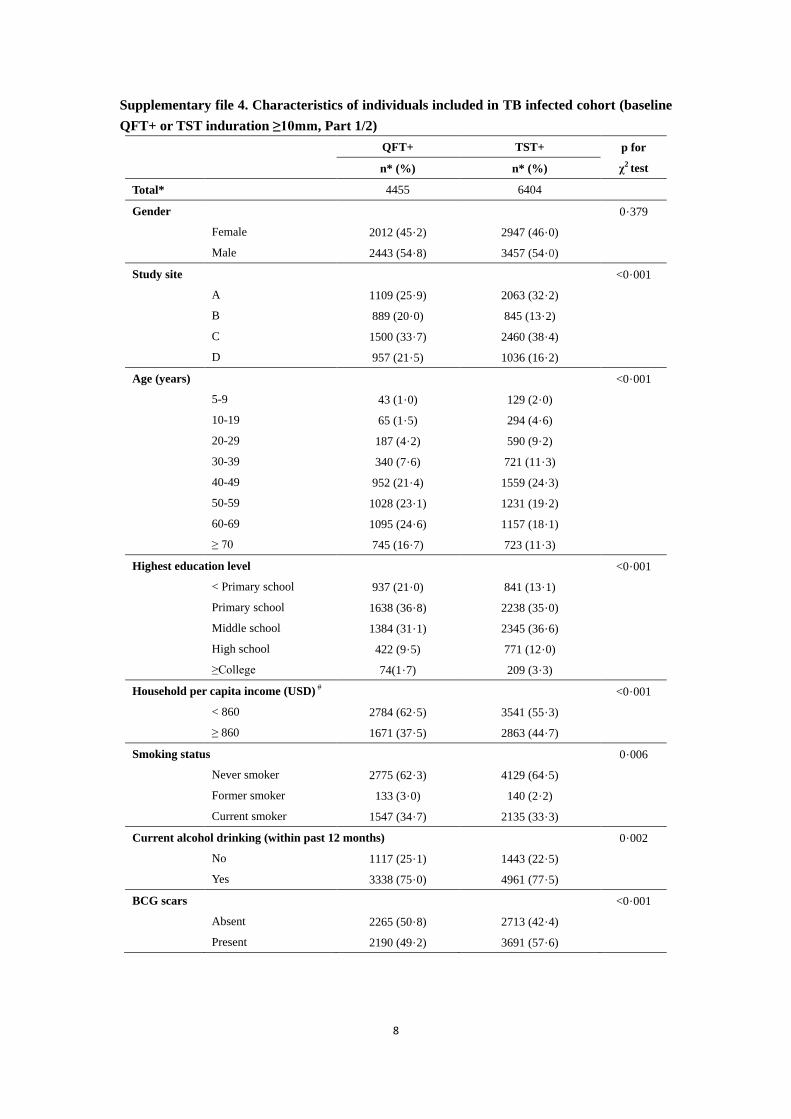
Supplementary file 4. Characteristics of individuals included in TB infected cohort (baseline
QFT+ or TST induration ≥10mm, Part 1/2)
QFT+ TST+ p for
χ2 test n* (%) n* (%)
Total* 4455 6404
Gender 0·379
Female 2012 (45·2) 2947 (46·0)
Male 2443 (54·8) 3457 (54·0)
Study site <0·001
A 1109 (25·9) 2063 (32·2)
B 889 (20·0) 845 (13·2)
C 1500 (33·7) 2460 (38·4)
D 957 (21·5) 1036 (16·2)
Age (years) <0·001
5-9 43 (1·0) 129 (2·0)
10-19 65 (1·5) 294 (4·6)
20-29 187 (4·2) 590 (9·2)
30-39 340 (7·6) 721 (11·3)
40-49 952 (21·4) 1559 (24·3)
50-59 1028 (23·1) 1231 (19·2)
60-69 1095 (24·6) 1157 (18·1)
≥ 70 745 (16·7) 723 (11·3)
Highest education level <0·001
< Primary school 937 (21·0) 841 (13·1)
Primary school 1638 (36·8) 2238 (35·0)
Middle school 1384 (31·1) 2345 (36·6)
High school 422 (9·5) 771 (12·0)
≥College 74(1·7) 209 (3·3)
Household per capita income (USD) #
<0·001
< 860 2784 (62·5) 3541 (55·3)
≥ 860 1671 (37·5) 2863 (44·7)
Smoking status 0·006
Never smoker 2775 (62·3) 4129 (64·5)
Former smoker 133 (3·0) 140 (2·2)
Current smoker 1547 (34·7) 2135 (33·3)
Current alcohol drinking (within past 12 months) 0·002
No 1117 (25·1) 1443 (22·5)
Yes 3338 (75·0) 4961 (77·5)
BCG scars <0·001
Absent 2265 (50·8) 2713 (42·4)
Present 2190 (49·2) 3691 (57·6)

9
Supplementary file 4. Characteristics of individuals included in TB infected cohort (baseline
QFT+ or TST induration ≥ 10mm, Part 2/2)
QFT+ TST+ p for
χ2 test n* (%) n* (%)
BMI (kg/m2)
<18·5 299 (6·7) 557 (8·7) 0·001
≥18·5-<24 2307 (51·8) 3328 (52·0)
≥24-<28 1361 (30·6) 1881 (29·4)
≥28 488 (11·0) 637 (10·0)
Self-reported history of T2D 0·745
No 4160 (93·4) 5990 (93·5)
Yes 295 (6·6) 414 (6·5)
Self-reported history of immunological diseases 0·875
No 4383 (98·4) 6298 (98·3)
Yes 72 (1·6) 106 (1·7)
Self-reported history of household close contacts* 0·259
No 4223 (95·5) 6091 (95·7)
Yes (2 years ago) 152 (3·4) 188 (3·0)
Yes (in 2 years) 59 (1·3) 98 (1·5)
History of prior TB& <0·001
No 3964 (88·98) 5863 (91·55)
Yes 491 (11·02) 541 (8·45)
Abbreviation: BCG, bacille Calmette–Guérin; BMI, body mass index; QFT, QuantiFERON-TB Gold In-Tube; TB,
tuberculosis; TST, tuberculin skin test; T2D, type 2 diabetes.
*Data may not sum to total due to missing data.
#Grouped by the national mean level (6000 RMB) in 2010 (China Statistical Yearbook-2010. China Statistics
Press, 2010).
&Self-reported or baseline identified with fibrotic chest radiography abnormalities.
10
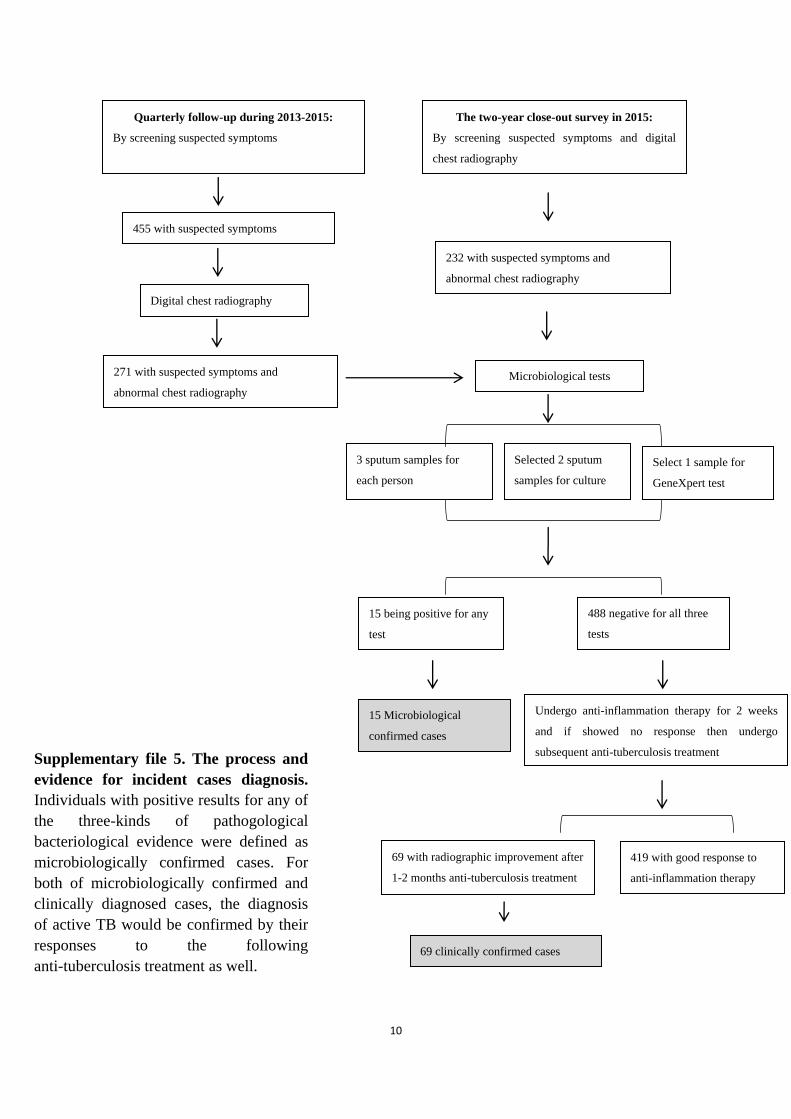
455 with suspected symptoms
Quarterly follow-up during 2013-2015:
By screening suspected symptoms
The two-year close-out survey in 2015:
By screening suspected symptoms and digital
chest radiography
232 with suspected symptoms and
abnormal chest radiography
Digital chest radiography
3 sputum samples for
each person
Selected 2 sputum
samples for culture
Select 1 sample for
GeneXpert test
Microbiological tests
15 being positive for any
test
488 negative for all three
tests
271 with suspected symptoms and
abnormal chest radiography
Undergo anti-inflammation therapy for 2 weeks
and if showed no response then undergo
subsequent anti-tuberculosis treatment
15 Microbiological
confirmed cases
419 with good response to
anti-inflammation therapy
69 clinically confirmed cases
69 with radiographic improvement after
1-2 months anti-tuberculosis treatment
Supplementary file 5. The process and
evidence for incident cases diagnosis.
Individuals with positive results for any of
the three-kinds of pathogological
bacteriological evidence were defined as
microbiologically confirmed cases. For
both of microbiologically confirmed and
clinically diagnosed cases, the diagnosis
of active TB would be confirmed by their
responses to the following
anti-tuberculosis treatment as well.

11
Supplementary file 6. The detailed information on diagnosis for each incident case (Part 1/4)
Site ID Gender Age (years) Year of diagnosis Evidence for diagnosis
Sputum tests Gene-Xpert Response to treatment
Microbiologically confirmed
D 21217301 Female 29 2015 Smear positive N/A Yes
C 11038706 Male 66 2014 Smear positive N/A Yes
C 11039501 Male 49 2014 Smear positive N/A Yes
C 12001702 Male 70 2014 Smear positive N/A Yes
C 13027302 Male 78 2014 Smear-positive N/A Yes
A 32008403 Female 43 2015 Smear negative, culture positive Positive Yes
A 32056403 Male 22 2015 Smear negative, culture positive Positive Yes
B 51000201 Male 46 2014 Smear negative, culture positive Positive Yes
B 51061601 Male 75 2014 Smear negative, culture positive Positive Yes
B 51083202 Female 73 2014 Smear negative, culture positive Positive Yes
B 51244401 Male 56 2014 Smear negative, culture positive Positive Yes
C 12000301 Male 69 2015 Smear negative, culture positive Positive Yes
C 11034801 Male 57 2014 Smear negative, culture positive Positive Yes
A 32024401 Male 78 2015 Smear and culture negative Positive Yes
D 23604201 Female 66 2015 Smear and culture negative Positive Yes
Clinically diagnosed
C 11023301 Female 57 2015 Smear and culture negative Negative Yes
C 12004002 Male 56 2014 Smear and culture negative Negative Yes
C 12020303 Male 65 2014 Smear and culture negative Negative Yes
C 12023101 Male 66 2015 Smear and culture negative Negative Yes
C 13001902 Male 48 2014 Smear and culture negative Negative Yes
C 13004101 Male 52 2015 Smear and culture negative Negative Yes
12
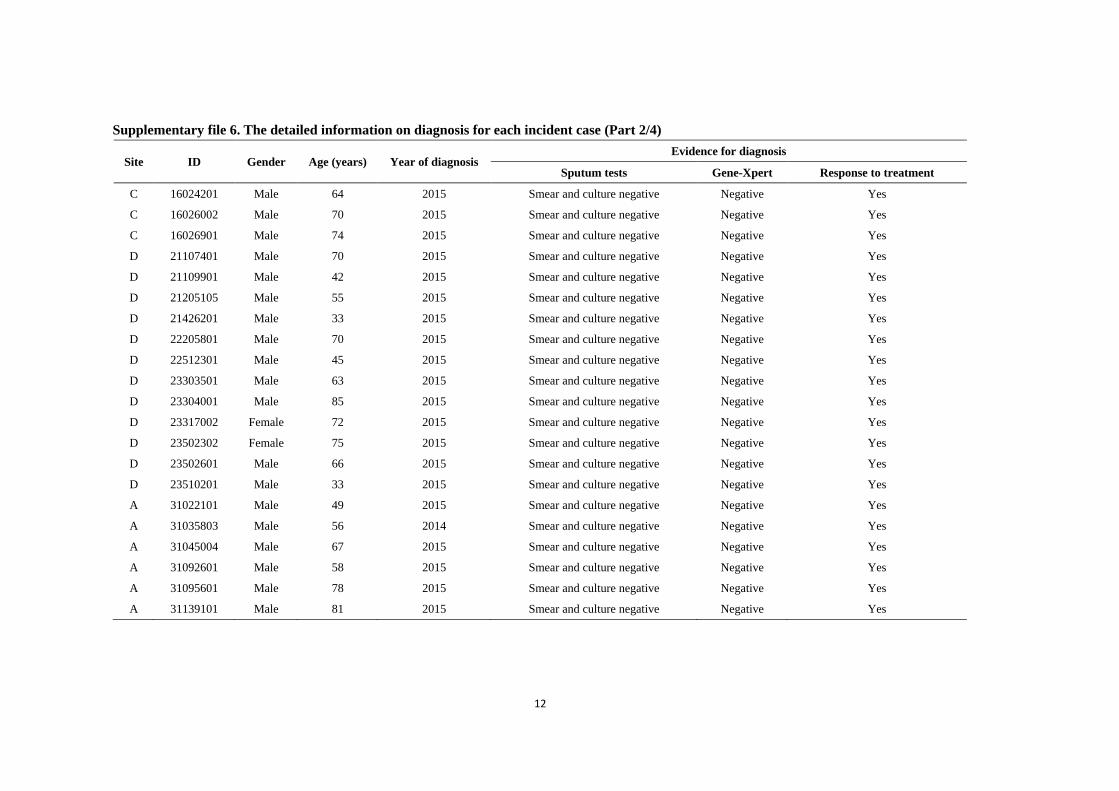
Supplementary file 6. The detailed information on diagnosis for each incident case (Part 2/4)
Site ID Gender Age (years) Year of diagnosis Evidence for diagnosis
Sputum tests Gene-Xpert Response to treatment
C 16024201 Male 64 2015 Smear and culture negative Negative Yes
C 16026002 Male 70 2015 Smear and culture negative Negative Yes
C 16026901 Male 74 2015 Smear and culture negative Negative Yes
D 21107401 Male 70 2015 Smear and culture negative Negative Yes
D 21109901 Male 42 2015 Smear and culture negative Negative Yes
D 21205105 Male 55 2015 Smear and culture negative Negative Yes
D 21426201 Male 33 2015 Smear and culture negative Negative Yes
D 22205801 Male 70 2015 Smear and culture negative Negative Yes
D 22512301 Male 45 2015 Smear and culture negative Negative Yes
D 23303501 Male 63 2015 Smear and culture negative Negative Yes
D 23304001 Male 85 2015 Smear and culture negative Negative Yes
D 23317002 Female 72 2015 Smear and culture negative Negative Yes
D 23502302 Female 75 2015 Smear and culture negative Negative Yes
D 23502601 Male 66 2015 Smear and culture negative Negative Yes
D 23510201 Male 33 2015 Smear and culture negative Negative Yes
A 31022101 Male 49 2015 Smear and culture negative Negative Yes
A 31035803 Male 56 2014 Smear and culture negative Negative Yes
A 31045004 Male 67 2015 Smear and culture negative Negative Yes
A 31092601 Male 58 2015 Smear and culture negative Negative Yes
A 31095601 Male 78 2015 Smear and culture negative Negative Yes
A 31139101 Male 81 2015 Smear and culture negative Negative Yes
13
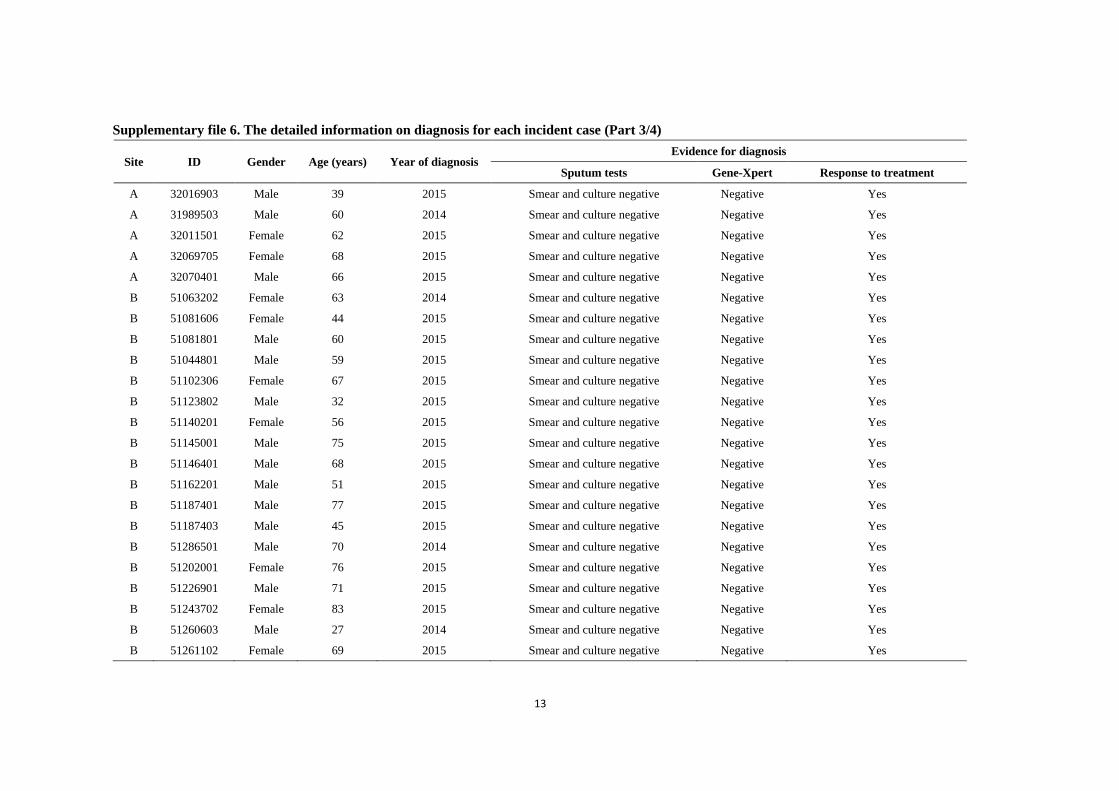
Supplementary file 6. The detailed information on diagnosis for each incident case (Part 3/4)
Site ID Gender Age (years) Year of diagnosis Evidence for diagnosis
Sputum tests Gene-Xpert Response to treatment
A 32016903 Male 39 2015 Smear and culture negative Negative Yes
A 31989503 Male 60 2014 Smear and culture negative Negative Yes
A 32011501 Female 62 2015 Smear and culture negative Negative Yes
A 32069705 Female 68 2015 Smear and culture negative Negative Yes
A 32070401 Male 66 2015 Smear and culture negative Negative Yes
B 51063202 Female 63 2014 Smear and culture negative Negative Yes
B 51081606 Female 44 2015 Smear and culture negative Negative Yes
B 51081801 Male 60 2015 Smear and culture negative Negative Yes
B 51044801 Male 59 2015 Smear and culture negative Negative Yes
B 51102306 Female 67 2015 Smear and culture negative Negative Yes
B 51123802 Male 32 2015 Smear and culture negative Negative Yes
B 51140201 Female 56 2015 Smear and culture negative Negative Yes
B 51145001 Male 75 2015 Smear and culture negative Negative Yes
B 51146401 Male 68 2015 Smear and culture negative Negative Yes
B 51162201 Male 51 2015 Smear and culture negative Negative Yes
B 51187401 Male 77 2015 Smear and culture negative Negative Yes
B 51187403 Male 45 2015 Smear and culture negative Negative Yes
B 51286501 Male 70 2014 Smear and culture negative Negative Yes
B 51202001 Female 76 2015 Smear and culture negative Negative Yes
B 51226901 Male 71 2015 Smear and culture negative Negative Yes
B 51243702 Female 83 2015 Smear and culture negative Negative Yes
B 51260603 Male 27 2014 Smear and culture negative Negative Yes
B 51261102 Female 69 2015 Smear and culture negative Negative Yes

14
Supplementary file 6. The detailed information on diagnosis for each incident case (Part 4/4)
Site ID Gender Age (years) Year of diagnosis Evidence for diagnosis
Sputum tests Gene-Xpert Response to treatment
B 52009601 Female 71 2015 Smear and culture negative Negative Yes
B 52028201 Male 73 2015 Smear and culture negative Negative Yes
B 52047301 Female 50 2014 Smear and culture negative Negative Yes
B 52062701 Male 44 2015 Smear and culture negative Negative Yes
B 52066603 Male 75 2015 Smear and culture negative Negative Yes
B 52067001 Male 42 2015 Smear and culture negative Negative Yes
B 52080102 Female 57 2015 Smear and culture negative Negative Yes
B 53001603 Male 35 2014 Smear and culture negative Negative Yes
C 13011604 Male 77 2015 Smear and culture negative Negative Yes
C 14002201 Male 46 2015 Smear and culture negative Negative Yes
C 14009201 Male 36 2015 Smear and culture negative Negative Yes
C 14010901 Female 69 2015 Smear and culture negative Negative Yes
C 15024502 Female 45 2015 Smear and culture negative Negative Yes
C 15025704 Male 79 2015 Smear and culture negative Negative Yes
C 15031501 Male 54 2014 Smear and culture negative Negative Yes
C 15033302 Female 58 2014 Smear and culture negative Negative Yes
C 15037202 Female 70 2015 Smear and culture negative Negative Yes
C 16004601 Male 70 2015 Smear and culture negative Negative Yes
C 16021802 Male 81 2015 Smear and culture negative Negative Yes
Abbreviation: N/A, not available; TB, tuberculosis.
15
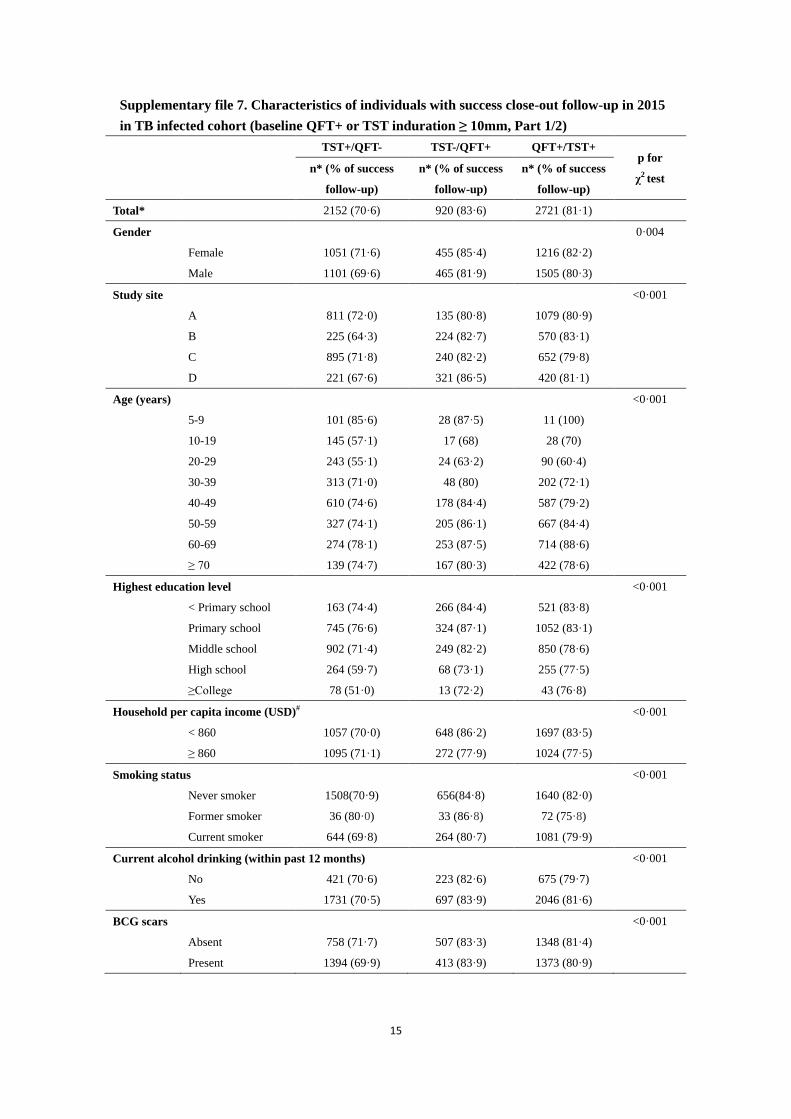
Supplementary file 7. Characteristics of individuals with success close-out follow-up in 2015
in TB infected cohort (baseline QFT+ or TST induration ≥ 10mm, Part 1/2)
TST+/QFT- TST-/QFT+ QFT+/TST+ p for
χ2 test
n* (% of success
follow-up)
n* (% of success
follow-up)
n* (% of success
follow-up)
Total* 2152 (70·6) 920 (83·6) 2721 (81·1)
Gender 0·004
Female 1051 (71·6) 455 (85·4) 1216 (82·2)
Male 1101 (69·6) 465 (81·9) 1505 (80·3)
Study site <0·001
A 811 (72·0) 135 (80·8) 1079 (80·9)
B 225 (64·3) 224 (82·7) 570 (83·1)
C 895 (71·8) 240 (82·2) 652 (79·8)
D 221 (67·6) 321 (86·5) 420 (81·1)
Age (years) <0·001
5-9 101 (85·6) 28 (87·5) 11 (100)
10-19 145 (57·1) 17 (68) 28 (70)
20-29 243 (55·1) 24 (63·2) 90 (60·4)
30-39 313 (71·0) 48 (80) 202 (72·1)
40-49 610 (74·6) 178 (84·4) 587 (79·2)
50-59 327 (74·1) 205 (86·1) 667 (84·4)
60-69 274 (78·1) 253 (87·5) 714 (88·6)
≥ 70 139 (74·7) 167 (80·3) 422 (78·6)
Highest education level <0·001
< Primary school 163 (74·4) 266 (84·4) 521 (83·8)
Primary school 745 (76·6) 324 (87·1) 1052 (83·1)
Middle school 902 (71·4) 249 (82·2) 850 (78·6)
High school 264 (59·7) 68 (73·1) 255 (77·5)
≥College 78 (51·0) 13 (72·2) 43 (76·8)
Household per capita income (USD)# <0·001
< 860 1057 (70·0) 648 (86·2) 1697 (83·5)
≥ 860 1095 (71·1) 272 (77·9) 1024 (77·5)
Smoking status <0·001
Never smoker 1508(70·9) 656(84·8) 1640 (82·0)
Former smoker 36 (80·0) 33 (86·8) 72 (75·8)
Current smoker 644 (69·8) 264 (80·7) 1081 (79·9)
Current alcohol drinking (within past 12 months) <0·001
No 421 (70·6) 223 (82·6) 675 (79·7)
Yes 1731 (70·5) 697 (83·9) 2046 (81·6)
BCG scars <0·001
Absent 758 (71·7) 507 (83·3) 1348 (81·4)
Present 1394 (69·9) 413 (83·9) 1373 (80·9)
16
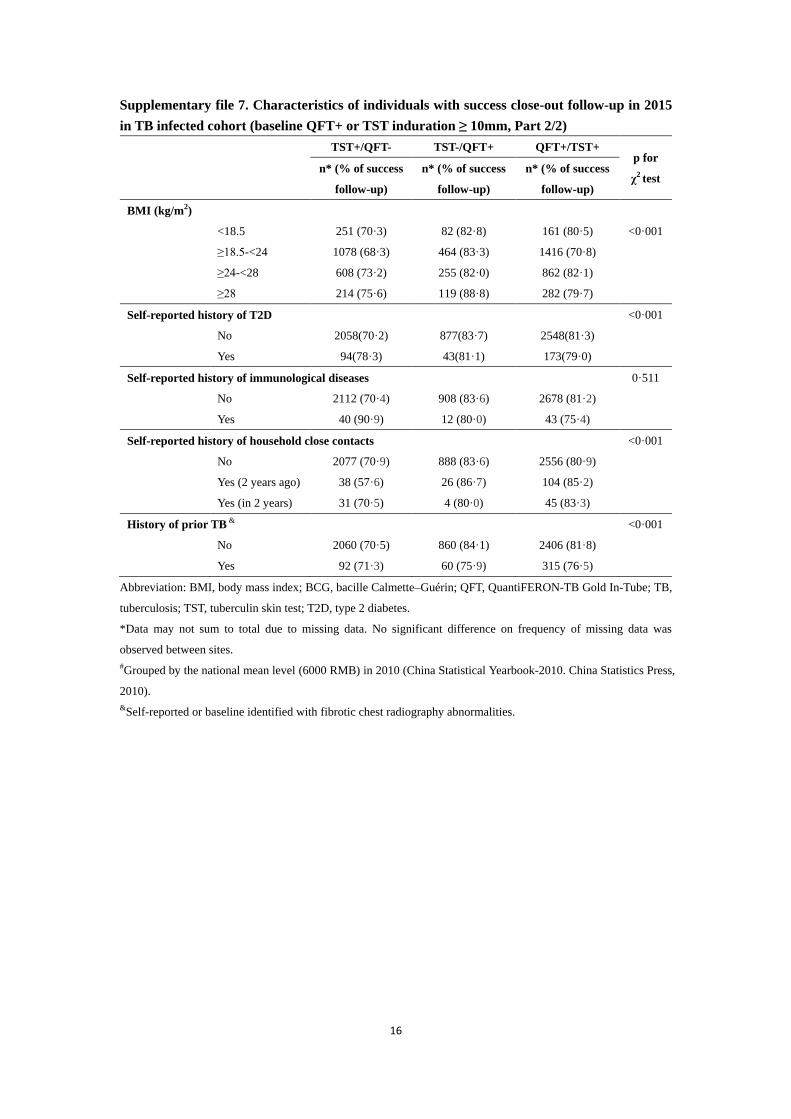
Supplementary file 7. Characteristics of individuals with success close-out follow-up in 2015
in TB infected cohort (baseline QFT+ or TST induration ≥ 10mm, Part 2/2)
TST+/QFT- TST-/QFT+ QFT+/TST+ p for
χ2 test
n* (% of success
follow-up)
n* (% of success
follow-up)
n* (% of success
follow-up)
BMI (kg/m2)
<18.5 251 (70·3) 82 (82·8) 161 (80·5) <0·001
≥18.5-<24 1078 (68·3) 464 (83·3) 1416 (70·8)
≥24-<28 608 (73·2) 255 (82·0) 862 (82·1)
≥28 214 (75·6) 119 (88·8) 282 (79·7)
Self-reported history of T2D <0·001
No 2058(70·2) 877(83·7) 2548(81·3)
Yes 94(78·3) 43(81·1) 173(79·0)
Self-reported history of immunological diseases 0·511
No 2112 (70·4) 908 (83·6) 2678 (81·2)
Yes 40 (90·9) 12 (80·0) 43 (75·4)
Self-reported history of household close contacts <0·001
No 2077 (70·9) 888 (83·6) 2556 (80·9)
Yes (2 years ago) 38 (57·6) 26 (86·7) 104 (85·2)
Yes (in 2 years) 31 (70·5) 4 (80·0) 45 (83·3)
History of prior TB & <0·001
No 2060 (70·5) 860 (84·1) 2406 (81·8)
Yes 92 (71·3) 60 (75·9) 315 (76·5)
Abbreviation: BMI, body mass index; BCG, bacille Calmette–Guérin; QFT, QuantiFERON-TB Gold In-Tube; TB,
tuberculosis; TST, tuberculin skin test; T2D, type 2 diabetes.
*Data may not sum to total due to missing data. No significant difference on frequency of missing data was
observed between sites.
#Grouped by the national mean level (6000 RMB) in 2010 (China Statistical Yearbook-2010. China Statistics Press,
2010).
&Self-reported or baseline identified with fibrotic chest radiography abnormalities.

17
Supplementary file 8. Risk of active TB among baseline QFT positives when using different
cut-off values
Cut-off values
of baseline QFT
(IU/ml)
Number of
positives
Number of
incidence cases
Person Time
(person-years)
Incidence
density
Cumulative
incidence HR (95% CI)
0.35 4302 72 8300 0·87 1·67 4·01 (2·17, 7·38)
0.40 4091 68 7890·3 0·86 1·66 3·20 (1·88, 5·52)
0.45 3911 64 7542·3 0·85 1·64 2·67 (1·62, 4·41)
0.50 3748 61 7230·3 0·84 1·63 2·41 (1·49, 3·90)
0.55 3602 56 6950 0·81 1·55 1·97 (1·25, 3·10)
0.60 3480 53 6715 0·79 1·52 1·80 (1·16, 2·81)
0.65 3349 52 6460·5 0·80 1·55 1·85 (1·19, 2·88)
0.70 3240 52 6247·8 0·83 1·60 1·97 (1·27, 3·06)
0.75 3136 51 6044·8 0·84 1·63 1·99 (1·28, 3·08)
0.80 3041 50 5863·5 0·85 1·64 2·00 (1·29, 3·08)
0.85 2963 49 5710·3 0·86 1·65 1·99 (1·29, 3·07)
0.90 2886 49 5560 0·88 1·70 2·09 (1·35, 3·22)
0.95 2813 48 5418 0·89 1·71 2·07 (1·35, 3·19)
1.00 2757 48 5308·5 0·90 1·74 2·14 (1·39, 3·30)
1.05 2682 46 5160·5 0·89 1·72 2·04 (1·33, 3·14)
1.10 2612 46 5025 0·92 1·76 2·13 (1·39, 3·28)
1.15 2548 46 4903·3 0·94 1·81 2·21 (1·44, 3·40)
1.20 2489 46 4786·3 0·96 1·85 2·31 (1·50, 3·54)
1.25 2433 46 4678·5 0·98 1·89 2·39 (1·55, 3·67)
1.30 2381 46 4577·5 1·00 1·93 2·47 (1·61, 3·80)
1.35 2320 45 4459 1·01 1·94 2·45 (1·60, 3·77)
1.40 2260 44 4345·5 1·01 1·95 2·42 (1·58, 3·71)
1.45 2212 41 4251·5 0·96 1·85 2·17 (1·41, 3·33)
1.50 2156 41 4141 0·99 1·90 2·26 (1·47, 3·46)
2.00 1782 38 3424·3 1·11 2·13 2·55 (1·66, 3·91)
5.00 708 17 1362·3 1·25 2·40 2·32 (1·36, 3·94)
Abbreviation: CI, confidence interval; HR, hazard ratio; QFT, QuantiFERON-TB Gold In-Tube; TB, tuberculosis.
18
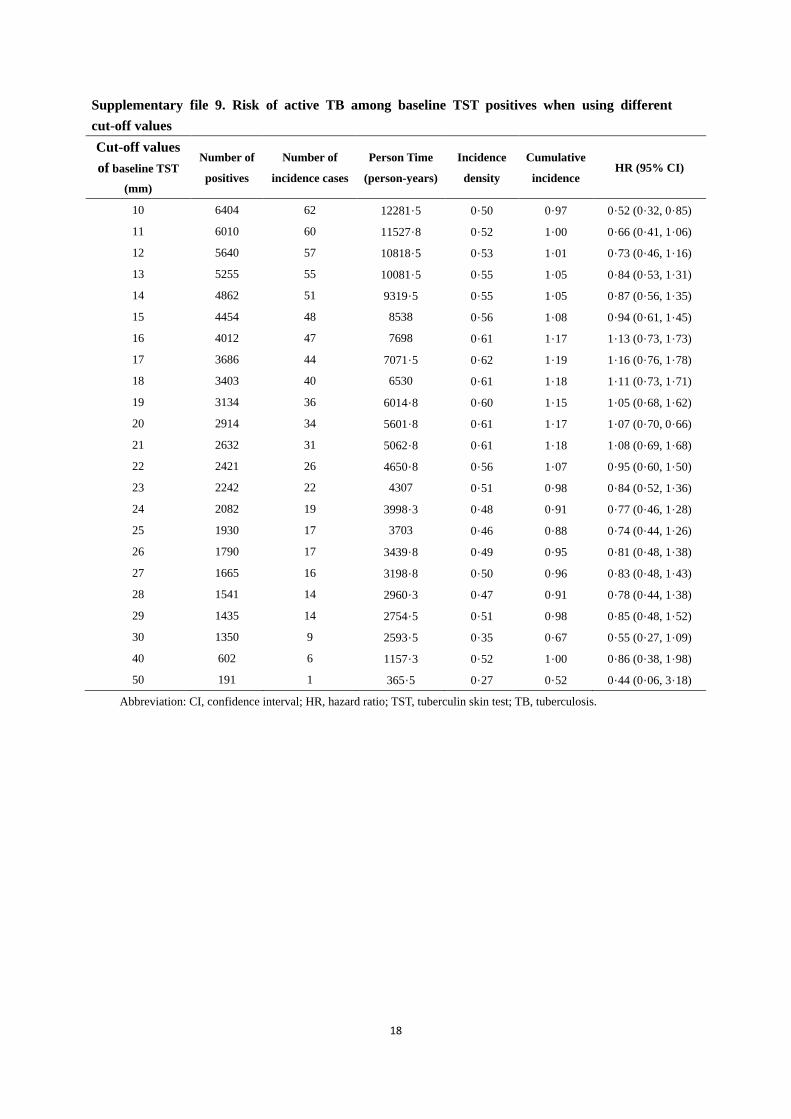
Supplementary file 9. Risk of active TB among baseline TST positives when using different
cut-off values
Cut-off values
of baseline TST
(mm)
Number of
positives
Number of
incidence cases
Person Time
(person-years)
Incidence
density
Cumulative
incidence HR (95% CI)
10 6404 62 12281·5 0·50 0·97 0·52 (0·32, 0·85)
11 6010 60 11527·8 0·52 1·00 0·66 (0·41, 1·06)
12 5640 57 10818·5 0·53 1·01 0·73 (0·46, 1·16)
13 5255 55 10081·5 0·55 1·05 0·84 (0·53, 1·31)
14 4862 51 9319·5 0·55 1·05 0·87 (0·56, 1·35)
15 4454 48 8538 0·56 1·08 0·94 (0·61, 1·45)
16 4012 47 7698 0·61 1·17 1·13 (0·73, 1·73)
17 3686 44 7071·5 0·62 1·19 1·16 (0·76, 1·78)
18 3403 40 6530 0·61 1·18 1·11 (0·73, 1·71)
19 3134 36 6014·8 0·60 1·15 1·05 (0·68, 1·62)
20 2914 34 5601·8 0·61 1·17 1·07 (0·70, 0·66)
21 2632 31 5062·8 0·61 1·18 1·08 (0·69, 1·68)
22 2421 26 4650·8 0·56 1·07 0·95 (0·60, 1·50)
23 2242 22 4307 0·51 0·98 0·84 (0·52, 1·36)
24 2082 19 3998·3 0·48 0·91 0·77 (0·46, 1·28)
25 1930 17 3703 0·46 0·88 0·74 (0·44, 1·26)
26 1790 17 3439·8 0·49 0·95 0·81 (0·48, 1·38)
27 1665 16 3198·8 0·50 0·96 0·83 (0·48, 1·43)
28 1541 14 2960·3 0·47 0·91 0·78 (0·44, 1·38)
29 1435 14 2754·5 0·51 0·98 0·85 (0·48, 1·52)
30 1350 9 2593·5 0·35 0·67 0·55 (0·27, 1·09)
40 602 6 1157·3 0·52 1·00 0·86 (0·38, 1·98)
50 191 1 365·5 0·27 0·52 0·44 (0·06, 3·18)
Abbreviation: CI, confidence interval; HR, hazard ratio; TST, tuberculin skin test; TB, tuberculosis.
19
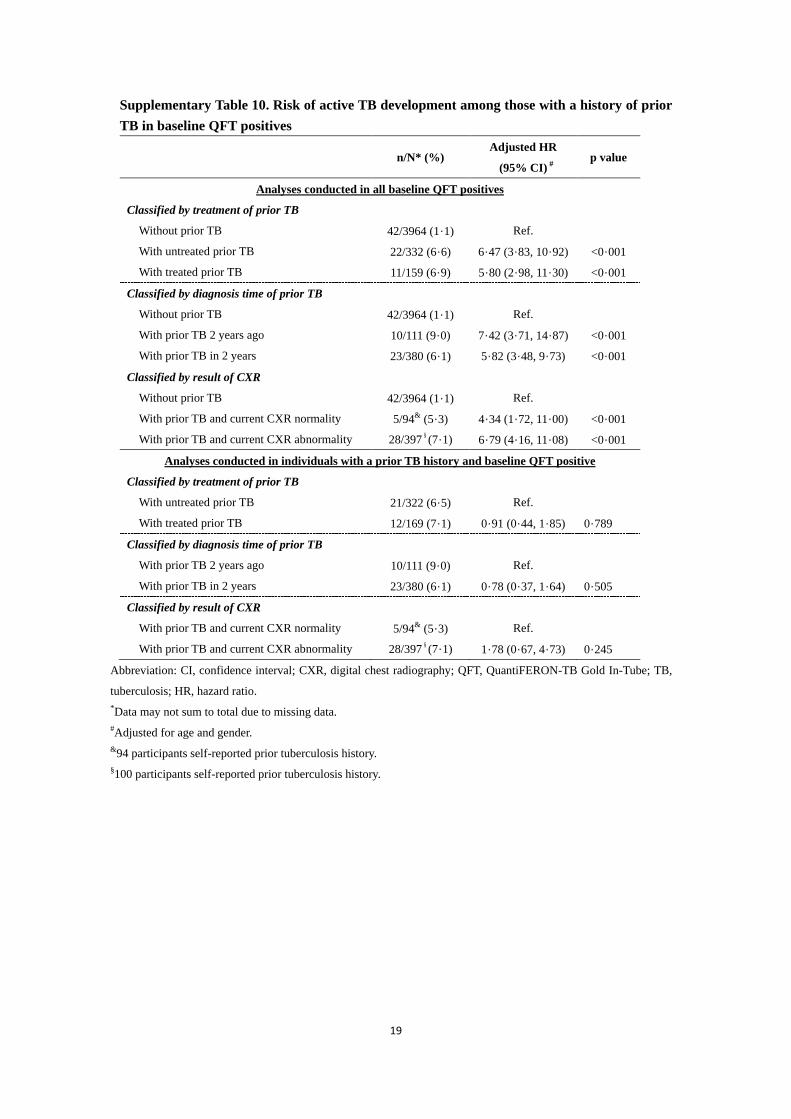
Supplementary Table 10. Risk of active TB development among those with a history of prior
TB in baseline QFT positives
n/N* (%) Adjusted HR
(95% CI) #
p value
Analyses conducted in all baseline QFT positives
Classified by treatment of prior TB
Without prior TB 42/3964 (1·1) Ref.
With untreated prior TB 22/332 (6·6) 6·47 (3·83, 10·92) <0·001
With treated prior TB 11/159 (6·9) 5·80 (2·98, 11·30) <0·001
Classified by diagnosis time of prior TB
Without prior TB 42/3964 (1·1) Ref.
With prior TB 2 years ago 10/111 (9·0) 7·42 (3·71, 14·87) <0·001
With prior TB in 2 years 23/380 (6·1) 5·82 (3·48, 9·73) <0·001
Classified by result of CXR
Without prior TB 42/3964 (1·1) Ref.
With prior TB and current CXR normality 5/94& (5·3) 4·34 (1·72, 11·00) <0·001
With prior TB and current CXR abnormality 28/397§(7·1) 6·79 (4·16, 11·08) <0·001
Analyses conducted in individuals with a prior TB history and baseline QFT positive
Classified by treatment of prior TB
With untreated prior TB 21/322 (6·5) Ref.
With treated prior TB 12/169 (7·1) 0·91 (0·44, 1·85) 0·789
Classified by diagnosis time of prior TB
With prior TB 2 years ago 10/111 (9·0) Ref.
With prior TB in 2 years 23/380 (6·1) 0·78 (0·37, 1·64) 0·505
Classified by result of CXR
With prior TB and current CXR normality 5/94& (5·3) Ref.
With prior TB and current CXR abnormality 28/397§(7·1) 1·78 (0·67, 4·73) 0·245
Abbreviation: CI, confidence interval; CXR, digital chest radiography; QFT, QuantiFERON-TB Gold In-Tube; TB,
tuberculosis; HR, hazard ratio.
*Data may not sum to total due to missing data.
#Adjusted for age and gender.
&94 participants self-reported prior tuberculosis history.
§100 participants self-reported prior tuberculosis history.
20
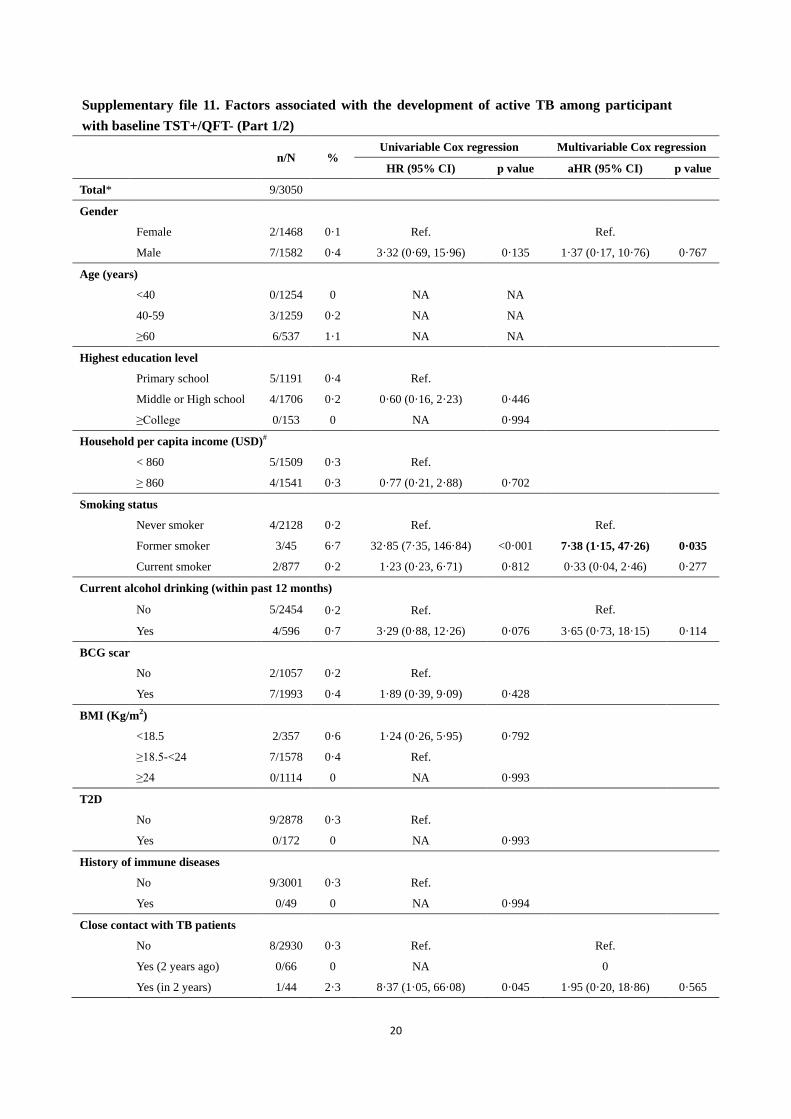
Supplementary file 11. Factors associated with the development of active TB among participant
with baseline TST+/QFT- (Part 1/2)
n/N % Univariable Cox regression Multivariable Cox regression
HR (95% CI) p value aHR (95% CI) p value
Total* 9/3050
Gender
Female 2/1468 0·1 Ref. Ref.
Male 7/1582 0·4 3·32 (0·69, 15·96) 0·135 1·37 (0·17, 10·76) 0·767
Age (years)
<40 0/1254 0 NA NA
40-59 3/1259 0·2 NA NA
≥60 6/537 1·1 NA NA
Highest education level
Primary school 5/1191 0·4 Ref.
Middle or High school 4/1706 0·2 0·60 (0·16, 2·23) 0·446
≥College 0/153 0 NA 0·994
Household per capita income (USD)#
< 860 5/1509 0·3 Ref.
≥ 860 4/1541 0·3 0·77 (0·21, 2·88) 0·702
Smoking status
Never smoker 4/2128 0·2 Ref. Ref.
Former smoker 3/45 6·7 32·85 (7·35, 146·84) <0·001 7·38 (1·15, 47·26) 0·035
Current smoker 2/877 0·2 1·23 (0·23, 6·71) 0·812 0·33 (0·04, 2·46) 0·277
Current alcohol drinking (within past 12 months)
No 5/2454 0·2 Ref. Ref.
Yes 4/596 0·7 3·29 (0·88, 12·26) 0·076 3·65 (0·73, 18·15) 0·114
BCG scar
No 2/1057 0·2 Ref.
Yes 7/1993 0·4 1·89 (0·39, 9·09) 0·428
BMI (Kg/m2)
<18.5 2/357 0·6 1·24 (0·26, 5·95) 0·792
≥18.5-<24 7/1578 0·4 Ref.
≥24 0/1114 0 NA 0·993
T2D
No 9/2878 0·3 Ref.
Yes 0/172 0 NA 0·993
History of immune diseases
No 9/3001 0·3 Ref.
Yes 0/49 0 NA 0·994
Close contact with TB patients
No 8/2930 0·3 Ref. Ref.
Yes (2 years ago) 0/66 0 NA 0
Yes (in 2 years) 1/44 2·3 8·37 (1·05, 66·08) 0·045 1·95 (0·20, 18·86) 0·565
21
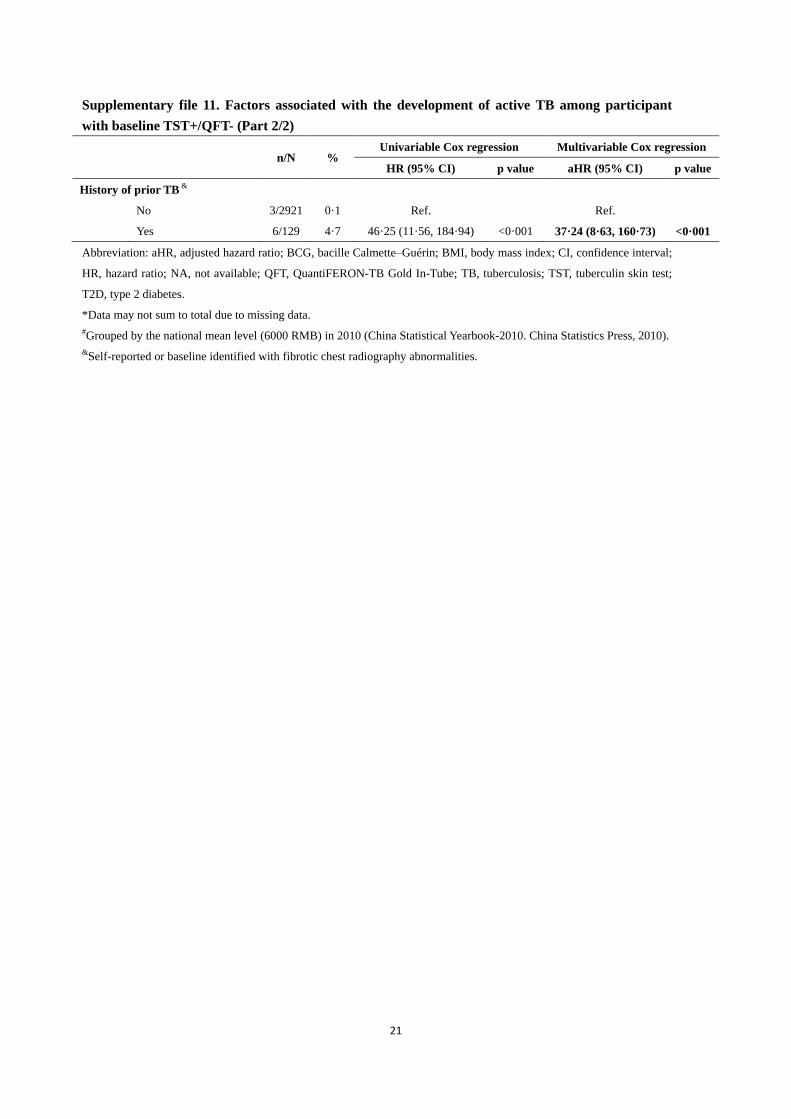
Supplementary file 11. Factors associated with the development of active TB among participant
with baseline TST+/QFT- (Part 2/2)
n/N %
Univariable Cox regression Multivariable Cox regression
HR (95% CI) p value aHR (95% CI) p value
History of prior TB &
No 3/2921 0·1 Ref. Ref.
Yes 6/129 4·7 46·25 (11·56, 184·94) <0·001 37·24 (8·63, 160·73) <0·001
Abbreviation: aHR, adjusted hazard ratio; BCG, bacille Calmette–Guérin; BMI, body mass index; CI, confidence interval;
HR, hazard ratio; NA, not available; QFT, QuantiFERON-TB Gold In-Tube; TB, tuberculosis; TST, tuberculin skin test;
T2D, type 2 diabetes.
*Data may not sum to total due to missing data.
#Grouped by the national mean level (6000 RMB) in 2010 (China Statistical Yearbook-2010. China Statistics Press, 2010).
&Self-reported or baseline identified with fibrotic chest radiography abnormalities.
22
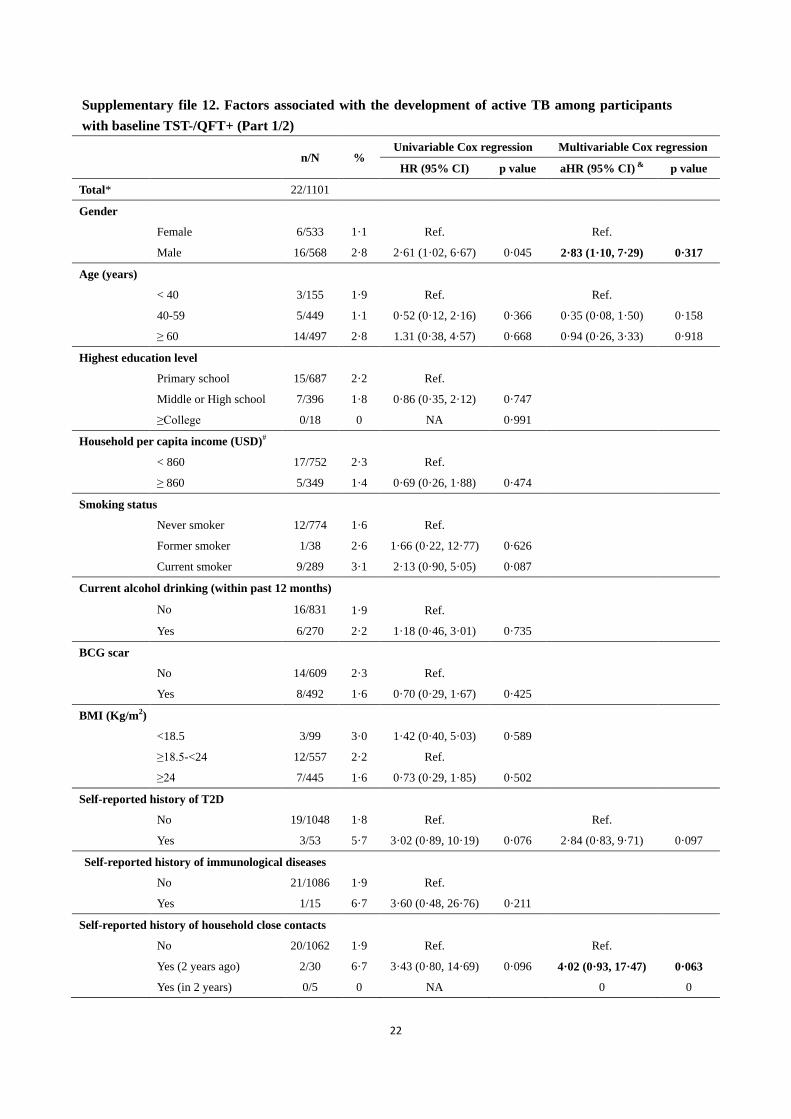
Supplementary file 12. Factors associated with the development of active TB among participants
with baseline TST-/QFT+ (Part 1/2)
n/N % Univariable Cox regression Multivariable Cox regression
HR (95% CI) p value aHR (95% CI) &
p value
Total* 22/1101
Gender
Female 6/533 1·1 Ref. Ref.
Male 16/568 2·8 2·61 (1·02, 6·67) 0·045 2·83 (1·10, 7·29) 0·317
Age (years)
< 40 3/155 1·9 Ref. Ref.
40-59 5/449 1·1 0·52 (0·12, 2·16) 0·366 0·35 (0·08, 1·50) 0·158
≥ 60 14/497 2·8 1.31 (0·38, 4·57) 0·668 0·94 (0·26, 3·33) 0·918
Highest education level
Primary school 15/687 2·2 Ref.
Middle or High school 7/396 1·8 0·86 (0·35, 2·12) 0·747
≥College 0/18 0 NA 0·991
Household per capita income (USD)#
< 860 17/752 2·3 Ref.
≥ 860 5/349 1·4 0·69 (0·26, 1·88) 0·474
Smoking status
Never smoker 12/774 1·6 Ref.
Former smoker 1/38 2·6 1·66 (0·22, 12·77) 0·626
Current smoker 9/289 3·1 2·13 (0·90, 5·05) 0·087
Current alcohol drinking (within past 12 months)
No 16/831 1·9 Ref.
Yes 6/270 2·2 1·18 (0·46, 3·01) 0·735
BCG scar
No 14/609 2·3 Ref.
Yes 8/492 1·6 0·70 (0·29, 1·67) 0·425
BMI (Kg/m2)
<18.5 3/99 3·0 1·42 (0·40, 5·03) 0·589
≥18.5-<24 12/557 2·2 Ref.
≥24 7/445 1·6 0·73 (0·29, 1·85) 0·502
Self-reported history of T2D
No 19/1048 1·8 Ref. Ref.
Yes 3/53 5·7 3·02 (0·89, 10·19) 0·076 2·84 (0·83, 9·71) 0·097
Self-reported history of immunological diseases
No 21/1086 1·9 Ref.
Yes 1/15 6·7 3·60 (0·48, 26·76) 0·211
Self-reported history of household close contacts
No 20/1062 1·9 Ref. Ref.
Yes (2 years ago) 2/30 6·7 3·43 (0·80, 14·69) 0·096 4·02 (0·93, 17·47) 0·063
Yes (in 2 years) 0/5 0 NA 0 0

23
Supplementary file 12. Factors associated with the development of active TB among participant
with baseline TST-/QFT+ (Part 2/2)
n/N %
Univariable Cox regression Multivariable Cox regression
HR (95% CI) p value aHR (95% CI) p value
History of prior TB &
No 13/1022 1·3 Ref. Ref.
Yes 9/79 11·4 9·86 (4·22, 23·07) <0·001 10·30 (4·33, 24·52) <0·001
Abbreviation: aHR, adjusted hazard ratio; BCG, bacille Calmette–Guérin; BMI, body mass index; CI, confidence interval;
HR, hazard ratio; NA, not available; QFT, QuantiFERON-TB Gold In-Tube; TB, tuberculosis; TST, tuberculin skin test;
T2D, type 2 diabetes.
*Data may not sum to total due to missing data.
#Grouped by the national mean level (6000 RMB) in 2010 (China Statistical Yearbook-2010. China Statistics Press, 2010).
&Self-reported or baseline identified with fibrotic chest radiography abnormalities.
24
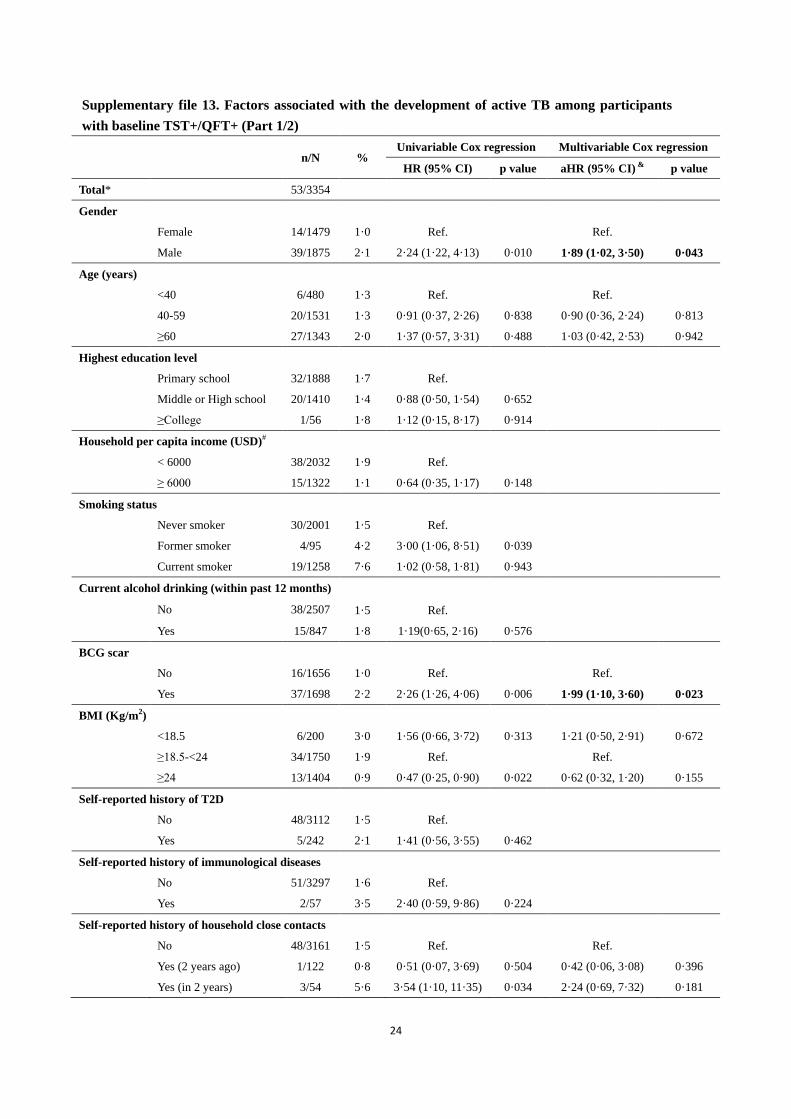
Supplementary file 13. Factors associated with the development of active TB among participants
with baseline TST+/QFT+ (Part 1/2)
n/N % Univariable Cox regression Multivariable Cox regression
HR (95% CI) p value aHR (95% CI) &
p value
Total* 53/3354
Gender
Female 14/1479 1·0 Ref. Ref.
Male 39/1875 2·1 2·24 (1·22, 4·13) 0·010 1·89 (1·02, 3·50) 0·043
Age (years)
<40 6/480 1·3 Ref. Ref.
40-59 20/1531 1·3 0·91 (0·37, 2·26) 0·838 0·90 (0·36, 2·24) 0·813
≥60 27/1343 2·0 1·37 (0·57, 3·31) 0·488 1·03 (0·42, 2·53) 0·942
Highest education level
Primary school 32/1888 1·7 Ref.
Middle or High school 20/1410 1·4 0·88 (0·50, 1·54) 0·652
≥College 1/56 1·8 1·12 (0·15, 8·17) 0·914
Household per capita income (USD)#
< 6000 38/2032 1·9 Ref.
≥ 6000 15/1322 1·1 0·64 (0·35, 1·17) 0·148
Smoking status
Never smoker 30/2001 1·5 Ref.
Former smoker 4/95 4·2 3·00 (1·06, 8·51) 0·039
Current smoker 19/1258 7·6 1·02 (0·58, 1·81) 0·943
Current alcohol drinking (within past 12 months)
No 38/2507 1·5 Ref.
Yes 15/847 1·8 1·19(0·65, 2·16) 0·576
BCG scar
No 16/1656 1·0 Ref. Ref.
Yes 37/1698 2·2 2·26 (1·26, 4·06) 0·006 1·99 (1·10, 3·60) 0·023
BMI (Kg/m2)
<18.5 6/200 3·0 1·56 (0·66, 3·72) 0·313 1·21 (0·50, 2·91) 0·672
≥18.5-<24 34/1750 1·9 Ref. Ref.
≥24 13/1404 0·9 0·47 (0·25, 0·90) 0·022 0·62 (0·32, 1·20) 0·155
Self-reported history of T2D
No 48/3112 1·5 Ref.
Yes 5/242 2·1 1·41 (0·56, 3·55) 0·462
Self-reported history of immunological diseases
No 51/3297 1·6 Ref.
Yes 2/57 3·5 2·40 (0·59, 9·86) 0·224
Self-reported history of household close contacts
No 48/3161 1·5 Ref. Ref.
Yes (2 years ago) 1/122 0·8 0·51 (0·07, 3·69) 0·504 0·42 (0·06, 3·08) 0·396
Yes (in 2 years) 3/54 5·6 3·54 (1·10, 11·35) 0·034 2·24 (0·69, 7·32) 0·181
25
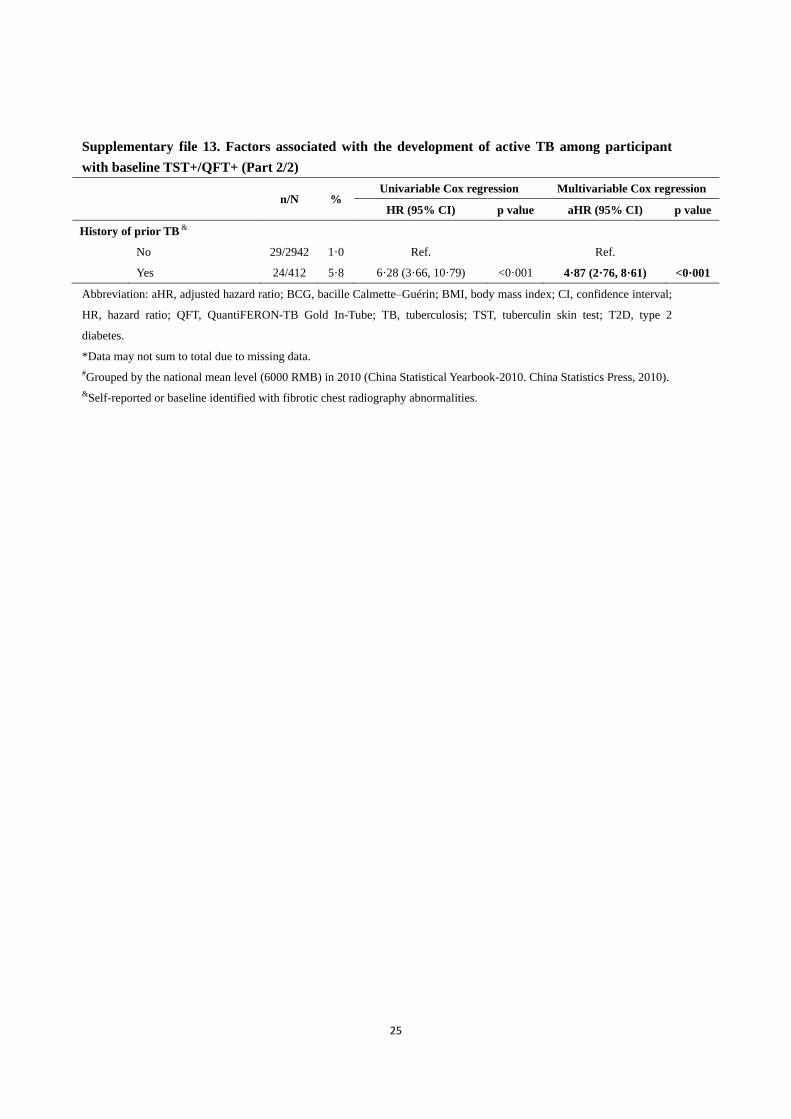
Supplementary file 13. Factors associated with the development of active TB among participant
with baseline TST+/QFT+ (Part 2/2)
n/N %
Univariable Cox regression Multivariable Cox regression
HR (95% CI) p value aHR (95% CI) p value
History of prior TB &
No 29/2942 1·0 Ref. Ref.
Yes 24/412 5·8 6·28 (3·66, 10·79) <0·001 4·87 (2·76, 8·61) <0·001
Abbreviation: aHR, adjusted hazard ratio; BCG, bacille Calmette–Guérin; BMI, body mass index; CI, confidence interval;
HR, hazard ratio; QFT, QuantiFERON-TB Gold In-Tube; TB, tuberculosis; TST, tuberculin skin test; T2D, type 2
diabetes.
*Data may not sum to total due to missing data.
#Grouped by the national mean level (6000 RMB) in 2010 (China Statistical Yearbook-2010. China Statistics Press, 2010).
&Self-reported or baseline identified with fibrotic chest radiography abnormalities.

26
Supplementary file 14. Stratified analysis on the association of TB risk with age, gender, and
history of prior TB among QFT positives
Incidence of TB
n/N* (%)
Adjusted HR
(95% CI)
p for likelihood
ratio test
<60 years Females 7/1207 (0·6) Ref. <0·001
Males 27/1408 (1·9) 1·62 (0·84, 3·13) †
≥60 years Females 13/805 (1·6) Ref.
Males 28/1035 (2·7) 2·66 (1·15, 6·15) †
Males Without a history of prior TB 32/2126 (1·5) Ref. <0·001
With a history of prior TB 23/317 (7·3) 5·17 (3·02, 8·87) ‡
Females Without a history of prior TB 10/1838 (0·5) Ref.
With a history of prior TB 10/174 (5·8) 9·43 (3·83, 23·25) ‡
<60 years Without a history of prior TB 17/2404 (0·7) Ref. <0·001
With a history of prior TB 17/211 (8·1) 10·51 (5·33, 20·72) #
≥60 years Without a history of prior TB 25/1560 (1·6) Ref.
With a history of prior TB 16/280 (5·7) 3·86 (2·06, 7·23) #
Abbreviations: CI, confidence interval; HR, hazard ratio; QFT, QuantiFERON-TB Gold In-Tube; TB, tuberculosis.
†Adjusted for history of prior TB.
‡ Adjusted for age.
# Adjusted for gender.
27
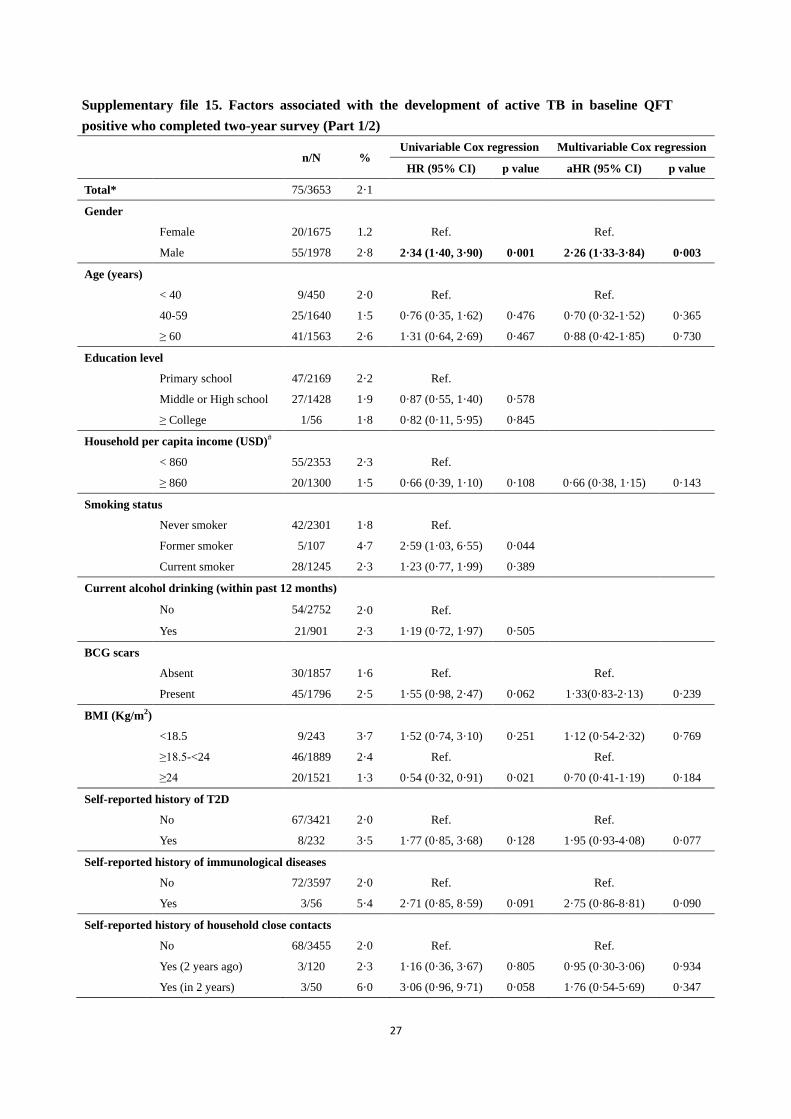
Supplementary file 15. Factors associated with the development of active TB in baseline QFT
positive who completed two-year survey (Part 1/2)
n/N % Univariable Cox regression Multivariable Cox regression
HR (95% CI) p value aHR (95% CI) p value
Total* 75/3653 2·1
Gender
Female 20/1675 1.2 Ref. Ref.
Male 55/1978 2·8 2·34 (1·40, 3·90) 0·001 2·26 (1·33-3·84) 0·003
Age (years)
< 40 9/450 2·0 Ref. Ref.
40-59 25/1640 1·5 0·76 (0·35, 1·62) 0·476 0·70 (0·32-1·52) 0·365
≥ 60 41/1563 2·6 1·31 (0·64, 2·69) 0·467 0·88 (0·42-1·85) 0·730
Education level
Primary school 47/2169 2·2 Ref.
Middle or High school 27/1428 1·9 0·87 (0·55, 1·40) 0·578
≥ College 1/56 1·8 0·82 (0·11, 5·95) 0·845
Household per capita income (USD)#
< 860 55/2353 2·3 Ref.
≥ 860 20/1300 1·5 0·66 (0·39, 1·10) 0·108 0·66 (0·38, 1·15) 0·143
Smoking status
Never smoker 42/2301 1·8 Ref.
Former smoker 5/107 4·7 2·59 (1·03, 6·55) 0·044
Current smoker 28/1245 2·3 1·23 (0·77, 1·99) 0·389
Current alcohol drinking (within past 12 months)
No 54/2752 2·0 Ref.
Yes 21/901 2·3 1·19 (0·72, 1·97) 0·505
BCG scars
Absent 30/1857 1·6 Ref. Ref.
Present 45/1796 2·5 1·55 (0·98, 2·47) 0·062 1·33(0·83-2·13) 0·239
BMI (Kg/m2)
<18.5 9/243 3·7 1·52 (0·74, 3·10) 0·251 1·12 (0·54-2·32) 0·769
≥18.5-<24 46/1889 2·4 Ref. Ref.
≥24 20/1521 1·3 0·54 (0·32, 0·91) 0·021 0·70 (0·41-1·19) 0·184
Self-reported history of T2D
No 67/3421 2·0 Ref. Ref.
Yes 8/232 3·5 1·77 (0·85, 3·68) 0·128 1·95 (0·93-4·08) 0·077
Self-reported history of immunological diseases
No 72/3597 2·0 Ref. Ref.
Yes 3/56 5·4 2·71 (0·85, 8·59) 0·091 2·75 (0·86-8·81) 0·090
Self-reported history of household close contacts
No 68/3455 2·0 Ref. Ref.
Yes (2 years ago) 3/120 2·3 1·16 (0·36, 3·67) 0·805 0·95 (0·30-3·06) 0·934
Yes (in 2 years) 3/50 6·0 3·06 (0·96, 9·71) 0·058 1·76 (0·54-5·69) 0·347
28
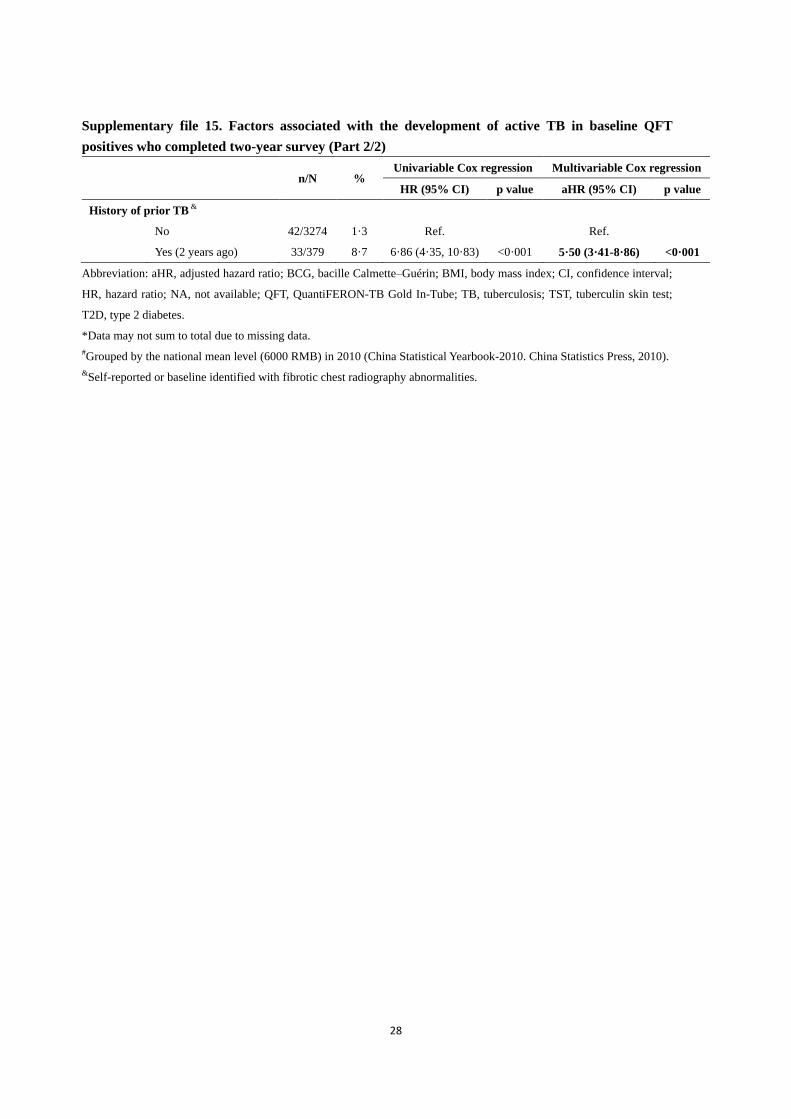
Supplementary file 15. Factors associated with the development of active TB in baseline QFT
positives who completed two-year survey (Part 2/2)
n/N %
Univariable Cox regression Multivariable Cox regression
HR (95% CI) p value aHR (95% CI) p value
History of prior TB &
No 42/3274 1·3 Ref. Ref.
Yes (2 years ago) 33/379 8·7 6·86 (4·35, 10·83) <0·001 5·50 (3·41-8·86) <0·001
Abbreviation: aHR, adjusted hazard ratio; BCG, bacille Calmette–Guérin; BMI, body mass index; CI, confidence interval;
HR, hazard ratio; NA, not available; QFT, QuantiFERON-TB Gold In-Tube; TB, tuberculosis; TST, tuberculin skin test;
T2D, type 2 diabetes.
*Data may not sum to total due to missing data.
#Grouped by the national mean level (6000 RMB) in 2010 (China Statistical Yearbook-2010. China Statistics Press, 2010).
&Self-reported or baseline identified with fibrotic chest radiography abnormalities.
29
Supplementary file 16.The LATENTTB-NSTP study team member list
Site A team: Wen Kong, Cheng Chen, Yuejin Wang, Fengqiu Gong, Lili Guo, Zhonghui
Huang,Wenjuan Shao, Ping Sun, Chunhua Xue, Yiqing Zhu, Weiping Jiang, Yaxiang Gui, Hao Wang,
Ping Yang, Ruiyong Yao, Wenhua Yin, Nong Chao, Tao Jiang, Baima village:Qinxiao Qian, Hongqin
Shi, Yungen Tao, Meiqin Wu, Yuping Yang, Dongmei Zhang, Guoxian Zhang, Jianguo Wang, Xiaojun
Chen, Zhaosheng Ding, Huajie Fu, Li Hang, Yu Huang, Huiping Jiang, Huaxin Jiang, Junlian Li,
Baoxia Liu, Lijun Pan, Caiyun Shao, Huixia Tan, Qiuwei Tan, Weizhong Wang, Jianping Yang, Meiqin
Yi, Qianlu Yin, Hua Yuan, Weixing Zhang, Hong Zhu, Haojun Fei, Liwei Jiang, Wenhong Li, Zhaoer
Shen, Xiaomei Sun, Wenjuan Tang, Mingming Wang, Jinlong Wu, Songqing Zhang, Xiaozhong
Zhang.
Site B team: Ling Guan, Xueling Guan, Wantong Liu, Wei Cui, Zhaokuan Lei, Yongming Wang,
Yongmin Yu, Liucun Song, Tao Wang, Xiaolong Li, Jianrong Luo, Hebin Wang, Weiguo Liu, Fude
Zhang, Fang Zhang, Yongfu Wang, Qingna Zhao, Yinbiao Liu, Jianli Li, Liujie Dan, Dakuan Wang,
Jiaoxia Yan, Guofu Zhu, Zisen Liu, Zhoulun He, Yongfen Yan, Ping Li, Huailiang Shang, Baichao
Heng, Shuli Liu, Zhe Ran, Kun Jiang, Xin Zhu, Haibin Wu, Liling Liang, Jianhui Yuan, Zhigang Wang,
Aijing Meng, Jing Wang, Xia Guan, Jiannan Yang, Yan Li, Haixia Liu, Wuying Wang, Xinhao Liu, Fuke
Qiao, Xianmin Li, Herong Zhao, Chunyuan Zhu, Yanan Lu, Ning Liu, Yanan Peng, Li Wan, Hairui
Chen, Xiaoming Song, Qingtao Lou, Wei Wang, Changshui Liu, Lijuan Zhang, Zhanjiang Zhang,
Shijie Yuan, Yongxin Yang, Suqin Chen, Changjie Dong, Jianguo Ran, Weiling Wu, Zhen Li, Hui
Zhang, Liujia Duan, Fan Yang, Ying Liu, Kun Wang, Lina Yan, Jiangli Ma, Liuyan Wan, Yanfen Li, Han
Wang, Bing Yuan, Ruiling Du, Jie Zhang, Jingge Zhang, Lin Li, Aihua Zhao, Junhong Wei, Ning Zhao,
Yonghui Zhu, Wuyi Mao, Qi Luo, ZhongpuHuang, Hongbin Guo, Na Zheng, Weiwei Pan, Meng Qin,
Ying Li, Shanshan Xiao, Yun Zhang, Weiying Wu, Jing Li, Liusen Song.
Site C team: Yi Tang, Qineng Yao, Kunyun Yang, Meixiong Kuang, Changlin Bao, Tao Xiao, Yanping
Wan, Xiaojie Wan, Binbin Liu, Tieliu Jiang, Xiaoping Zhang, Zhen Tan, Xiaobing Zhang, Zhaoguo Liu,
Zhenhua Chen, Yu Wang, Yanyan Yu, Saibo Dai, PeiLei Hu, Chuanfang Zhang, Yanhong Li, Dehua
Gong, Liqin Liu, Xiaohong Li, Jie Ling, Xinhua Shan, Z huo Zhang, Haibing Deng, Zhengbiao Zeng,
Honghua Li, Shuiping Zhou, Ying Xu, Can Zhang, Haifeng Chen, Xiaoling Wang, Yao Chen, Sheng
30
Yang, Weiping Peng, Huan Sun, Hui Liao, Xiping Xie, Fang Liang, Cheng Hu, Siwei Hu, Xinyu Liu, Jun
Peng, Wenxin Liu, Decheng Liu, Wenbin Liu, Xiangmei Li, Hui Guo.
Site D team: Wen Wang, Yujue He, Bo Wang, Yaping Zhang, Qiaofen Gao, Jianxi Zhao, Weitao
Chen, Qing Li, Taojun Mu, Qijun Liang, Jixiu Gu, Ling Ma, Ning An, Junwen Li, Qinhua Yao,
Chengzhi Liang, Xiuqun Ge, Yalin Chen, Shumao Luan, Yanhong Sun, Ruifang Yang, Bin Ma,
Suiqiang Zhang, Fusheng Liang, Yuan Tian, Hongxia Zhang, Fanqin Yang, Qifeng Lu, Jun Chen, Yan
Dong, Hui Zhang, Shunsheng Zhang, Ziming Jin, Jintao Wang, Jianwei Lan, Zhanjun Zhang, Yumin
Wu, Jianlin Shi, Zhaoping Shi, Yan Chen, Jianxin Ding, Xiaofeng An, Jun Yang, Dongdong Ling.,
Zhenzhou Nie, Chunli Liu, Guangyin Mi, Hongxia Zhang, Jun Ma, Jiyun Guo.