supplementation of acqua lete® (bicarbonate calcic mineral...
TRANSCRIPT


Indice Journal of the International Society of Sport Nutrition 2012, 9:35 http://www.jissn.com/content/9/1/35 Supplementation of Acqua Lete (Bicarbonate Calcic Natural Mineral Water) improves hydration status in athletes after short term anaerobic exercise P. Brancaccio, F.M. Limongelli, I.Paolillo, A.D’Aponte, V.Donnarumma and L.Rastrelli…….Pg 1 Journal of the International Society of Sport Nutrition 2012, 9:35 http://www.jissn.com/content/9/1/35 L’Assunzione di Acqua Minerale Naturale Bicarbonato Calcica Lete migliora lo stato di idratazione in atleti dopo esercizio anaerobico di breve termine P. Brancaccio, F.M. Limongelli, I.Paolillo, A.D’Aponte, V.Donnarumma and L.Rastrelli…….Pg 9 The Open Sports Medicine Journal, 2011, 5, 24-30 Influence of Acqua Lete (Bicarbonate Calcic Natural Mineral Water) Hydration on Blood Lactate After Exercise P. Brancaccio, F.M. Limongelli, I.Paolillo, C.Grasso, V.Donnarumma and L.Rastrelli…….....Pg 21 The Open Sports Medicine Journal, 2011, 5, 24-30 Influenza dell’Acqua Minerale Naturale Bicarbonato Calcica Lete sulla Concentrazione di Lattato Ematico in Atleti dopo Esercizio P. Brancaccio, F.M. Limongelli, I.Paolillo, C.Grasso, V.Donnarumma and L.Rastrelli…….....Pg 29 Medicina Clinica e Termale Effetti della somministrazione di Acqua Minerale Naturale Bicarbonato Calcica Lete nella dispepsia funzionale M.Tarocchi, E. Dabizzi, Mgo Ninotta, B.Casanova, C.Violanti, C.Surrenti*..............................Pg 43 (*) Prof. Calogero Surrenti, MD. Professore Ordinario di Gastroenterologia – Università degli Studi di Firenze – Dipartimento di Fsiopatologia Clinica.


Brancaccio et al. Journal of the International Society of Sports Nutrition 2012, 9:35http://www.jissn.com/content/9/1/35
RESEARCH ARTICLE Open Access
Supplementation of Acqua LeteW (BicarbonateCalcic Mineral Water) improves hydration statusin athletes after short term anaerobic exercisePaola Brancaccio1, Francesco Mario Limongelli1, Iride Paolillo2, Antonio D’Aponte1, Vincenzo Donnarumma3
and Luca Rastrelli4*
Abstract
Background: Experimental studies suggest that mineral waters with high concentrations of calcium andbicarbonate can impact acid–base balance. The purpose of this study was to test the effect on acid–base balanceand specific urine gravity, of a bicarbonate calcic mineral water (Acqua LeteW) compared to a minimally mineralizedwater.
Methods: 88 amateur male athletes underwent two experimental trials with a modified Wingate test: the first wascarried out without hydration (Control Test, Test C, n = 88); the second was carried out after one week of controlledhydration (Test with hydration, Test H, n = 88), with 1.5 L/day of a very low mineral content water (Group A, n = 44)or 1.5 L/day of Acqua LeteW (Group B, n = 44). Measure of body temperature, bioimpedance analysis, muscularultrasound, and urinalysis were taken before (t0), immediately after (t1), 5’ (t2), and 30’ (t3) after exercise.
Results: Hydration results in a decreased core temperature; muscular ultrasound showed increased musclethickness after exercise related to content of body water. Regarding urinalysis, in test H, we found in both groupsafter exercise a significant decrease of specific urine gravity with significantly lower levels in Group B. We also founda significant increase of pH in the same Group B.
Conclusions: In conclusion all the athletes hydrated with Acqua LeteW showed a positive impact on hydrationstatus after anaerobic exercise with significant decrease of specific urine gravity and a positive effect on pH.
Keywords: Acqua LeteW mineral water, Urine specific gravity, Urine pH, Intracellular body water, Muscularultrasound
BackgroundScientists and athletes pay particular attention to thestrategies of water intake in order to guarantee the bestbalance of fluids and to improve performance [1,2].American College of Sports Medicine and the NationalAthletic Trainers' Association have defined hydration-status founding on urine specific gravity [3,4]. In 1996the American College of Sport Medicine established theguideline, recently confirmed [5], recommended to pre-serve an optimal balance of hydration in order to im-prove performance and to prevent injuries.
* Correspondence: [email protected] di Scienze Farmaceutiche e Biomediche, University of Salerno,Via Ponte Don Melillo, Fisciano, Salerno 84084, ItalyFull list of author information is available at the end of the article
© 2012 Brancaccio et al.; licensee BioMed CenCreative Commons Attribution License (http:/distribution, and reproduction in any medium
Natural, untreated, spring water distinguishes itselffrom other bottled waters by its specific undergroundgeological origin, its stable composition of minerals andits purity. Mineral waters can have potential beneficialeffects on health [6], including bone health and numer-ous health claims have been made for the benefits aris-ing from the traces of a large number of minerals foundin solution [7]. Water alone provides adequate hydrationduring performance [8]; several researchers have sug-gested, for instance, that mineral waters, especially thosewith high concentrations of calcium and bicarbonate,can impact acid–base balance [9] and contribute to theprevention of bone loss [10].Alkalinizing mineral waters can influence the acid–
base equilibrium of the body [11]. Even small changes in
tral Ltd. This is an Open Access article distributed under the terms of the/creativecommons.org/licenses/by/2.0), which permits unrestricted use,, provided the original work is properly cited.

Brancaccio et al. Journal of the International Society of Sports Nutrition 2012, 9:35 Page 2 of 7http://www.jissn.com/content/9/1/35
pH have crucial effects on cellular function, suggestingthat the purposeful consumption of mineral water repre-sents one of the most practical ways to increase the nu-tritional load of alkali to the body. On the other hand,several studies have shown that alkalinizing mineralwaters low in SO4
2-and rich in HCO3- had better effects
on Ca metabolism and bone resorption markers thanwaters rich in SO4
2- and Ca [12].Acqua LeteW mineral water has calcium concentra-
tions of 314 mg/L, magnesium of 15 mg/L and bicar-bonate of 981 mg/L, being a very high calcium andbicarbonate mineral water. The Acqua LeteW exhibitsother peculiarities, notably high levels of carbon dioxide,and low contents of sodium and potassium.Objectives of this study were to examine the relation-
ship between Acqua LeteW intake and total body water,muscle thickness and urinary markers of hydration aftershort term anaerobic exercise. Based on experimentalevidence, we hypothesized that Acqua LeteW mineralwater ingestion will correlate with acid–base balance inthe body lowering specific urine gravity of athletes andthat it can guarantee the effectiveness of a correct hydra-tion during short term exercise.
MethodsProtocolAll testing procedures were approved by the institution’sHuman Research Ethics committee. Eighty-eight maleamateur athletes volunteered to participate in the study.All potential participants attended a familiarization ses-sion where details of the test protocol and their timecommitment were described. All participants wereadvised that they were free to withdraw from testing atany time without any adverse consequences. Upon com-pletion of the consent form, participants were randomlydivided in two groups (A and B groups) of 44 subjects.Athletes trained (swimming or running) 4–5 hours perweek. All the subjects stopped the training and followeda diet without any kind of mineral supplements duringthe entire period of the study (2 weeks).Group A : age 34.7 y ± 7.4 (mean± S.D.); height
178.5 cm± 5.6; weight 79.6 kg ± 6.9, and Body MassIndex (BMI) 24.6 ± 1.2. Group B : age 33.7 y ± 8.6(mean ± S.D.); height 174.6 cm± 5.4; weight 79.6 kg ± 9.6,and Body Mass Index (BMI) 25.7 ± 3.4.Both groups underwent two experimental trials, per-
formed on an electrically braked ergometer (BycicleSECA Hamburg, Germany) with a modified repeatedWingate protocol: five bouts of cycling of 60” with amean speed of 80 RPM and 60” of rest between the ses-sions. The workload was 85 % of their maximal work-load computed in a preliminary session a week beforethe first Test, with an incremental test on bicycle untilexhaustion.
The two Tests were: test C of control, in basal condi-tions and without hydration the day of trial, for bothgroups and test H, after one week of controlled hydra-tion with 1.5 L/die of a very low mineral content waterin group A and 1.5 L/die of Acqua LeteW, a bicarbonatecalcic water with a medium mineral content in group B.Moreover athletes received 750 ml of water usingfreshly opened bottles one hour before the exercise and250 ml of water in the following 30 minutes after effort,as recommended by National Athletic Trainer Associ-ation [4]. The type of water used was still the very lowmineral content water (Group A) and Acqua LeteW
(Group B).Before testing, participants received a physical examin-
ation including medical history. In each session of work(Test C and Test H), we measured: body temperature;total body water (TBW), extracellular water (ECW),intracellular water (ICW); muscular size of quadricepsfemoris; urinalysis.
The timing of measurements were:
at rest before the exercise (t0): body temperature,bioimpedance analysis for TBW, ECW and ICW,muscular ultrasound for detection of muscular size,urinalysis;immediately after the last session of exercise (t1): bodytemperature;5 minute after exercise (t2): bioimpedance analysis,muscular ultrasound examination;30 minutes after exercise (t3):urinalysis;
Water analysisThe bicarbonate-rich mineral water Acqua Lete (AcquaLeteW; Società Generale delle Acque Minerali, Pratella,CE, Italy), consumed by the experimental Group B wasshipped directly to the testing lab from its bottling facil-ity. The very low mineral content water used for GroupA is commonly available throughout Italy; it does notcontain significant minerals or electrolytes whatsoever.Very low mineral content and Acqua Lete waters werealso analyzed for 15 chemical parameters in our labora-tory. Most of the elements were determined by ion chro-matography (IC) using a Dionex instrument. A non-acidified aliquot was used to determine pH, electricalconductivity (EC), to titrate alkalinity. The 15 chemicaland chemical-physical variables measured on each sam-ple are listed in Table 1. Analytical methods are not fur-ther discussed here since they represent standardmethods fixed by Italian regulations (IRSA – CNR meth-ods 1994). Results are expressed as mean values ± SD(standard deviation) of three replicate analyses for eachwater.

Table 1 Chemical characteristics of mineral waters usedin the study*
Parameter Measurementunit
AcquaLeteW
Very lowmineral content
Conductivity mS/cm 1321.40 ± 46.10 17.57 ± 0.91
pH pH 6.14 ± 0.11 5.00 ± 0.09
Fixed residue mg/l 878.41 ± 25.21 14.31 ± 0.68
CO2 mg/L 1890.12 ± 72.51 15.22 ± 0.77
HCO3- mg/l 981.11 ± 33.82 3.51 ± 0.15
Cl- mg/l 8.24 ± 2.22 0.41 ± 0.02
SO42- mg/l 6.60 ± 0.91 1.40 ± 0.08
NO3- mg/l 4.14 ± 0.20 1.91 ± 0.08
Na+ mg/l 4.91 ± 0.33 1.21 ± 0.05
K+ mg/l 2.10 ± 0.08 0.32 ± 0.01
Ca++ mg/l 313.70 ± 9.81 1.11 ± 0.05
Mg++ mg/l 15.12 ± 3.92 0.42 ± 0.03
Fe mg/l 0.02 ± 0.01 < 0.01
Sr++ mg/l 0.15 ± 0.01 < 0.1
Li+ mg/l < 0.01 < 0.01
*Each results represents the mean ± SD of three analysis for each water.
Brancaccio et al. Journal of the International Society of Sports Nutrition 2012, 9:35 Page 3 of 7http://www.jissn.com/content/9/1/35
Body temperatureThe Measurement of body temperature was made bymeans of tympanic thermometer Braun ThermoScan.
Bioimpedance analysisThe qualitative and quantitative appraisal of the bodycomposition was made by means of instrumentationBodygram AKERN, Florence Italy, which evaluates bodyand tissue composition, hydration and nutrition status.BIA methods are based on empirical equations basedon height, weight and resistance or impedance of thewrist-ankle at 50 kHz, and allows determination of fluidvolume and total body water from measurements ofresistivity of tissues. We estimated the following para-meters: total body water (TBW), extracellular bodywater (ECW) and intracellular body water (ICW). Theexamination at T0 was performed fasting from food anddrink, whereas at T2 after the controlled hydration.
Muscle ultrasoundMuscle thickness were determined on the right leg byultrasonography with a 10 MHz probe with the subjectsitting on the examination couch with hips and kneesflexed at 90° as reported previously. Muscular ultra-sound is a non invasive, available method to detect dif-ferences in muscular size after exercise [13]. Subjectswere asked to stay relaxed. The same operator per-formed all measurements at the border between thelower one third and the upper two thirds of the dis-tance between the anterior superior iliac spine and the
upper pole of the patella. The measuring point wasmarked with a marking pen. Measurements were per-formed just before the exercise test (t0), and 5 minuteafter the end of the cycloergometer test (t2). We mea-sured the thickness of the quadriceps femoris (rectusfemoris + vastus intermedius) with the probe placed inthe transverse plane.
UrinalysisThe urine was collected in polyethylene containers andmixed with 5 ml/L of a 5 % solution of thymol in isopro-panol to preserve the urine. During the collectionperiod, the containers and their contents were main-tained at 5 °C. Urine samples were tested for the pres-ence of blood and infection. Nitrite-positive andhaematuria samples were discarded. Urine Specific Grav-ity was evaluated using a refractometer (Atago DigitalUrine Specific Gravity Refractometer). Urine pH wasrecorded using a Rondolino sample changer potentiom-eter (Mettler Toledo). The color of the urine has beenevaluate using a visual staircase. Vogel 1 (yellow urine,yellow pale, yellow clear), Vogel 2 (yellowish urines, red-dish, redheads), Vogel 3 (red brownish and brownurines). 2 (yellowish urines, reddish, redheads), Vogel 3(red brownish and brown urines).
Statistical analysesStatistical analysis was performed by SPSS statisticalpackage for Windows, release 17.0 (Chicago, IL, USA).We compared the data collected in each group at everystep of work. Statistical significance between group Aand group B was evaluated by unpaired samples T Test :descriptive statistics were calculated, and values reportedas mean ± SD. Statistical significance within group A andgroup B, comparing Test C and Test H, was also evalu-ated by Student’sT Test for paired samples: descriptivestatistics were calculated, and values are reported asmean ± standard deviation. Relationships between themeasures collected were calculated with a bivariate cor-relation measuring the Pearson’s correlation coefficient.Differences were considered statistically significant whenP ≤ 0.05.
Results and discussionAll of the subjects underwent the protocol as described.In Table 1 we reported the features of the mineral watersused in the study.Tests were performed at an environmental temperature
of 19.50 ± 0.53 °C with a wetness of 58.38 ± 0.52 %.
Test CIn the first test made without hydration, the bodytemperature showed a significant increase immediatelyat the end of the cycloergometer test: the athletes started

Table 3 Urine pH detected in Test C (control) and in TestH (hydration) before and after Exercise*
Test C t0 t2
Group A 5.6 ± 0.2a 5.3 ± 0.1a
Group B 5.6 ± 0.4 5.4 ± 0.5
Test H t0 t2
Group A 5.5 ± 0.8 5.4 ± 0.9
Group B 5.4 ± 0.2b 5.7 ± 0.1b
* Data are expressed as mean ± SD, n = 44.Mean values were significantly different: a and bp< 0.05.
Brancaccio et al. Journal of the International Society of Sports Nutrition 2012, 9:35 Page 4 of 7http://www.jissn.com/content/9/1/35
exercise with a mean temperature of 35.9 ± 0.6 °C, reach-ing at the end of work 36.5 ± 0.4 °C; (p< 0.001). No dif-ferences were perceived in total body water distribution,with almost the same levels of ICW and ECW detectedbefore (t0) and 5 minute after exercise (t2). Converselysignificant changes were detected in TBW during thetest C (Table 2).Ultrasonography performed at rest (t0) and 5’ after the
Wingate test (t2) showed in both groups a variation ofmuscular thickness, consistent with our previous study[11]. (Group A: 29.94 ± 3.89 mm vs 32.29 ± 3.13 mm:p = 0.00); Group B: 30.56 ± 3.30 mm vs 33.08 ± 2.89 mm:p = 0.00).Urinalysis collected at t0 and t3 showed no significant
difference in colour; we observed a decrease of urinarypH at t2 (Table 3), as expected after anaerobic exercise,whereas specific urinary gravity after effort (Figure 1)showed a significant increase (Group A: 1020 ± 4.7 g/Lvs 1022 ± 4.4 g/L; p =<0.001; Group B: 1018 ± 6.5 g/L vs1019 ± 5.5 g/L; p = ns). Data on urine pH and specificgravity between the two groups were compared. Thevalues were not different between the two groups.
Test HThe body temperature showed an increase t0-t1 in test C(35.9 ± 0.4 °C vs 36.4 ± 0.4 °C; p =<0.001). Bioimpedanceanalysis performed after hydration (Table 2), showed nodifference in group A, whereas in group B we found aslight but significant decrease of ECW at rest and a con-comitant increase of ICW. After exercise group Bshowed a shift of body water, from extracellular to intra-cellular compartment.Ultrasonography detected an increase in muscular
thickness, in test H. (Group A: 29.93 ± 3.89 mm vs32.00 ± 3.61 mm; Group B: 30.84 ± 3.47 mm vs32.82 ± 2.72 mm).In athletes hydrated with Acqua Lete urine pH was
more alkaline than in those who drank very low mineral
Table 2 Total body water (TBW), Extracellular water (ECW) anH (hydration) before and after exercise*
Test C TBW
t0 t3 t0
Group A 56.69 ± 1.14a 55.30 ± 1.05a 40.60 ± 2.4
Group B 57.50 ± 1.80b 55.87 ± 0.75b 37.76 ± 4.1
Test H TBW
t0 t3 t0
Group A 57.83 ± 3.75 57.43 ± 5.01 40.85 ± 2.8
Group B 57.84 ± 2.26 57.37 ± 3.11 38.47 ± 1.1*values are expressed in percentage (%).Data are expressed as mean ± SD: n = 44.Mean values were significantly different from resting values (t0):
a and bp< 0.001; c a
content water (Table 3). The specific gravity of the urineafter effort sustained a significant and similar decreasein the two groups but subjects who drank Acqua Letemineral water (Group B) showed a significantly lowermean values of specific urinary gravity when comparedwith athletes belonging to Group A (Group A1014 ± 4.1 g/L vs Group B 1008 ± 4.3 g/L - Figure 2).Many studies used Wingate Test and modified Win-
gate Test [14], to assess physiological responses to anaer-obic exercise. In our study we evaluated the response toanaerobic exercise before and after hydration with abicarbonate-calcic mineral water, named Acqua Lete,compared to a very low mineral content water (dry resi-dues 14.3 mg/L).A modest increase in core body temperature occurred
despite subjects performed at a moderately high exerciseintensity for a short time, although there are not uni-vocal conclusions in the literature about the relation be-tween core temperature, intensity of exercise andhydration status [15]. However some studies reported in-crease of core temperature after Wingate test, with a fa-tigue index higher when core temperature values arehighest [16]. The exact mechanism of fatigue is notknown; but presumably it is a complex interplay be-tween both peripheral and central factors: the mechan-ism is probably mediated by catecholamines dopamineand noradrenaline. [17].
d Intracellular water (ICW) in Test C (control) and in Test
ECW ICW
t3 t0 t3
8 41.20 ± 2.84 59.40 ± 2.40 58.81 ± 2.84
7 37.46 ± 2.82 62.24 ± 4.17 62.54 ± 2.82
ECW ICW
t3 t0 t3
7 40.57 ± 2.42 59.15 ± 2.87 59.43 ± 2.42
1c 37.10 ± 1.04c 61.53 ± 1.14d 62.94 ± 0.94d
nd dp< 0.05.

Figure 1 Urinary specific gravity detected in Test C (Control)before and after exercise*. *Data are expressed as mean ± SD;n = 44; Group A: 1020 ± 4.7 (t0) vs 1022 ± 4.4 (t3): p =< 0.05 Group B:1018 ± 6.5 (t0) vs 1019 ± 5.5(t3), p = ns.
Brancaccio et al. Journal of the International Society of Sports Nutrition 2012, 9:35 Page 5 of 7http://www.jissn.com/content/9/1/35
Other studies reported increase of temperature afterlight exercise, as the warm-up, depending on the dur-ation of exercise [18]. The relationship between level ofhydration and core temperature has been widely studiedand, although it is well documented that dehydrationincreases body temperature during exercise [19], manystudies agree that hyperhydration provides no thermo-regulatory advantage over the maintenance of euhydra-tion during exercise [20]. In our study we found aslight but significant difference in body temperatureafter exercise between Test C and Test H (36.5 ± 0.4 °Cvs 36.4 ± 0.4 °C; p =<0.001), with lower values after hy-dration, confirming that the euhydration obtained inthe second test ensured a better thermoregulatoryhomeostasis.Body composition assessment is useful in a variety of
clinical settings to gain information about nutritionalcondition and the status of body fluid compartments.Bioimpedance analysis (BIA) is an attractive techniquefor the purpose, because it is safe, non-invasive,
Figure 2 Urinary specific gravity detected in Test H (test withhydration) before (t0) and 30’ after exercise (t3)*. *Data areexpressed as mean ± SD; n = 44; Group A: 1021 ± 4.6 (t0) vs1014 ± 4.1(t3), p =< 0.05 Group B: 1021 ± 3.7 (t0) vs 1008 ± 4.3 (t3),p =< 0.05 Group A (t3) vs Group B (t3) = p< 0.05.
inexpensive and easy to use. Previous studies have char-acterized the accuracy of bioimpedance analysis [21] andhave reported difference in total body water before andafter effort, due to a shift from extracellular to intracel-lular compartment consequent to modification of cellu-lar osmolarity after energy depletion [22,23]. Duringexercise, the elevated metabolic activity within the cell,leads to increased osmotic pressure, stimulates an influxof fluid into the intracellular compartment to re-establish an osmotic equilibrium [24].Although changes in TBW are reported in the litera-
ture as a consequence of long-term exercise [25], wefound significant change of TBW in both groups, whennot hydrated. Conversely, after hydration both groupsshowed a similar total body water, but different distribu-tion of ECW and ICW: Group B, hydrated with a bicar-bonate calcic mineral water (Acqua LeteW), showed asignificant shift of water through intracellular comparti-ment. This group reached at peak of exercise a higher levelof blood lactate (9.8 ± 0.6 mmol/L vs 7.4 ± 0.8 mmol/L;p< 0.05), leading to a change of intracellular pH andmediating cellular osmolality, which may be responsiblefor the increased volume of water in the intracellularspace [26].An ultrasound examination of both groups showed a
similar increase of muscle thickness 5 minute after theend of the cycloergometer test, with a mean increase of2.14 ± 1.06 mm in Group A and 2.55 ± 1.22 in Group B.Changes in size and muscle architecture, reported in anumber of studies, were related to the biochemicalchanges which occurred with muscle fatigue [27]. In aprevious study we found a significant increase of musclethickness after cycloergometer test, bound to a variationof muscle architecture [13] probably as a consequence ofmuscle oedema. However the increased muscle thicknessmay be also resulting from a slowing of muscle relax-ation due to intracellular accumulation of Ca++ and H+:in fact the elevation of the Ca++-dependent proteolyticpathway degrades structural and contractile proteins,and depression in pH reduces the rate of cross bridgedetachment [28].After hydration we also found in both groups an inter-
esting correlation between the increase of ICW and thethickness of quadriceps (Group A: r = 0.957, p< 0.001;Group B: r = 0.454, p< 0.05): in this case the increasedvolume of quadriceps seems to be due to a higher con-tent of cellular water. (Group A=mean increase of2.35 ± 1.27 vs Group B 2.52 ± 0.91). We did not find thisrelation in Test C: one possible explanation is that in thecontrol test the increase of thickness was mainly due tothe lack of relaxation, possibly the consequence of milddehydration on neuro-muscular control [29].Urinalysis assesses hydration status, particularly with
urine osmolarity, specific gravity and colour [30]. In our

Brancaccio et al. Journal of the International Society of Sports Nutrition 2012, 9:35 Page 6 of 7http://www.jissn.com/content/9/1/35
study we evaluated specific urine gravity, pH and colourbefore (t0) and 30’ after the end of the cycloergometertest (t3) in both sessions (without and with hydration).When the groups were tested without hydration, we
found in both groups a slight but significant increase ofurine gravity after exercise. The date had the samecourse in both groups thus reaching a significant differ-ence in group A. Even if a more complete study whichtake account all the aspects of fluid balance (urine vol-ume osmolarity and hematocrit) could give more detail,We think that this result might be due to different hy-dration status (TBW) in the groups as described inTable 2. Conversely, in test H the controlled hydrationimposed during the week before the test, lead to an equalTBW at rest. Anyway we supposed decreasing of urinaryspecific gravity after acute hydration, but we found thatgroup B reached after exercise a significantly lower levelthan group A (1008.1 ± 4.3 g/L vs 1014.6 ± 4.1 g/L;p =<0.001). Both groups were well hydrated, but groupB reading less than 1.010 reflected a better hydrated con-dition than the group A [5].This result can be attributed to the specific chemical
composition of waters used in Test H: the very low min-eral content water had low levels of calcium and bicar-bonate and a fixed residue of 14.3 mg/L; the AcquaLeteW water (fixed residue 878.8 mg/L) with modestcontents of sodium (4.9 mg/L), potassium (2.1 mg/L)and sulphate (6.6 mg/L) had significant contents of bi-carbonate (range values of 981.1), calcium (313.7 mg/L)and magnesium (15.1 mg/L), belongs to the group of thebicarbonate-calcics.The specific gravity is dependent on the number and
weight of solute particles constituted mainly of urea andelectrolytes. In physiological conditions the greater ab-sorption of water induce a lower concentration ofsolutes, producing urine with a low specific gravity,which indicates better capacity to retain water as wefound in Group B. Moreover, consumption of mineralwaters rich in magnesium and bicarbonate can increaseurinary pH, magnesium, and citrate and decrease cal-cium oxalate concentration [31].In the present study, when compared with the con-
sumption of the very low mineral content bottled water,hydration with Acqua LeteW mineral water was asso-ciated with a significant increase in urine pH. Previousresearch by König et al. [32] demonstrated that con-sumption of a mineral-rich supplement significantlyincreased urinary pH. Similarly, Heil [9] (2010) showedthat mineral-rich bottled water with alkalinizant supple-ment improved acid–base balance and hydration status.The observations from these studies are consistent withthe changes in urine observed in the present study forGroup B. Moreover in a previous study [26] we foundthat the better hydration status improved the recovery
after exercise in both groups of athletes, with a rate ofdecrease of lactate higher in test H respect the test C.Besides the specificity of the Acqua Lete water, haveaffected the increase of lactate at peak of exercise andthe restore after exercise, leading to minimal, but signifi-cantly lower levels of [La-] after effort.
ConclusionsTo date most of the studies focused on the maintenanceof better hydration status during strenuous exercise,whereas little has been written on useful strategies of re-hydration in short term exercise, when water loss is min-imal and other aspects of recovery may be taken intoaccount. The results of our study confirm that in shortterm exercise, a correct hydration is important as well asin long term exercise and confirm our hypothesis thatAcqua LeteW mineral water intake is correlated with theincrease of urinary pH and with a lower urine specificgravity in amateur athletes, therefore it may be a valu-able nutritional vector for influencing hydration statusin athletes.
AbbreviationsTest C: Control test; Test H: Test with hydration; BMI: Body Mass Index;TBW: Total Body Water; ECW: Extracellular Water; ICW: Intracellular Water;IC: Ion Chromatography; EC: Electrical Conductivity; BIA: BioimpedanceAnalysis.
Competing interestWe declare that no conflict of interest. We have no financial or other interestin the product or distributor of the product.
Author’s contributionPaola Brancaccio, participated the design of the study, performed thestatistical analysis, the interpretation of data and drafted the manuscript,Francesco Mario Limongelli, have given final approval of the version, IridePaolillo, participated to the acquisition of data and carried out urinalysis,bioimpedance analysis and muscle ultrasound, Antonio D’Aponte,participated to the acquisition of data and carried out the Wingate test,Vincenzo Donnarumma, carried out all the laboratory analysis, Luca Rastrelli,performed the water analysis, participated the interpretation of data, draftedthe manuscript and given final approval of the version. All authors read andapproved the final manuscript.
Limitation of the studyWe did not afford a complete assessment of hydration status, because theshort duration of exercise and the lack of sweating did not allow toappreciate changes in body weight. A more complete study which takeaccount all the aspects of fluid balance (urine volume osmolarity andhematocrit) and a complete diet, could give more detail and betterindication on type of water to use in different type of exercise.
AcknowledgmentThis work was supported by School of “Idrologia e Medicina Termale e delloSport” of University of Salerno and by Società Sportiva Calcio Napoli S.p.A.The author states that there are no conflicts of interest.
Author details1Servizio di Medicina dello Sport, University of Naples, Via Costantinopoli,Naples 16 80138, Italy. 2Dipartimento di Scienze Farmaceutiche eBiomediche, University of Salerno, Via Ponte Don Melillo, Fisciano, Salerno84084, Italy. 3Roecker Diagnostics and clinical research Laboratory, Marano diNapoli, Italy. 4Dipartimento di Scienze Farmaceutiche e Biomediche,University of Salerno, Via Ponte Don Melillo, Fisciano, Salerno 84084, Italy.

Brancaccio et al. Journal of the International Society of Sports Nutrition 2012, 9:35 Page 7 of 7http://www.jissn.com/content/9/1/35
Received: 8 March 2012 Accepted: 26 July 2012Published: 26 July 2012
References1. Murray R: Rehydration strategies-balancing substrate, fluid, and
electrolyte provision. Int J Sports Med 1998, 19:133–135.2. Maughan RJ, Noakes TD: Fluid replacement and exercise stress. A brief
review of studies on fluid replacement and some guidelines for theathlete. Sports Med 1991, 12:16–31.
3. Sawka MN, Burke LM, Eichner ER, Maughan RJ, Montain SJ, Stachenfeld SN:American College of Sports Medicine: exercise and fluid replacement.Med Sci Sports Exerc 2007, 39:377–390.
4. Casa DJ, Armstrong LE, Hillman SK, Montain SJ, Rich B, Roberts WO, Stone JA:National athletic trainers' association position statement: fluid replacementfor athletes. J Athlet Train 2000, 35:212–224.
5. Montain SJ: Hydration recommendations for sport. Curr Sports Med Rep2008, 7:187–192.
6. Petraccia L, Liberati G, Giuseppe Masciullo S, Grassi M, Fraioli A: Water,mineral waters and health. Clin Nutr 2006, 25:377–385.
7. Vandevijvere S, Horion B, Fondu M, Mozin MJ, Ulens M, Huybrechts I, vanOyen H: Noirfalise Fluoride intake through consumption of tap waterand bottled water in Belgium. A Int J Environ Res Public Health. 2009,6:1676–1690.
8. Meyer LG, Horrigan DJ Jr, Lotz WG: Effects of three hydration beverageson exercise performance during 60 hours of heat exposure. Aviat SpaceEnviron Med 1995, 66:1052–1057.
9. Heil DP: Acid–base balance and hydration status following consumptionof mineral-based alkaline bottled water. J Int Soc Sports Nutr 2010,7:29–41.
10. Guillemant J, Accarie C, de la Guéronnière V, Guillemant S: Calcium inmineral water can effectively suppress parathyroid function and boneresorption. Nutr Res 2002, 8:901–910.
11. Burckhardt P: The effect of the alkali load of mineral water on bonemetabolism: Interventional studies. J Nutr 2008, 138:435S–437S.
12. Wynn E, Raetz E, Burckhardt P: The composition of mineral waters sourcedfrom Europe and North America in respect to bone health: compositionof mineral water optimal for bone. Br J Nutr 2009, 101:1195–1199.
13. Brancaccio P, Limongelli FM, D'Aponte A, Narici M, Maffulli N: Changes inskeletal muscle architecture following a cycloergometer test toexhaustion in athletes. J Sports Sci Med 2008, 11:538–541.
14. Fattorini L, Egidi F, Faiola F, Pittiglio G: Power output and metabolicresponse in multiple Wingate tests performed with arms. Medicina delloSport 2008, 61:21–28.
15. Casa DJ, Stearns RL, Lopez RM, Ganio MS, McDermott BP, Walker Yeargin S,Yamamoto LM, Mazerolle SM, Roti MW, Armstrong LE, Maresh CM:Influence of Hydration on Physiological Function and PerformanceDuring Trail Running in the Heat. J Athlet Train 2010, 45:147–156.
16. Souissi N, Driss T, Chamari K, Vandewall H, Davenne D, Gam A, Fillard JR,Jousselin E: Diurnal variation in Wingate test performances: influence ofactive warm-up. Chronobiol Int 2010, 27:640–652.
17. Roelands B, Meeusen B: xAlterations in central fatigue bypharmacological manipulations of neurotransmitters in normal and highambient temperature. Sports Med 2010, 40:229–246.
18. Racinais S, Blonc S, Hue O: Effects of active warm-up and diurnal increasein temperature on muscular power. Med Sci Sports Exerc 2005,37:2134–2139.
19. Buono MJ, Wall AJ: Effect of hypohydration on core temperature duringexercise in temperate and hot environments. Pflugers Arch 2000,440:476–480.
20. Sawka MN, Montain SJ, Latzka WA: Hydration effects on thermoregulationand performance in the heat. Comp Biochem Physiol Mol Integr Physio2001, 128:679–690.
21. De Lorenzo A, Andreoli A, Matthie J, Withers P: Predicting body cell masswith bioimpedance by using theoretical methods: a technologicalreview. J Appl Physiol 1997, 82:1542–1558.
22. Mohan K, Raja GH, Raymer GR, Marsh G, Thompson GG: Changes in tissuewater content measured with multiple-frequency bioimpedance andmetabolism measured with 31P-MRS during progressive forearmexercise. J Appl Physiol 2006, 101:1070–1075.
23. Ploutz-Snyder LL, Convertino VA, Dudley GA: Resistance exercise-inducedfluid shifts: change in active muscle size and plasma volume. Am JPhysiol 1995, 269:R536–R543.
24. Mohsenin V, Mohsenin V: Tissue pressure and plasma oncotic pressureduring exercise. J Appl Physiol 1984, 56:102–108.
25. Baker LB, Lang JA, Kenney WL: Change in body mass accurately andreliably predicts change in body water after endurance exercise. Eur JApp Physiol 2009, 105:959–967.
26. Brancaccio P, Limongelli FM, Paolillo I, Grasso C, Donnarumma V, Rastrelli L:Influence of Acqua LeteW (Bicarbonate Calcic Natural Mineral Water)Hydration on Blood Lactate after Exercise. The Open Sports Med J 2011,5:24–30.
27. Rudroff T, Staudenmann D, Enoka R: Electromyographic measures ofmuscle activation and changes in muscle architecture of human elbowflexors during fatiguing contractions. J Appl Physiol 2008, 104:1720–1726.
28. Armstrong RB, Warren GL, Warren JA: Mechanism of exercise-inducedmuscle fibre injury. Sports Med 1991, 12:184–207.
29. Montain SJ, Tharion WJ: Hypohydration and muscular fatigue of thethumb alter median nerve somatosensory evoked potentials. Appl PhysiolNut Met 2010, 35:456–463.
30. Oppliger RA, Magnes SA, Popowski LA: Accuracy of urine specific gravityand osmolarity as indicators of hydration status. Int J Sport Nutr Exerc Met2005, 15:236–251.
31. Kessler T, Hesse A: Cross-over study of the influence of bicarbonate-richmineral water on urinary composition in comparison with sodiumpotassium citrate in healthy male subjects. Br J Nutr 2000, 84:865–871.
32. König D, Muser K, Dickhuth HH, Berg A, Deibert P: Effect of a supplementrich in alkaline minerals on acid–base balance in humans. J Nutr 2009,8:23–31.
doi:10.1186/1550-2783-9-35Cite this article as: Brancaccio et al.: Supplementation of Acqua LeteW
(Bicarbonate Calcic Mineral Water) improves hydration status in athletesafter short term anaerobic exercise. Journal of the International Society ofSports Nutrition 2012 9:35.
Submit your next manuscript to BioMed Centraland take full advantage of:
• Convenient online submission
• Thorough peer review
• No space constraints or color figure charges
• Immediate publication on acceptance
• Inclusion in PubMed, CAS, Scopus and Google Scholar
• Research which is freely available for redistribution
Submit your manuscript at www.biomedcentral.com/submit


L'assunzione di Acqua minerale bicarbonato calcica Lete® migliora lo stato di idratazione in atleti dopo esercizio anaerobico di breve termine.
P. Brancaccioa, F.M. Limongellia, I. Paolillob, A. D’Apontea, V. Donnarummac, L. Rastrellib*
aSeconda Università di Napoli, Servizio di Medicina dello Sport, Via Costantinopoli 16
80138, Napoli, Italia; bDipartimento di Scienze Farmaceutiche e Biomediche, Università di Salerno, Via Ponte Don
Melillo, 84084 Fisciano, Salerno, Italy; cLaboratorio di diagnostica e ricerca clinica Roecker, Marano di Napoli.
*Corresponding author. Phone: 0039 89969766. Fax: 0039 89969602, E-mail: [email protected]
Abstract
Background: Studi in letteratura suggeriscono che acque minerali con alte concentrazioni di calcio e bicarbonato possono influenzare l’equilibrio acido base. Lo scopo di questo studio è stato quello di valutare su atleti volontari gli effetti dell’assunzione di acqua Lete® (un' acqua minerale naturale bicarbonato calcica) sul bilancio acido-base corporeo e sulla densità urinaria in paragone a quelli esercitati da un'acqua classificata come minimamente mineralizzata. Metodi: 88 atleti maschi volontari sono stati sottoposti a due prove da sforzo utilizzando il Wingate test modificato: la prima prova è stata effettuata senza idratazione (Test C, n=88), la seconda (Test H) dopo una settimana di idratazione controllata con 1.5 L/giorno di acqua, somministrando a 44 atleti l'acqua minimamente mineralizzata (gruppo A) e ad altri 44 Acqua Lete® (gruppo B). Prima (t0), immediatamente dopo (t1), ed a 5’ (t2) e 30’ (t3) dopo l'esercizio sono state effettuate le seguente determinazioni: rilievo della temperature corporea, analisi bioimpedenziometrica, ecografia muscolare, analisi delle urine. Risultati: Il migliore stato di idratazione atteso nel Test H, e dovuto ad un aumento della concentrazione di acqua corporea, è stato confermato da una diminuzione della temperatura corporea e da un aumento dello spessore muscolare, misurato mediante ecografia del quadricipite femorale destro dopo esercizio. Per quanto riguarda l’esame delle urine, nel test H è stato rilevato in entrambi i gruppi di atleti una significativa riduzione del peso specifico urinario dopo lo sforzo, con valori significativamente più bassi nel gruppo B, nello stesso gruppo è stato rilevato inoltre un significativo aumento del pH urinario. Conclusioni: Tutti gli atleti idratati con Acqua Lete® hanno mostrato un effetto positivo sul loro stato di idratazione dopo esercizio anaerobico, associato ad una significativa diminuzione della densità urinaria ed un moderato aumento del pH.
Keywords: Acqua Minerale Lete®; Densità Urinaria; pH Urinario; Acqua Corporea Intracellulare; Ecografia Muscolare.

INTRODUZIONE
Il mondo scientifico e quello dello sport prestano particolare attenzione alle strategie di idratazione al fine di garantire il migliore equilibrio idro-elettrolitico e migliorare la performance [1,2]. L’American College of Sports Medicine [3] e la National Athletic Trainers' Association [4] hanno definito lo stato di idratazione basandosi sulla valutazione del peso specifico delle urine, stabilendo le linee guida, recentemente confermate [5] e raccomandando la conservazione di un ottimo stato di idratazione sia per migliorare la performance che per prevenire gli infortuni
Le acque minerali naturali si distinguono dalle altre acque per la loro specifica origine geologica sotterranea, la composizione stabile di minerali e la loro purezza. Le acque minerali possono esercitare effetti benefici sulla salute [6], compresa la salute delle ossa [7]. Diversi ricercatori hanno suggerito, per esempio, che le acque minerali, in particolare quelle con alte concentrazioni di calcio e bicarbonato, possono avere un impatto sull’idratazione [8], sull' equilibrio acido-base [9] e contribuire alla prevenzione della perdita del tessuto osseo [10]. In letteratura è riportato che acque alcalinizzate possono influenzare l'equilibrio acido-base del corpo. Anche piccole variazioni di pH hanno effetti cruciali sulla funzione cellulare. Burckhardt ha suggerito che il consumo intenzionale di acqua minerale, rappresenta uno dei mezzi più pratici per aumentare il carico nutrizionale di alcali [11]. D’altro canto numerosi studi hanno dimostrato che le acque minerali alcalinizzate, a basso contenuto di SO4
2- e ricche in HCO3- hanno un migliore effetto sul metabolismo del Ca+2 e
sui markers di riassorbimento osseo, rispetto ad acque ricche di SO42- e Ca+2 [12].
Acqua Lete® con contenuti modesti di sodio e (4.88-5.01 mg/L) e potassio (1.93-2.11 mg/L) e con valori significativi di calcio (311.9-334.1 mg/L) e magnesio (13.93-15.14 mg/L), appartiene al gruppo delle acque bicarbonato-calciche (Tabella 1). Scopo del nostro studio è stato quello di esaminare la relazione tra l'assunzione di Acqua Lete® e la distribuzione dell’acqua corporea totale, lo spessore muscolare e i markers urinari di idratazione in 88 atleti dopo esercizio fisico di tipo anaerobico. Basandoci su evidenze sperimentali abbiamo ipotizzato che l'ingestione di Acqua minerale Lete® possa essere correlata con l'equilibrio acido-base corporeo ed in grado di abbassare il peso specifico delle urine e garantire una efficace e corretta idratazione durante l'esercizio a breve termine.
MATERIALI E METODI
Protocollo
88 atleti amatoriali di sesso maschile, hanno partecipato allo studio volontariamente. I soggetti sono stati reclutati in modo consecutivo e suddivisi in due gruppi ciascuno composto da 44 elementi. Gli atleti, nuotatori o podisti, si hanno eseguito allenamenti di 4-5 ore a settimana. Il protocollo seguito è stato approvato dal Comitato Etico (Human Ethics Committee) e ciascun partecipante ha sottoscritto il proprio consenso. Durante l’intero periodo di studio (2 settimane) ciascun atleta ha sospeso le proprie attività di allenamento e l’assunzione di eventuali integratori minerali. I due gruppi di studio sono qui di seguito descritti: Gruppo A: età 34.7 anni ± 7.4 (media ± S.D.); altezza 178.5 cm ± 5.6; peso 79.6 kg ± 6.9, Indice di Massa Corporea (BMI) 24.6 ± 1.2.

Gruppo B: età 33.7 anni ± 8.6 (media ± S.D.); altezza 174.6 cm ± 5.4;peso 79.6 kg ± 9.6, Indice di Massa Corporea (BMI) 25.7 ± 3.4. Entrambi i gruppi sono stati sottoposti a due prove sperimentali, eseguite su ergometro elettricamente frenato (Bycicle SECA Hamburg, Germany) con il seguente protocollo Wingate modificato: cinque serie di 60” ad una velocità media di 80 CPM con recupero di 60” tra le serie. Il carico imposto è stato l’85% del massimale calcolato in una seduta preliminare eseguita una settimana prima del primo test, mediante test incrementale ad esaurimento. I due test eseguiti sono di seguito descritti:
• Test C di controllo, eseguito in condizioni basali senza idratazione, per entrambi i gruppi.
• Test H, eseguito dopo una settimana di idratazione controllata mediante l’assunzione di 1.5 L/die di acqua minimamente mineralizzata (residuo fisso 14.3 mg/l) somministrata al gruppo A, e di 1.5 L/die di acqua bicarbonato calcica (Acqua Lete®) a medio contenuto minerale (residuo secco >840 mg/l), al gruppo B. Inoltre gli atleti hanno ricevuto 750 ml di acqua, utilizzando sempre bottiglie appena aperte, un’ora prima dell’esercizio e 250 ml durante i 30 minuti successivi allo sforzo, come raccomandato dal National Athletic Trainer Association [4].
Prima dei test, tutti i soggetti sono stati sottoposti ad anamnesi e visita medica, per accertarne lo stato di buona salute. Per ciascuna sessione di lavoro (Test C e Test H), sono stati determinati i seguenti parametri: temperature corporea; acqua corporea totale (TBW), acqua extracellulare (ECW), acqua intracellulare (ICW); dimensione del muscolo quadricipite femorale; analisi delle urine La tempistica dei vari esami è stata la seguente:
• A riposo prima dell’esercizio (t0): rilievo della temperatura corporea, esame bioimpedenziometrico per il calcolo di TBW, ECW e ICW, ecografia muscolare per rilevare la dimensione del quadricipite femorale, esame delle urine;
• Immediatamente dopo l’esercizio (t1): rilievo della temperatura corporea;
• 5 minuti dopo l’esercizio (t2): Esame bioimpedenziometrico, esame ecografico muscolare;
• 30 minuti dopo l’esercizio (t3): analisi delle urine
Analisi chimica delle acque
L’acqua minerale bicarbonato calcica, (Acqua Lete®; Società Generale delle Acque Minerali, Pratella, CE, Italia), che è stata utilizzata per l’idratazione del gruppo B è stata fornita agli atleti direttamente dal laboratorio di controllo dello stabilimento di imbottigliamento. L’acqua minerale minimamente mineralizzata è tra quelle reperibili facilmente in commercio su tutto il territorio italiano; questa non contiene quantità significative di minerali o elettroliti di alcun genere. Entrambe le acque sono state analizzate presso i nostri laboratori per la determinazione di 15 parametri chimici caratterizzanti. La maggior parte degli elementi è stata determinata mediante cromatografia ionica (IC) utilizzando uno Dionex , mentre un’aliquota non acidificata è stata utilizzata per la determinazione di pH, conducibilità elettrica, (EC), titolazione dell’alcalinità. I 15 parametri chimici e chimico-fisici determinati

in ciascun campione sono riportati in Tabella 1. I metodi analitici utilizzati sono quelli standard di riferimento adottati delle normative italiane (IRSA - CNR methods 1994). Temperatura corporea
Il rilevo della temperature corporea è stato effettuato mediante termometro timpanico Braun ThermoScan. Esame bioimpedenziometrico La valutazione qualitativa e quantitativa della composizione corporea è stata fatta mediante strumentazione Bodygram AKERN (Firenze Italia) che valuta la composizione corporea e dei tessuti, l’idratazione e lo stato nutrizionale. Il metodo BIA si basa su equazioni empiriche che considerando l’altezza, il peso del soggetto e la resistenza o impedenza a 50 kHz misurata con due elettrodi posti al polso e alla caviglia, permettono la determinazione del volume del liquido e dell'acqua corporea totale in base alla resistività dei tessuti. Sono stati valutati i seguenti parametri: acqua corporea totale (TBW), acqua corporea extracellulare (ECW) e acqua corpo intracellulare (ICW). L'esame a t0 è stato eseguito a digiuno da cibo e bevande, mentre in t2 dopo l'idratazione controllata secondo il protocollo dello studio.
Ecografia muscolare
L’ecografia muscolare è una metodica semplice e non invasiva che consente di rilevare differenze di volume muscolare dopo esercizio. Lo spessore muscolare del quadricipite femorale destro, è stato determinato mediante esame ecografico con una sonda da 10 MHz su soggetti seduti sul lettino con anche e ginocchia flesse a 90° e rilassati, come riportato in precedenza [13]. Lo stesso operatore ha eseguito tutte le misure rilevate al limite fra il III° medio e il III° inferiore della distanza fra la spina iliaca anteriore superiore e il polo superiore della rotula. Il punto rilevato è stato marcato con penna dermografica. Le misure sono state eseguite immediatamente prima dell’esercizio (t0), e 5 minuti dopo il termine del test al cicloergometro (t2). Lo spessore del quadricipite femorale (rectus femoris + vastus intermedius) è stato misurato con la sonda posizionata trasversalmente.
Esame delle urine L'urina è stata raccolta in contenitori di polietilene e miscelati con 5 ml/L di una soluzione al 5% di timolo in isopropanolo. Durante il periodo di raccolta, i contenitori ed il loro contenuto sono stati mantenuti a 5 ° C I campioni di urine sono stati testati per la presenza di sangue e infezioni. Campioni positivi per nitriti ed ematuria sono stati scartati. Il peso specifico delle urine è stato valutato utilizzando un rifrattometro (Atago Digital Urina Rifrattometro Peso specifico). Il pH delle urine è stato registrato utilizzando potenziometro (Rondolino, Mettler Toledo). Il colore delle urine è stato valutato mediante una scala visiva. Vogel 1 (urine giallo, urine giallo pallido, giallo chiaro), Vogel 2 (giallastre, rossastre, rosse), Vogel 3 (rosso bruno e marrone urine).

Analisi Statistica La valutazione statistica dei risultati è stata eseguita utilizzando un pacchetto SPSS per Windows, versione 17.0 (Chicago, IL, USA). Sono stati confrontati i risultati ottenuti per ciascun gruppo durante tutti gli stadi dello studio:
• in test C (senza idratazione) prima e dopo lo sforzo; • in test H (a seguito di idratazione) prima e dopo lo sforzo; • I due gruppi tra loro.
Il significatività statistica dei due gruppi (A e B) è stata determinata mediante il T Test di Student per campioni indipendenti: i parametri statistici sono stati calcolati e i valori espressi come media ± deviazione standard (S.D.). Le relazioni tra le misure raccolti sono stati calcolati con una correlazione bivariata di Pearson. Le differenze sono state considerate statisticamente significative quando p <0.05. RISULTATI e DISCUSSIONE
Tutti i soggetti si sono sottoposti al protocollo sperimentale descritto precedentemente. Tutti i test sono stati eseguiti ad una temperatura ambientale di 19.50±0.53°C con un’umidità del 58.38±0.52%. Test C. Nel primo test effettuato senza idratazione, la temperatura corporea ha mostrato un aumento significativo immediatamente dopo il termine del test cicloergometro (t0-t1): gli atleti hanno iniziato l'esercizio con una temperatura media di 35.9 ± 0.6 °C, raggiungendo alla fine del lavoro 36.5 ± 0,4 °C; p <0.001. Nessuna differenza è stata osservata nella distribuzione corporea di acqua totale, con quasi gli stessi livelli di ICW ed ECW rilevati prima (t0) e 5 minuti dopo l'esercizio fisico (t2) (Tabella 1). L’esame ecografico eseguito a riposo (t0) e 5’ dopo il Wingate test (t2) ha mostrato in entrambi i gruppi una variazione dello spessore muscolare in accordo con i nostri precedenti studi [7] (gruppo A: 29.94 ± 3.89 mm vs 32.29 ± 3.13 mm, p = 0.00; gruppo B: 30.56 ± 3.30 mm vs 33.08 ± 2.89 mm, p = 0.00). L’analisi delle urine raccolte a t0 e t3 non ha mostrato alcuna differenza significativa nel colore; è stato osservato una diminuzione del pH urinario a t2 (Tabella 3) come previsto dopo esercizio anaerobico, mentre il peso specifico urinario dopo lo sforzo ha mostrato un aumento significativo (gruppo A: 1020 ± 4.7 g/L vs 1022 ± 4.4 g/L; p =<0.001; gruppo B: 1018 ± 6.5 g/L vs 1019 ± 5.5 g/L; p = ns), (Figura 1). I dati sul pH e densità delle urine sono stati confrontati anche tra i due gruppi. I valori non hanno mostrato differenze significative Test H. La temperatura corporea ha mostrato un aumento t0-t1 così come si era verificato nel test C (35.9 ± 0.4 °C vs 36.4 ± 0.4 °C; p = <0.001). L’Analisi bioimpedenziometrica eseguita dopo idratazione (Tabella 2), non ha mostrato differenze nel gruppo A, mentre nel gruppo B è stato riscontrato un lieve ma significativo aumento della ECW a riposo e una concomitante diminuzione della ICW. Dopo esercizio il gruppo B, idratato con Acqua Lete® ha mostrato uno spostamento di acqua corporea, dal compartimento extracellulare a quello intracellulare. L'esame ecografico ha rilevato un incremento dello spessore muscolare, così come già osservato nel Test C, (gruppo A: 29.93 ± 3.89 mm vs 32.00 ± 3.61 mm; gruppo B: 30.84 ± 3.47 mm vs 32.82 ± 2.72 mm). In atleti idratati con acqua Lete® è stato osservato un pH delle urine più alcalino rispetto a quelli che hanno idratati con l' acqua minerale minimamente mineralizzata (Tabella 3) ed una significativa riduzione del peso specifico urinario dopo esercizio sforzo, sempre in confronto con gli atleti appartenenti al gruppo A (gruppo A 1014 ± 4.1 g/L vs gruppo B 1008 ± 4.3 g/L; Figura 2).

Molti studi hanno utilizzato il Wingate test e il Wingate test modificato [14], per valutare le risposte fisiologiche all’esercizio anaerobico: nel nostro studio è stata valutata la risposta all’esercizio anaerobico prima e dopo idratazione con un’acqua minerale bicarbonato-calcica chiamata Acqua Lete® in paragone ad un’acqua classificata come minimamente mineralizzata (residuo fisso 14.3 mg/L). Un modesto incremento della temperatura corporea si è verificato nonostante i soggetti avessero eseguito l’esercizio ad un’intensità media per un breve tempo. Sebbene non ci siano conclusioni uniche in letteratura circa la relazione fra temperatura corporea, intensità dell’esercizio e stato di idratazione [15], alcuni studi riportano un aumento della temperatura corporea dopo Wingate test, con un indice di fatica più alto per temperature corporee più alte [16]. Altri studi riportano un aumento della temperatura dopo blando esercizio, come il riscaldamento muscolare, in funzione della durata dell’esercizio [17]. La relazione fra i livelli di idratazione e la temperature corporea è stata ampiamente studiata, e nonostante sia ben documentato che la deidratazione aumenta la temperatura corporea durante esercizio [18], molti studi concordano che l’iperidratazione non fornisce particolari vantaggi nel mantenimento dell’omeostasi idrica durante esercizio [19, 20]. Nel nostro studio abbiamo trovato una modesta ma significativa differenza nei livelli di temperature corporea dopo esercizio fra Test C e Test H (36.5 ± 0.4°C vs 36.4 ± 0.4°C; p= <0.001), con i minori valori dopo idratazione. Questi dati confermano che la corretta idratazione ottenuta nel secondo test, ha garantito il mantenimento di una migliore omeostasi termoregolatoria.
La valutazione della composizione corporea è utile in una serie di contesti clinici per ottenere informazioni relative alle condizioni nutrizionali e alla distribuzione dei fluidi corporei. L’analisi bioimpedenziometrica (BIA) è una tecnica sicura, non invasiva, poco costosa e facile da usare. Studi precedenti hanno accertato l’accuratezza dell’analisi impedenziometrica [21] ed hanno riportato differenze nella distribuzione dell’acqua corporea totale prima e dopo lo sforzo, dovute ad un passaggio della stessa dal comparto extracellulare a quello intracellulare conseguente a modificazioni dell’osmolarità cellulare dopo esaurimento energetico [22, 23]. Numerosi fattori regolano gli spostamenti dei liquidi fra i compartimenti: l’esercizio è un potente stimolo per lo spostamento dei fluidi, determinando una riduzione del volume plasmatico correlato con un aumento della sezione trasversale dei muscoli [24]. Queste conclusioni supportano l’idea che l’esercizio determini un movimento di fluidi dal plasma allo spazio intracellulare e interstiziale. Durante l’esercizio, l’aumento di attività metabolica all’interno delle cellule, porta ad un aumento della pressione osmotica e stimola un influsso di fluidi nel comparto intracellulare per ristabilire l’equilibrio osmotico. Sebbene in letteratura siano riportate variazioni della TBW come conseguenza dell’esercizio di lunga durata [25], noi abbiamo trovato significative variazioni della TBW in entrambi I gruppi di soggetti, durante lo sforzo eseguito senza idratazione (Test C). Al contrario dopo idratazione entrambi I gruppi hanno mostrato un contenuto simile di acqua corporea totale, ma differenti distribuzioni di ECW ed ICW: il gruppo B, idratato con acqua minerale bicarbonato-calcica Lete®, ha mostrato un significativo shift di acqua attraverso il comparto intracellulare. Questo gruppo, rispetto al gruppo idratato con acqua minimamente mineralizzata, ha raggiunto al picco dell’esercizio, un livello di lattatemia più alto (9.8 ± 0.6 mmol/L vs 7.4 ± 0.8 mmol/L; p<0.05), portando presumibilmente ad una variazione del pH intracellulare che attraverso variazioni dell’osmolarità cellulare può essere stata responsabile dell’aumentato volume di acqua nello spazio intracellulare [26].
All’esame ecografico entrambi I gruppi hanno mostrato un analogo incremento di volume muscolare 5 minuti dopo il termine dell’esercizio (gruppo A: 2.14 ± 1.06 mm e gruppo B: 2.55 ± 1.22 mm;). Variazioni di volume e architettura muscolare sono state riportate in

numerosi studi e messe in relazione ai cambiamenti biochimici che insorgono con l’affaticamento muscolare [27]. In un precedente studio, abbiamo trovato dopo test ergometrico, un significativo aumento del volume muscolare, unito a variazioni dell’architettura muscolare [13] probabile conseguenza di edema muscolare. L’aumento del volume muscolare può anche essere il risultato di un diminuito rilassamento muscolare dovuto ad un accumulo intracellulare di Ca++ e H+: in questo caso la stimolazione della via proteolitica Ca++-dipendente degrada proteine strutturali e contrattili e la riduzione del pH riduce il distacco dei legami a ponte [28].
Dopo idratazione abbiamo inoltre trovato in entrambi i gruppi una interessante correlazione fra l’aumento di ICW e lo spessore del quadricipite (gruppo A: r= 0.957, p< 0.001; gruppo B: r= 0.454, p<0.05): in questo caso l’aumentato volume del quadricipite femorale sembra essere dovuto ad un aumentato contenuto di acqua cellulare (gruppo A incremento medio di 2.35 ± 1.27 mm vs gruppo B: 2.52 ± 0.91 mm). La stessa relazione non è stata trovata nel Test C: una possibile spiegazione può essere che nel Test di controllo l’aumento di volume sia prevalentemente dovuto ad una diminuzione del rilassamento muscolare, possibile conseguenza di una seppur modesta disidratazione [29].
L’esame delle urine consente di valutare lo stato di idratazione di atleti e sedentari valutando in particolare l’osmolarità urinaria, il peso specifico ed il colore. Questi parametri sembrano infatti estremamente sensibili alle variazioni dello stato di idratazione e dell’osmolarità plasmatica [30]. In base alle posizioni dell’American College of Sports Medicine [3] e del National Athletic Trainers' Association [4], uno stato di corretta idratazione è definito da un peso specifico urinario minore di 1.020; ipoidratazione da 1.020 a 1.029; e disidratazione importante per valori uguali o maggiori di 1.030. Nel nostro studio abbiamo valutato peso specifico delle urine, pH e colore, prima (t0) e 30’ dopo il termine del test al cicloergometro (t3) in entrambe le sessioni (senza e con idratazione). Quando i gruppi sono stati testati senza idratazione, abbiamo trovato in entrambi un minimo ma significativo incremento del peso specifico dopo esercizio, al contrario, abbiamo potuto riscontare una diminuzione della densità urinaria dopo idratazione acuta. Risultato significativo è stato quello di aver osservato, dopo esercizio, livelli significativamente più bassi del gruppo B rispetto al gruppo A (1008.1 ± 6.3 g/L vs 1014.6 ± 5.1 g/L; p=<0.00). Entrambi i gruppi erano quindi ben idratati, ma il gruppo B, ottenendo un livello medio di peso specifico urinario minore di 1.010, dimostra una migliore idratazione rispetto al gruppo A [5]. Questo risultato può essere attribuito alla specifica composizione chimica delle acque utilizzate nel Test H. Le acque somministrate durante il Test H sono infatti molto diverse tra loro (Tabella 1): l’acqua minimamente mineralizzata è caratterizzata da livelli minimi di calcio e bicarbonato con un residuo di 14.3 mg/l (Tabella 1), l’Acqua Lete® caratterizzata da un contenuto modesto di sodio (4.91mg/L) e potassio (2.10 mg/L) e con un contenuto significativo di bicarbonato (981.1 mg/L), calcio (313.7 mg/L), magnesio (15.12 mg/L) e stronzio (0.15 mg/L) appartiene al gruppo delle acque minerali bicarbonato-calciche. Il peso specifico dipende dal numero e dal peso dei soluti, costituiti prevalentemente da urea ed elettroliti. In condizioni fisiologiche il maggiore assorbimento di acqua induce una diminuzione della concentrazione di soluti, producendo urine con un basso peso specifico, che indica quindi la migliore capacità di trattenere acqua (come riscontrato nel gruppo B). Inoltre il consumo di acqua minerale ricca in magnesio e bicarbonato può aumentare il pH urinario, e l’escrezione di magnesio e citrato, e diminuire la concentrazione di ossalati di calcio [31]. Nel presente studio, l’idratazione con Acqua Lete® è risultata associate ad un significativo aumento del pH urinario, se comparata con l’idratazione mediante acqua minimamente mineralizzata.

In un precedente studio König et al. [32] hanno dimostrato che il consumo di acque ricche di minerali, può aumentare significativamente il pH urinario. Analogamente Heil [9] ha dimostrato che acque minerali arricchite con agenti alcalinizzanti migliorano l’equilibrio acido-base e lo stato di idratazione. Inoltre in un precedente studio abbiamo riportato l'influenza dell’Acqua Lete® sulla concentrazione di lattato ematico in atleti dopo esercizio [26]. Le osservazioni effettuate in questi studi concordano con le variazioni urinarie osservate nel nostro studio nel gruppo B: l’apporto di bicarbonato fornito mediante Acqua Lete® e la sua peculiare composizione chimica produce un effetto alcalinizzante che aumenta i valori di pH urinario.
Conclusioni
Al momento la maggior parte degli studi riportati in letteratura si sono concentrati sul mantenimento di un ottimale stato di idratazione durante esercizio strenuo, mentre poco è stato scritto sulle strategie di idratazione nel caso di esercizi a breve termine, quando le perdite di acqua sono minime e altri aspetti del recupero devono essere presi in considerazione. Il risultati del nostro studio confermano che nell’esercizio di breve durata una corretta idratazione è altrettanto importante che nell’esercizio prolungato. L' assunzione di acqua minerale bicarbonato-calcica denominata Acqua Lete® da parte di atleti amatoriali, prima e dopo il Wingate test, è stato associato ad un aumento del pH urinario e ad un minore peso specifico delle urine, indicando che questa acqua minerale può rappresentare una preziosa risorsa nutrizionale in grado di influenzare lo stato di idratazione degli atleti.
BIBLIOGRAFIA
1. Murray R. Rehydration strategies-balancing substrate, fluid, and electrolyte provision. Int J Sports Med 1998; 19: 133-135.
2. Maughan RJ, Noakes TD. Fluid replacement and exercise stress. A brief review of studies on fluid replacement and some guidelines for the athlete. Sports Med. 1991; 12:16-31.
3. Sawka MN, Burke LM, Eichner ER Maughan RJ, Montain SJ, Stachenfeld SN. American College of Sports Medicine: exercise and fluid replacement. Med Sci Sports Exerc 2007; 39: 377-390.
4. Casa DJ, Armstrong LE, Hillman SK, Montain SJ, Rich B, Roberts WO, Stone JA. National Athletic Trainers' Association Position Statement: Fluid Replacement for Athletes. J Athlet Train 2000; 35: 212-224.
5. Montain SJ. Hydration recommendations for sport. Curr Sports Med Rep 2008; 7: 187-192. 6. Petraccia L, Liberati G, Giuseppe Masciullo S, Grassi M, Fraioli A Water, mineral waters and
health. Clin Nutr. 2006 ;25:377-85. 7. Vandevijvere S, Horion B, Fondu M, Mozin MJ, Ulens M, Huybrechts I, van Oyen H, Noirfalise
Fluoride intake through consumption of tap water and bottled water in Belgium. A Int J Environ Res Public Health. 2009;6:1676-90.
8. Meyer LG, Horrigan DJ Jr, Lotz WG. Effects of three hydration beverages on exercise performance during 60 hours of heat exposure. Aviat Space Environ Med. 1995; 66:1052-7.
9. Heil DP. Acid-base balance and hydration status following consumption of mineral-based alkaline bottled water. J Int Soc Sports Nutr 2010; 7: 29-41.
10. Guillemant J, Accarie C, de la Guéronnière V, Guillemant S. Calcium in mineral water can effectively suppress parathyroid function and bone resorption. Nutr Res 2002; 8: 901-910.
11. Burckhardt P. The effect of the alkali load of mineral water on bone metabolism: Interventional studies. J Nutr 2008; 138: 435S-437S.
12. Wynn E, Raetz E, Burckhardt P. The composition of mineral waters sourced from Europe and North America in respect to bone health: composition of mineral water optimal for bone. Br J Nutr. 2009; 101:1195-1199.

13. Brancaccio P, Limongelli FM, D'Aponte A, Narici M, Maffulli N. Changes in skeletal muscle architecture following a cycloergometer test to exhaustion in athletes. J Sports Sci Med 2008; 11: 538-541.
14. Fattorini L, Egidi F, Faiola F, Pittiglio G. Power output and metabolic response in multiple Wingate tests performed with arms. Medicina dello Sport 2008; 61: 21-28.
15. Casa DJ, Stearns RL, Lopez RM, Ganio MS, McDermott BP, Walker Yeargin, S, Yamamoto LM, Mazerolle SM, Roti MW, Armstrong, LE, Maresh CM. Influence of Hydration on Physiological Function and Performance During Trail Running in the Heat. J Athlet Train 2010; 45: 147-156.
16. Souissi N, Driss T, Chamari K, Vandewall H, Davenne D Gam A, Fillard JR, Jousselin E. Diurnal variation in Wingate test performances: influence of active warm-up. Chronobiol Int 2010; 27: 640-652.
17. Roelands B, Meeusen R Alterations in central fatigue by pharmacological manipulations of neurotransmitters in normal and high ambient temperature. Sports Med. 2010;40:229-46
18. Racinais S, Blonc S, Hue O. Effects of active warm-up and diurnal increase in temperature on muscular power. Med Sci Sports Exerc 2005; 37: 2134-2139.
19. Buono MJ, Wall AJ. Effect of hypohydration on core temperature during exercise in temperate and hot environments. Pflugers Archiv 2000; 440: 476-480.
20. Sawka MN, Montain SJ, Latzka WA. Hydration effects on thermoregulation and performance in the heat. Comp Biochem Physiol Mol Integr Physio 2001; 128: 679-690.
21. De Lorenzo A, Andreoli A, Matthie J, Withers P. Predicting body cell mass with bioimpedance by using theoretical methods: a technological review. J Appl Physiol 1997; 82: 1542-1558.
22. Mohan K, Raja GH, Raymer GR, Marsh G, Thompson GG. Changes in tissue water content measured with multiple-frequency bioimpedance and metabolism measured with 31P-MRS during progressive forearm exercise. J Appl Physiol 2006; 101: 1070-1075.
23. Ploutz-Snyder LL, Convertino VA, Dudley GA. Resistance exercise-induced fluid shifts: change in active muscle size and plasma volume. Am J Physiol 1995; 269: R536-543.
24. Mohsenin V, Gonzalez RR Tissue pressure and plasma oncotic pressure during exercise. J Appl Physiol. 1984; 56:102-8.
25. Baker LB, Lang JA, Kenney WL. Change in body mass accurately and reliably predicts change in body water after endurance exercise. Eur J App Physiol 2009; 105: 959-967.
26. Brancaccio P, Limongelli FM, Paolillo I, Grasso C, Donnarumma V, Rastrelli L. Influence of Acqua Lete® (Bicarbonate Calcic Natural Mineral Water) Hydration on Blood Lactate after Exercise. The Open Sports Med J 2011; 5: 24-30.
27. Rudroff T, Staudenmann D, Enoka R. Electromyographic measures of muscle activation and changes in muscle architecture of human elbow flexors during fatiguing contractions. J Appl Physiol 2008; 104: 1720-1726.
28. Armstrong RB, Warren GL, Warren JA. Mechanism of exercise-induced muscle fibre injury. Sports Med 1991; 12: 184-207.
29. Montain SJ, Tharion WJ. Hypohydration and muscular fatigue of the thumb alter median nerve somatosensory evoked potentials. Appl Physiol Nut Met 2010; 35: 456-463.
30. Oppliger RA, Magnes SA, Popowski LA. Accuracy of urine specific gravity and osmolarity as indicators of hydration status. Int J Sport Nutr Exerc Met 2005; 15: 236-251.
31. Kessler T, Hesse A. Cross-over study of the influence of bicarbonate-rich mineral water on urinary composition in comparison with sodium potassium citrate in healthy male subjects. Br J Nutr 2000; 84: 865-871.
32. König D, Muser K, Dickhuth HH, Berg A, Deibert P. Effect of a supplement rich in alkaline minerals on acid-base balance in humans. J Nutr 2009; 8: 23-31.

Tabella 1. Caratteristiche chimiche delle acque minerali utilizzate nello studio* Parametri Unità di
Misura Acqua Lete Acqua
Minimamente Mineralizzata
Conducibilità mS/cm 1321.40 ± 46.10 17.57 ± 0.91 pH pH 6.14 ± 1.91 5.00 ± 0.21
Residuo Fisso mg/l 878.41 ± 25.21 14.31 ± 0.68 CO2 mg/L 1890.12 ± 72.51 15.22 ± 0.77 HCO3- mg/l 981.11 ± 33.82 3.51 ± 0.15 Cl- mg/l 8.24 ± 2.22 0.41 ± 0.02 SO4
2- mg/l 6.60 ± 0.91 1.40 ± 0.08 NO3
- mg/l 4.14 ± 0.20 1.91 ± 0.08 Na+ mg/l 4.91 ± 0.33 1.21 ± 0.05 K+ mg/l 2.10 ± 0.08 0.32 ± 0.01 Ca++ mg/l 313.70 ± 9.81 1.11 ± 0.05 Mg++ mg/l 15.12 ± 3.92 0.42 ± 0.03 Fe mg/l 0.02 ± 0.01 < 0.01 Sr++ mg/l 0.15 ± 0.01 < 0.1 Li+ mg/l < 0.01 < 0.01 *I risultati riportati sono la media ± SD di analisi eseguite in triplicato

Tabella 2. Acqua corporea totale (TBW), acqua extracellulare (ECW) e acqua intracellulare
(ICW)* rilevate nel Test C e nel Test H prima e dopo esercizio*
__________________________________________________________________________________________
Test C TBW ECW ICW
t0 t3 t0 t3 t0 t3
__________________________________________________________________________________________
Gruppo A 56.69±1.14a 55.30±1.05a 40.60±2.48 41.20±2.84 59.40±2.40 58.81±2.84
Gruppo B 57.50±1.80b 55.87±0.75b 37.76±4.17 37.46±2.82 62.24±4.17 62.54±2.82
__________________________________________________________________________________________
Test H TBW ECW ICW
t0 t3 t0 t3 t0 t3
__________________________________________________________________________________________
Gruppo A 57.83±3.75 57.43±5.01 40.85±2.87 40.57±2.42 59.15±2.87 59.43±2.42
Gruppo B 57.84±2.26 57.37±3.11 38.47±1.11c 37.10±1.04c 61.53±1.14d 62.94±0.94d
__________________________________________________________________________________________ *I valori sono espressi in percentuale (%) I dati sono espressi come media ± SD: n=44; I valori sono significativamente differenti rispetto ai valori di riposo (t0): a e bp < 0.001; c e dp < 0.05 _____________________ Tabella 3. pH delle urine in Test C (controllo) e Test H (idratazione) prima e dopo esercizio*
______________________________________________________________
Test C t0 t2
______________________________________________________________
Gruppo A 5.6 ± 0.2a 5.3 ± 0.1a
Gruppo B 5.6 ± 0.4 5.4 ± 0.5
______________________________________________________________
Test H t0 t2
______________________________________________________________
Gruppo A 5.5 ± 0.8 5.4 ± 0.9
Gruppo B 5.4 ± 0.2b 5.7 ± 0.1b
______________________________________________________________ *I dati sono espressi come media ± SD: n=44; I valori sono significativamente differenti: a e bp < 0.05
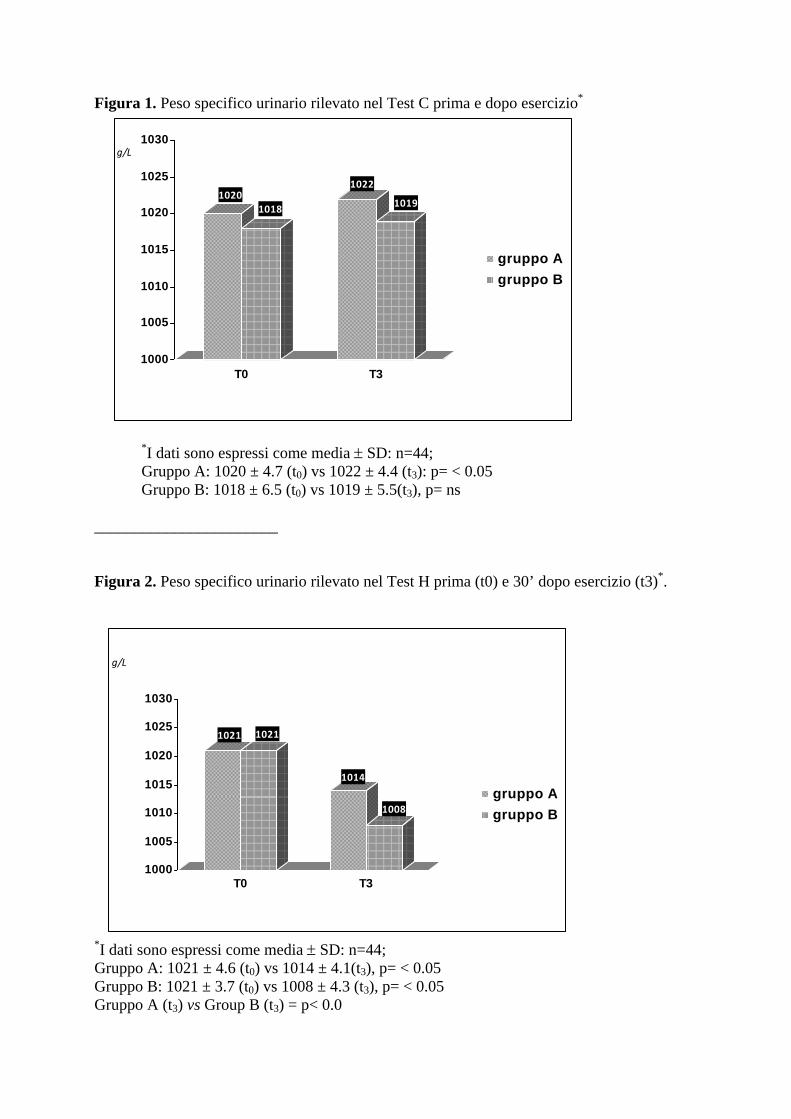
Figura 1. Peso specifico urinario rilevato nel Test C prima e dopo esercizio*
*I dati sono espressi come media ± SD: n=44; Gruppo A: 1020 ± 4.7 (t0) vs 1022 ± 4.4 (t3): p= < 0.05 Gruppo B: 1018 ± 6.5 (t0) vs 1019 ± 5.5(t3), p= ns _______________________ Figura 2. Peso specifico urinario rilevato nel Test H prima (t0) e 30’ dopo esercizio (t3)*.
*I dati sono espressi come media ± SD: n=44; Gruppo A: 1021 ± 4.6 (t0) vs 1014 ± 4.1(t3), p= < 0.05 Gruppo B: 1021 ± 3.7 (t0) vs 1008 ± 4.3 (t3), p= < 0.05 Gruppo A (t3) vs Group B (t3) = p< 0.0
10201018
1022
1019
1000
1005
1010
1015
1020
1025
1030
T0 T3
g/L
gruppo Agruppo B
1021 1021
1014
1008
1000
1005
1010
1015
1020
1025
1030
T0 T3
g/L
gruppo Agruppo B

24 The Open Sports Medicine Journal, 2011, 5, 24-30
1874-3870/11 2011 Bentham Open
Open Access
Influence of Acqua Lete® (Bicarbonate Calcic Natural Mineral Water)
Hydration on Blood Lactate After Exercise
P. Brancaccio*,1
, F.M. Limongelli1, I. Paolillo
2, C. Grasso
1, V. Donnarumma
3 and L. Rastrelli
2
1Seconda Università di Napoli, Servizio di Medicina dello Sport, Via Costantinopoli 16 80138, Napoli, Italy
2Dipartimento di Scienze Farmaceutiche, Università di Salerno, Via Ponte Don Melillo, 84084 Fisciano, Salerno, Italy
3Laboratorio di diagnostica e ricerca clinica Roecker, Marano di Napoli, Italy
Abstract: Purpose: This investigation examined the effects of Acqua Lete® bicarbonate calcic mineral water ingestion on
blood lactate, glucose, and serum lactate dehydrogenase.
Methods: 88 amateur male athletes underwent two experimental trials with modified Wingate test: the first was carried out
without hydration (Test C), the second (Test H) with hydration following this scheme: 44 subjects (Group A) hydrated by
a very low mineral content water and 44 subjects (Group B) hydrated by Acqua Lete®
. Measures of body temperature,
[La-], glucose, total LDH and its isoenzyme pattern, were taken before (T0), during (T1-T5), and after exercise (T6-T7).
Results: Blood lactate significantly increased after the session of exercises in both groups: after hydration and 30’ of
resting (T7) Group B returned a level of lactate lower than the Group A (2.2±0.2 vs 2.9±0.3mmol/L; p<0.001). In Test H,
LDH activities after exercise did not change but serum LDH5 isoenzyme activity decreased by 0.9% in athletes in Group
B compared to Group A (p< 0.05).
Conclusions: All the athletes (Group B) hydrated pre-exercise with Acqua Lete® showed a significant decrease in blood
lactate levels post-exercise and changes in LDH isoenzymatic pattern compared with athletes hydrated pre-exercise with a
low mineral content water.
Keywords: Acqua Lete®
mineral water, hydration, blood glucose, blood lactate, LDH isoenzymes, urinary specific gravity.
INTRODUCTION
Lactic acid (La) at physiological pH is dissociated more than 99% into La anions and protons (H
+). During exercise
and muscle contractions, muscle and blood [La-] and [H
+]
can rise to very high levels. Most researchers have argued that any detrimental effects of La on muscle and exercise performance are due to H
+ rather than La
- [1]. However,
some studies have recently identified strategies that may help to lower blood lactate levels during exercise and have a better recovery [2, 3]. High activity of cytosolic LDH is considered to guarantee La
- formation in the cytosol under
virtually all conditions but especially during exercise; total serum LDH and specific isoenzymes activities change with training status of the athlete. Variation in LDH isoenzymes profile might have a role in studying muscle response to training and particularly LDH5 is the isoenzyme involved in lactate production [4]. Lactate production is compensated by the displacement of bicarbonate into carbon dioxide, which is lost through the lungs during exercise more rapidly than it is produced by cell respiration [5]. Alkalinizing agents including sodium bicarbonate (NaHCO3), mineral-based alkaline bottled water, nutritional drinks and mineral waters containing more than 600 mg/L of bicarbonate, have been
*Address correspondence to this author at the Seconda Università di Napoli,
Servizio di Medicina dello Sport, Via Costantinopoli 16 80138, Napoli,
Italy; Tel: 0039 815665908; Fax: 0039 815665864;
E-mail: [email protected]
proposed for their potential effects on providing enhanced extracellular buffer capacity, leading to the elevated proton efflux from the contracting musculature [6-8] and elevated plasma HCO3
- can improve exercise endurance in humans
[9]. According to current EEC directives mineral waters, are of underground origin, protected from contamination, and microbiologically wholesome; present a peculiar and constant chemical composition, and have favorable effects on health; they must be bottled at source into safe and checked containers. Acqua Lete® mineral water shows calcium concentrations of 314 mg/L, magnesium levels of 15 mg/L and bicarbonate levels of 981 mg/L, implying very high calcium and bicarbonate mineral water. The Acqua Lete® exhibits other peculiarities, notably high levels of carbon dioxide, and low contents of sodium and potassium. Bicarbonate waters may neutralize acid secretion, accelerate gastric empting, and provoke the release of gastric peptides (like gastrin and endorphins). They are indicated in hydrochloric-peptic hypersecretion and gastro-esophageal reflux disease [10]. During physical activity they restore liquids and salts, facilitate nitrogen waste clearance and counterbalance metabolic acidosis, which is typical of the effort syndrome of the sportsman [11].
The aim of this study was to investigate the effectiveness of a hydration strategy prior to exercise involving the ingestion of Acqua Lete® mineral water on blood lactate concentration and serum levels of LDH in 88 amateur athletes.

Influence of Acqua Lete® (Bicarbonate Calcic Natural Mineral Water) The Open Sports Medicine Journal, 2011, Volume 5 25
METHODS
Participants
All testing procedures were approved by the institution’s Human Research Ethics committee. Eighty-eight male amateur athletes volunteered to participate in the study. All potential participants attended a familiarization session where details of the test protocol and their time commitment were described. All participants were advised that they were free to withdraw from testing at any time without any adverse consequences. Upon completion of the consent form participants were randomly selected into one of two groups of 44 subjects:
Group A : aged 34.7 y ± 7.4 (mean ± S.D.); height 178.5 cm ± 5.6; weight 79.6 kg ± 6.9, and Body Mass Index (BMI) 24.6 ± 1.2.
Group B : aged 33.7 y ± 8.6 (mean ± S.D.); height 174.6 cm ± 5.4; weight 79.6 kg ± 9.6, and Body mass Index (BMI) 25.7 ± 3.4.
Study Design
Both groups underwent two experimental trials, performed on an electrically braked ergometer (Bycicle SECA Hamburg, Germany) with a modified repeated Wingate protocol: five bouts of cycling of 60” with a mean speed of 80 RPM and 60” of recovery between the sessions. The workload was 85% of their maximal workload calculated in a preliminary session a week before the first Test, with an incremental cycle test until exhaustion. Before the test all the athletes complete a 2 minutes of warm up on treadmill, with a speed of 4 Km/hr without grade.
The two Tests were:
• Test C of control, in basal conditions and without hydration the day of trial, for both groups.
• Test H, after one week of controlled hydration with 1.5 L/die of a very low mineral content water (dry residues 14.3 mg/l) in Group A and 1.5 L/die of a bicarbonate calcic water (Acqua Lete®) with a medium mineral content (dry residues >840 mg/l), in Group B. Moreover, athletes received 750 ml of water using freshly opened bottles one hour before the exercise and 250 ml of water in the following 30 minutes after effort, as recommended by National Athletic Trainer Association [8].
Before testing, all participants received a physical examination including medical history. In each session of work (Test C and Test H), was detected:
• At rest before the exercise (T0): blood concentration of lactate, glucose, total serum LDH and its isoenzymes, urinary specific gravity;
• During exercise, after each bouts of cycling (T1, after 1 minute cycling; T2, after 2 minutes cycling; T3, after 3 minutes cycling; T4, after 4 minutes cycling): blood glucose;
• immediately after the last session of exercise (T5, after 5 minutes cycling): blood glucose and blood lactate;
• 5 minute after exercise (T6): blood glucose and blood lactate;
• 30 minutes after exercise (T7): blood concentration of lactate, glucose, total serum LDH and its isoenzymes, urinary specific gravity;
Testing Procedures
Blood Lactate Concentration
We have taken a drop of blood by pricking the fingertip after cleaning the sweat with cotton wool and wipe off the first drop of blood. Samples have been collected by inserting a La
- strip into a calculator-sized instrument and then
touching the strip with a drop of blood: the sample is drawn into the strip by capillary action. Lactate concentration (mmol/L) have been measured on whole blood before and after exercise (T0, T5, T6, T7) using an amperometric method with an enzymatic electrode (Lactate Pro, Arkray, Kyoto, Japan).
LDH and Isoenzymes Analysis
Blood samples were taken from a forearm vein by a trained nurse. The post-exercise blood samples were taken immediately after the cycling. The blood samples were put in ice bath and sent to the laboratory for analysis. The relative value of each lactic dehydrogenase isoenzyme (iso LDH) was measured by electrophoretic separation on a cool serum within 12 hours after blood sample was taken. LDH enzymes were analyzed with a spectrometric monotest method, (Pharmacia LKB-vitrospec) at 25°C of temperature, taking into consideration the following values as normal: LDH= 113 - 189 U/L. Isoenzymatic evaluation was performed by agarose-gel electrophoresis and determined by Beckman Appraise Densitometer System method and expressed as a percentage of the total LDH activity.
Blood Glucose
Blood was collected by fingertip and blood glucose concentration (mmol/L) was measured using a One Touch Ultra 2 glucometer per the manufacturer’s instructions Johnson & Johnson instrument.
Urinary Specific Gravity
The urine was collected in polyethylene containers and mixed with 5 ml/L of a 5% solution of thymol in isopropanol to preserve the urine. During the collection period, the containers and their contents were maintained at 5°C. Urine samples were tested for the presence of blood and infection. Nitrite-positive and hematuria samples were discarded. Urinary specific gravity was recorded by Bayern Ketostix
Water Analysis
The bicarbonate-rich mineral water Acqua Lete (Acqua Lete®; Società Generale delle Acque Minerali, Pratella, CE, Italy), was consumed by the experimental Group B and shipped directly to the testing lab from its bottling facility. The very low mineral content water used for Group A is commonly available throughout Italy; contains no significant minerals or electrolytes whatsoever. Very low mineral content and Acqua Lete waters were also analyzed for 15 chemical parameters in our laboratory. Most of the elements were analyzed by ion chromatography (IC) using a Dionex

26 The Open Sports Medicine Journal, 2011, Volume 5 Brancaccio et al.
instrument, while a non-acidified aliquot was used to determine pH, electrical conductivity (EC), to titrate alkalinity. The 15 chemical and chemical-physical variables measured on each sample are listed in Table 1. Analytical methods are not further discussed here since they represent standard methods fixed by Italian regulations (IRSA - CNR methods 1994).
Table 1. Chemical Characteristics of Mineral Waters Used in
the Study*
Parameter Measurement
Unit Acqua Lete
Very Low
Mineral Content
Conductivity mS/cm 1321.40 ± 46.10 17.57 ± 0.91
pH pH 6.14 ± 1.91 5.00 ± 0.21
Fixed residue mg/l 878.41 ± 25.21 14.31 ± 0.68
CO2 mg/L 1890.12 ± 72.51 15.22 ± 0.77
(HCO3-) mg/l 981.11 ± 33.82 3.51 ± 0.15
Cl- mg/l 8.24 ± 2.22 0.41 ± 0.02
SO42- mg/l 6.60 ± 0.91 1.40 ± 0.08
NO3- mg/l 4.14 ± 0.20 1.91 ± 0.08
Na+ mg/l 4.91 ± 0.33 1.21 ± 0.05
K+ mg/l 2.10 ± 0.08 0.32 ± 0.01
Ca++ mg/l 313.70 ± 9.81 1.11 ± 0.05
Mg++ mg/l 15.12 ± 3.92 0.42 ± 0.03
Fe mg/l 0.02 ± 0.01 < 0.01
Sr++ mg/l 0.15 ± 0.01 < 0.1
Li+ mg/l < 0.01 < 0.01
*Each result represents the mean ± SD of three analysis for each water.
Statistical Analysis
Statistical analysis was performed by SPSS statistical package for Windows, release 17.0 (Chicago, IL, USA). We compared the data collected in each group at every step of work:
• in test C (without hydration) before and after exercises;
• in the test H (with hydration) before and after exercises;
• the two groups to each other.
Statistical significance between Group A and Group B was evaluated by Student’s T Test for independent samples: descriptive statistics were calculated, and values reported are mean ± standard deviation. Statistical significance within Group A and Group B, comparing Test C and Test H, was evaluated by Student’s T Test for paired samples: descriptive statistics were calculated, and values are reported as mean ± standard deviation. Differences were considered statistically significant when p<0.05.
RESULTS
All the subjects underwent the protocol previously described. Tests were performed at an environmental
temperature of 19.50±0.53°C with a wetness of 58.38±0.52%.
Blood Lactate
Table 2 identifies the lactate levels produced by participants under each test condition. In detail, without hydration (Test C), both groups started with the same mean values of [La
-] reached similar levels at peak of exercise and
showed after 30 minutes resting the same blood lactate concentration, with a rate of decrease of 44.77 % in Group A vs 46.26 % in Group B. Some studies evaluate blood lactate after Wingate test, reporting a peak of blood lactate concentration between the 3rd and the 8th minute after effort [12, 13], with an almost complete recovery within the 10 minutes after the test [14]. In fact the shortness of exercise provides a delayed onset of lactate: in our study the modified Wingate test is longer than usual and therefore the lactate accumulation begins during exercise, reaching a peak at the end of it. Comparing Test C and Test H, we saw that after hydration, peak lactate values at T5 were increased by 10.4 % in Group A and of 44.2% in Group B probably for the higher rest levels detected in this Group in the Test H (Table 2). Moreover, comparing the response of two groups after hydration (Fig. 1), we found that Group B, despite reaching higher peak levels of lactate at the end of exercise (T5), when compared to Group A, showed a better blood lactate removal, with a decrease over the 30 minutes recovery period (T7) of 77.5 % vs 60.8 % (Table 2).
LDH and Glucose
Comparing the groups in Test C before and after exercise (Table 3), we found almost the same isoenzymatic pattern. In Test H, (Table 4) LDH5 decreased significantly after exercise (4.0±0.7% vs 6.2±0.9%, p<0.05). Blood glucose showed a progressive decrease of its levels during the exercise in both groups during Test C and Test H (Table 5).
Urinary Specific Gravity
When the groups were tested without hydration, we found in both group a slight but significant increase of urine gravity after exercise (Group A: 1020 ± 4.7 g/L at rest vs 1022 ± 4.4 g/L after exercise; p=<0.001; Group B: 1018 ± 6.5 g/L at rest vs 1019 ± 5.5 g/L after exercise; p= ns): conversely we expected the decreasing of urinary specific gravity after acute hydration, but we found that group B reached after exercise a significantly lower level than group A (1008.1 ± 6.3 g/L vs 1014.6 ± 5.1 g/L; p=<0.001), reflecting a better hydrated condition (Fig. 2).
DISCUSSION
Many studies have used Wingate Test [15, 16] and modified Wingate Test [17], to evaluate physiological responses to anaerobic exercise. In our study we evaluate the response to anaerobic exercise before and after hydration with a bicarbonate-calcic mineral water, named Acqua Lete, compared to very low mineral content water (dry residues 14.3 mg/L).
The importance of [La-] as a carbohydrate fuel source is
now underscored [18]: in short term exhaustion exercise, muscle produces La
- quickly, while its clearance is slow.
Lactate enters the plasma from interstitial fluid of active

Influence of Acqua Lete® (Bicarbonate Calcic Natural Mineral Water) The Open Sports Medicine Journal, 2011, Volume 5 27
muscle and from the plasma into the red blood cells (RBC), which are in equilibrium with plasma, so that RBC/plasma ratio is almost constant. The tool we used for blood lactate evaluation was Lactate Pro, which measures lactate in whole blood lysing RBC, and has been found to be a reliable instrument for lactate detection [19]. In Test C, without hydration (Fig. 1), we found in both groups an increase of lactate levels immediately after exercise (T5) remaining elevated until the 5th minute and returning at lower values 30 minutes after exercise (Table 2). In the second test with hydration (Test H, Table 2) the groups showed different responses: the Group B, despite reaching a higher increase of lactate at the end of exercise (490% vs 462%, p<0.05), had
significantly lower values after 30 minutes, than the Group A (2.2±0.2 mmol/L vs 2.9±0.3 mmol/L, respectively; p<0.001). Hydration status has been widely studied, detecting its incidence on lactate threshold, showing that, low levels of hydration; change the trigger of anaerobic metabolism [20, 21]. In fact, according with literature, the better hydration status improved the recovery after exercise in both groups of athletes, with a rate of decrease of lactate higher in test H respect the test C.
Besides in our study the mineral ion composition of water seems to have had an effect on blood lactate: the water administered during the second trial were very different (Table 1), the very low mineral content water had low levels
Fig. (1). Differences between not hydrated (Test C) and hydrated athletes (Test H) in terms of the [La-] response to exercise and recovery.
Group A (n=44) hydrated by a very low mineral content, Group B (n=44) hydrated by Acqua Lete mineral water.
Table 2. Blood Lactate Levels* During and After Session Exercise
**
Test C Rest (T0) T5 T6 T7 *
Group A 1.7±0.4 6.7±0.6a 394% 7.1±0.9 3.7±0.7b 44.77% e
Group B 1.7±0.3 6.8±0.8a 400% 6.3±0.8 3.7±0.6b 46.26% d
Test H Rest (T0) T5 T6 T7 *
Group A 1.6±0.2 7.4±0.8a, 462% 6.1±0.7 2.9±0.3b, 60.80% c e
Group B 2.0±0.5 9.8±0.6a, 490% 7.1±0.4 2.2±0.2b, 77.55% c d
Group A: Control water. Group B: Lete Water. *Values are expressed in mmol/L. **Mean±SE, n=88.
rate of increase measured in percentage (%) respect T0.
* rate of decrease measured in percentage (%) respect T5. aSignificantly different from resting values, P < 0.05. bSignificantly different from resting values, P < 0.001. c,d P < 0.001. e P < 0.05. Test C: test performed without hydration.
Test H: test performed with hydration. Group A: subjects hydrated with control water.
Group B: subject hydrated with Lete water. T5: immediately after exercise.
T6: 5 minutes after exercise.
T7: 30 minutes after exercise.

28 The Open Sports Medicine Journal, 2011, Volume 5 Brancaccio et al.
of calcium and bicarbonate and a dry residues of 27 mg/l (Table 1), the Acqua Lete mineral water with significant contents of bicarbonate (981.1 mg/L), calcium (313.7 mg/L) and magnesium (15.12 mg/L), belongs to the group of the bicarbonate-calcics and exhibits other interesting peculiari-ties, notably high levels of carbon dioxide (1890.12 mg/L), interesting amount of Sr
++ (0.15 mg/L) and low
contents of sodium (4.91 mg/L) and potassium (2.10 mg/L).
Table 3. Enzyme activities (± s.d.) at each testing stage (n=88)
in Test C
Enzyme Rest (T0) T7
Group A
Serum total LDH* 287.6±59.6 279.7±64.1
LDH1** 25.4±1.6 24.6±1.78
LDH2** 37.3±0.8 36.4±1.31
LDH3** 24.0±0.7 25.9±1.01
LDH4** 7.8±1.3 8.0±1.26
LDH5** 5.5±1.1b 5.1±1.31b
Group B
Serum total LDH* 347.5±42.0 334.7±53.1
LDH1** 26.3±1.3 25.3±1.8
LDH2** 36.2±0.6 35.8±1.2
LDH3** 24.3±1.8 25.9±0.5
LDH4** 7.9±1.3 8.4±1.4
LDH5** 5.3±1.3a 4.6±0.8a
*Values are expressed in U/L.
**% total LDH. aSignificantly different from resting value, P < 0.001. bSignificantly different from resting values, P < 0.05.
Fig. (2). Urinary specific gravity detected in Test H before and after
exercise. T0=: before exercise; T7= 30 minutes after exercise.
In athletes hydrated with Acqua Lete we found a significant decrease of specific urinary gravity after effort, in fact subjects who drank Acqua Lete mineral water (Group B) showed a significant lower mean values of specific urinary gravity when compared with athletes belonging to Group A (Fig. 2).
Research has shown that the free intake of mineral rich alkalizing bottled water, could improve hydration status in young adults [22]. However, studies about the effect of bicarbonate ingestion on metabolic response are often conflicting. A study conduct on horses by Schuback et al. in 2002 reported no effect of sodium bicarbonate ingestion on metabolic response and duration of exercise [23]; contrariwise other study reported in athletes, show an improved performance in a way dose-dependent [24-26] and probably by increasing buffering capacity [27, 28]. Alkalinizing agents, including sodium bicarbonate, have been proposed as ergogenic aids for their potential effect on providing enhanced extracellular buffer capacity. In fact increased blood lactate, commonly observed with metabolic alkalosis, results from a complex series of events which modulate the activities of the key regulatory enzymes, resulting in a mismatch between the rates of pyruvate production and oxidation [29]; metabolic alkalosis leads to an increased lactate production and intramuscular accumulation resulting from the absence of downregulation of glycogenolysis and glycolysis that typically occurs as pH declines.
Table 4. Enzyme Activities (± s.d.) at Each Testing Stage
(n=88) in Test H
Enzyme Rest (T0) T7
Group A
Serum total LDH* 304.4±52.4 301.2±51.9
LDH1** 25.2±1.0 23.1±1.9
LDH2** 36.6±1.9 38.3±1.3
LDH3** 23.5±1.5 24.8±0.4
LDH4** 8.2±1.3 7.6±1.3
LDH5** 6.5±1.3b 6.2±0.9bc
Group B
Serum total LDH* 340.5±70.4 334.7±53.1
LDH1** 26.8±1.2 27.8±1.7
LDH2** 35.6±1.9 36.3±0.8
LDH3** 24.7±1.9 25.0±1.4
LDH4** 7.5±1.2 6.9±0.9
LDH5** 5.4±1.2a 4.0±0.7ac
* Values are expressed in U/L.
**% total LDH. aSignificantly different from resting value, P < 0.001. bSignificantly different from resting values, P < 0.05. c P < 0.05
In our study the specificity of the Acqua Lete water, with the combination of high calcium content and a buffering agent, may have affected the increase of lactate at peak of exercise and the restore after exercise, leading to minimal, but significantly lower levels of [La
-] after effort. The
intracellular lactate shuttle (ILS) hypothesis holds that lactate produced as the result of glycolysis and glycogenolysis in the cytosol, is balanced by oxidative removal in mitochondria of the same cell. The presence of intracellular lactate shuttles gives rise to the notion that
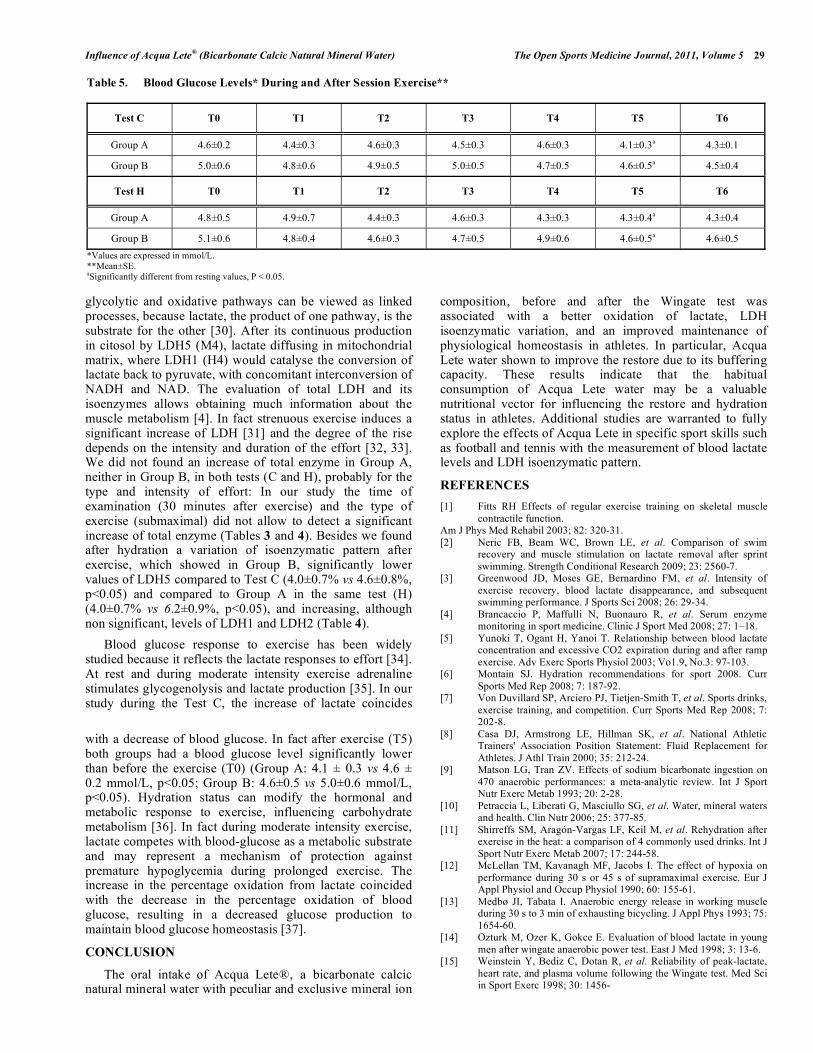
Influence of Acqua Lete® (Bicarbonate Calcic Natural Mineral Water) The Open Sports Medicine Journal, 2011, Volume 5 29
glycolytic and oxidative pathways can be viewed as linked processes, because lactate, the product of one pathway, is the substrate for the other [30]. After its continuous production in citosol by LDH5 (M4), lactate diffusing in mitochondrial matrix, where LDH1 (H4) would catalyse the conversion of lactate back to pyruvate, with concomitant interconversion of NADH and NAD. The evaluation of total LDH and its isoenzymes allows obtaining much information about the muscle metabolism [4]. In fact strenuous exercise induces a significant increase of LDH [31] and the degree of the rise depends on the intensity and duration of the effort [32, 33]. We did not found an increase of total enzyme in Group A, neither in Group B, in both tests (C and H), probably for the type and intensity of effort: In our study the time of examination (30 minutes after exercise) and the type of exercise (submaximal) did not allow to detect a significant increase of total enzyme (Tables 3 and 4). Besides we found after hydration a variation of isoenzymatic pattern after exercise, which showed in Group B, significantly lower values of LDH5 compared to Test C (4.0±0.7% vs 4.6±0.8%, p<0.05) and compared to Group A in the same test (H) (4.0±0.7% vs 6.2±0.9%, p<0.05), and increasing, although non significant, levels of LDH1 and LDH2 (Table 4).
Blood glucose response to exercise has been widely studied because it reflects the lactate responses to effort [34]. At rest and during moderate intensity exercise adrenaline stimulates glycogenolysis and lactate production [35]. In our study during the Test C, the increase of lactate coincides
with a decrease of blood glucose. In fact after exercise (T5) both groups had a blood glucose level significantly lower than before the exercise (T0) (Group A: 4.1 ± 0.3 vs 4.6 ± 0.2 mmol/L, p<0.05; Group B: 4.6±0.5 vs 5.0±0.6 mmol/L, p<0.05). Hydration status can modify the hormonal and metabolic response to exercise, influencing carbohydrate metabolism [36]. In fact during moderate intensity exercise, lactate competes with blood-glucose as a metabolic substrate and may represent a mechanism of protection against premature hypoglycemia during prolonged exercise. The increase in the percentage oxidation from lactate coincided with the decrease in the percentage oxidation of blood glucose, resulting in a decreased glucose production to maintain blood glucose homeostasis [37].
CONCLUSION
The oral intake of Acqua Lete®, a bicarbonate calcic natural mineral water with peculiar and exclusive mineral ion
composition, before and after the Wingate test was associated with a better oxidation of lactate, LDH isoenzymatic variation, and an improved maintenance of physiological homeostasis in athletes. In particular, Acqua Lete water shown to improve the restore due to its buffering capacity. These results indicate that the habitual consumption of Acqua Lete water may be a valuable nutritional vector for influencing the restore and hydration status in athletes. Additional studies are warranted to fully explore the effects of Acqua Lete in specific sport skills such as football and tennis with the measurement of blood lactate levels and LDH isoenzymatic pattern.
REFERENCES
[1] Fitts RH Effects of regular exercise training on skeletal muscle
contractile function. Am J Phys Med Rehabil 2003; 82: 320-31.
[2] Neric FB, Beam WC, Brown LE, et al. Comparison of swim recovery and muscle stimulation on lactate removal after sprint
swimming. Strength Conditional Research 2009; 23: 2560-7. [3] Greenwood JD, Moses GE, Bernardino FM, et al. Intensity of
exercise recovery, blood lactate disappearance, and subsequent swimming performance. J Sports Sci 2008; 26: 29-34.
[4] Brancaccio P, Maffulli N, Buonauro R, et al. Serum enzyme monitoring in sport medicine. Clinic J Sport Med 2008; 27: 1–18.
[5] Yunoki T, Ogant H, Yanoi T. Relationship between blood lactate concentration and excessive CO2 expiration during and after ramp
exercise. Adv Exerc Sports Physiol 2003; Vo1.9, No.3: 97-103. [6] Montain SJ. Hydration recommendations for sport 2008. Curr
Sports Med Rep 2008; 7: 187-92. [7] Von Duvillard SP, Arciero PJ, Tietjen-Smith T, et al. Sports drinks,
exercise training, and competition. Curr Sports Med Rep 2008; 7: 202-8.
[8] Casa DJ, Armstrong LE, Hillman SK, et al. National Athletic Trainers' Association Position Statement: Fluid Replacement for
Athletes. J Athl Train 2000; 35: 212-24. [9] Matson LG, Tran ZV. Effects of sodium bicarbonate ingestion on
470 anaerobic performances: a meta-analytic review. Int J Sport Nutr Exerc Metab 1993; 20: 2-28.
[10] Petraccia L, Liberati G, Masciullo SG, et al. Water, mineral waters and health. Clin Nutr 2006; 25: 377-85.
[11] Shirreffs SM, Aragón-Vargas LF, Keil M, et al. Rehydration after exercise in the heat: a comparison of 4 commonly used drinks. Int J
Sport Nutr Exerc Metab 2007; 17: 244-58. [12] McLellan TM, Kavanagh MF, Jacobs I. The effect of hypoxia on
performance during 30 s or 45 s of supramaximal exercise. Eur J Appl Physiol and Occup Physiol 1990; 60: 155-61.
[13] Medbø JI, Tabata I. Anaerobic energy release in working muscle during 30 s to 3 min of exhausting bicycling. J Appl Phys 1993; 75:
1654-60. [14] Ozturk M, Ozer K, Gokce E. Evaluation of blood lactate in young
men after wingate anaerobic power test. East J Med 1998; 3: 13-6. [15] Weinstein Y, Bediz C, Dotan R, et al. Reliability of peak-lactate,
heart rate, and plasma volume following the Wingate test. Med Sci in Sport Exerc 1998; 30: 1456-
Table 5. Blood Glucose Levels* During and After Session Exercise**
Test C T0 T1 T2 T3 T4 T5 T6
Group A 4.6±0.2 4.4±0.3 4.6±0.3 4.5±0.3 4.6±0.3 4.1±0.3a 4.3±0.1
Group B 5.0±0.6 4.8±0.6 4.9±0.5 5.0±0.5 4.7±0.5 4.6±0.5a 4.5±0.4
Test H T0 T1 T2 T3 T4 T5 T6
Group A 4.8±0.5 4.9±0.7 4.4±0.3 4.6±0.3 4.3±0.3 4.3±0.4a 4.3±0.4
Group B 5.1±0.6 4.8±0.4 4.6±0.3 4.7±0.5 4.9±0.6 4.6±0.5a 4.6±0.5
*Values are expressed in mmol/L. **Mean±SE. aSignificantly different from resting values, P < 0.05.

30 The Open Sports Medicine Journal, 2011, Volume 5 Brancaccio et al.
[16] Bampouras TM, Marrin K. Comparison of two anaerobic water
polo-specific tests with the Wingate test. J Strength & Cond Res 2009; 23: 336-40.
[17] Rodio A, Quattrini FM, Fattorini L, et al. Power output and metabolic response in multiple Wingate test performed with arms.
Medicina dello Sport 2008; 61: 21-8. [18] Gladden LB. Lactate metabolism: a new paradigm for the third
millennium. J Physiol 2004; 558: 5-30. [19] Medbø JI, Mamen A, Holt Olsen O, et al. Examination of four
different instruments for measuring blood lactate concentration. Scand J Clin Lab Invest 2000; 60: 367-80.
[20] Kenefick RW, Mahood NV, Mattern CO, et al. Hypohydration adversely affects lactate threshold in endurance athletes. J Strength
Cond Res 2002; 16: 38-43. [21] Papadopoulos C, Doyle J, Rupp J, et al. The effect of the
hypohydration on the lactate threshold in a hot and humid environment. J Sports Med Phys Fitness 2008; 48: 293-9.
[22] Heil DP. Acid-base balance and hydration status following consumption 425 of mineral-based alkaline bottled water. J Int Soc
Sports Nutr 2010; 13; 7-29. [23] Schuback K, Essen-Gustavsson B, Persson SG. Effect of sodium
bicarbonate administration on metabolic responses to maximal exercise. Equine Veterinary Journal. Supplement 2002; 539-44.
[24] Douroudos II, Fatouros IG, Gourgoulis V, et al. Dose-related effects of prolonged NaHCO3 ingestion high-intensity exercise.
Med Sci Sport Exerc 2006; 38: 1746-53. [25] Price MJ, Simons C. The effect of sodium bicarbonate ingestion on
high-intensity intermittent running and subsequent performance. J Strength Cond Res 2010; 24: 1834-42.
[26] Edge J, Bishop D, Goodman C. Effects of chronic NaHCO3 ingestion during interval training on changes to muscle buffer
capacity, metabolism, and short-term endurance performance. J Appl Physiol 2000; 10: 918-25.
[27] Lindh AM, Peyrebrune MC, Ingham SA, et al. Sodium bicarbonate
improves swimming performance. Int J Sports Med 2008; 29: 519-23.
[28] Dalbo VJ, Roberts MD, Hassell SE, et al. Effects of a mineral antioxidant complex on clinical safety, body water, lactate
response, and aerobic performance in response to exhaustive exercise. Intl J Sport Nutr Exer Metab 2010; 20: 381-92.
[29] Hollidge-Horvat MG, Parolin ML, Wong D, et al. Effect of induced metabolic alkalosis on human skeletal muscle metabolism
during exercise. Am J Physiol- Endocrinol Metab 2000; 278: E316-E329.
[30] Dubouchaud H, Butterfield GE, Wolfel EE, et al. Endurance training, expression, and physiology of LDH, MCT1, and MCT4 in
human skeletal muscle. Am J Physiol- Endocrinol Metab 2000; 278: E571-E579.
[31] Lippi G, Schena F, Salvagno GL, et al. Acute variation of biochemical markers of muscle damage following a 21-km, half
marathon run. Scand J Clin Lab Invest Suppl 2008; 68: 667-72. [32] Priest JB, Oei TO, Moorehead WR. Exercise-induced changes in
common laboratory tests. Am J Clin Pathol 1982; 77: 285-9. [33] Stokke O. Clinical chemical changes in physical activity. Scand J
Soc Med 1982; 29: 93-101. [34] Simoes HG, Grubert Campbell GS, Kokubun E, et al. Blood
glucose responses in humans mirror lactate responses for individual anaerobic threshold and for lactate minimum in track test. Eur J
Appl Physiol 1999; 80: 34-40. [35] Stainsby WN, Brechue WF, V O'Drobinak DM. Regulation of
muscle lactate production. Med Sci Sports Exerc 1991; 23: 907-11. [36] Judelson DA, Maresh CM, Yamamoto LM, et al. Effect of
hydration state on resistance exercise-induced endocrine markers of anabolism, catabolism, and metabolism. J Appl Physiol 2008; 105:
816-24. [37] Richter EA, Kiens B, Saltin B, et al. Skeletal muscle glucose
uptake during dynamic exercise in humans: role of muscle mass. Am J Phys 1998; 25: E555-61.
Received: July 12, 2011 Revised: August 21, 2011 Accepted: September 8, 2011
© Brancaccio et al.; Licensee Bentham Open.
This is an open access article licensed under the terms of the Creative Commons Attribution Non-Commercial License (http://creativecommons.org/licenses/by-nc/3.0/)
which permits unrestricted, non-commercial use, distribution and reproduction in any medium, provided the work is properly cited.


Influenza dell’Acqua Minerale Naturale Bicarbonato Calcica Lete® sulla Concentrazione di Lattato Ematico in Atleti dopo Esercizio
P. Brancaccio1*, F.M. Limongelli1,, I. Paolillo2, C. Grasso1, V. Donnarumma3 and L. Rastrelli2
1Seconda Università di Napoli, Servizio di Medicina dello Sport, Via Costantinopoli 16 80138, Napoli, Italia;
2Dipartimento di Scienze Farmaceutiche, Università di Salerno, Via Ponte Don Melillo, 84084 Fisciano, Salerno, Italy;
3Laboratorio di diagnostica e ricerca clinica Roecker, Marano di Napoli
*Corresponding authors, Phone: 0039 815665908. Fax: 0039 815665864, E-mail: [email protected]
Abstract
Scopo: Condotto su un gruppo di 88 atleti maschi volontari, questo lavoro sperimentale ha esaminato gli effetti dell’idratazione con Acqua Lete®, un’acqua minerale naturale bicarbonato-calcica, sulla risposta metabolica all’esercizio lattacido valutando le concentrazioni di lattato e glucosio ematico e l’attività della lattico deidrogenasi serica e dei suoi isoenzimi. Metodi: 88 atleti maschi volontari sono stati sottoposti a due prove da sforzo utilizzando un Wingate test modificato: la prima è stata effettuata senza idratazione (Test C), la secondo con idratazione (Test H) seguendo il seguente schema: 44 soggetti (gruppo A) idratati con un'acqua minimamente mineralizzata (Residuo Fisso = 17.5 mg/L) e 44 soggetti (gruppo B) idratati con Acqua Lete®. Prima (T0), durante (T1-T5), e dopo l'esercizio (T6-T7) sono stati analizzati i seguenti parametri: temperatura corporea, concentrazione di lattato ematico e glucosio, attività della LDH totale e dei suoi isoenzimi (LDH1- LDH2 LDH3 LDH4 LDH5). Risultati: Come atteso, il lattato ematico è aumentato significativamente dopo la sessione di esercizi in entrambi i gruppi: dopo l'idratazione e a seguito riposo (30’,T7) il Gruppo B, idratato con Acqua Lete® ha mostrato livelli di lattato inferiori rispetto al gruppo A (2.2 ±0.2 vs 2.9± 0.3 mmol /L; p<0.001). L’attività dell’isoenzima LDH5 è diminuita nel siero di atleti del Gruppo B del 0,9% rispetto al Gruppo A. Conclusioni: Tutti gli atleti idratati con Acqua Lete® hanno mostrato una riduzione significativa dei livelli di lattatemia con una variazione del pattern isoenzimatico della LDH dopo esercizio. L'assunzione di Acqua Lete® negli atleti sottoposti allo studio ha dimostrato migliorare il recupero dopo l’esercizio in maniera significativa.
Keywords: Acqua Lete® Acqua Minerale, Idratazione, Lattato Ematico, Isoenzimi della LDH.
INTRODUZIONE
L’Acido lattico (La) a pH fisiologico è dissociato per oltre il 99% in anioni La- e protoni (H+). Durante l'esercizio fisico, le concentrazioni di [La-] e di [H+] ematico possono innalzarsi, raggiungendo dei picchi significativi (1). Molti ricercatori hanno sostenuto che gli eventuali effetti dannosi del lattato sul muscolo e sulle performance atletiche sono dovuti ad H+, piuttosto che a La-.

Recentemente molti studi hanno sottolineato le diverse strategie per abbassare i livelli di lattato nel sangue dopo l'attività fisica ottenendo un miglior recupero (2, 3). Un’elevata attività citosolica della LDH è segno di un’alta produzione di La- nel citosol , questo avviene in diverse condizioni, ma soprattutto durante l'attività fisica. La variazione del profilo isoenzimatico della LDH potrebbe avere un ruolo nella risposta muscolare all’allenamento, in particolare l’isoenzima LDH5 sembra coinvolto nella produzione di lattato (4). La produzione di lattato è compensata dalla trasformazione di bicarbonato in anidride carbonica, che si perde attraverso i polmoni durante l'esercizio (5). Recentemente diversi agenti alcalinizzanti, compreso il bicarbonato di sodio (NaHCO3), oltre ad acque alcalinizzanti, bevande nutrizionali e acque minerali con contenuti superiori di 600 mg/l di bicarbonato sono stati proposti per i loro effetti potenziali sull’aumento della capacità tampone extracellulare, con miglioramento della resistenza e del recupero (6-9). Acque bicarbonate sono particolarmente indicate, inoltre, nell'ipersecrezione gastrica e nei casi di reflusso gastro-esofageo (10) e durante l'attività fisica per il recupero di liquidi e sali (11). Acqua Lete® con contenuti modesti di sodio e (4.88-5.01 mg/L) e potassio (1.93-2.11 mg/L) e con valori significativi di calcio (311.9-334.1 mg/L) e magnesio (13.93-15.14 mg/L), appartiene al gruppo delle acque bicarbonato-calciche. Obiettivo del nostro studio è stato quello di valutare l’ incidenza dell’idratazione con Acqua Lete®, sulla risposta metabolica all’esercizio lattacido e sui livelli serici di LDH in un gruppo di 88 atleti.
METODI
Partecipanti 88 atleti amatoriali di sesso maschile, hanno partecipato allo studio volontariamente. I soggetti sono stati reclutati in modo consecutivo e suddivisi in due gruppi ciascuno composto da 44 elementi. Gli atleti, nuotatori o podisti, si hanno eseguito allenamenti di 4-5 ore a settimana. Il protocollo seguito è stato approvato dal Comitato Etico (Human Ethics Committee) e ciascun partecipante ha sottoscritto il proprio consenso. Durante l’intero periodo di studio (2 settimane) ciascun atleta ha sospeso le proprie attività di allenamento e l’assunzione di eventuali integratori minerali I due gruppi di studio sono qui di seguito descritti: Gruppo A: età 34.7 anni ± 7.4 (media ± S.D.); altezza 178.5 cm ± 5.6; peso 79.6 kg ± 6.9, Indice di Massa Corporea (BMI) 24.6 ± 1.2. Gruppo B: età 33.7 anni ± 8.6 (media ± S.D.); altezza 174.6 cm ± 5.4;peso 79.6 kg ± 9.6, Indice di Massa Corporea (BMI) 25.7 ± 3.4. Protocollo dello Studio Entrambi i gruppi sono stati sottoposti a due prove sperimentali, eseguite su ergometro elettricamente frenato (Bycicle SECA Hamburg, Germany) con il seguente protocollo Wingate modificato: cinque serie di 60” ad una velocità media di 80 CPM con recupero di 60” tra le serie. Il carico imposto è stato l’85% del massimale calcolato in una seduta preliminare eseguita una settimana prima del primo test, mediante test incrementale ad esaurimento. I due test eseguiti sono di seguito descritti:
• Test C di controllo, eseguito in condizioni basali senza idratazione, per entrambi i gruppi. • Test H, eseguito dopo una settimana di idratazione controllata mediante l’assunzione di 1.5
L/die di acqua minimamente mineralizzata (residuo fisso 14.3 mg/l) somministrata al Gruppo A, e di 1.5 L/die di acqua bicarbonato calcica (Acqua Lete®) a medio contenuto minerale (residuo secco >840 mg/l), al Gruppo B. Inoltre gli atleti hanno ricevuto 750 ml di acqua, utilizzando sempre bottiglie appena aperte, un’ora prima dell’esercizio e 250 ml durante i 30 minuti successivi allo sforzo, come raccomandato dal National Athletic Trainer Association (8).

Prima dei test, tutti i soggetti sono stati sottoposti ad anamnesi e visita medica, per accertarne lo stato di buona salute. Per ciascuna sessione di lavoro (Test C e Test H), sono stati determinati i seguenti parametri:
• A riposo, prima dell’esercizio (T0): Concentrazione ematica di lattato, glucosio, LDH sierica totale e isoenzimi, peso specifico delle urine;
• Dopo ciascuna sessione di lavoro (T1, T2, T3, T4): Concentrazione ematica del glucosio;
• Immediatamente dopo l’ultima sessione di lavoro (T5): Concentrazione ematica di lattato e glucosio;
• 5 minuti dopo lo sforzo (T6): Concentrazione ematica di lattato e glucosio;
• 30 minuti dopo lo sforzo (T7): Concentrazione ematica di lattato, glucosio, LDH serica totale e isoenzimi, peso specifico delle urine;
MATERIALI
Concentrazione ematica di lattato L’esame è stato eseguito prelevando una goccia di sangue ottenuta mediante puntura del polpastrello, previa asciugatura del sudore con un batuffolo di cotone ed eliminazione della prima goccia di sangue. Il campione è stato raccolto su una strip di La-
previamente posta all’interno di un calcolatore tarato: il campione si inseriva nello strip per capillarità. La concentrazione di Lattato (mmol/L) veniva quindi misurata sul sangue intero prima e dopo lo sforzo (T0, T5, T6, T7) utilizzando un metodo amperometrico con elettrodo enzimatico (Lactate Pro, Arkray, Kyoto, Japan). Analisi di LDH ed Isoenzimi I campioni di sangue sono stati prelevati da un vena dell’avambraccio da personale esperto. I campioni post-sforzo sono stati prelevati immediatamente dopo la fine dell’esercizio, conservati in ghiaccio e inviati immediatamente al laboratorio di analisi. L’esame degli isoenzimi della lattiato deidrogenasi è stato effettuato mediante separazione elettroforetica su siero refrigerato entro le 12 ore successive al prelievo. L’enzima LDH totale è stato analizzato mediante metodo spettrometrico monotest (Pharmacia LKB-vitrospec) a 25°C, considerando normale il seguente valore: LDH= 113-189 U/L. La determinazione isoenzimatica è stata condotta mediante elettroforesi su gel di agarosio e determinata con il metodo Beckman Appraise Densitometer System ed espressa come percentuale dell’attività LDH totale. Concentrazione ematica del Glucosio Il sangue, ottenuto per puntura digitale è stato analizzato utilizzando un apparecchio One Touch Ultra 2 seguendo le indicazioni del produttore (Johnson & Johnson instrument) esprimendo il contenuto di glucosio in mmol/L. Esame delle urine L'urina è stata raccolta in contenitori di polietilene e miscelati con 5 ml/L di una soluzione al 5% di timolo in isopropanolo. Durante il periodo di raccolta, i contenitori ed il loro contenuto sono stati mantenuti a 5 ° C. Analisi chimica delle acque L’acqua minerale bicarbonato calcica, (Acqua Lete®; Società Generale delle Acque Minerali, Pratella, CE, Italia), che è stata utilizzata per l’idratazione del gruppo B è stata fornita agli atleti direttamente dal laboratorio di controllo dello stabilimento di imbottigliamento. L’acqua minerale minimamente mineralizzata è tra quelle reperibili facilmente in commercio su tutto il territorio italiano; questa non contiene quantità significative di minerali o elettroliti di alcun genere. Entrambe

le acque sono state analizzate presso i nostri laboratori per la determinazione di 15 parametri chimici caratterizzanti. La maggior parte degli elementi è stata determinata mediante cromatografia ionica (IC) utilizzando uno Dionex , mentre un’aliquota non acidificata è stata utilizzata per la determinazione di pH, conducibilità elettrica, (EC), titolazione dell’alcalinità. I 15 parametri chimici e chimico-fisici determinati in ciascun campione sono riportati in Tabella 1. I metodi analitici utilizzati sono quelli standard di riferimento adottati delle normative italiane (IRSA - CNR methods 1994). Analisi Statistica La valutazione statistica dei risultati è stata eseguita utilizzando un pacchetto SPSS per Windows, versione 17.0 (Chicago, IL, USA). Sono stati confrontati i risultati ottenuti per ciascun gruppo durante tutti gli stadi dello studio:
• in test C (senza idratazione) prima e dopo lo sforzo; • in test H (a seguito di idratazione) prima e dopo lo sforzo; • I due gruppi tra loro.
Il significatività statistica dei due gruppi (A e B) è stata determinata mediante il T Test di Student per campioni indipendenti: i parametri statistici sono stati calcolati e i valori espressi come media ± deviazione standard (S.D.).
RISULTATI
Tutti i soggetti si sono sottoposti al protocollo sperimentale descritto precedentemente. Tutti i test sono stati eseguiti ad una temperatura ambientale di 19.50±0.53°C con un’umidità del 58.38±0.52%. Concentrazione ematica del lattato Come atteso l’esercizio ha consentito l’innesco del meccanismo anaerobico lattacido, producendo i livelli di lattatemia [La-] riportati in Tabella 2. In dettaglio, nel test eseguito senza idratazione (Test C), entrambi i gruppi hanno mostrato simili livelli iniziali di [La-], hanno raggiunto livelli paragonabili all’apice dello sforzo e si sono attestati, dopo 30 minuti di recupero, sulle stesse concentrazioni ematiche di lattato, con una percentuale di decremento del 44.77 % nel Gruppo A vs 46.26 % nel Gruppo B. In molti studi è stata esaminata la produzione di lattato ematico dopo Wingate test, riportando un picco di concentrazione fra il 3° e l’ 8° minuto dopo lo sforzo (12, 13), con un recupero quasi completo entro i 10 minuti seguenti l’esercizio (14). Infatti la breve durata dell’esercizio induce un accumulo ritardato di lattato. Nel nostro studio, il protocollo modificato di Wingate test ha maggiore durata, per cui l’accumulo di lattato comincia durante l’esercizio raggiungendo un picco al termine dello stesso. Dopo idratazione (Test H) i valori di lattatemia registrati all’apice dello sforzo (T5) sono risultati aumentati del 10.4 % nel Gruppo A e del 44.2% nel Gruppo B, rispetto a quelli rilevati nel test di controllo (Test C), probabilmente anche in relazione ai diversi livelli di riposo registrati nei due gruppi (Tabella 2). Inoltre comparando le risposte ottenute nei due gruppi dopo idratazione (Figura 1) abbiamo notato che il Gruppo B, pur raggiungendo livelli di picco di lattatemia (T5) più alti rispetto al Gruppo A, ha mostrato un miglior recupero, con un decremento dei livelli di lattato dopo 30 minuti di recupero (T7) del 77.5 % vs 60.8 % del Gruppo A (Tabella 2). LDH e glucosio Ponendo a paragone i due gruppi nel test di controllo (Test C) prima e dopo l’esercizio, (Tabella 3), abbiamo rilevato un pattern isoenzimatico simile. Nel Test H (Tabella 4), l’isoenzima LDH5 risulta significativamente diminuito dopo esercizio con una percentuale maggiore nel Gruppo B (4.0±0.7% vs 6.2±0.9%, p<0.05) rispetto al Gruppo A. I livelli di glucosio ematico hanno dimostrato una riduzione progressiva nel corso dell’esercizio in entrambi i gruppi, sia durante il Test C che durante il Test H (Tabella 5). Densità Urinaria

Quando i gruppi sono stati testati senza idratazione, è stato osservato un lieve ma significativo aumento della gravità urinaria dopo l'esercizio (gruppo A: 1020 ± 4.7 g / L a riposo vs 1022 ± 4.4 g / L dopo l'esercizio fisico, p = <0.001; Gruppo B: 1018 ± 6.5 g / L a riposo vs 1019 ± 5.5 g / L dopo l'esercizio fisico, p = ns). Dopo idratazione acuta, oltre all'attesa diminuzione della densità urinaria dovuta al’idratazione, si è riscontrato un livello più basso di densità urinaria per il gruppo B idratato con Acqua Lete A (1008.1 ± 6.3 g / L vs 1014.6 ± 5.1 g / L, p = <0.001), significativo di una migliore idratazione (Figura 2).
DISCUSSIONE
Molti studi hanno applicato il Wingate Test (15, 16) ed il Wingate Test modificato (17), per valutare la risposta fisiologica all’esercizio anaerobico. Nel presente studio sono state determinate le risposte all’esercizio anaerobico prima e dopo idratazione con un acqua minerale bicarbonato calcica denominata Acqua Lete®, e confrontate con quelle ottenute con idratazione di un’acqua minimamente mineralizzata (residuo secco 14.3 mg/L). L’importanza del [La-] come fonte di energia è ormai nota (18): durante breve sforzo intenso il muscolo produce La- velocemente e lo elimina lentamente. Il lattato penetra nel plasma dai fluidi interstiziali del muscolo attivo e dal plasma ai globuli rossi del sangue (RBC), in equilibrio con il plasma, fino la raggiungimento di un valore costante del rapporto RBC/plasma. Il lattato ematico è stato analizzato utilizzando una strumentazione Lactate Pro, che misura il contenuto totale nel sangue per rottura delle RBC, tale metodo è stato dimostrato essere il più robusto per la determinazione di questo analita (19). Nel test senza idratazione (Test C, Figura 1), è stato osservato per entrambi i gruppi un aumento del livello del lattato immediatamente dopo lo sforzo (T5) che rimaneva elevato fino al quinto minuto di riposo per poi tornare a valori più bassi entro i trenta minuti successivi allo sforzo (Tabella 2). Nel secondo test eseguito con l’idratazione degli atleti (Test H, Tabella 2) i gruppi hanno dato risposte diverse. Il Gruppo B, nonostante un maggior valore di lattato alla fine dello sforzo (490% vs 462%, p<0.05), raggiungeva valori molto più bassi del Gruppo A entro i 30 minuti successivi allo sforzo (2.2±0.2 mmol/L vs 2.9±0.3 mmol/L, rispettivamente; p<0.001). Lo stato di idratazione è stato ampiamente studiato, determinando il contributo al livello di lattato. Dai risultati riportati in letteratura sembra che il livello di idratazione influenzi il processo anaerobico (20, 21). Infatti, in accordo con i dati di letteratura, per entrambi i gruppi di atleti che sono stati sottoposti al Wingate Test, un miglior stato di idratazione ha condotto ad un recupero migliore dopo l’esercizio, con una diminuzione più evidente di lattato nel Test H rispetto al Test C. Nel presente studio la composizione chimica dell’acqua utilizzata sembra aver ricoperto un ruolo importante sul livello ematico di lattato. Le acque somministrate durante il Test H sono molto diverse tra loro (Tabella 1): l’acqua minimamente mineralizzata è caratterizzata da livelli minimi di calcio e bicarbonato con un residuo di 14.3 mg/l (Tabella 1), l’Acqua Lete® caratterizzata da un contenuto modesto di sodio (4.91mg/L) e potassio (2.10 mg/L) e con un contenuto significativo di bicarbonato (981.1 mg/L), calcio (313.7 mg/L), magnesio (15.12 mg/L) e stronzio (0.15 mg/L) appartiene al gruppo delle acque minerali bicarbonato-calciche. In accordo con le direttive EEC sulle acque minerali, queste ultime sono di origine sotterranea, protette dalla contaminazione e microbiologicamente pure; presentano una composizione chimica peculiare e costante ed esercitano effetti favorevoli al mantenimento dello stato di salute. Quando i due gruppi sono stati testati senza idratazione, abbiamo rilevato in entrambi un modesto ma significativo aumento della densità urinaria dopo esercizio (Gruppo A: 1020 ± 4.7 g/L a riposo vs 1022 ± 4.4 g/L dopo esercizio; p=<0.001; Gruppo B: 1018 ± 6.5 g/L a riposo vs 1019 ± 5.5 g/L dopo esercizio; p= ns): al contrario si è verificata una attesa diminuzione della densità urinaria dopo idratazione, con valori significativamente più bassi nel Gruppo B rispetto al Gruppo A (1008.1 ±

6.3 g/L vs 1014.6 ± 5.1 g/L; p=<0.001, Figure 2). Questo dato riflette la migliore idratazione ottenuta nel Gruppo B (Figura 1). In un recente studio di DP Heil, è stato dimostrato che l’assunzione libera di acqua minerale alcalinizzata, può migliorare lo stato di idratazione di giovani e adulti (22): gli studi relativi agli effetti dell’ingestione di bicarbonati sulla risposta metabolica all’esercizio, sono numerosi ed alcune volte discordanti. In uno studio di Schuback et al. condotto nel 2002 su cavalli da corsa non è stato riportato nessun effetto sulla risposta metabolica all’esercizio di endurance, riconducibile alla somministrazione di bicarbonato (23); Al contrario, altri studi effettuati su atleti hanno dimostrato un miglioramento della performance in maniera dose dipendente (24-26) e probabilmente legata ad un aumento dell’effetto tampone (27, 28). Agenti alcalinizzanti, compreso il bicarbonato di sodio, sono stati proposti come supplementi ergogenici per i loro potenziali effetti sul miglioramento della capacità tampone extracellulare. Infatti, l’aumento di lattatemia comunemente osservato durante l’alcalosi metabolica, risulta da una complessa serie di eventi che modulano l’attività degli enzimi regolatori inducendo una alterazione fra la quota di piruvato prodotta e ossidata (29); l’alcalosi metabolica porta ad un incremento della produzione di lattato e il suo accumulo è dovuto alla assenza di una downregulation della glicogenolisi e alla glicolisi che si verifica quando il pH diminuisce. Nel nostro studio la specificità dell’Acqua Lete®, con combinazione di alti contenuti di calcio ed agenti tamponanti, può aver inciso sui livelli di lattatemia, determinando [La-] significativamente più basse dopo lo sforzo. Il funzionamento del sistema intracellulare di trasporto del lattato sembra consentire che il lattato prodotto dalla glicolisi e dalla glicogenolisi nel citosol, sia rimosso per ossidazione nei mitocondri delle stesse cellule. La presenza di un sistema shuttles intracellulare per il lattato da luogo all’ipotesi che la glicolisi e l’ossidazione siano processi strettamente correlati, in cui il lattato, prodotto della prima via metabolica, è il substrato della seconda (30). In seguito alla sua continua produzione nel citosol, ad opera dell’isoenzima LDH5 (M4), il lattato diffonde nella matrice mitocondriale dove l’isoenzima LDH1 (H4) provvede alla sua riconversione in piruvato con la concomitante interconversione dell’ NADH e NAD. La valutazione dell’LDH totale e dei suoi isoenzimi, consente quindi di ottenere maggiori informazioni relative al metabolismo muscolare (4). Infatti l’esercizio strenuo induce un significativo aumento di LDH (31) e l’entità dell’incremento dipende dall’intensità e dalla durata dello sforzo (32, 33). Nel nostro studio non è stato riscontrato un incremento dei livelli serici di enzima totale in nessun test, probabilmente per la tipologia e l’intensità dello sforzo proposto: il tempo di esecuzione del prelievo (30 minuti dopo esercizio) e il tipo di esercizio (sottomassimale) non ci hanno consentito di rilevare significativi incrementi del titolo enzimatico (Tabelle 3 e 4). Inoltre comparando il test effettuato con idratazione e quello di controllo è stata riscontrata una variazione del pattern isoenzimatico dopo esercizio, con valori di LDH5 significativamente più bassi in particolare nel Gruppo B (4.0±0.7% vs 4.6±0.8%, p<0.05), con aumento (sebbene non significativo) dei livelli di LDH1 ed LDH2 (Tabella 4) Il tasso di glucosio ematico in corso di esercizio è stato ampiamente studiato poiché riflette la risposta lattacida allo sforzo (34). Infatti a riposo e durante esercizio di moderata intensità l’adrenalina stimola la glicogenolisi e la produzione di lattato (35). Nello studio riportato, nel Test C l’aumento di lattato ha coinciso con una diminuzione del glucosio ematico: infatti dopo l’esercizio (T5) entrambi i gruppi hanno fatto registrare livelli di glicemia significativamente più bassi rispetto ai basali (T0) (Gruppo A: 4.1 ± 0.3 vs 4.6 ± 0.2 mmol/L, p<0.05; Gruppo B: 4.6±0.5 vs 5.0±0.6 mmol/L, p<0.05). E’ riportato che lo stato di idratazione può modificare la risposta ormonale e metabolica all’esercizio, influenzando il metabolismo dei carboidrati (36). Infatti durante l’esercizio di moderata intensità il lattato compete con il glucosio come substrato metabolico e può rappresentare un meccanismo di protezione nei confronti dell’ipoglicemia durante esercizio prolungato. L’incremento nella percentuale di ossidazione del lattato coincide con la diminuzione della percentuale di ossidazione del glucosio ematico, provocando una diminuzione della produzione di glucosio necessaria per mantenere l’omeostasi glicemica (37). Questo risultato, se confermato da ulteriori studi, testimonierebbe la migliore ossidazione del lattato ottenuta nel

Gruppo B e dimostrata dalla variazione del quadro isoenzimatico della LDH ed il mantenimento di una migliore omeostasi glicemica dopo idratazione con acqua bicarbonato-calcica. CONCLUSIONI
L'assunzione orale di acqua minerale naturale bicarbonato calcica, Acqua Lete®, caratterizzata da un peculiare ed esclusivo chimismo, prima e dopo il Wingate Test è risultata associata ad una migliore ossidazione del lattato, ad una variazione degli isoenzimi della lattico deidrogenasi LDH, ed ad un miglior mantenimento dell' omeostasi fisiologica in atleti. Tutti gli atleti idratati con Acqua Lete® hanno mostrato una riduzione significativa dei livelli di lattatemia con una variazione del pattern isoenzimatico della LDH dopo esercizio. In particolare, l'assunzione Acqua Lete® ha dimostrato migliorare il recupero dopo esercizio indicando che questa acqua minerale può rappresentare una preziosa risorsa nutrizionale in grado di influenzare il recupero e l'idratazione degli atleti.
Bibliografia [1] Fitts, R.H. Effects of regular exercise training on skeletal muscle contractile function. American Journal of Physical Medicine & Rehabilitation 2003; 82: 320-331 [2] Neric FB, Beam WC, Brown LE, and Wiersma LDJ (2009) Comparison of swim recovery and muscle stimulation on lactate removal after sprint swimming.Strength Conitional Research, 23:2560-2567 [3] Greenwood JD, Moses GE, Bernardino FM, Gaesser GA, and Weltman A. (2008). Intensity of exercise recovery, blood lactate disappearance, and subsequent swimming performance. Journal of Sports Sciences, 26: 29-34. [4] Brancaccio, P., Maffulli, N., Buonauro R., and Limongelli, F.M. (2008). Serum enzyme monitoring in sport medicine. Clinic Journal of Sport Medicine, 27, 1–18. [5] Yunoki, T., Ogant, H., and Yanoi, T. (2003). Relationship between blood lactate concentration and excessive CO2 expiration during and after ramp exercise. Adv. Exerc. Sports Physiol., Vo1.9, No.3, .97-103. [6] Montain, S.J. (2008). Hydration recommendations for sport 2008. Current Sports Medicine Report, 7, 187-192. [7] Von Duvillard, S.P., Arciero, P.J., Tietjen-Smith, T., and Alford, K., (2008). Sports drinks, exercise training, and competition. Current Sports Medicine Report, 7, 202-208. [8] Casa, D.J., Armstrong, L.E., Hillman, S.K., Montain S.J., Reiff, R.V., Rich, B.S.E., Roberts, W.O. and Stone, J.A. (2000). National Athletic Trainers' Association Position Statement: Fluid Replacement for Athletes. Journal of Athletic Training, 35, 212-224. [9] Matson, L. G., and Tran, Z.V. Effects of Sodium Bicarbonate Ingestion on 470 Anaerobic Performance: A Meta-Analytic Review (1993) International Journal of Sport Nutrition and Exercise Metabolism, 20, 2-28. [10] Petraccia, L., Liberati, G., Masciullo, S.G., Grassi, M., and Fraioli, A. (2006). Water, mineral waters and health. Clinical nutrition, 25, 377-385. [11] Shirreffs, S.M., Aragón-Vargas, L.F., Keil, M., Love, T.D., and Phillips. S. (2007). Rehydration after exercise in the heat: a comparison of 4 commonly used drinks. International Journal of Sport Nutrition and Exercise Metabolism, 17, 244-258. [12] McLellan, T.M., Kavanagh, M.F., and Jacobs, I. (1990). The effect of hypoxia on performance during 30 s or 45 s of supramaximal exercise. European Journal of Applied Physiology and Occupational Physiology, 60, 155-161. [13] Medbø, J.I., and Tabata, I. (1993). Anaerobic energy release in working muscle during 30 s to 3 min of exhausting bicycling. . Journal of Applied Physiology, 75, 1654-1660. [14] Ozturk, M., Ozer, K., and Gokce, E. (1998). Evaluation of blood lactate in young men after wingate anaerobic power test. Eastern Journal of Medicine, 3, 13-16.

[15] Weinstein, Y., Bediz, C., Dotan, R., and Falk B. (1998). Reliability of peak-lactate, heart rate, and plasma volume following the Wingate test. Medicine & Science in Sport & Exercise, 30, 1456-
[16] Bampouras, T.M., and Marrin, K. (2009). Comparison of two anaerobic water polo-specific tests with the Wingate test. The Journal of Strength & Conditioning Research, 23, 336-340.
[17] Rodio, A., Quattrini, F.M., Fattorini, L., Egidi, F., Faiola, F., and Pittiglio, G. (2008). Power output and metabolic response in multiple Wingate test performed with arms. Medicina dello Sport, 61, 21-28.
[18] Gladden, L.B. (2004). Lactate metabolism: a new paradigm for the third millennium. The Journal of Physiology, 558. 1, 5-30. [19] Medbø, J.I., Mamen, A., Holt Olsen, O., and Evertsen, F. (2000). Examination of four different instruments for measuring blood lactate concentration. Scandinavian journal of clinical and laboratory investigation, 60, 367-380. [20] Kenefick, R.W., Mahood, N.V., Mattern, C.O., Kertzer, R., and Quinn, TJ. (2002). Hypohydration adversely affects lactate threshold in endurance athletes. The Journal of Strength & Conditioning Research,16, 38-43. [21] Papadopoulos, C., Doyle, J., Rupp, J., Brandon, L., Benardot, D., and Thompson, W. (2008). The effect of the hypohydration on the lactate threshold in a hot and humid environment. Journal of Sports Medicine and Physical Fitness, 48, 293-299. [22] Heil, D.P. (2010). Acid-base balance and hydration status following consumption 425 of mineral-based alkaline bottled water. Journal of The International Society of Sport Nutrition, 13, 7-29. [23] Schuback, K., Essen-Gustavsson, B., and Persson, S.G. (2002). Effect of sodium bicarbonate administration on metabolic responses to maximal exercise. Equine Veterinary Journal. Supplement, 539-44. [24] Douroudos, I.I., Fatouros, I.G., Gourgoulis, V., Jamurtas, A.Z., Tsitsios, T., Hatzinikolaou, A., Margonis, K., Mavromatidis, K., and Taxildaris, K. (2006). Dose-related effects of prolonged NaHCO3 ingestion high-intensity exercise. Medicine & Science in Sport & Exercise, 38, 1746-53. [25] Price M.J., and Simons, C. (2010). The effect of sodium bicarbonate ingestion on high-intensity intermittent running and subsequent performance. The Journal of Strength & Conditioning Research, 24, 1834-1842. [26] Edge, J., Bishop, D. and Goodman C (2000). Effects of chronic NaHCO3 ingestion during interval training on changes to muscle buffer capacity, metabolism, and short-term endurance performance. Journal of Applied Physiology, 101, 918-925. [27] Lindh, A.M., Peyrebrune, M.C., Ingham, S.A., Bailey, D.M., and Folland, J.P. (2008). Sodium bicarbonate improves swimming performance. International Journal Sports Medicine, 29, 519-523. [28] Dalbo, V.J., Roberts, M.D., Hassell, S.E., Moon, J.R., and Kerksick, C.M. (2010) Effects of a mineral antioxidant complex on clinical safety, body water, lactate response, and aerobic performance in response to exhaustive exercise. International Journal of Sport Nutrition and Exercise Metabolism, 20, 381-392. [29] Hollidge-Horvat, M.G., Parolin, M.L., Wong, D., Jones N.L, and Heigenhauser, G.J.F. (2000) Effect of induced metabolic alkalosis on human skeletal muscle metabolism during exercise. American Journal of Physiology- Endocrinology And Metabolism, 278, E316-E329. [30] Dubouchaud, H., Butterfield, G.E., Wolfel, E.E., Bergman, B.C., and Brooks G.A. (2000). Endurance training, expression, and physiology of LDH, MCT1, and MCT4 in human skeletal muscle. American Journal of Physiology- Endocrinology And Metabolism, 278, E571-E579. [31] Lippi, G., Schena, F., Salvagno, G.L., Montagnana, M., Gelati, M., Tarperi, C., Banfi, G., and Guidi, G.C., (2008) Acute variation of biochemical markers of muscle damage following a 21-km, half marathon run. Scandinavian Journal of Clinical and Laboratory Investigation, 68, 667-672. [32] Priest, J.B., Oei, T.O., and Moorehead, W.R. (1982). Exercise-induced changes in common laboratory tests. American Journal of Clinical Pathology, 77, 285-9.

[33] Stokke, O. (1982). Clinical chemical changes in physical activity. Scandinavian Journal of Social Medicine, 29, 93-101. [34] Simoes, H.G., Grubert Campbell, G.S., Kokubun, E., Denadai, B.S., and Baldissera, V. (1999). Blood glucose responses in humans mirror lactate responses for individual anaerobic threshold and for lactate minimum in track test. European Journal of Applied Physiology, 80, 34-40. [35] Stainsby, W.N., Brechue, W.F., and V O'Drobinak, D.M. (1991). Regulation of muscle lactate production. Medicine & Science in Sport & Exercise, 23, 907-911. [36] Judelson, D.A., Maresh, C.M., Yamamoto, L.M., Farrell, M.J., Armstrong, L.E., Kraemer, W.J., Volek, J.S., Spiering, B.A., Casa, D.J., and Anderson, J.M. (2008). Effect of hydration state on resistance exercise-induced endocrine markers of anabolism, catabolism, and metabolism. Journal of Applied Physiology, 105, 816-824. [37] Richter, E.A., Kiens, B., Saltin, B., Christensen, N.J. and Savard, G. (1998). Skeletal muscle glucose uptake during dynamic exercise in humans: role of muscle mass. American Journal of Physiology, 254, E555-561.

Tabella 1. Caratteristiche chimiche delle acque minerali utilizzate nello studio* Parametri Unità di
Misura Acqua Lete Acqua
Minimamente Mineralizzata
Conducibilità mS/cm 1321.40 ± 46.10 17.57 ± 0.91 pH pH 6.14 ± 1.91 5.00 ± 0.21
Residuo Fisso mg/l 878.41 ± 25.21 14.31 ± 0.68 CO2 mg/L 1890.12 ± 72.51 15.22 ± 0.77 HCO3- mg/l 981.11 ± 33.82 3.51 ± 0.15 Cl- mg/l 8.24 ± 2.22 0.41 ± 0.02 SO4
2- mg/l 6.60 ± 0.91 1.40 ± 0.08 NO3
- mg/l 4.14 ± 0.20 1.91 ± 0.08 Na+ mg/l 4.91 ± 0.33 1.21 ± 0.05 K+ mg/l 2.10 ± 0.08 0.32 ± 0.01 Ca++ mg/l 313.70 ± 9.81 1.11 ± 0.05 Mg++ mg/l 15.12 ± 3.92 0.42 ± 0.03 Fe mg/l 0.02 ± 0.01 < 0.01 Sr++ mg/l 0.15 ± 0.01 < 0.1 Li+ mg/l < 0.01 < 0.01 *I risultati riportati sono la media ± SD di analisi eseguite in triplicato

Tabella 2. Livelli di lattato ematico* misurati durante e dopo esercizio** _________________________________________________________________________ Test C Riposo (T0) T5 Δ T6 T7 Δ* _________________________________________________________________________ Gruppo A 1.7±0.4 6.7±0.6a 394% 7.1±0.9 3.7±0.7b 44.77% e Gruppo B 1.7±0.3 6.8±0.8a 400% 6.3±0.8 3.7±0.6b 46.26% d _________________________________________________________________________ Test H Riposo (T0) T5 Δ T6 T7 Δ* _________________________________________________________________________ Gruppo A 1.6±0.2 7.4±0.8a, 462% 6.1±0.7 2.9±0.3b, 60.80% c e Gruppo B 2.0±0.5 9.8±0.6a, 490% 7.1±0.4 2.2±0.2b, 77.55% c d __________________________________________________________________________ * i valori sono espresso in mmol/L ** media ±SE, n=88 Δ incremento misurato in (%) rispetto T0 Δ* decremento misurato in (%) rispetto T5 aSignificativamente differente rispetto ai valori di riposo, P < 0.05 bSignificativamente differente rispetto ai valori di riposo, P < 0.001 c,d P < 0.001 e P < 0.05 Test C: test eseguito senza idratazione Test H: test eseguito con idratazione Group A: soggetti idratati con acqua di controllo Group B: soggetti idratati con acqua Lete T5: immediatamente dopo l’esercizio T6: 5 minuti dopo l’esercizio T7: 30 minuti dopo l’esercizio

Figure 1. [La-] rilevate durante esercizio e nel recupero in soggetti non idratati (Test C) e idratati (Test H). Gruppo A (n=44): idratati con acqua minimamente mineralizzata, Gruppo B (n=44) idratati con Acqua Lete.
0
2
4
6
8
10
T0 T5 T6 T7
Bloo
d [La‐] m
mol/L
Gruppo A test C
Gruppo A test H
Gruppo B test C
Gruppo B test H

Tabella 3. Livelli enzimatici (± s.d.) rilevati a riposo e dopo esercizio (n=88) in Test C ____________________________________________________ Enzyme Rest (T0) T7 ____________________________________________________ Gruppo A LDH totale* 287.6±59.6 279.7±64.1 LDH1** 25.4±1.6 24.6±1.78 LDH2** 37.3±0.8 36.4±1.31 LDH3** 24.0±0.7 25.9±1.01 LDH4** 7.8±1.3 8.0±1.26 LDH5** 5.5±1.1b 5.1±1.31b ____________________________________________________ Gruppo B LDH totale* 347.5±42.0 334.7±53.1 LDH1** 26.3±1.3 25.3±1.8 LDH2** 36.2±0.6 35.8±1.2 LDH3** 24.3±1.8 25.9±0.5 LDH4** 7.9±1.3 8.4±1.4 LDH5** 5.3±1.3a 4.6±0.8a ____________________________________________________ * I valori sono espressi in U/L **% LDH totale aSignificativamente differente rispetto ai livelli di riposo, P < 0.001 bSignificativamente differente rispetto ai livelli di riposo, P < 0.05 ________________________________________________________________________________ Tabella 4. Livelli enzimatici (± s.d.) rilevati a riposo e dopo esercizio (n=88) in Test H ____________________________________________________ Enzyme Rest (T0) T7 ____________________________________________________ Gruppo A LDH* totale 304.4±52.4 301.2±51.9 LDH1** 25.2±1.0 23.1±1.9 LDH2** 36.6±1.9 38.3±1.3 LDH3** 23.5±1.5 24.8±0.4 LDH4** 8.2±1.3 7.6±1.3 LDH5** 6.5±1.3b 6.2±0.9bc ____________________________________________________ Group B LDH* totale 340.5±70.4 334.7±53.1 LDH1** 26.8±1.2 27.8±1.7 LDH2** 35.6±1.9 36.3±0.8 LDH3** 24.7±1.9 25.0±1.4 LDH4** 7.5±1.2 6.9±0.9 LDH5** 5.4±1.2a 4.0±0.7ac ____________________________________________________ * I valori sono espressi in U/L **% LDH totale aSignificativamente differente rispetto ai livelli di riposo, P < 0.001 bSignificativamente differente rispetto ai livelli di riposo, P < 0.05 c P < 0.05

Tabella 5. Livelli di glicemia rilevati* prima, durante e dopo esercizio** ________________________________________________________________________________ Test C T0 T1 T2 T3 T4 T5 T6 ________________________________________________________________________________ Gruppo A 4.6±0.2 4.4±0.3 4.6±0.3 4.5±0.3 4.6±0.3 4.1±0.3a 4.3±0.1 Gruppo B 5.0±0.6 4.8±0.6 4.9±0.5 5.0±0.5 4.7±0.5 4.6±0.5a 4.5±0.4 _______________________________________________________________________________ Test H T0 T1 T2 T3 T4 T5 T6 _______________________________________________________________________________ Gruppo A 4.8±0.5 4.9±0.7 4.4±0.3 4.6±0.3 4.3±0.3 4.3±0.4a 4.3±0.4 Gruppo B 5.1±0.6 4.8±0.4 4.6±0.3 4.7±0.5 4.9±0.6 4.6±0.5a 4.6±0.5 ________________________________________________________________________________ *I valori sono espresso in in mmol/L **Medie±SE. aSignificativamente differente rispetto ai livelli di riposo, P < 0.05. ________________________________________________________________________________ Figure 1. densità urinaria rilevata nel Test H prima e dopo esercizio
T=: prima dell’esercizio T7: 30 minuti dopo esercizio
1021 1021
1014
1008
1000
1005
1010
1015
1020
1025
1030
T0 T7
g/L
group Agroup B

Effetti della somministrazione di acqua minerale bicarbonato calcica “lete” nella dispepsia funzionale 1
EFFETTI DELLA SOMMINISTRAZIONE DI
ACQUA MINERALE BICARBONATO CALCICA “LETE”
NELLA DISPEPSIA FUNZIONALE
Effects of the “Lete” bicarbonate - calcic water administration in functional dyspepsia
M. Tarocchi, E. Dabizzi, Mgo Ninotta, B. Casanova, C. Violanti, C. Surrenti*
Dipartimento di Fisiopatologia Clinica,
Unità di Gastroenterologia,
UNIVERSITÀ DEGLI STUDI DI FIRENZE
*Prof. Calogero Surrenti, MD.
Professore Ordinario di Gastroenterologia
Università degli Studi di Firenze
Viale Morgagni 85, 50134 Firenze
E-mail: [email protected]

Effetti della somministrazione di acqua minerale bicarbonato calcica “lete” nella dispepsia funzionale 2
RIASSUNTO
Introduzione: La dispepsia è una sindrome clinica caratterizzata da sintomi, cronici o ricorrenti, a carico del
tratto intestinale superiore. I sintomi, comprendenti dolenzia addominale, sazietà precoce, senso di
ripienezza post-prandiale, nausea, vomito ed eruttazione, possono essere associati o meno all'assunzione di
alimenti. In oltre il 60% di questi pazienti gli accertamenti eseguiti non mostrano alterazioni organiche
evidenti ed in questo caso la dispepsia si definisce funzionale. Spesso il trattamento farmacologico
convenzionale nei pazienti con dispepsia funzionale è del tutto inefficace o solo parzialmente efficace.
Diverse osservazioni cliniche suggeriscono che le acque minerali, grazie alle loro particolari proprietà
chimico-fisiche, sono in grado di modulare l'attività motoria gastrointestinale, la più frequente alterazione in
corso di dispepsia funzionale.
Scopo dello studio è valutare l'effetto di un trattamento idropinico a base di acqua minerale bicarbonato
calcica nella sintomatologia dispeptica.
Pazienti e metodi: Sono stati reclutati 50 pazienti affetti da dispepsia funzionale, suddivisi in due gruppi: un
gruppo di 30 pazienti sottoposti ad un'assunzione giornaliera di 1000 mL di Acqua minerale LeteÒ per 10
giorni ed un gruppo di 20 soggetti, utilizzati come controllo, sottoposto ad assunzione di acqua comune di
rubinetto, sempre per il medesimo
periodo. A tutti i pazienti è stato somministrato, prima e dopo il trattamento, un questionario graduato per la
valutazione della sintomatologia.
Risultati: Tutti i pazienti trattati con Acqua LeteÒ hanno mostrato, rispetto ai soggetti che avevano assunto
acqua comune di rubinetto, un miglioramento significativo della sintomatologia sia in termini di intensità che
di frequenza, per tutti i sintomi analizzati, ad eccezione dell'intensità del dolore addominale, in cui si
evidenzia un miglioramento non significativo rispetto al gruppo trattato con acqua di rubinetto.
Conclusione: La supplementazione con Acqua Minerale LeteÒ riduce la sintomatologia dispeptica,
attraverso una modulazione dell'attività motoria-secretoria del tratto gastrointestinale.

Effetti della somministrazione di acqua minerale bicarbonato calcica “lete” nella dispepsia funzionale 3
ABSTRACT
Background: Dyspepsia is a clinic syndrome characterized by recurrent or chronic symptoms of the upper
intestinal tract. Symptoms, including abdominal pain or discomfort, bloating, nausea or vomit and belching,
could be associated either with food consumption or not.
Dyspepsia, in the absence of a clinically identifiable structural lesion causing symptoms, is usually referred to
as functional dyspepsia.
Frequently, drug therapy achieves only a partial relief of symptoms in the majority of cases. Clinical
observations suggest that mineral waters, depending on their chemical and physical properties, may
modulate gastrointestinal motility, which is the more frequent alteration in the development of symptoms.
This study aims to assess the effect of carbonated water intake in patients with dyspepsia symptoms.
Methods: 50 patients were recruited and divided into two groups: the first group was formed by 30 patients,
who daily consumed 1000 mL of LeteÒ mineral water for 10 days, and the second one, formed by 20
patients, as a control one, who consumed tap water of the Florence aqueduct.
We deliver to everyone, before and after the treatment, a questionnaire for the symptoms valuation.
Results: All the patients treated with Lete mineral water showed a significant improvement of symptoms
respect to those patients who drank tap water, both in frequency and in intensity, with the exception of
abdominal pain frequency, that isn't a statistic significant improvement.
Conclusion: Lete mineral water supplementation to the diet improves dyspepsia symptoms, modulating
gastrointestinal motility and secretion activity.

Effetti della somministrazione di acqua minerale bicarbonato calcica “lete” nella dispepsia funzionale 4
INTRODUZIONE
La dispepsia è una condizione patologica eterogenea, caratterizzata dalla presenza di dolore o fastidio ad
andamento cronico o ricorrente, localizzato a livello dell'addome superiore della durata di almeno 3 mesi (1).
Essa rappresenta una delle principali cause di visite specialistiche gastroenterologiche (circa il 30%) (2) e di
indagini ematochimiche e strumentali. In oltre il 60% di questi pazienti gli accertamenti eseguiti non
mostrano alterazioni organiche evidenti ed in questo caso la dispepsia si definisce funzionale. I sintomi più
frequenti sono sazietà precoce, ripienezza post-prandiale, nausea, conati di vomito o vomito ricorrente,
associati o meno ai pasti. I meccanismi fisiopatologici alla base della dispepsia funzionale non sono chiari.
Studi recenti hanno evidenziato anomalie della motilità gastrointestinale quali un ritardo dello svuotamento
gastrico, documentato con Breath test all'acido ottanico (3), un'ipomotilità antrale postprandiale e
un'alterazione del tempo di transito oro-cecale. In altri casi è stata dimostrata una modificazione della
percezione viscerale sotto forma di una aumentata sensibilità all'acidità gastrica, associata o meno ad
infiammazione mucosale (4-7).
Sebbene l'Helicobacter pylori sia spesso chiamato in causa come cofattore della dispepsia, il suo ruolo nella
patogenesi di questa sindrome e l'efficacia delle eventuali terapie eradicanti rimane incerta (8).
La terapia attuale della dispepsia funzionale è largamente empirica e si basa sull'uso di farmaci quali
procinetici, antiacidi, antisecretivi (inibitori di pompa protonica, H2-antagonisti) e antispastici. Purtroppo il
trattamento farmacologico nei pazienti con dispepsia funzionale è spesso inefficace o di beneficio parziale e
limitato nel tempo (9).
Alcune osservazioni cliniche suggeriscono che modificazioni dello stile di vita e delle abitudini alimentari
possono giocare un ruolo determinante nella terapia della dispepsia funzionale (10-12).
È infatti ben documentato che alcune acque minerali, grazie alle loro particolari proprietà chimico-fisiche,
hanno la capacità di stimolare lo svuotamento gastrico e l'attività motoria interdigestiva nei pazienti con
dispepsia funzionale e rallentato svuotamento gastrico (3).
È stato ipotizzato inoltre che l'influenza positiva su tali disturbi possa dipendere dall'alta concentrazione di
ioni calcio e bicarbonato: il calcio potrebbe avere un effetto diretto sulla contrattilità della muscolatura liscia,
mentre i bicarbonati agirebbero diminuendo il tempo di svuotamento gastrico e regolando le secrezioni acide
(12, 13).

Effetti della somministrazione di acqua minerale bicarbonato calcica “lete” nella dispepsia funzionale 5
L'obiettivo di questo studio è quello di valutare l'effetto sulla sintomatologia dispeptica di un trattamento
idropinico a base di Acqua minerale Lete, che si differenzia dalle acque in commercio per la composizione in
bicarbonato, calcio e CO2, in un gruppo di pazienti con dispepsia funzionale.
PAZIENTI E METODI
Lo studio è stato condotto su 50 pazienti (28 maschi e 22 femmine, età media 46,4 anni, range 26-63 anni)
con dispepsia funzionale arruolati prospetticamente tra Giugno e Luglio 2005. La diagnosi di dispepsia
funzionale è stata formulata in accordo con i criteri Roma II, (1) sulla base della sintomatologia e della
assenza di alterazioni organiche documentabili all'esame obiettivo, all'esofagogastroduodenoscopia, e
all'esame ecografico dell'addome.
Criteri di esclusione per l'arruolamento sono stati:
• la presenza di patologie organiche addominali
• pregressi interventi chirurgici addominali
• malattie dismetaboliche (diabete mellito, distiroidismo) e psichiatriche
• infezione da Helicobacter pylori
• assunzione di farmaci nei quattro mesi precedenti lo studio
• assunzione di quantità maggiori di 40 grammi/die di alcol per gli uomini e di 20 grammi/die per le
donne
Tutti i pazienti sono stati sottoposti ad un trattamento idropinico con 1000 mL al giorno di Acqua minerale
Lete, divisa in 4 somministrazioni, per 10 giorni a stomaco vuoto.
L'assunzione della dose singola 250 mL avveniva almeno 2 ore dopo l'ultimo pasto e prima dell'inizio del
pasto successivo. Per tutto il periodo del trattamento con Acqua LeteÒ, è stato chiesto ai soggetti di
mantenere le normali abitudini alimentari e di stile di vita.
All'inizio e alla fine del trattamento, ai soggetti reclutati nello studio è stato consegnato un questionario (14)
(appendice A) che analizza, secondo punteggi prestabiliti, l'intensità e la frequenza dei sintomi dispeptici, ed
in particolare il dolore epigastrico, la sazietà precoce, il gonfiore addominale, l'eruttazioni, la nausea ed il
vomito.

Effetti della somministrazione di acqua minerale bicarbonato calcica “lete” nella dispepsia funzionale 6
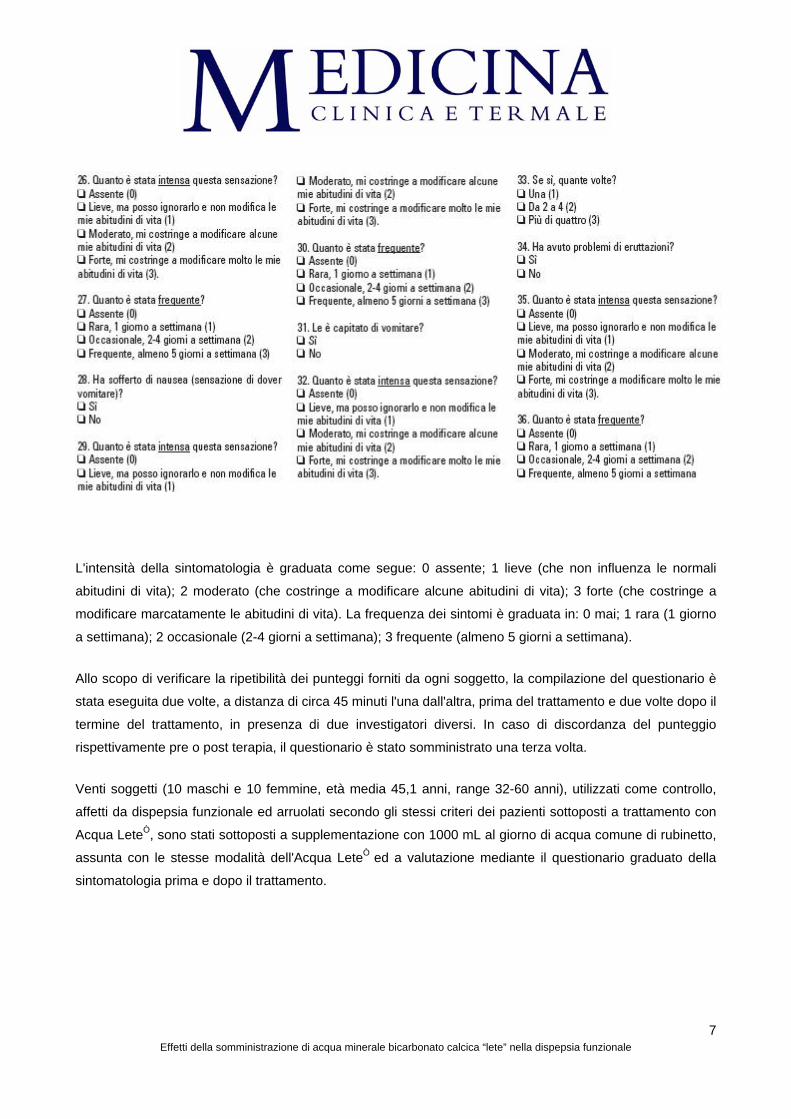
Effetti della somministrazione di acqua minerale bicarbonato calcica “lete” nella dispepsia funzionale 7
L'intensità della sintomatologia è graduata come segue: 0 assente; 1 lieve (che non influenza le normali
abitudini di vita); 2 moderato (che costringe a modificare alcune abitudini di vita); 3 forte (che costringe a
modificare marcatamente le abitudini di vita). La frequenza dei sintomi è graduata in: 0 mai; 1 rara (1 giorno
a settimana); 2 occasionale (2-4 giorni a settimana); 3 frequente (almeno 5 giorni a settimana).
Allo scopo di verificare la ripetibilità dei punteggi forniti da ogni soggetto, la compilazione del questionario è
stata eseguita due volte, a distanza di circa 45 minuti l'una dall'altra, prima del trattamento e due volte dopo il
termine del trattamento, in presenza di due investigatori diversi. In caso di discordanza del punteggio
rispettivamente pre o post terapia, il questionario è stato somministrato una terza volta.
Venti soggetti (10 maschi e 10 femmine, età media 45,1 anni, range 32-60 anni), utilizzati come controllo,
affetti da dispepsia funzionale ed arruolati secondo gli stessi criteri dei pazienti sottoposti a trattamento con
Acqua LeteÒ, sono stati sottoposti a supplementazione con 1000 mL al giorno di acqua comune di rubinetto,
assunta con le stesse modalità dell'Acqua LeteÒ ed a valutazione mediante il questionario graduato della
sintomatologia prima e dopo il trattamento.

Effetti della somministrazione di acqua minerale bicarbonato calcica “lete” nella dispepsia funzionale 8
ANALISI STATISTICA
Le differenze tra le percentuali dei pazienti in cui si è verificato un miglioramento dopo trattamento con
Acqua Minerale LeteÒ e con acqua di rubinetto sono state analizzate mediante il Test del chi-quadro,
considerando significativo un valore di P <0,05.
RISULTATI
Tutti i soggetti hanno completato lo studio. In sette soggetti è emersa una discordanza nel punteggio fornito
durante la compiIazione dei questionari, ed a ciascuno di essi è stato somministrato un terzo questionario.
I sintomi dispeptici riferiti dai soggetti reclutati (pazienti e controlli) erano rappresentati da dolore epigastrico,
presente in 20/50 (40%) pazienti, sazietà precoce, presente in 29/50 (58%) pazienti, gonfiore addominale,
presente in 35/50 (70%) dei pazienti, nausea, in 19/50 (38%) dei pazienti ed eruttazioni, in 25/50, (50%) dei
pazienti. Nessun paziente riferiva episodi di vomito.
Assumendo la riduzione di almeno un punto per
ciascun sintomo come indice di miglioramento, i
pazienti trattati con Acqua Minerale Lete hanno
presentato un significativo miglioramento sia della
intensità (Figura 1) che della frequenza (Figura 2) dei
sintomi, se confrontato con i risultati ottenuti dopo
trattamento con acqua del rubinetto.
Si evidenzia una riduzione anche dell'intensità del
dolore epigastrico, senza raggiungere significatività
statistica (p < 0,20).

Effetti della somministrazione di acqua minerale bicarbonato calcica “lete” nella dispepsia funzionale 9
DISCUSSIONE
I risultati di questo studio hanno evidenziato come una somministrazione quotidiana per dieci giorni di Acqua
minerale LeteÒ induca un miglioramento della dispepsia funzionale.
I dati mostrano una riduzione statisticamente significativa sia di intensità che di frequenza del dolore
epigastrico, del senso di sazietà precoce, del gonfiore addominale, della nausea e dell'eruttazione. Questi
risultati indicano che l'Acqua minerale LeteÒ, ricca di bicarbonati e di calcio, può determinare un
modulazione sia motoria che secretoria del tratto gastrointestinale tale da migliorare la sintomatologia clinica
nei pazienti con dispepsia funzionale.
I meccanismi di azione sono ancora poco noti, ma si ritiene che l'Acqua minerale LeteÒ possa esplicare la
sua azione a vari livelli. Innanzitutto è stato dimostrato che il carico di liquidi, anche in virtù del suo contenuto
elettrolitico, ha la capacità, se assunto in discrete quantità, di accelerare il transito oro-cecale (15).
Inoltre la ricchezza in queste acque minerali, di ioni calcio sembra avere sia un effetto diretto sulla
muscolatura liscia (16) sia sul sistema neuroendocrino intestinale, tramite l'attivazione di chemorecettori tali
da favorire l'aumento della contrazioni della muscolatura gastrointestinale (12).
Infine, la presenza di bicarbonato incrementa l'attività motoria ciclica interdigestiva del tratto
gastrointestinale, diminuisce i tempi di svuotamento gastrico e promuove la secrezione acido-peptica dello
stomaco (12).
È stato anche attribuito alle bevande ricche in bicarbonato un effetto di stimolazione chimica dei nocicettori
della cavità orale che interagendo con le vie della sensibilità viscerale avrebbero un effetto positivo sulla
sintomatologia dispeptica (17,18).
In conclusione, i dati di questo studio indicano che una assunzione regolare di acqua bicarbonato calcica,
modulando l'attività motoria e secretoria del tratto gastrointestinale induce un significativo miglioramento dei
sintomi associati a dispepsia funzionale, senza richiedere importanti modificazioni delle abitudini alimentari e
dello stile di vita: l'Acqua LeteÒ può quindi costituire un valido strumento terapeutico da utilizzare nella
dispepsia funzionale in associazione ai trattamenti farmacologici attualmente utilizzati in tale patologia.

Effetti della somministrazione di acqua minerale bicarbonato calcica “lete” nella dispepsia funzionale 10
BIBLIOGRAFIA
1. Talley N.J. et al. Functional gastroduodenal disorders. Gut. 1999 Sep;45 Suppl 2:II37-42.
2. Talley N.J. et al. Onset and disapearance of gastrointestinal symptoms and functional gastrointestinal disorders. Am J Epidemiol 1992;136:165-77;
3. Anti M, Gasbarrini A. et al, Effects of mineral-water supplementation on gastric emptying of solids in patients with functional dyspepsia assessed with the 13C-octanoic acid breath test. Hepatogastroenterology 2004 Nov-Dec; 51(60): 1856-59.
4. L. Agreus, Talley N.J. Dyspepsia: current understanding and management. Annu Rev Med 1997; 49: 475-493.
5. Montalto M. et al. Functional dyspepsia: definition, classification, clinical and therapeutic management. Ann Ital Med Int. 2004 Apr-Jun;19(2):84-9
6. Malagelada JR. Gastrointestinal motor disturbances in functional dyspepsia. Scand J Gastroenterol 1991; 26 (Suppl. 182) : 29-32.
7. Mansi C. et al. Comparative effects of levosulpiride and cisapride on gastric emptying and symptoms in patients with functional dyspepsia and gastroparesis. Aliment Pharmacol Ther 2000; 14: 561-569.
8. Sarnelli G. et al. Symptom patterns and pathophysiological mechanisms in dyspeptic patients with and without Helicobacter pylori. Dig Dis Sci. 2003;48:2229-2236.
9. Dobrilla G. et al. Drug treatment of functional dyspepsia. A meta-analysis of randomized controlled clinical trials. J Clin Gastroenterol. 1989; 11:169-177.
10. Grossi F. Influence of mineral waters on functional dyspepsia. Clin Ter 1989; 129:261-270;
11. Grassi M. Dyspeptic syndrome. Aspects of physiopathology, clinical features and pharmacological and hydrologic therapy. Clin Ter. 1991 137:199-208.
12. Bertoni M. et al Effects of a bicarbonate-alkaline mineral water on gastric functions and functional dyspepsia: a preclinical and clinical study. Pharmacol Res. 2002; 46:525-531.
13. Bortolotti M. et al. Modifications induced by mineral water on gastrointestinal motility of patients with idiopathic dyspepsia. Minerva Medica 1999;90:187-194.
14. Tucci A. et al. Helicobacter pylori infection and gastric function in patients with chronic idiopathic dyspepsia.Gastroenterology 1992;103:768-774.
15. Anti M. et al. Water supplementation enhances the effect of high-fiber diet on stool frequency and laxative consumption in adult patients with functional constipation. Hepatogastroenterology 1998;45:727-732

Effetti della somministrazione di acqua minerale bicarbonato calcica “lete” nella dispepsia funzionale 11
16. Cuomo R. et al. Effects of carbonated water on functional dispepsia and constipation. Eur J Gastroenterol Hepatol 2002;14:991-999.
17. Dessiner JM. Et al. Psychophysical and neurobiological evidence that the oral sensation elicited by carbonated water is of chemogenic origin. Chemical Senses 2000;25:227-284.
18. Wood JD. Et al. Fundamentals of neurogastroenterology. Gut 1999;45 (Suppl II):II6-II16.

