supplier presentation - supplier excellence...
TRANSCRIPT
47
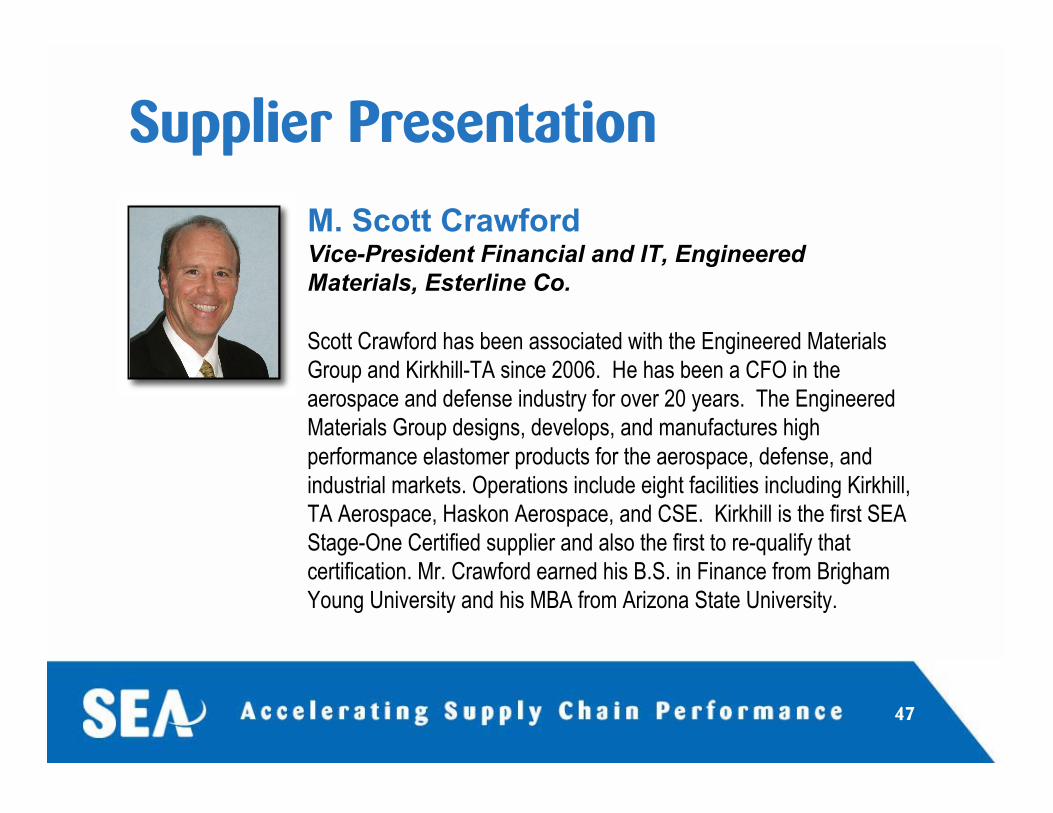
Supplier Presentation
M. Scott CrawfordVice-President Financial and IT, Engineered
Materials, Esterline Co.
Scott Crawford has been associated with the Engineered Materials
Group and Kirkhill-TA since 2006. He has been a CFO in the
aerospace and defense industry for over 20 years. The Engineered
Materials Group designs, develops, and manufactures high
performance elastomer products for the aerospace, defense, and
industrial markets. Operations include eight facilities including Kirkhill,
TA Aerospace, Haskon Aerospace, and CSE. Kirkhill is the first SEA
Stage-One Certified supplier and also the first to re-qualify that
certification. Mr. Crawford earned his B.S. in Finance from Brigham
Young University and his MBA from Arizona State University.

In Memory of Steve BartonFriend, Colleague and Esteemed Leader
1946 - 2009

Kirkhill – TA Co.Kirkhill Elastomers
Scott Crawford
SEA Lean Enterprise System
Prime EmpoweredPrime Empowered
..………….Supplier Led.Supplier Led
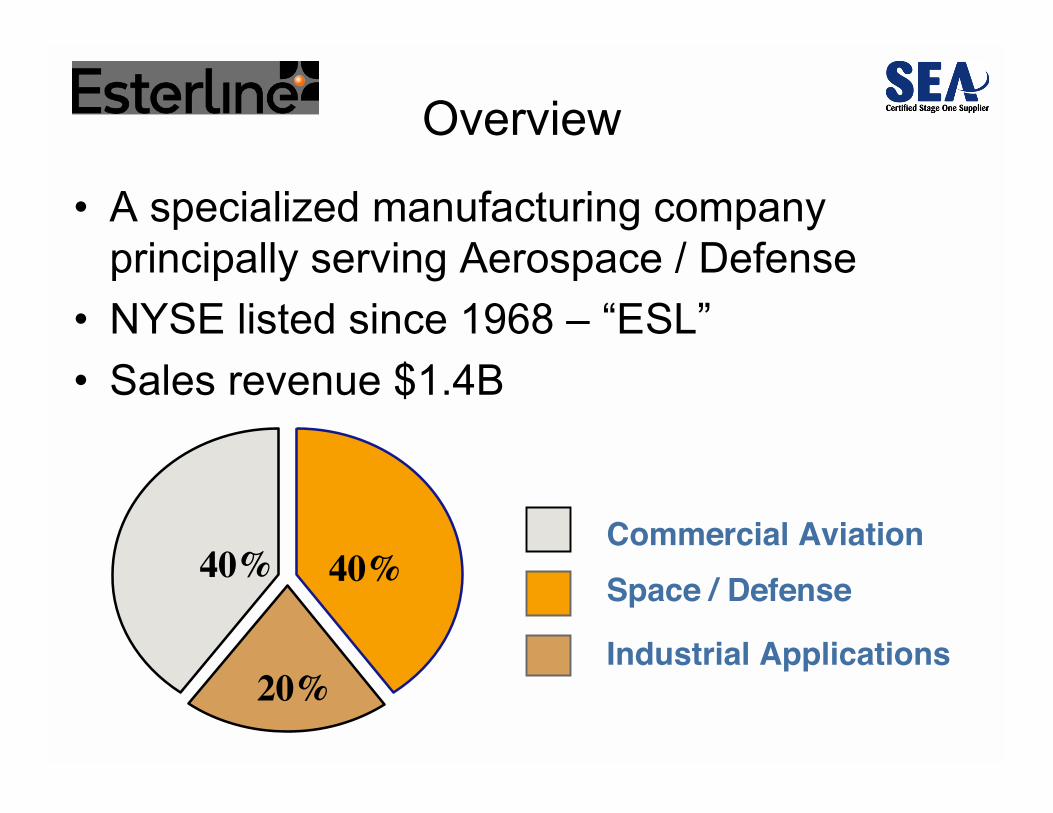
• A specialized manufacturing companyprincipally serving Aerospace / Defense
• NYSE listed since 1968 – “ESL”
• Sales revenue $1.4B
Overview
Commercial Aviation
Space / Defense
Industrial Applications
40% 40%
20%

Over 9400 Employees Worldwide
sourcing
Mfg, JV, &Sourcing
2500 peoplein Europe
H.Q. +
9 CA plants
4 plants WA
2 plantsCanada
Sales &Mfg. partner
2 plantsMexico
Overview
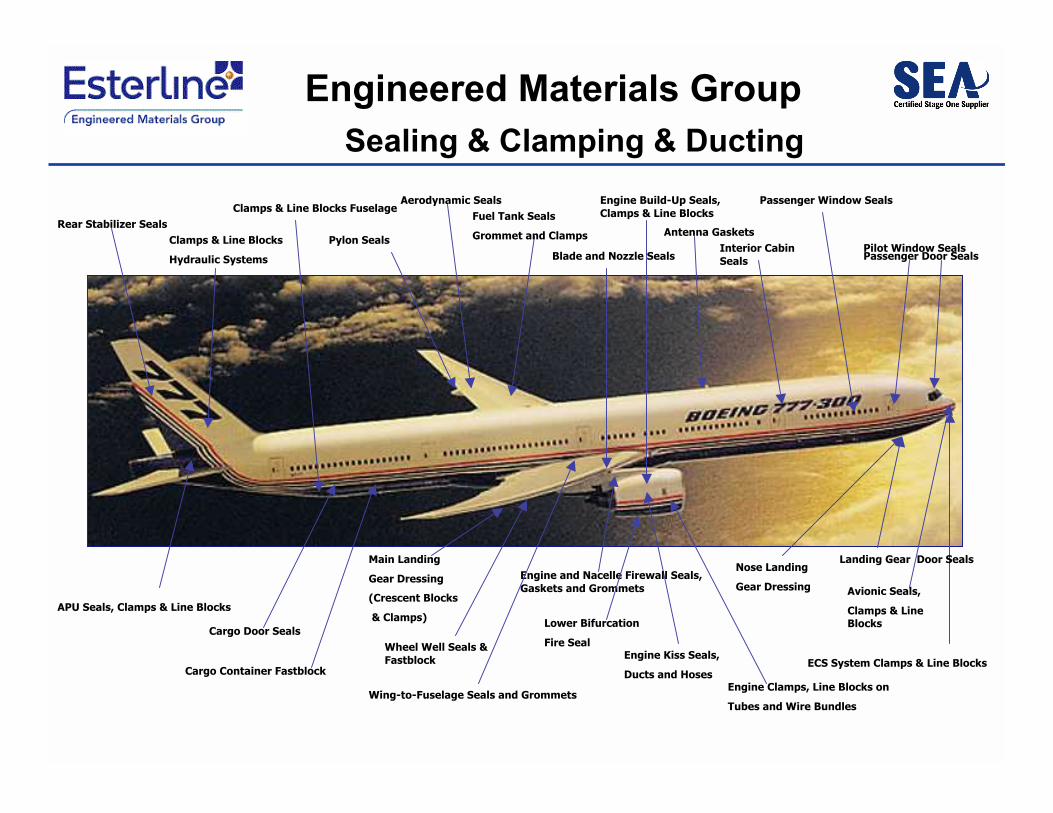
APU Seals, Clamps & Line Blocks
Pilot Window Seals
ECS System Clamps & Line Blocks
Rear Stabilizer Seals
Passenger Door Seals
Passenger Window Seals
Avionic Seals,
Clamps & LineBlocks
Nose Landing
Gear Dressing
Landing Gear Door Seals
Interior Cabin
Seals
Antenna Gaskets
Engine Clamps, Line Blocks on
Tubes and Wire Bundles
Engine Kiss Seals,
Ducts and Hoses
Engine and Nacelle Firewall Seals,
Gaskets and Grommets
Pylon Seals
Cargo Door Seals
Fuel Tank Seals
Grommet and Clamps
Wing-to-Fuselage Seals and Grommets
Main Landing
Gear Dressing
(Crescent Blocks
& Clamps)
Wheel Well Seals &
Fastblock
Aerodynamic SealsClamps & Line Blocks Fuselage
Cargo Container Fastblock
Clamps & Line Blocks
Hydraulic Systems
Engine Build-Up Seals,
Clamps & Line Blocks
Blade and Nozzle Seals
Lower Bifurcation
Fire Seal
Sealing & Clamping & Ducting
Engineered Materials Group
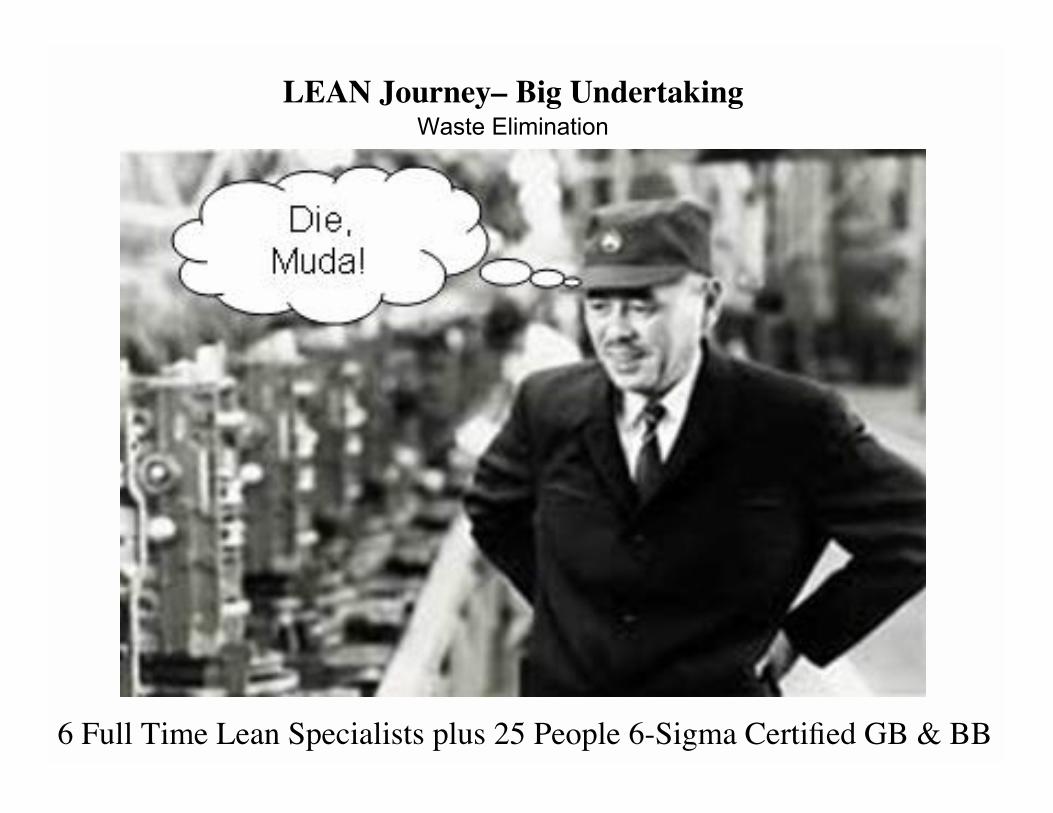
LEAN Journey– Big UndertakingWaste Elimination
6 Full Time Lean Specialists plus 25 People 6-Sigma Certified GB & BB

Historical Lean Timeline• Embarked on Lean with HLS February 2005
• Engaged with SEA October 2005
• SEA LES Training for Management April 2006
• SEA Roadmap Certifications (9 execs) 2006 - 2007
• SEA Managing Process Improvement August 2007
• SEA Audit Stage 1 October 9-11 2007
• SEA Certified Stage 1 Level 3 PMM October 12, 2007
• SEA Re-Certified Stage 1 Level 3 PMM January 2009
• TA Aerospace – Sister Company – SEA Certified January 2009

Kirkhill-TA Lean Journey
FY2004 FY2008
• Sales Revenue $100M $154M
• Sales/ee $84K $125K
• Inventory Turns 3.4 4.2
• On time Delivery 39% 81%
• AR Days 59 49
• Quality PPM’s 28,948 10,776
• Floor Space Savings 33,600 Ft2
• Financial Results
54% Growth!
100+% Gain!
49% Improvement!
24% Improvement!
30% Gain!
62% Improvement!
Greatly Improved !!
Needed Space !!

2009 KIRKHILL-TAFLIGHT PLAN FY05 FY06 FY07 FY08 FY09
Actual Actual Actual Actual Plan Key Actions
ROI % Increasexxx xxx xxx xxx xxx
1. Mexico Startup2. Reduced inventory3. Reduce AR
PROFITABILITY
Sales growth
Earnings
growth
19%
xxx
9%
xxx
13%
xxx
6%
xxx
2%
Xxx
1. Expand global market share2. Improve dev. & launch processes3. Scrap reduction thru six sigma
LEAN Inv Turns
Sales per ee
3.8
99K
4.0
105K
4.0
110K
4.2
125K
4.6
125K
1. Implement TPS/HLS/PES2. Lean enterprise company wide3. Adopt SEA Phase I-II-III, PMM 3+
DELIVERY
Line Items 61% 68% 77% 85% 90%
1. PC&L with level loading2. Involve key suppliers in Lean VSM3. Expand VSM’s to include
customers
QUALITYPPM’s
22,100 21,350 16,800 10,776 <10,000
1. Move inspection Resp. to Ops2. Expand use of 6-Sigma processes3. Continue equipment
modernization
EMPLOYEES Training Hrs
Per EE
Safety IFR
ETP-
60%
5.9%
ETP-
60%
5.9%
ETP-
80%
5.5%
ETP-
80%
5.4%
40-H
100-M
<5.0
1. Obtain a 4th
State training grant2. Revise and update safety
programs3. Increase training hours per ee4. Maintain high communications
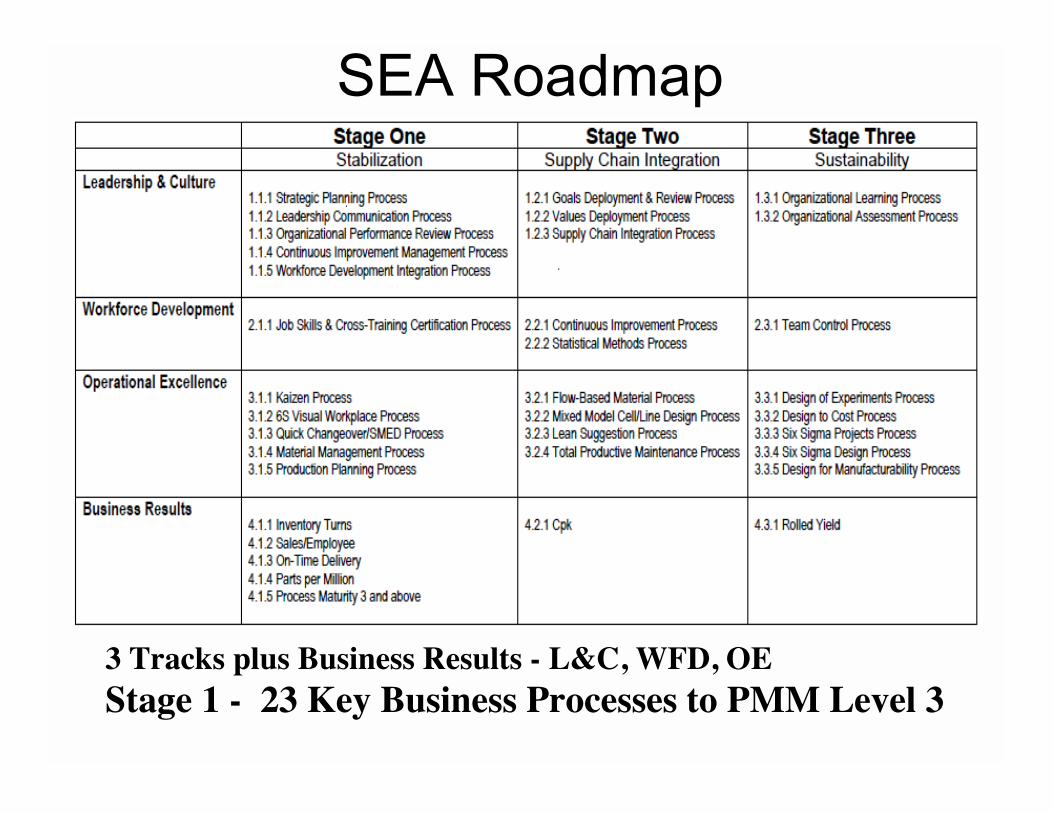
SEA Roadmap
3 Tracks plus Business Results - L&C, WFD, OEStage 1 - 23 Key Business Processes to PMM Level 3

Operational Kaizen:Improve Process
Capability
Phase II – Stage 2
Waste Elimination:Create Flow & Improve
Productivity
Phase I – Stage 1
Supply Value Chain:Order To Delivery
Phase III – Stage 3
Timeline
Lean Transformation 5-Year Plan
•Supply-Chain Integration Initiatives
•Production leveling and adherence scheduling plan.
•Purchased Parts Supermarkets.
•JIT Internal Supplier linkage.
•FG Supermarket Strategy.
•TAKT image attainment and Process Cycle-Time Balance.
•Pull Systems (Kanban, Visual Replenishment, Two-Bins).
•Cross-Training and Flexible Manpower Cells.
•PFEP, POUT, and Delivery Material Routings.
•Kaizen Methodologies: 3-5 day Events, Spot Activities, Kaizen Newspaper
Problem Resolution.
•Process Linkage and Flow Sequence.
•Value Stream Mapping & 90-Day Improvement Plan
•6”S” & Visual Factory deployment and sustaining program.
•Black-Belt Six-Sigma Statistical Problem Solving Techniques.
•Green-Belt Problem Solving Techniques (DMAIC).
•Machinery set-up reduction and SMED Techniques.
•Reduce process variation and standardize operation procedures
•Problem Solving (PDCA).
•Kaizen Leaders Training
•Balanced Standard Work.

Lean 5 Year Plan
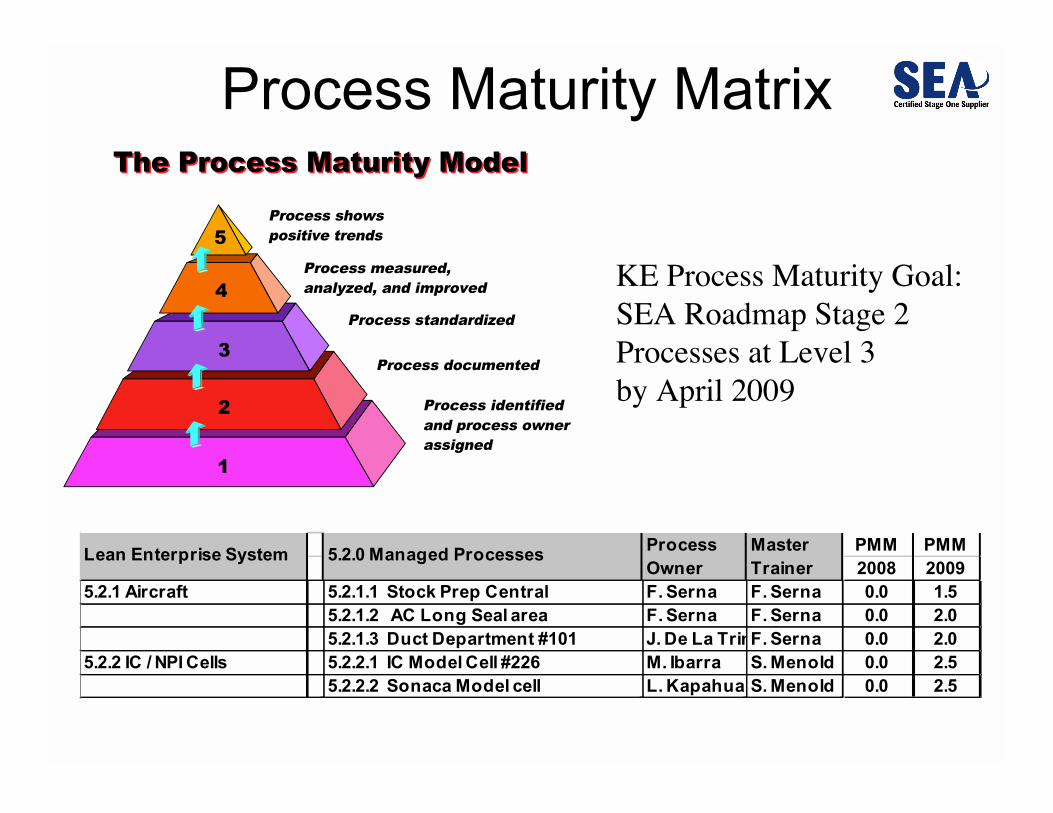
The�Process�Maturity�ModelThe�Process�Maturity�Model
Process�showspositive�trends
Process�measured,analyzed,�and�improved
Process�standardized
Process�documented
Process�identifiedand�process�ownerassigned
5
4
3
2
1
Process Maturity Matrix
KE Process Maturity Goal:SEA Roadmap Stage 2Processes at Level 3by April 2009
PMM PMM
2008 2009
5.2.1 Aircraft 5.2.1.1 Stock Prep Central F. Serna F. Serna 0.0 1.5
5.2.1.2 AC Long Seal area F. Serna F. Serna 0.0 2.0
5.2.1.3 Duct Department #101 J. De La TrinF. Serna 0.0 2.0
5.2.2 IC / NPI Cells 5.2.2.1 IC Model Cell #226 M. Ibarra S. Menold 0.0 2.5
5.2.2.2 Sonaca Model cell L. Kapahua S. Menold 0.0 2.5
Process
Owner
Master
TrainerLean Enterprise System 5.2.0 Managed Processes

Stage 2 Leadership & Culture
Champion : President & CEO Stabilization
ProcessProcess
Owner
Master
Trainer
PMM
2008
PMM
2009
1.2.1 Goals Deployment & Review VP Finance VP Finance 3 3
Process
1.2.2 Values Deployment Process COO VP HR 2 3
1.2.3 Supply Chain Integration Dir Purch Dir Purch 2 3
Six Executives SEA Certified in Lean Leadership
SEA Roadmap
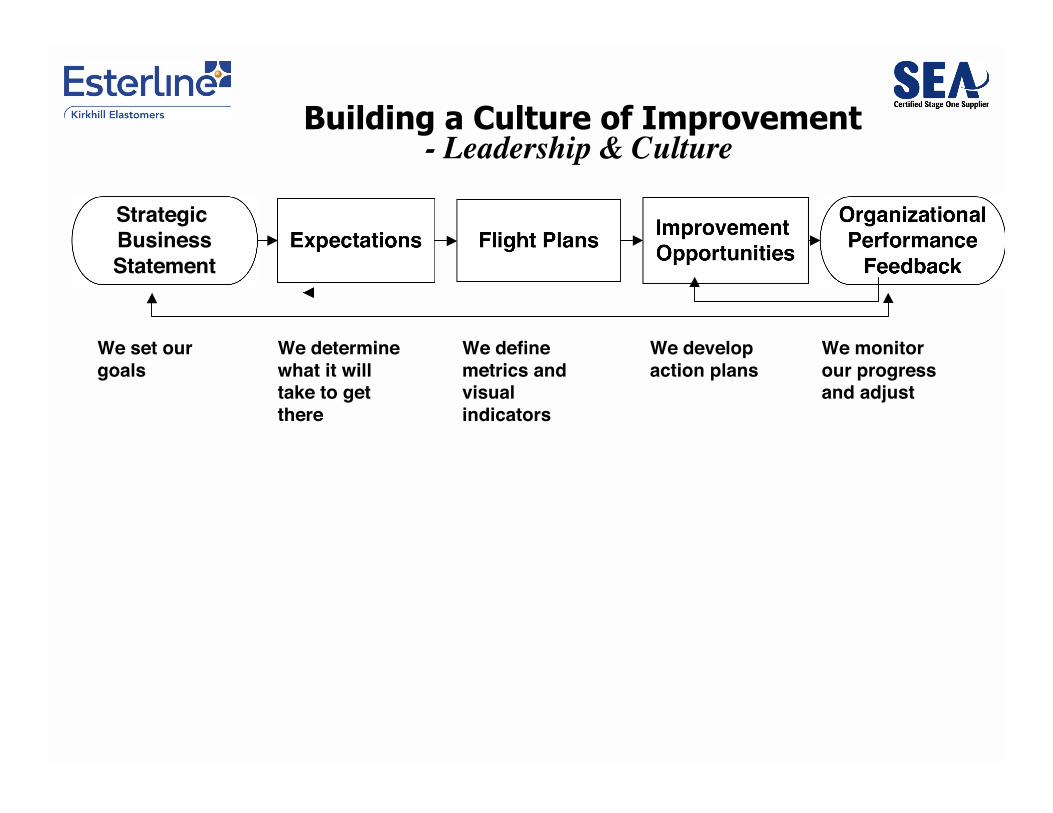
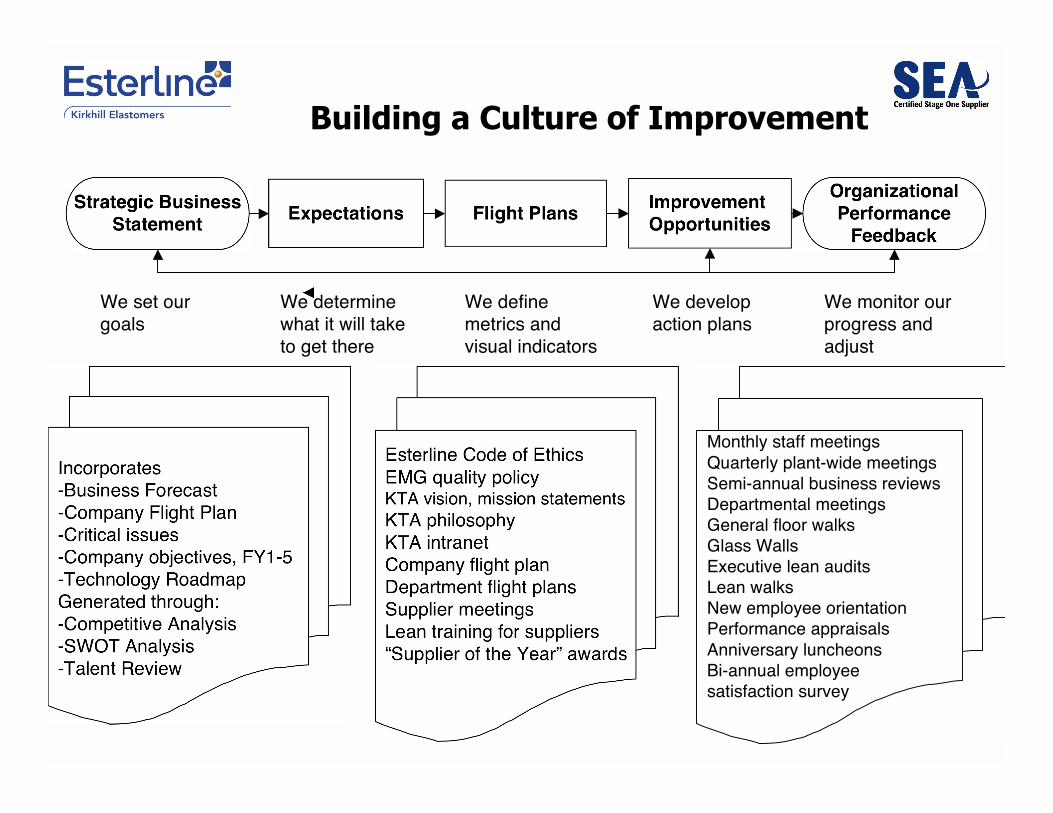
Building a Culture of Improvement
Flight PlansExpectationsImprovement Opportunities
OrganizationalPerformance
Feedback
Strategic BusinessStatement
We set ourgoals
We determinewhat it willtake to getthere
We definemetrics andvisualindicators
We developaction plans
We monitorour progressand adjust
- Leadership & Culture
Flight PlansExpectationsImprovement Opportunities
OrganizationalPerformance
Feedback
Strategic BusinessStatement
We set ourgoals
We determinewhat it will taketo get there
We definemetrics andvisual indicators
We developaction plans
We monitor ourprogress andadjust
Incorporates -Business Forecast-Company Flight Plan-Critical issues-Company objectives, FY1-5-Technology RoadmapGenerated through:-Competitive Analysis-SWOT Analysis-Talent Review
Esterline Code of EthicsEMG quality policyKTA vision, mission statementsKTA philosophyKTA intranetCompany flight planDepartment flight plansSupplier meetingsLean training for suppliers“Supplier of the Year” awards
Monthly staff meetingsQuarterly plant-wide meetingsSemi-annual business reviewsDepartmental meetingsGeneral floor walksGlass WallsExecutive lean auditsLean walksNew employee orientationPerformance appraisalsAnniversary luncheonsBi-annual employee satisfaction survey
Building a Culture of Improvement

Strategic
Business
Statement
(SBS)
Develop
Departmental
Goals & Objectives
Deploy
Improvement
Plans
Organizational
Performance
Review
Organizational Performance Review System- Sustainment
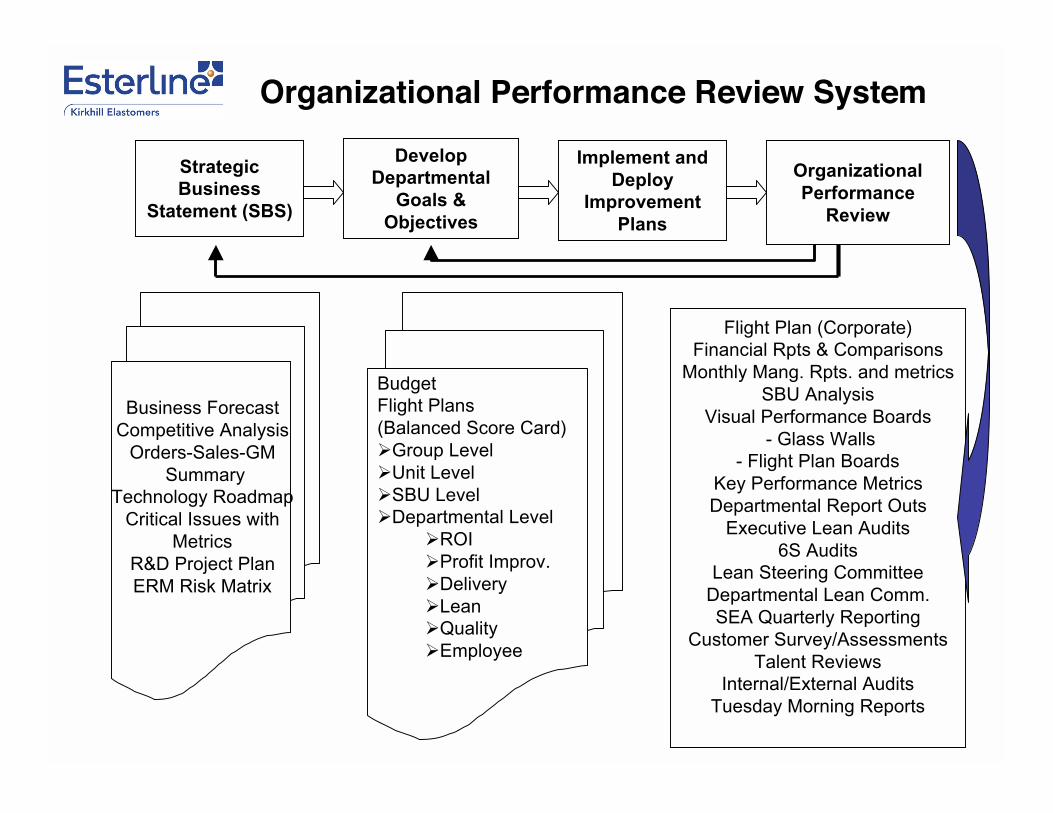
Strategic
Business
Statement (SBS)
Develop
Departmental
Goals &
Objectives
Implement and
Deploy
Improvement
Plans
Organizational
Performance
Review
Business ForecastCompetitive Analysis
Orders-Sales-GM Summary
Technology RoadmapCritical Issues with
MetricsR&D Project PlanERM Risk Matrix
BudgetFlight Plans(Balanced Score Card)
Group LevelUnit LevelSBU LevelDepartmental Level
ROIProfit Improv.DeliveryLeanQualityEmployee
Flight Plan (Corporate)Financial Rpts & Comparisons
Monthly Mang. Rpts. and metricsSBU Analysis
Visual Performance Boards - Glass Walls
- Flight Plan BoardsKey Performance MetricsDepartmental Report Outs
Executive Lean Audits6S Audits
Lean Steering CommitteeDepartmental Lean Comm.SEA Quarterly Reporting
Customer Survey/AssessmentsTalent Reviews
Internal/External AuditsTuesday Morning Reports
Organizational Performance Review System
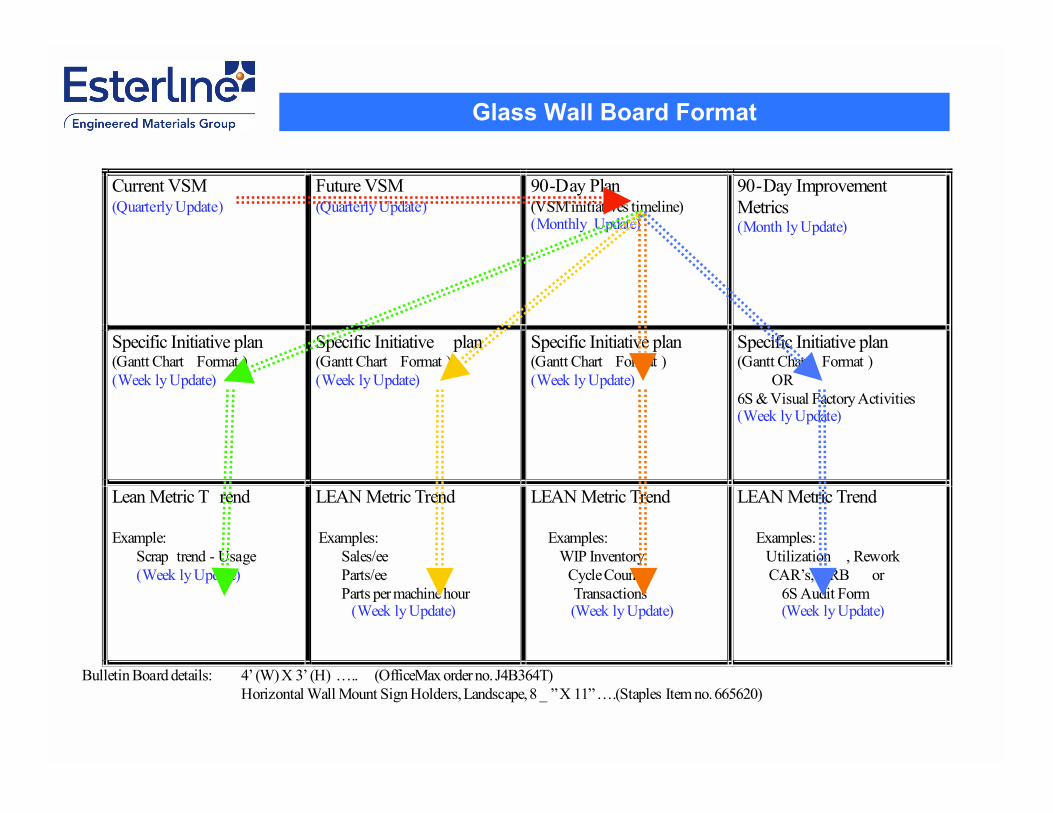
Current VSM (Quarterly Update)
Future VSM (Quarterly Update)
90-Day Plan (VSM initiatives timeline) (Monthly Update)
90-Day Improvement
Metrics (Month ly Update)
Specific Initiative plan (Gantt Chart Format )
(Week ly Update)
Specific Initiative plan (Gantt Chart Format )
(Week ly Update)
Specific Initiative plan (Gantt Chart Format )
(Week ly Update)
Specific Initiative plan (Gantt Chart Format )
OR
6S & Visual Factory Activities (Week ly Update)
Lean Metric T rend
Example:
Scrap trend - Usage
(Week ly Update)
LEAN Metric Trend
Examples:
Sales/ee
Parts/ee
Parts per machine hour (Week ly Update)
LEAN Metric Trend
Examples:
WIP Inventory
Cycle Counts
Transactions (Week ly Update)
LEAN Metric Trend
Examples:
Utilization , Rework
CAR’s, MRB or
6S Audit Form (Week ly Update)
Bulletin Board details: 4’ (W) X 3’ (H) ….. (OfficeMax order no. J4B364T)
Horizontal Wall Mount Sign Holders, Landscape, 8 _ ” X 11” ….(Staples Item no. 665620)
Glass Wall Board Format
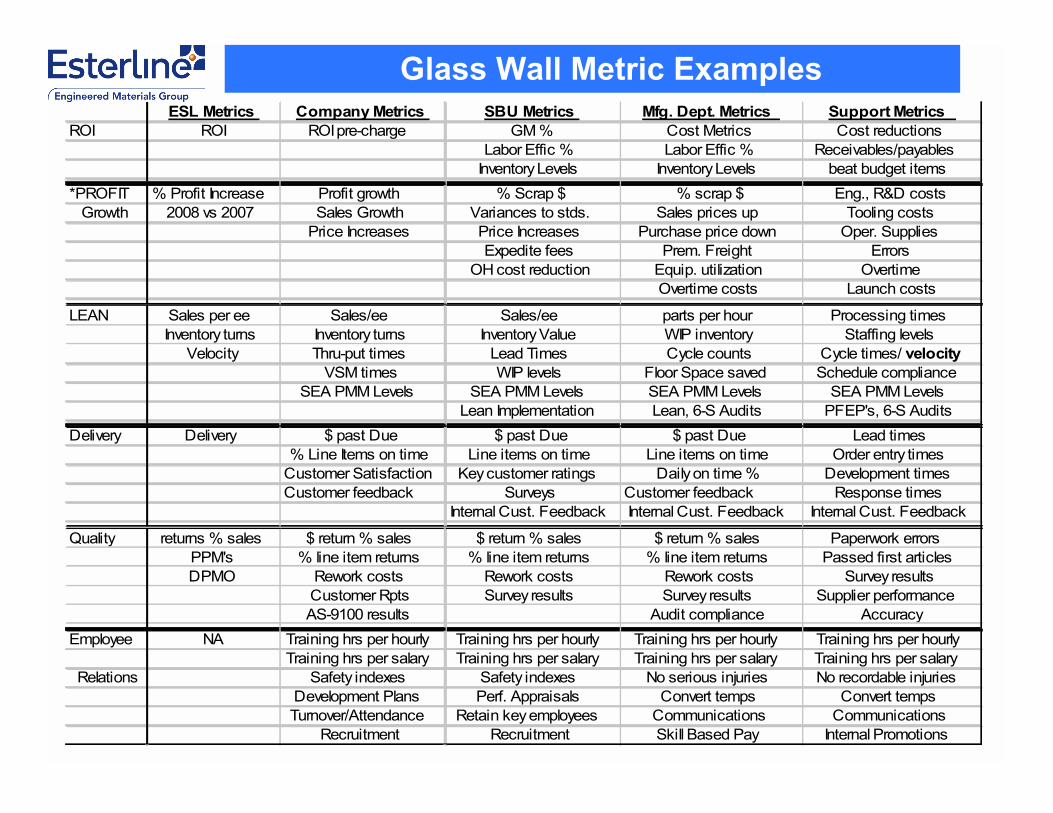
ESL Metrics Company Metrics SBU Metrics Mfg. Dept. Metrics Support Metrics
ROI ROI ROI pre-charge GM % Cost Metrics Cost reductions
Labor Effic % Labor Effic % Receivables/payables
Inventory Levels Inventory Levels beat budget items
*PROFIT % Profit Increase Profit growth % Scrap $ % scrap $ Eng., R&D costs
Growth 2008 vs 2007 Sales Growth Variances to stds. Sales prices up Tooling costs
Price Increases Price Increases Purchase price down Oper. Supplies
Expedite fees Prem. Freight Errors
OH cost reduction Equip. utilization Overtime
Overtime costs Launch costs
LEAN Sales per ee Sales/ee Sales/ee parts per hour Processing times
Inventory turns Inventory turns Inventory Value WIP inventory Staffing levels
Velocity Thru-put times Lead Times Cycle counts Cycle times/ velocity
VSM times WIP levels Floor Space saved Schedule compliance
SEA PMM Levels SEA PMM Levels SEA PMM Levels SEA PMM Levels
Lean Implementation Lean, 6-S Audits PFEP's, 6-S Audits
Delivery Delivery $ past Due $ past Due $ past Due Lead times
% Line Items on time Line items on time Line items on time Order entry times
Customer Satisfaction Key customer ratings Daily on time % Development times
Customer feedback Surveys Customer feedback Response times
Internal Cust. Feedback Internal Cust. Feedback Internal Cust. Feedback
Quality returns % sales $ return % sales $ return % sales $ return % sales Paperwork errors
PPM's % line item returns % line item returns % line item returns Passed first articles
DPMO Rework costs Rework costs Rework costs Survey results
Customer Rpts Survey results Survey results Supplier performance
AS-9100 results Audit compliance Accuracy
Employee NA Training hrs per hourly Training hrs per hourly Training hrs per hourly Training hrs per hourly
Training hrs per salary Training hrs per salary Training hrs per salary Training hrs per salary
Relations Safety indexes Safety indexes No serious injuries No recordable injuries
Development Plans Perf. Appraisals Convert temps Convert temps
Turnover/Attendance Retain key employees Communications Communications
Recruitment Recruitment Skill Based Pay Internal Promotions
Glass Wall Metric Examples

Score1-2 = Unclear if
activities are in-
progress
3-4 = Activities in
progress, no clear
ownership, not sustaining
5-6 = Strong indicators of lean activities
being sustained, employee involvement,
using metrics to track progress
9-10 = Lean Enterprise wide, trends
positive, everyone fully engaged
6S Deployment &
Sustainment
Lean Waste
Elimination
Glass Wall
Boards
Visual Management
Systems & Controls
Strategic Initiatives
linked to
Flight Plan
Standardization
Practices, Process
Maturity Model
Employee
Development &
Involvement
Lean Systems
Implementation -
Factory & offices
Leadership and
Support
New Lean Initiatives
for Future
Monthly Score Log Total ÷ 10 = (Month Ave rage Score )
1st Mo: __________ 2nd Mo: ___________ 3rd Mo.: ___________
Auditors:
Previous Qtr.
Avg: _______
0 0.0
Category
Notes for the Next Level of Improvement
(0-10)
Weekly/monthly audit forms completed, scores are reasonable , results graphed,
countermeasures implemented. Employees engaged to maintain and improve 6S scores.
Areas are clean, orderly, well organized, and effectively use space.
Expansion of lean activities to new areas (Offices, Production Cells, Storage Areas).
Plans and actions exist to engage new areas (or people) into the Lean Entrerprise. Area
leaders can explain plans for future expansion of Lean to become enterprise wide.
MANAGEMENT LEAN AUDIT FORM
Any score of 4 or less requires a feedback comment.
Perfect score = 100
Evaluation & Scoring Criteria
Date:______________
Dept:______________
7-8 = Achievements obvious, employees engaged,
driving CI activiites, metrics updated, tracked.
Boards exist, are populated with correct information, updated and in use. Current and
Future State VSM's, 90 day overall plan, detailed action plans, meaningful metrics, skills
cross training, etc. Plans and metrics are meaningful and appropriate.
Positive results from Kaizen improvement activities to reduce WASTE: Overproduction,
Excess Inventory, Waiting, Over Processing (labor or reports), Correction (rework), Over
Transportation (People/Material), Under-utilization (People/Machines).
Hr-by-Hr production charts in use & up-to-date, Kaizen Newsletters effectively used as a
two-way communication deviceAndon systems, color coding systems, floor marking, lights,
shadowboards, task boards, etc. established and in use. Visual office concepts in use.
Major initiatives aligned to achieve Flight Plan Targets. Updated Flight Plan metricsare in
place to monitor progress towards strategic business objectives, Quarterly Plans, and
actions taken. Priorities reflect both current and long term business needs.
Evidence, usage of standard work (Work Instructions, Operation Sheets, Written
Processes, etc). Standard office procedures in factory and offices. Standard forms used.
Changes documented. Standards followed. Process Maturity being actively improvd.
Managers, supervisors,and lead people actively lead Lean activities by example. Their own
work areas are organized, use visual controls, have performance indicators. Area leaders
own the processes and are committed to process improvement through Lean.
Skills Certification table used and posted, Master trainers identified. Training goals met.
Recognition & Positive Reinforcement program on display. Team members knowledgable
in Lean tools in use, can explain systems and procedures in use in their areas.
Established and maintained: Kanbans, Min-Max Systems, Supermarkets, Level Loading
devices (i.e. Heijunka box, card pull boards, etc), Visual Replenishment devices, Line
Balancing Charts, etc. Easy to understand and use.
Management Involvement is Required

Return on Investment:Flight Plans, Managing by Objectives
Flight Plans, PDCA
ManMan – BOM’s, Routers, Work Orders, Xactman
Inventory Management, Warehouse Procedures
Profit Growth :
Contract Review
Customer Service Skills
Regulatory Compliance Training
Financial Reporting for Managers/Supervisors
Six Sigma Problem Solving
Lean Enterprise :
6-S, 6-S Audit Review
Glass Wall & Visual Indicators, Visual Office
Production Min-Max Supermarket,
Value Stream Mapping, Kaizen
Metrics, How to Develop & Use
SEA LES, HLS Lean Basics, LET
Delivery :
Project Management
Time Management
Quick Change Over, SMED
Kanban Systems
Quality :AS 9100 – Introduction & Advanced
Geometric Dimensions and Tolerancing
Master Trainer training, Job Skills
Problem Solving/Root Cause Analysis
Quality System Training, Levels 1-4
Employee Relations :
Communication Skills, Leadership Skills
Esterline Competencies – Individual Performer
Esterline Competencies – Managerial Needs
ESL Management Essentials
Office Safety, Production Safety Topics
Stress Management, Change Management
KIRKHILL TRAINING PLAN FY2009Flight Plan Initiatives Linked Training :
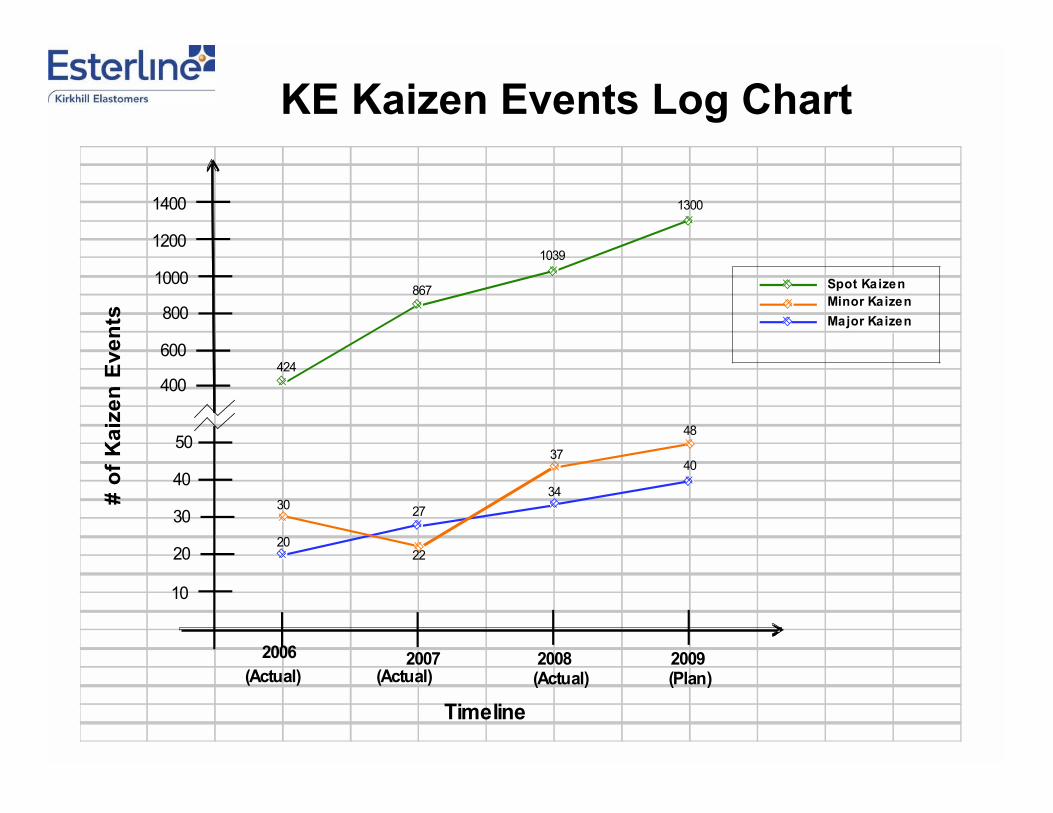
KE Kaizen Events Log Chart
Spot Kaizen
Minor Kaizen
Major Kaizen
10
20
30
40
50
# o
f K
aiz
en
Ev
en
ts
Timeline
2006 2007 2008 2009
400
600
800
1000
1200
1400
(Actual) (Actual) (Actual) (Plan)
20
27
34
40
30
22
37
48
424
867
1039
1300
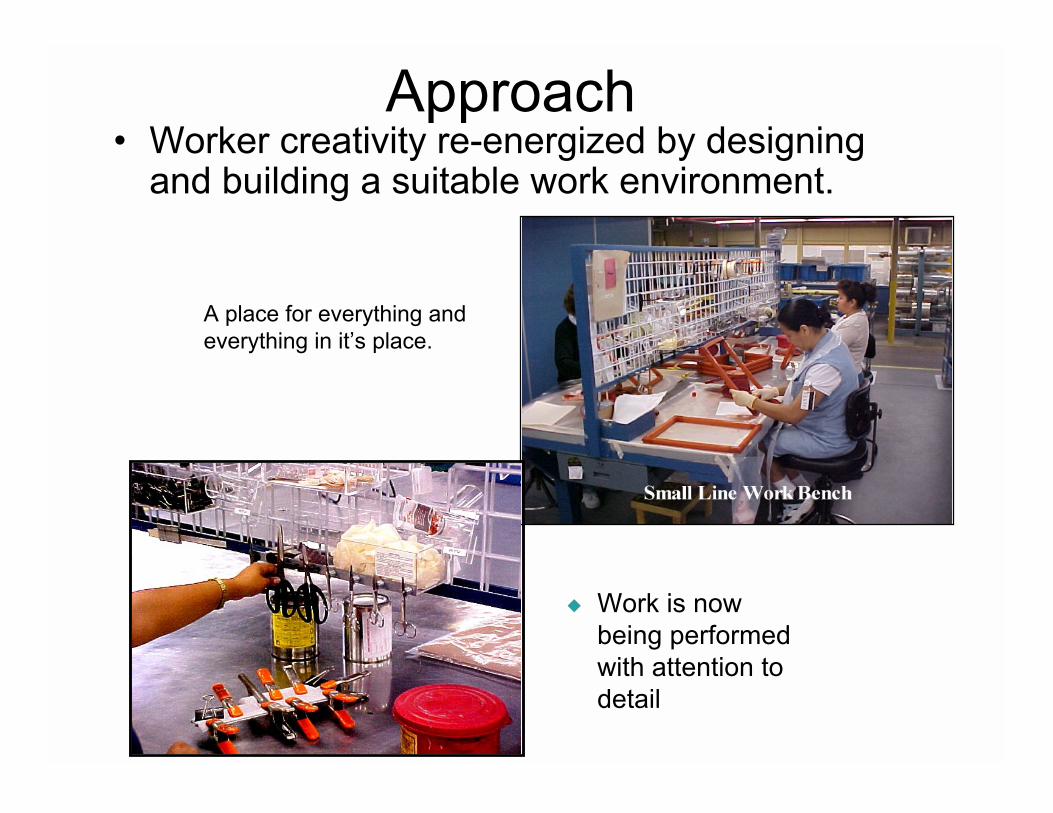
Approach• Worker creativity re-energized by designing
and building a suitable work environment.
Work is nowbeing performedwith attention todetail
A place for everything andeverything in it’s place.

Brea BeforeBrea BeforeThe Small Line occupied a large area
under-utilized for work and over
utilized for the placement of WIP
and other non-essential items
Brea After Brea AfterAs a direct result of the 5S activity,
the entire Small Line was able to
move closer to the next process;
identification. This freed up over
400 sq. feet of space which allowed
the department to move a related
process to where it could feed into the
next processes.

• Strategic Planning Sessions May - August - November
• HLS Reviews & Seminars March - September
• SEA Stage 2 & 3 PMM level 3 Ongoing
• Glass Wall Boards 90 Day Plans
• Plant-wide Meetings Quarterly
• Exec Lean Steering Committee Monthly
• Lean Executive Audits Monthly
• Flight Plan Reviews Monthly
• Kaizen Events Daily / Weekly
• 6-S Area Audits Weekly
• Production Charting Hourly
Lean Future PlansOverview

Kirkhill-TA Lessons Learned
• Must be driven by top management
• No silver bullet – If anything, it is sustained through faithand trust in the process.
• Communications vital, get people engaged
• Layered auditing minimizes backsliding.
• Effective training has a good payback.
• Administrative gains can be significant.
• Use factual metrics to track progress.
Over time it becomes part of the DNA
of the company.
SEA RoadmapIT’S ALL ABOUT VELOCITY
& CUSTOMER FOCUS !
Mouse busting through maze
goes here!!! Too big of file.

Thank YouThank You