supplier selection decision making in the pharmaceutical
TRANSCRIPT

Supplier selection decision making in the pharmaceutical industry based on Kraljic portfolio and MAUT method:
A Case Study in Indonesia
Yudi Abdillah Master of Industrial Engineering Student
Universitas Mercu Buana, Jakarta, Indonesia [email protected]
Sawarni Hasibuan
Master of Industrial Engineering Program Universitas Mercu Buana, Jakarta, Indonesia
[email protected], [email protected]
Abstract
The decision to select suppliers is a strategic issue in the pharmaceutical industry because of the tight regulations on the quality, safety, and reliability of raw materials for the drug manufacturing process. The selection of suppliers of raw materials for the pharmaceutical industry needs to ensure conformity to the characteristics and profiles of suppliers with standard supplier criteria in the pharmaceutical industry. The purpose of this study is to evaluate the decision to select suppliers of raw materials to the pharmaceutical industry in Indonesia in the case of large volume parenteral or intravenous fluids. The Kraljic matrix is used to model the purchase portfolio of raw materials for intravenous fluids in the pharmaceutical industry, based on the dimensions of supply risk and company profitability. The decision framework for supplier selection using the MAUT method is designed for raw materials belonging to the strategic item quadrant by optimizing the criteria that are the main needs of the company according to the company's procurement strategy and business. The results of the study succeeded in mapping four strategic items from seven types of raw materials for intravenous fluids. The attribute in the supplier selection decision for raw materials for infusion fluids are grouped into five attributes, namely assurance of supply, quality & regulatory compliance, procurement cost, innovation/technical, and responsiveness & communication. Each attribute is elaborated into sub-attributes. By using the MAUT method, the ranking among suppliers was successfully carried out. The purchasing price and assurance of supply attribute differentiate between these three alternative suppliers, however, the first and second rankings meet the criteria to be continued in long-term cooperation because the quality of performance is above the company's minimum standards and still has the potential to improve its performance.
Keywords: Kraljic matrix, MAUT method, pharmaceutical industry, supplier selection.
1. Introduction
Providing added value to products distributed to customers becomes a must for every company in all industries in addition to meeting customer expectations for quality and competitive products.No exception with the pharmaceutical industry, where the pharmaceutical industry can be seen as an industry with complex process systems, operations, and organizations involved in the discovery, development, and manufacture of drugs (Moniz et al.2015). Strict qualification rules related to the quality, safety, and reliability of raw materials for the drug manufacturing process, strategic partnerships with supply chain management are expected to result in increased benefits for pharmaceutical companies (Khan & Siddiqui, 2018) and Good Manufacturing Process and supplier qualifications greatly determine the quality, safety, and efficacy of the resulting drug products (Patel & Chotai, 2010).
Proceedings of the 11th Annual International Conference on Industrial Engineering and Operations Management Singapore, March 7-11, 2021
© IEOM Society International 4159

The supplier selection and evaluation process are one of the main activities that must be integrated by the organization into the company's core strategic decisions (Eyinda et al.2010). Supplier selection issues in the business domain have been addressed through various approaches by evaluating supplier and product-specific data (Miah et al, 2013).
In the end, this article aims to assist pharmaceutical companies in the process of selecting the right raw material suppliers by considering the raw material category as part of the company's procurement strategy by using the Kraljic matric portfolio and MAUT method for supplier selection.
2. Literature review
In terms of literature related to the selection of raw material suppliers for the pharmaceutical industry, several previous studies have proposed and recommended selection and evaluation methods for supplier selection as follows; AHP method (Eyinda et al.2010, Yadav.2015 and Asamoah et al.2012), an ANP method (Kirytopoulos et al.2008), Fuzzy AHP (Ganguly et al.2019, Alinezad et al, 2013), Fuzzy TOPSIS Method (Mehraliana et al, 2012, Narenjian et al, 2019). Several combinations of methods are also proposed such as the combination of Fuzzy AHP and Fuzzy VIKOR Methods (Nadar et al, 2020), MOPSO and TOPSIS methods recommended by Adeli et al. 2019, a combination of PCA, Z-TOPSIS, and MILP methods recommended (Forghani et al, 2018), and a combination of TOPSIS and PROMETHEE II Methods (Pourghahremana et al, 2015).
In this research, Kraljic's matrix portfolio used to map the position of raw materials related to their relative contribution to supply risk and profitability of the company, so that the results of such mapping can complement and become the baseline of supplier selection strategy. Multi Utility Attribute Theory (MAUT) is used as a supplier selection method in this research.
3. Research Methods
This study takes the qualitative and quantitative approach with applied research design, where a combination of literature studies, surveys and interviews, field observation, and analysis of company documents become a source of data collection. The distribution of questionnaires as part of data collection instruments is carried out on competent experts in terms of decision making related to production, quality control, quality management, and procurement of raw materials (Direct & Indirect material). Focus group discussion and interviews with experts representing stakeholders of the production and procurement process.
The steps carried out in this study are as follows: (1) Mapping the position of raw materials or materials in the kraljic matric quadrant by using the dimensions of supply risk and profit impact. (2) Identify the criteria and sub-criteria of the supplier selection process. (3) Identify assumptions, risk management, and business strategy of the company. (4) Data processing and analysis of the results of opinions and perspectives of experts using the method of MAUT.Verification on existing suppliers owned by the company is currently carried out to demonstrate the effectiveness of the method approach used in this study.
4. Result & Discussion
One of the medicinal products produced by the pharmaceutical industry is a large parenteral volume product or infusion fluid. This product is a dosage form intended for injection into the body, water is usually used as a solvent (Reading F.2005). Ringer Lactate Products is one of the most widely produced infusion fluid products by LVP manufacturers and the most widely used consumers in the world.
Until the year 2020 in Indonesia, six companies are manufacturers of this type of product to meet the public's need for this infusion product continues to increase with an estimated 150 million units per year in 2017 to 210 million units per year in 2020. This research conducted in one of the global multinational pharmaceutical companies based in Germany, with a factory located in one of the Industrial areas in West Java, one of six manufacturers producing infusion drug products in Indonesia with a production capacity of 15 million bottles per year.
Proceedings of the 11th Annual International Conference on Industrial Engineering and Operations Management Singapore, March 7-11, 2021
© IEOM Society International 4160

4.1. Assessing Risks and Maximize the Benefits of Raw Material Procurement
Bill of the material of Lactate Ringer products in general, are as follows: (1) sodium chloride or industrial salt with pharma grade, (2) Potassium chloride, (3) Calcium Chloride Dihydrate, (4) Sodium lactate solution 50%, (5) HDPE, (6) LDPE granulate, and (7) Trim Cap. Some of the raw materials in the procurement process are carried out through importation from several producers outside Indonesia, and some in the supply from local suppliers who are distributors from overseas producers.
Bildsten et al.(2010) mapped the Kraljic Portfolio Quadratic for raw materials as shown in table (1), showing the difference between each quadrant based on the points of concern and the company's baseline strategy.
Table 1. Quadratic Characteristics of Kraljic Portfolio Product Types / Features Non-Critical
items Leverage Items Bottleneck Item Strategic Items
Focus on Acquisition Low-Value High Value (Qty) Low Value (Small Volume)
High Value (High Complexity)
Key Performance Criteria
Functional efficiency
Cost/price And materials Flow management
Cost management and reliable short-term
sourcing
Long-term Availability
Time Horizon Short Medium Medium Long Supply Rich Rich Scarce Scarce Alternative Supplier Many Many Few Few/None
Kraljic (1983) mapped the position of purchasing goods into four quadratic portfolios rather than their relative contribution to the company's supply and profitability risks. Matrik Kraljic distinguishes strategies into four quadrants based on two different dimensions. Padhi et al.(2013) by developing an objective assessment for commodities before including them into the Kraljic Portfolio Matrik, with the following steps: (1) Create a ranking scale and provide numerical values for each attribute of both supply risk and profit impact. (2) Collect priority scores for each attribute of supply risk and profit impact from the perspective of experts and take the average priority score for each attribute. (3) Determining the weight for each attribute and normalizing it, this study used an approach with the AHP method to get the priority weight of each attribute.
Table 2. Attribute weight for each Dimension Dimension Attributes Weights
Supply Risk Ketersediaan Material (In terms of Availability) - (S01) 32.9 % Jumlah Pemasok (number of suppliers) - (S02) 28.7% Kompetitif permintaan (Competitive demand) - (S03) 20.6% Kemungkinan Penggantian (Possible replacement) – (S04) 17.7%
Profit Impact Tingkat kekritisan pembelian (Criticality of Purchase) –( P01) 16.4% Besarnya nilai pembelian (Percentage of total purchase cost – (P02) 53.9% Kualitas product (Impact on product quality or business growth)-(P03) 29.7%
In the Supply risk dimension, showing material availability (S01) ranked first with a weight of 32.9%. Then followed the Number of Suppliers (S01) with 28.7% in the second, competitive demand (S03) with 20.6% in the third, and The Possibility of Replacement in the last order (S04) with 17.7%. (S01) being the criteria with the highest weight for the Supply Risk Dimension shows the risk of scarcity of material preparations in the market to be a point of concern considering this has happened in the early days of the Covid-19 pandemic hit the world in 2020, where raw material producing countries imposed a lockdown so that import-export flows were hampered and resulted in the scarcity of raw materials in the market.
Impact's profit dimension sorts (P02) in the first place with a very significant value weight of 53.9%, the effect on product quality (P03) is in second place with 29.7% and followed by purchasing criticism rate (P01) with 16.4%. The profitability of pharmaceutical companies just like other companies in different industries comes from the high volume of product absorption in the market and the low cost incurred by companies in
Proceedings of the 11th Annual International Conference on Industrial Engineering and Operations Management Singapore, March 7-11, 2021
© IEOM Society International 4161

their production cycles. Value (P02) becomes significant showing the price or cost incurred by the company becomes the main criteria from an expert perspective that will affect the dimension of Profit Impact. (4) collect the total commodity utility score from the expert's perspective on the offer risk and attribute the
profit impact and take the average of the preference score. (5) calculate the total commodity utility score by multiplying the attribute weight (step 3) by the commodity
performance score (step 4) in a normalization matrix.
Table 3. Normalization Matrix (SC) (PC) (CCD) (SLS) (HDPE) (LDPE) (CT) S01 0.66 0.66 0.33 0.66 0.99 0.99 0.99 S02 0.58 0.29 0.87 0.58 0.58 0.58 0.87 S03 0.63 0.21 0.21 0.21 0.42 0.42 0.63 S04 0.36 0.18 0.18 0.18 0.36 0.36 0.54 P01 1.08 0.54 0.54 0.54 1.62 1.62 1.08 P02 0.90 0.60 0.60 0.60 0.60 0.90 0.90 P03 0.48 0.16 0.16 0.16 0.48 0.48 0.48
(6) Calculate the matrix of commodity euclidean distance using total utility score, which serves as input for multidimensional scale (MDS);
Table 4. Euclidean Commodity Matrix SC PC CCD SLS HDPE LDPE CT
SC 0 0.881 0.941 0.832 0.731 0.667 0.475 PC 0.881 0 0.667 0.290 1.240 1.276 1.111 CCD 0.941 0.667 0 0.439 1.366 1.398 1.107 SLS 0.832 0.290 0.439 0 1.206 1.243 0.991 HDPE 0.731 1.240 1.366 1.206 0 0.300 0.736 LDPE 0.667 1.276 1.398 1.243 0.300 0 0.672 CT 0.475 1.111 1.107 0.991 0.736 0.672 0
Then a multidimensional scale process is carried out to find items in the four quadrants of the Kraljic Portfolio Matrix, where on the (x) axis is the supply risk and the axis (y) is profit Impact.
Figure 1. Mapping of the raw material along the two dimensions
Based on mapping on matric kraljic for raw materials (PC, CCD, SLS) is in non-critical quadrant or material that fall into this category is "Low-Profit Impact, Low Supply Risk" and has a lot of choices in the market both the availability of goods and a large number of suppliers. Thus, the sourcing strategy for this type of material is to focus on reducing transaction costs through product standardization, order volume optimization, efficient processing, and inventory optimization (Hesping et al, 2016).
SC
PC
CCD
SLS
HDPE
LDPE
CT
-0.8
-0.6
-0.4
-0.2
0
0.2
0.4
0.6
0.8
-1 -0.8 -0.6 -0.4 -0.2 0 0.2 0.4 0.6 0.8 1Dim
2
Dim1
Proceedings of the 11th Annual International Conference on Industrial Engineering and Operations Management Singapore, March 7-11, 2021
© IEOM Society International 4162

Figure 2. Mapping of the raw material in Kraljic Portfolio Matrik
For raw materials (SC, HDPE, LDPE, and CT) that fall into this category is characteristic: "High-Profit Impact, High Supply Risk".The results of a study by Montgomery et al (2017) describe how practitioners have used Kraljic matrices to encourage deeper market penetration, as well as seek to move items from strategic status to leverage status, and to set them as targets of sourcing process improvement. Typical supplier selection for raw materials (SC, HDPE, LDPE, and CT) is to focus on optimizing weighting on criteria that mitigate supply chain risks in the company's production process by the company's procurement strategy and business as well as the quality of raw materials that have become mandatory and guarantee the availability of supply.
4.2 Selection of Strategic Raw Material Suppliers Supplier selection will be strongly influenced by the criteria developed as a determinant of supplier that matches the company's strategy and material position in the company's supply chain as Figure 3. Multi-Attribute Utility Theory (MAUT) used for supplier selection under this method scheme that uses quantitative comparisons that combine different risk and profit costs. In the MAUT method there is an evaluation process of each utility on the aspects that exist to get a decision, and calculated with the formula attached:
n V(x) = ∑ Wj . Xij i=1
Where; V(x) is that the analysis price of an object to i and wi is that the weight that determines the worth of however necessary a component to i is to different components. and n is that the variety of components. In this research calculation for evaluation utility or supplier with MAUT method supported by software "RightChoice" developed by Ventana System UK. Evaluation and verification is carried out to three suppliers of sodium chloride (Pharma grade) who have established cooperation with the company where these three suppliers are global suppliers: supplier (A) is associate industrial salt producer company primarily based in New Zeeland, supplier (B) is associate industrial salt producer company based in Germany, supplier (C) is an industrial salt producer company based in Scandinavian nation. The utility evaluation process for supplier selection for sodium chloride included in strategic items in the company's supply chain is as follows:
Proceedings of the 11th Annual International Conference on Industrial Engineering and Operations Management Singapore, March 7-11, 2021
© IEOM Society International 4163

1) Determination of alternatives and attributes relevant to the aim of the study, within the MAUT methodology the standards and sub-criteria square measure outlined as attributes and sub-attributes, and every attribute can then be duplicated into a value tree attribute (Table 5)
Figure 3. Value Tree Attribute for Raw Material’s supplier selection
2) Assigning weights relative to attributes and sub-attributes, by collecting priority scores for each attribute and sub-attribute from the perspective of experts. Questionnaires and FGDs become a means to collect priority scores from the perspective of experts who are then processed to gain relative weight for each attribute and sub-attribute. 3) In attribute table (Table 5) obtained the following order of priority; Quality & Regulatory Compliance (38.2%), Assurance of supply (34.1%), Procurement Cost (13.8%), Innovation/Technical (5.3%), and Responsiveness & Communication (8.6%).In other words, the attributes of quality and compliance with GMP and FDA/BPOM rules ranked first and this became an absolute requirement for suppliers of medicinal raw materials, then the price side and capability of suppliers to supply in second place, followed by the purchase price of suppliers in third place. 4) Combine attribute weights and evaluation to produce an overall evaluation of each utility By using "RightCoice" in the calculation process, the rank between suppliers is as follows: Supplier (A) with a value of 29.91 in the first rank, followed by Supplier (B) with a value of 29.15 in the third supplier rank (C) with a value of 27.53. 5) Perform sensitivity analysis and make Sensitivity decision analysis done to see input variables that affect the result of supplier selection rating output. The results of the sensitivity of the analysis are shown in images (5) to images (9) of each attribute to each utility (supplier).
Proceedings of the 11th Annual International Conference on Industrial Engineering and Operations Management Singapore, March 7-11, 2021
© IEOM Society International 4164

Table 5. Weight of Attributes and Sub-attributes Attribute Sub-Atribut
Assurance of Supply (AS) 34.1%
Capacity AS01 18.8% Safety/Health/Environmental Risk AS02 15.3% Inventory management AS03 15.3% Financial solvency/business stability AS04 17.8% Delivery performance AS05 19.1% Supply chain management of the material AS06 13.7%
Quality & Regulatory Compliance
(QR)
38.2%
cGMP Compliance & regulatory track record QR01 9.1% Recalls & Complaints QR02 9.1% Change/Deviation Management QR03 8.8% Materials management controls QR04 9.1% Quality Management Systems QR05 9.1% Quality Agreement QR06 9.1% Quality Culture QR07 9.1% Production Facilities & Equipment QR08 9.1% Product Quality Review QR09 9.1% Documentation standard QR10 9.1% QOTIF % (On time in Full) QR11 9.1%
Procurement/Cost (PC) 13.8%
Cost Management (Cost visibility) PC01 34.6% Presence in Low-Cost Countries (Emerging markets) PC02 30.8% Ability to achieve the target price PC03 34.6%
Innovation/Technical
(IT) 5.3%
Technology specialism IT01 9.1% Plant capabilities IT02 9.1% Laboratory capabilities IT03 9.1% Business problems resolving capabilities IT04 9.1% Technical skills/ Staff Qualifications IT05 9.1% Control systems IT06 9.1% Development capability IT07 9.1% Process development expertise IT08 9.1% Project management IT09 9.1% Willingness to innovate IT10 9.1% Intellectual property IT11 9.1%
Responsiveness & Communication
(RC) 8.6%
Rapidity project assessment RC01 14.3% Resource availability RC02 14.3% Flexibility (Attitude) RC03 14.3% Functional contacts definition RC04 14.3% Openness RC05 14.3% Ease of communication (understanding of English) RC06 14.3% Pro-activeness RC07 14.3%
Proceedings of the 11th Annual International Conference on Industrial Engineering and Operations Management Singapore, March 7-11, 2021
© IEOM Society International 4165
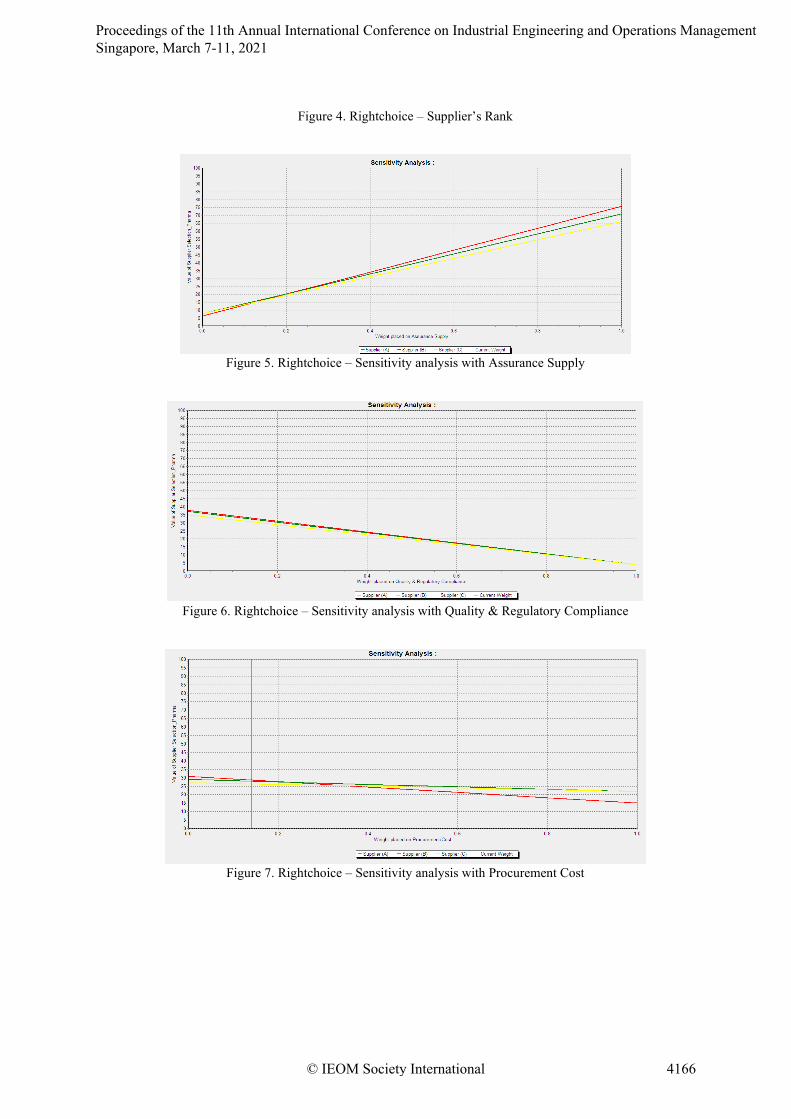
Figure 4. Rightchoice – Supplier’s Rank
Figure 5. Rightchoice – Sensitivity analysis with Assurance Supply
Figure 6. Rightchoice – Sensitivity analysis with Quality & Regulatory Compliance
Figure 7. Rightchoice – Sensitivity analysis with Procurement Cost
Proceedings of the 11th Annual International Conference on Industrial Engineering and Operations Management Singapore, March 7-11, 2021
© IEOM Society International 4166
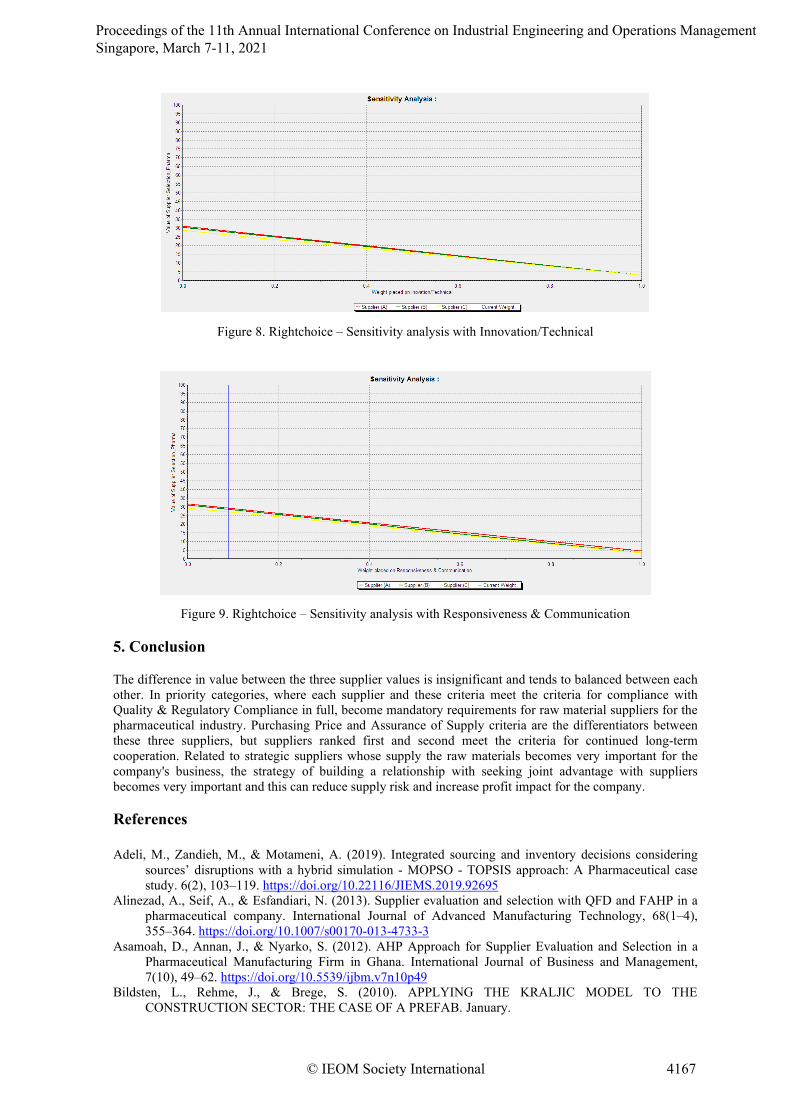
Figure 8. Rightchoice – Sensitivity analysis with Innovation/Technical
Figure 9. Rightchoice – Sensitivity analysis with Responsiveness & Communication
5. Conclusion
The difference in value between the three supplier values is insignificant and tends to balanced between each other. In priority categories, where each supplier and these criteria meet the criteria for compliance with Quality & Regulatory Compliance in full, become mandatory requirements for raw material suppliers for the pharmaceutical industry. Purchasing Price and Assurance of Supply criteria are the differentiators between these three suppliers, but suppliers ranked first and second meet the criteria for continued long-term cooperation. Related to strategic suppliers whose supply the raw materials becomes very important for the company's business, the strategy of building a relationship with seeking joint advantage with suppliers becomes very important and this can reduce supply risk and increase profit impact for the company.
References
Adeli, M., Zandieh, M., & Motameni, A. (2019). Integrated sourcing and inventory decisions considering sources’ disruptions with a hybrid simulation - MOPSO - TOPSIS approach: A Pharmaceutical case study. 6(2), 103–119. https://doi.org/10.22116/JIEMS.2019.92695
Alinezad, A., Seif, A., & Esfandiari, N. (2013). Supplier evaluation and selection with QFD and FAHP in a pharmaceutical company. International Journal of Advanced Manufacturing Technology, 68(1–4), 355–364. https://doi.org/10.1007/s00170-013-4733-3
Asamoah, D., Annan, J., & Nyarko, S. (2012). AHP Approach for Supplier Evaluation and Selection in a Pharmaceutical Manufacturing Firm in Ghana. International Journal of Business and Management, 7(10), 49–62. https://doi.org/10.5539/ijbm.v7n10p49
Bildsten, L., Rehme, J., & Brege, S. (2010). APPLYING THE KRALJIC MODEL TO THE CONSTRUCTION SECTOR: THE CASE OF A PREFAB. January.
Proceedings of the 11th Annual International Conference on Industrial Engineering and Operations Management Singapore, March 7-11, 2021
© IEOM Society International 4167

Enyinda, C. I., Emeka, D., & Bell-Hanyes, J. (2010). A Model for Quantifying Strategic Supplier Selection : Evidence From a Generic Pharmaceutical Firm Supply Chain. International Journal of Business, Marketing, and Decision Sciences, 3(2), 25–44.
Ganguly, A., Kumar, C., & Chatterjee, D. (2019). A Decision-making Model for Supplier Selection in Indian Pharmaceutical Organizations. Journal of Health Management, 21(3), 351–371. https://doi.org/10.1177/0972063419868552
Hesping, F. H., & Schiele, H. (2016). Matching tactical sourcing levers with the Kraljič matrix: Empirical evidence on purchasing portfolios. International Journal of Production Economics, 177, 101–117. https://doi.org/10.1016/j.ijpe.2016.04.011
Khan, A., & Siddiqui, D. A. (2018). Information Sharing and Strategic Supplier Partnership in Supply Chain Management: A Study on Pharmaceutical Companies of Pakistan. Asian Business Review, 8(3), 117–124. https://doi.org/10.18034/abr.v8i3.162
Kirytopoulos, K., Leopoulos, V., & Voulgaridou, D. (2008). Supplier selection in the pharmaceutical industry: An analytic network process approach. Benchmarking, 15(4), 494–516. https://doi.org/10.1108/14635770810887267
Kraljic, P. (n.d.). Purchasing Must Become Supply Management. 83509. Mehralian, G., Gatari, A. R., Morakabati, M., & Vatanpour, H. (2012). Developing a suitable model for
supplier selection based on supply chain risks: An empirical study from Iranian pharmaceutical companies. Iranian Journal of Pharmaceutical Research, 11(1), 209–219. https://doi.org/10.22037/ijpr.2012.1077
Miah, S. J., Ahsan, K., & Msimangira, K. A. B. (2014). An Approach of Purchasing Decision Support in Healthcare Supply Chain Management. Operations and Supply Chain Management: An International Journal, 6(2), 43–53. https://doi.org/10.31387/oscm0140087
Moniz, S., Barbosa-póvoa, A. P., & Sousa, P. De. (2015). On the complexity of production planning and scheduling in the pharmaceutical industry : the Delivery Trade-offs Matrix. In 12th International Symposium on Process Systems Engineering and 25th European Symposium on Computer-Aided Process Engineering (Vol. 37, Issue June). Elsevier. https://doi.org/10.1016/B978-0-444-63576-1.50005-4
Nadar, A. F., & Rani, R. M. (2020). Supplier selection using Fuzzy AHP and Fuzzy Vikor for XYZ Pharmaceutical Manufacturing Company. 7(1), 14–21.
Narenjian, A., Riahi, A., & Kheirabadi, M. A. (2019). Supply Chain Management and Analysis of Pharmaceutical Distribution Models in Pharmaceutical Companies. International Transaction Journal of Engineering Management & Applied Sciences & Technologies, 10(15), 1–15. https://doi.org/10.14456/ITJEMAST.2019.209
Padhi, S. S., Wagner, S. M., & Aggarwal, V. (2012). The positioning of commodities using the Kraljic Portfolio Matrix. Journal of Purchasing and Supply Management, 18(1), 1–8. https://doi.org/10.1016/j.pursup.2011.10.001
Patel, K. T., & Chotai, N. P. (2010). Vendor qualification for pharmaceutical excipients - GMP requirements and approach. Pharmazie, 65(11), 783–790. https://doi.org/10.1691/ph.2010.0146
Reading, F. (2005). Pharmaceutical analysis. 78–89. Yadav, A., Bhandari, G., Ergu, D., Mohsin, A., & Anis, M. (2015). Supplier Selection by AHP in KMC
Pharmaceutical: Use of GMIBM Method for Inconsistency Adjustment. Journal of Management Research, 7(5), 19. https://doi.org/10.5296/jmr.v7i5.8044
Biographies
Yudi Abdillah is a magister industrial engineering student at Mercu Buana University. He is interested in procurement and supply chain management, and actively participates in several professional associations, such as the Indonesian supply chain Institute, the Indonesian Procurement Professional Community, and the Indonesian Logistics Association.
Sawarni Hasibuan is an associate professor in the Industrial Engineering Department at Universitas Mercu Buana Jakarta. Completed his Masters in Industrial Engineering at the Bandung Institute of Technology and obtained a Doctorate in Agro-industrial Technology, Bogor Agricultural University. Doktor Sawarni is a senior researcher in operation management, green and sustainable manufacturing, and supply chain management and has published many publications in the field of industrial engineering.
Proceedings of the 11th Annual International Conference on Industrial Engineering and Operations Management Singapore, March 7-11, 2021
© IEOM Society International 4168