supply and demand for public school teachers in … and demand for public school teachers in...
TRANSCRIPT

Supply and Demand for Public School Teachers in Wisconsin
WCER Working Paper No. 2018-2 January 2018
Peter Goff, Bradley Carl, and Minseok Yang Wisconsin Center for Education Research University of Wisconsin–Madison [email protected] Suggested citation: Goff, P., Carl, B., & Yang, M. (2018). Supply and demand for public school teachers in Wisconsin (WCER Working Paper No. 2018-2). Retrieved from University of Wisconsin–Madison, Wisconsin Center for Education Research website: https://www.wcer.wisc.edu/publications/working-papers © 2018 by Peter Goff, Bradley Carl, and Minseok Yang. All rights reserved. Any opinions, findings, or conclusions expressed in this paper are those of the authors and do not necessarily reflect the views of the funding agencies, WCER, or cooperating institutions. This report reflects data from multiple sources, the collection, cleaning, and analysis of which would not have been possible without the support and contributions of University of Wisconsin–Madison School of Education Dean Diana Hess, Wisconsin Center for Education Research Director Bob Mathieu, Wisconsin Department of Public Instruction Assistant State Superintendent Sheila Briggs, and the entire Wisconsin Association of School Personnel Administrators leadership team. Any mistakes lie solely with the authors. Readers may make verbatim copies of this document for noncommercial purposes by any means, provided the above copyright notice appears on all copies. WCER working papers are available on the Internet at https://wcer.wisc.edu/publications/working-papers
ii
Contents List of Tables ................................................................................................................................. ii
List of Figures ............................................................................................................................... iii
Ask Dr. Goff: Wisconsin Supply and Demand .......................................................................... iv
Executive Summary ...................................................................................................................... v
Supply and Demand for Public School Teachers in Wisconsin ................................................ 1
A Brief History of Wisconsin Educator Labor Dynamics ......................................................... 1
Samples, Methods, and Measures................................................................................................ 4 Measuring Educator Labor Supply in Wisconsin ....................................................................... 5
Findings .......................................................................................................................................... 9 Mobility and Attrition ................................................................................................................. 9 Current Supply of Teachers ...................................................................................................... 15 Educator Preparation Programs ................................................................................................ 19 Emergency Credentials ............................................................................................................. 25 Teacher Diversity and “Diversity Gaps” in Wisconsin ............................................................ 30 Demand for Educators .............................................................................................................. 31 Strategies Wisconsin Districts Use to Hire Educators .............................................................. 36 Perceptions of Scarcity and Applicant Quality Pools ............................................................... 41
Conclusion and Recommendations ........................................................................................... 46 1. What are the prevailing trends in teacher attrition and mobility? ......................................... 46 2. What is the current supply of teachers? ................................................................................ 46 3. How are districts responding to staffing challenges? ........................................................... 47 4. Is there a teacher shortage in Wisconsin? ............................................................................. 47
Appendix A: Teaching Licensure Candidacies by Subject Area ........................................... 50
List of Tables
Table 1. Number of program completers by educator preparation program ................................ 23 Table 2. Most common teacher licensure endorsements by year and subject, all providers ........ 25 Table 3. 2016–17 emergency credentials (teachers only) and total fulltime teacher counts ........ 29 Table 4. Teaching emergency credentials across multiple years .................................................. 29 Table 5. Diversity of students and fulltime teachers in Wisconsin ............................................... 31

iii
List of Figures
Figure 1. Teacher retirement and inter-district mobility ................................................................ 2 Figure 2. Wisconsin educator labor network .................................................................................. 3 Figure 3. Data availability by district for WECAN and staffing survey data ................................ 5 Figure 4. Aggregate view: Weighted average number of applicants per vacancy across
28 positions .................................................................................................................... 7 Figure 5. Two hypothetical patterns of application from five applicants to three vacancies ......... 7 Figure 6. Statewide aggregated view: Average number of applications per vacancy across
28 positions .................................................................................................................... 8 Figure 7. Mobility rates across labor supply categories ............................................................... 11 Figure 8. Nonretirement teacher attrition rates, by labor supply category ................................... 12 Figure 9. Teacher mobility across Wisconsin, by labor supply category ..................................... 13 Figure 10. Teacher attrition (nonretirement) across Wisconsin, by labor supply category ......... 13 Figure 11. Mobility trends of minoritized teachers, by supply category...................................... 14 Figure 12. Nonretirement attrition trends of minoritized teachers, by supply category ............... 15 Figure 13. Wisconsin teacher labor supply: Origins of internal and external applicants ............. 16 Figure 14. Wisconsin teacher labor supply: Origins of novice teachers ...................................... 17 Figure 15. Estimated teacher labor supply, by origin category .................................................... 18 Figure 16. Novices across teacher labor supply categories, by origin subtype ............................ 19 Figure 17. Enrollment, licensure endorsements, and completers of Wisconsin educator
preparation programs ................................................................................................... 21 Figure 18. Selected trends among Wisconsin educator preparation program completers ........... 22 Figure 19. Teaching emergency credentials in Wisconsin public schools, 2012–13 to 2016–17 ...... 26 Figure 20. Teacher emergency credential type ............................................................................. 27 Figure 21. Most common teaching positions for which emergency credentials are used ............ 28 Figure 22. Diversity of fulltime teachers and students in Wisconsin ........................................... 30 Figure 23. How long applicants are on the job market................................................................. 33 Figure 24. Teachers’ duration on the job market for low-supply and high-supply positions ...... 34 Figure 25. Timing for applicants entering the labor market ......................................................... 35 Figure 26. Teaching applications submitted over time ................................................................ 36 Figure 27. Top three strategies, plus targeted recruitment and financial incentives, districts
reported using to staff high-supply vacancies ............................................................. 38 Figure 28. Top three strategies, plus targeted recruitment and financial incentives, that districts
reported using to staff medium-supply vacancies ....................................................... 39 Figure 29. Top three strategies, plus targeted recruitment and financial incentives, that districts
reported using to staff low-supply vacancies .............................................................. 40 Figure 30. Percentage of vacancies in which districts reported they made successful hires, by
labor supply categories ................................................................................................ 41 Figure 31. Perceived quality and quantity of applicant pools across labor supply categories ..... 42 Figure 32. Alignment of number of applications and perceptions of district leaders .................. 43 Figure 33. Characteristics of vacancies when districts report making successful hires, by years
of experience ............................................................................................................... 44 Figure 34. Hiring outcomes as a function of the number of applicants to a given vacancy,
across labor supply categories. .................................................................................... 45

iv
Ask Dr. Goff: Wisconsin Supply and Demand
This report is the first in a series from the Wisconsin Center for Education Research at the University of Wisconsin–Madison. One complaint about many state-level supply and demand reports is their depth of data and dearth of novel information. In keeping with the Wisconsin Idea, we will make these reports as responsive as possible to stakeholders around the state. As such, we anticipate the next report to evolve from this one in response to reader feedback, questions, and suggestions. Thus, we welcome and encourage readers’ thoughts and will do all we can to ensure these are considered when developing future reports.
We also are all too aware that not every interesting question can be fully explored within the context of a single report. Toward that end, we solicit any and all questions that you feel the data we have can address. Inquiries can be sent via the Twitter hashtag #DrGS&D (Dr. Goff Supply & Demand). Readers can use Twitter to share their interpretation of findings in the report, offer alternative explanations, or post labor market questions and strategies that may be of interest to a larger community.
[email protected] @ptgoff

v
Executive Summary
This report presents findings on key features of the Wisconsin teacher labor market, including mobility, attrition, supply, and demand. We use data from multiple sources (including state staffing and credentialing files, application and vacancy information, and statewide survey data on perceptions of staffing challenges) to (a) establish a common vocabulary around categories of labor supply—specifically which positions are high supply, which are medium supply, and which are low supply; (b) provide a baseline against which subsequent reports can build and future policies can be assessed; (c) provide a common base of empirical evidence to focus and foster debate; and (d) identify aspects of the teacher labor market that are problematic.
Key findings • High attrition rates among those in low-supply positions exacerbate staffing challenges. • There are two external applicants (those not currently teaching in a Wisconsin public
school) for every one internal applicant; yet, in the low-supply category, this external-to-internal applicant ratio is closer to 1:1, suggesting that policies that increase the labor supply may be warranted for these positions.
• There is a marked increase in the use of emergency credentialing to bring teachers entering the labor market into classrooms, and there is an increase in the number of individuals who remain on emergency certificates in consecutive years.
• Use of emergency credentialing appears incongruous with policy intent, as district leaders report using this tactic to fill 30% of high-supply vacancies.
• The prime hiring times are early March through mid-May, which therefore is the optimal time for districts to find candidates across all three labor supply categories.
• Opinions as to whether a teacher shortage exists vary with the kind of position being filled. According to district leaders, low-supply positions draw “too few” applicants (seldom more than 10 per vacancy), reinforcing perceptions of a labor shortage. In contrast, drawing fewer than 18 applicants for high-supply positions is considered too small of an applicant pool by district leaders; the perception of a teacher shortage arises with roughly half of the vacancies for these high-supply positions.
• Regardless of the depth of the vacancy pool, district administrators perceive a lack of quality in applicants; they consider 83% of applicants for low-supply positions, 64% of medium-supply applicants, and 50% of high-supply applicants to be of low quality.

Supply and Demand for Public School Teachers in Wisconsin
Peter T. Goff, Bradley Carl, and Minseok Yang
A pervasive challenge for Wisconsin and states across the nation is accurate assessment of teacher labor supplies at the state and local levels. Demand measures based on predictions of changing teacher and student demographics have been wildly inaccurate.1 Supply measures based on how many certificates or licenses a state issues often overstate the labor supply because a sizable proportion of individuals obtain teaching licenses and never enter the labor market.2 At the local level, many Wisconsin districts report they struggle to attract quality applicants.
This report provides evidence on teacher supply and demand in Wisconsin to help policymakers see which avenues are available to influence the complex dynamics of differential mobility, attrition, licensure, and selection across educator labor markets. This portrait of Wisconsin’s teacher labor market illustrates and defines key features to create a common understanding and vocabulary to engage emerging and persistent challenges. We organized this report around the following questions:
1. What are the prevailing trends in teacher attrition and mobility? 2. What is the current supply of teachers? 3. How are districts responding to staffing challenges? 4. Is there a teacher shortage in Wisconsin?
Each of the above questions is multifaceted and will be expanded upon in the following sections. The final question is hyperbolic and intentionally provocative. Addressing this question aligns the experiences and perceptions of educational leaders with application and staffing data to address what may be the most pressing question facing Wisconsin’s teacher labor market.
A Brief History of Wisconsin Educator Labor Dynamics
The Wisconsin Department of Public Instruction (DPI) commissioned a 1998 report on educator staffing trends across the state and produced it annually for the following decade.3 The purpose of these reports was similar to that of the current report: illuminate hiring trends and perceptions about the quantity and quality of Wisconsin’s teacher labor supply. Yet, the data and methods in our report differ substantially from those in the earlier series. Most notably, we used previously unavailable data on vacancies for Wisconsin teaching positions and the people who applied for these positions, along with a much more robust set of survey data measuring districts’ perceptions of the quantity and quality of the teaching labor supply.
1 For an example of a forecasted crisis that never materialized, see Darling-Hammond, L. (1984). Beyond the commission reports. The coming crisis in teaching. The Rand Corporation, Publications Department, 1700 Main Street, PO Box 2138, Santa Monica, CA 90406-2138. 2 Cowan, J., Goldhaber, D., Hayes, K., & Theobald, R. (2016). Missing elements in the discussion of teacher shortages. Educational Researcher, 45(8), 460–462. 3 These 10 reports can be found on DPI’s website: https://dpi.wi.gov/tepdl/programs/supply-demand.
Teacher Supply and Demand
2
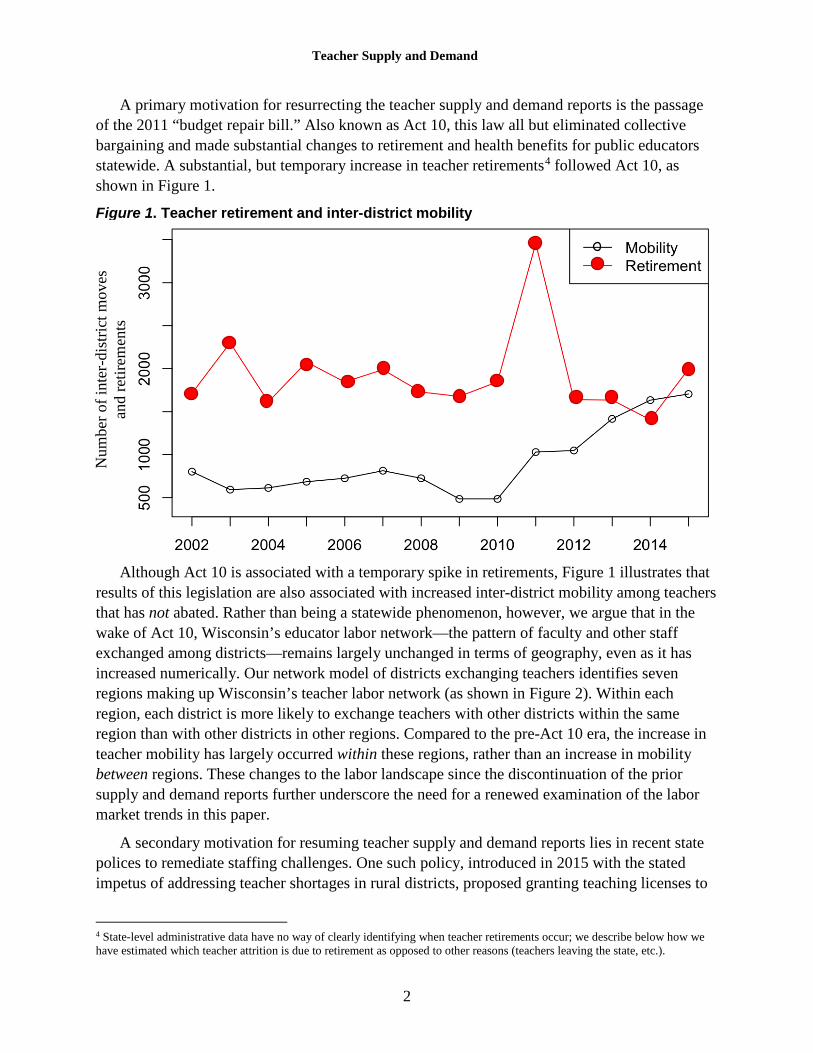
A primary motivation for resurrecting the teacher supply and demand reports is the passage of the 2011 “budget repair bill.” Also known as Act 10, this law all but eliminated collective bargaining and made substantial changes to retirement and health benefits for public educators statewide. A substantial, but temporary increase in teacher retirements4 followed Act 10, as shown in Figure 1.
Figure 1. Teacher retirement and inter-district mobility
Although Act 10 is associated with a temporary spike in retirements, Figure 1 illustrates that
results of this legislation are also associated with increased inter-district mobility among teachers that has not abated. Rather than being a statewide phenomenon, however, we argue that in the wake of Act 10, Wisconsin’s educator labor network—the pattern of faculty and other staff exchanged among districts—remains largely unchanged in terms of geography, even as it has increased numerically. Our network model of districts exchanging teachers identifies seven regions making up Wisconsin’s teacher labor network (as shown in Figure 2). Within each region, each district is more likely to exchange teachers with other districts within the same region than with other districts in other regions. Compared to the pre-Act 10 era, the increase in teacher mobility has largely occurred within these regions, rather than an increase in mobility between regions. These changes to the labor landscape since the discontinuation of the prior supply and demand reports further underscore the need for a renewed examination of the labor market trends in this paper.
A secondary motivation for resuming teacher supply and demand reports lies in recent state polices to remediate staffing challenges. One such policy, introduced in 2015 with the stated impetus of addressing teacher shortages in rural districts, proposed granting teaching licenses to
4 State-level administrative data have no way of clearly identifying when teacher retirements occur; we describe below how we have estimated which teacher attrition is due to retirement as opposed to other reasons (teachers leaving the state, etc.).
Num
ber o
f int
er-d
istri
ct m
oves
an
d re
tirem
ents

Teacher Supply and Demand
3
those who could demonstrate knowledge in noncore subjects, even in cases where the recipient lacked a bachelor’s degree or formal training.5 At the time the legislation was proposed, no evidence supported the claim of systematic staffing challenges in rural locales. Without an examination into the actual teacher labor market—including differences across locales—no one can ascertain if this or related policies were needed, improved labor dynamics, proved to be cost-effective, or had unintended consequences.
Finally, it is our hope and intention that, in addition to spurring discussion and prompting questions to direct policy solutions, this report will serve as a baseline by which to measure the impact of policies around teacher supply and demand in future years.
Figure 2. Wisconsin educator labor network Each panel represents a region identified via network analysis; each dot represents a school district within the region. Each region represents a set of districts most likely to exchange teachers.
5 Beck, M. (2015, June 11). Alternative teaching license measures to be redrawn in state budget. Wisconsin State Journal. Retrieved from http://host.madison.com/news/local/education/local_schools/alternative-teaching-license-measures-to-be-redrawn-in-state-budget/article_2e7cded8-7067-5bb6-8231-717cca7ed6a8.html

Teacher Supply and Demand
4
Samples, Methods, and Measures
The strength of this report lies in the unprecedented combination of labor market datasets. The data used to generate our findings reflect a combination of staffing data, teacher licensure data, application and vacancy data, and survey data.
Staffing data. Annual fall staffing reports are publicly available from DPI and contain school, district, and position assignments for all Wisconsin public school teachers.6
Teacher licensure data. These data are available for all emergency, provisional, and traditional credentials that DPI issues.
Application and vacancy data. These data represent vacancies posted by approximately 350 of Wisconsin’s 424 districts7 during the spring and summer of 2015 on the Wisconsin Educator Career Access Network (WECAN), and the applications associated with each vacancy. WECAN is a job posting and search portal created through a collaboration of Wisconsin school districts through Wisconsin Association of School Personnel Administrators. The University of Wisconsin–Madison’s School of Education manages and maintains the database.8 Teacher applicants in this dataset can be linked to teachers in the staffing and teacher licensure datasets.
Survey data. DPI, in collaboration with the University of Wisconsin–Madison, developed a comprehensive survey on educator staffing. The survey was sent to 414 superintendents in Wisconsin; district leaders completed and returned 322 surveys in spring 2016, a 78% response rate.9
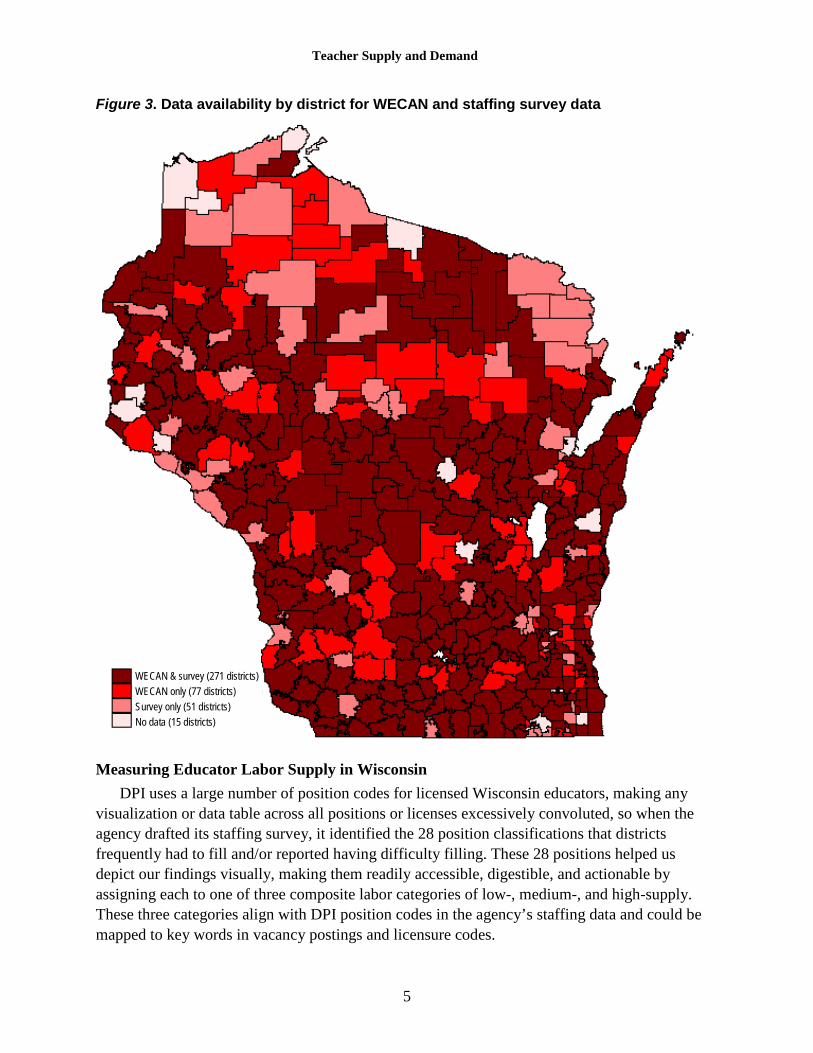
Figure 3 shows the sources of data for each of the surveyed 414 districts. We have survey and/or WECAN data as follows:
• WECAN data plus survey data: available from 271 of Wisconsin’s local districts (65%), • WECAN data but no survey data (77 districts; 19%), • Survey data but no WECAN data (51 districts; 12%), • Neither WECAN nor survey data (15 districts; 4%).
6 See DPI. (2016). Archived school staff: Salary, position, & demographic reports [Webpage]. Retrieved from https://dpi.wi.gov/cst/data-collections/staff/published-data 7 See DPI. (2016, May). Wisconsin public schools at a glance [Brief]. Retrieved from https://dpi.wi.gov/sites/default/files/imce/eis/pdf/schools_at_a_glance.pdf 8 https://wecan.education.wisc.edu 9 By comparison, the last supply and demand report in 2008 had a 62% response rate.
Teacher Supply and Demand
5
Figure 3. Data availability by district for WECAN and staffing survey data
Measuring Educator Labor Supply in Wisconsin DPI uses a large number of position codes for licensed Wisconsin educators, making any
visualization or data table across all positions or licenses excessively convoluted, so when the agency drafted its staffing survey, it identified the 28 position classifications that districts frequently had to fill and/or reported having difficulty filling. These 28 positions helped us depict our findings visually, making them readily accessible, digestible, and actionable by assigning each to one of three composite labor categories of low-, medium-, and high-supply. These three categories align with DPI position codes in the agency’s staffing data and could be mapped to key words in vacancy postings and licensure codes.
WECAN & survey (271 districts) WECAN only (77 districts) Survey only (51 districts) No data (15 districts)

Teacher Supply and Demand
6
One way to determine the supply categories is to calculate the average number of individuals (applicants) applying to each of the 28 vacancy classifications.10 Figure 4 shows a rank-order visualization of the average number of applicants across teaching positions for vacancies posted to WECAN in the 2015–16 school year. Individual applicants have been weighted to reflect their distribution across multiple position vacancies. For example, a teacher may apply to six elementary education positions and four special education positions. This teacher would be weighted as 0.6 in elementary education and 0.4 in special education. In our sample, 65% of applicants applied to two or more different positions (e.g., bilingual education and world languages). We then segmented this weighted, rank-ordered list into thirds to create the labor supply categories of low, medium, and high. Those positions with the lowest supply of teachers, such as bilingual, world languages, and special education (emotional/cross-categorical) are shown in red. Positions with the largest number of applicants per vacancy include social studies, physical education, and elementary/middle school education. These high-supply positions are shown in green. To illustrate, the 210 teaching vacancies for social studies positions in WECAN for 2015–16 had a weighted average of almost five applicants, compared to a weighted average of less than 0.5 applicants for the 14 bilingual education vacancies.
10 The analysis includes some non-teaching positions cited as the focus of staffing challenges such as library/media specialists and social workers. We refer to these inclusively as teaching positions. The number of applicants is not dependent upon certification and represents individuals who are certified, not certified, or pending certification.

Teacher Supply and Demand
7
Figure 4. Aggregate view: Weighted average number of applicants per vacancy across 28 positions
In creating Figure 4’s supply categories, we focused purposefully on the number of applicants rather than the number of applications. Our rationale for this approach is that one applicant can submit many applications but can only accept one position. Thus, the labor supply is better represented by the average number of applicants for a given position than by the total number of applications. This point is illustrated in Figure 5, where we see two distinct sets of labor market behaviors.
Both panels represent a scenario where five applicants are vying for three vacancies. In the
left panel each of the five teachers has applied to all three vacancies. On the right panel, each teacher has applied to only one vacancy. In the approach outlined above and used throughout this report, we used the ratio of the applicants (5) to the vacancies (3) to create the supply categories. This approach contrasts to using a ratio of the applications (15) to the vacancies (3), leading to a second way to determine the supply categories.
Vacancies (schools)
Applications
Applicants (teachers)
Figure 5. Two hypothetical patterns of application from five applicants to three vacancies
Low supply
Medium supply
High supply

Teacher Supply and Demand
8
Why this distinction of defining teacher supply in terms of applicants per vacancy rather than applications per vacancy? We argue that it matters because any given district leader sees the market from her or his own perspective only. A principal estimating labor supply from the school’s vantage point in the first scenario (left panel) would be apt to over-estimate labor supply, because each principal in this scenario sees five applicants to its vacancy. Assuming that some schools are more desirable to teachers than others, however, not all five schools can equally choose from that pool. A more accurate representation of the labor supply is not five potential candidates for each vacancy (15 applications/3 vacancies), as seen from the perspective of any given school, but rather 1.7 (5 applicants/3 vacancies), as seen from the aggregate perspective of the entire market. This second supply and demand method calculates the average number of applications submitted for each of the 28 most common vacancies, and thus expands perspectives beyond any one district to give a statewide perspective and improve understanding of the labor context as a whole. To illustrate how these measures may differ in practice, Figure 6 shows a calculation of demand categories using the applications per vacancy method.
Figure 6. Statewide aggregated view: Average number of applications per vacancy across 28 positions
Comparing Figure 4 to Figure 6 shows how teacher supply conversations based on school or
district applications (Figure 4, applicants per vacancy) may differ from conversations based on a broader measure of aggregate supply (Figure 6, applications per vacancy). We see many similarities—social studies and elementary education positions would, for example, be readily
Low supply
Medium supply
High supply

Teacher Supply and Demand
9
classified as high-supply using a ranking of applicants/vacancy or applications/vacancy. Yet the picture changes when we consider low-supply positions, which are the target of state-level and district-level teacher staffing policies to fill vacancies. Here, special education (emotional-behavioral and cross-categorical), world languages, and business should all be classified as low supply from a local district (applicants per vacancy, Figure 4) perspective, but would likely be considered medium supply from the statewide aggregate perspective (applications per vacancy, Figure 6). These differences arise, as we have shown, because not all teachers approach the market in the same manner. School psychologists, business teachers, and music teachers, for example, tend to be highly selective when applying for positions, each submitting fewer than five applications as they search for positions. In contrast, teachers seeking early childhood and elementary/middle school positions sent out, on average, 10 or more applications. In the remainder of this report, unless otherwise noted, we will use the distribution of the 28 positions into the three labor supply categories shown in Figure 4 (low/medium/high, as defined by applicants per position) to further explore trends in mobility, attrition, supply, and demand.
Findings
This section discusses our findings related to teacher mobility and attrition, correct supply of teachers, and diversity, as well as meeting district demand for teachers through educator preparation programs, the use of emergency credentials, and hiring strategies. We also discuss how district leaders perceive the quality and quantity of applicants.
Mobility and Attrition In this section we examine patterns in mobility and nonretirement attrition across position
type, locale, and ethnicity. Mobility and attrition merit further examination in a discussion of teacher labor markets, as both are indicators of workforce health and overall labor market activity. In one sense (i.e., from the standpoint of a school district), inter-district mobility (teachers leaving one Wisconsin district for another) and attrition (teachers leaving the profession altogether, whether for retirement or for a different nonteaching job) are fairly interchangeable—in both scenarios, the district faces a loss of human capital that needs to be replaced. However, from the standpoint of the overall state teaching labor market, mobility and nonretirement attrition are vastly different measures. From a statewide perspective, a moderate amount of mobility may actually be advantageous, such as when mobility results in teachers finding schools in which they are a better fit and are subsequently more productive, as research from Kirabo Jackson at Northwestern University suggests.11 Research on the fit-productivity boost is slim, however, and we lack a benchmark to identify the amount of mobility that would correspond to optimal productivity gains via enhanced teacher-school fit.
Teacher attrition represents a loss of human capital from the system and is potentially problematic. This may be particularly true depending on which teachers are exiting. Li Feng and
11 See this video interview for an overview of Dr. Jackson’s research: http://cprehub.org/content/cool-thinking-hot-topics-educator-labor-markets?video_id=68

Teacher Supply and Demand
10
Tim Sass12 examined trends in Florida’s teacher attrition and have found that attrition is highest among the most and least effective teachers. Focusing on the quality of leaving teachers, differential attrition is essential to any labor market study. However, the data currently available in Wisconsin prevent any such analysis and, as a result, we are unable to determine if the teachers leaving the profession are among our best as opposed to those who are less effective, or—as Feng and Sass found in Florida—a mix of the two.
Mobility can be measured in multiple ways. Given the policy focus of this report, we used DPI staff data to construct a measure of mobility centered on the district, rather than the school or the individual. In the maps and graphs that follow, we use a measure of teacher mobility defined as:
𝑀𝑀𝑀𝑀𝑀𝑀𝑀𝑀𝑀𝑀𝑀𝑀𝑀𝑀𝑀𝑀 =# 𝑀𝑀𝑜𝑜 𝑀𝑀𝑡𝑡𝑡𝑡𝑡𝑡ℎ𝑡𝑡𝑒𝑒𝑒𝑒 𝑜𝑜𝑒𝑒𝑀𝑀𝑓𝑓 𝑀𝑀ℎ𝑡𝑡 𝑑𝑑𝑀𝑀𝑒𝑒𝑀𝑀𝑒𝑒𝑀𝑀𝑡𝑡𝑀𝑀 𝑀𝑀𝑖𝑖 2014– 15 𝑜𝑜𝑀𝑀𝑓𝑓𝑖𝑖𝑑𝑑 𝑀𝑀𝑖𝑖 𝑡𝑡 𝑑𝑑𝑀𝑀𝑜𝑜𝑜𝑜𝑡𝑡𝑒𝑒𝑡𝑡𝑖𝑖𝑀𝑀 𝑑𝑑𝑀𝑀𝑒𝑒𝑀𝑀𝑒𝑒𝑀𝑀𝑡𝑡𝑀𝑀 𝑀𝑀𝑖𝑖 2015– 16
𝑀𝑀𝑀𝑀𝑀𝑀𝑡𝑡𝑀𝑀 # 𝑀𝑀𝑜𝑜 𝑀𝑀𝑡𝑡𝑡𝑡𝑡𝑡ℎ𝑡𝑡𝑒𝑒𝑒𝑒 𝑀𝑀𝑖𝑖 𝑀𝑀ℎ𝑡𝑡 𝑑𝑑𝑀𝑀𝑒𝑒𝑀𝑀𝑒𝑒𝑀𝑀𝑡𝑡𝑀𝑀 𝑀𝑀𝑖𝑖 2014– 15
When we calculated mobility rates by supply category, the numerator contained the number of teachers in that supply category who moved to another district and the denominator contained the total number of teachers in the given district in that supply category in the prior year.
It is useful to differentiate between teachers who retire as opposed to those who leave positions in Wisconsin public schools prior to traditional retirement age. While state datasets do not track reasons for departure, we can generally identify instances of retirement using teacher age and years of experience. To distinguish retirement attrition from nonretirement attrition, we used the criteria of a teacher who is younger than 59,13 has fewer than 25 years of total teaching experience, and left the Wisconsin system (is no longer in the DPI staffing database) to define nonretirement attrition.
Because Wisconsin administrative data contain teacher salary information, we can see how compensation levels change with mobility (although not necessarily in a causal way). This consideration is important in post-Act 10 Wisconsin due to what has been described as “teacher free agency,” wherein some districts (particularly those with more resources and located in close proximity to one another, such as the Milwaukee suburbs) aggressively recruit certain types of teachers with signing bonuses and other incentives. In our look at this phenomenon, Wisconsin teachers who stayed in the same school or moved across schools within the same district, median salary changes were fairly close to the rate of inflation (2.1%–2.3%). However, for those teachers who changed districts, salary increases were substantially greater (9%–11%). While these within-district salary increases were greater among teachers in low-supply positions than among those in high-supply positions, they were small compared to salary increases gained upon changing districts. Thus, teacher labor dynamics in Wisconsin appear to pay the greatest rewards to those who move between districts rather than rewarding those who stay within districts.
12 A summary of this research and a link to the formal research paper can be found here: https://www.brookings.edu/blog/brown-center-chalkboard/2017/06/01/stemming-the-tide-are-public-school-districts-keeping-the-best-and-brightest-teachers/ 13 The early retirement age in Wisconsin is 55.

Teacher Supply and Demand
11
Figure 7 shows the mobility patterns of the 1,903 teachers who moved across districts in each of the three labor supply categories from 2014–15 to 2015–16. Teachers in low-supply positions have the highest rates of mobility (5%) and teachers in high-supply positions have the lowest levels of mobility (3%). These mobility patterns are predictable given that the market is far more competitive among high-supply positions. These figures are largely consistent with other states that have many small districts.14
Figure 7. Mobility rates across labor supply categories
14 Michigan, for example: http://www.michigan.gov/documents/mde/Teacher_Mobility_Brief_Final_2017.09.18_v2_ada_601772_7.pdf; mobility estimates here are slightly higher as the Michigan analysis focuses on school to school mobility rather than inter-district mobility.

Teacher Supply and Demand
12
Figure 8 shows that 3,176 teachers left their jobs after 2014–15 for reasons that do not appear to be retirement. As with mobility (Figure 7), nonretirement attrition rates are substantially higher among low-supply positions compared to medium and high supply. The comparatively high attrition rates among teachers in low-supply positions underscores labor market concerns and staffing challenges. Nonetheless, Wisconsin has average to low levels of nonretirement attrition, as compared to the national share, which hovers close to 8%.15
Figure 8. Nonretirement teacher attrition rates, by labor supply category
15 See National Center on Education Statistics. (2015) Teacher attrition and mobility: Results From the 2012–13 teacher follow-up survey. Retrieved from https://nces.ed.gov/pubs2014/2014077.pdf

Teacher Supply and Demand
13
To provide greater context to the mobility and attrition findings, Figures 9 and 10 present cartographic depictions of mobility and attrition for Wisconsin’s public school districts. In each map, mobility and attrition were determined relative to the number of teachers in any given district, then these mobility and attrition rates were divided into thirds (high, medium, and low). In some cases, a district may have had a high attrition rate even when only one teacher exited, as would be the case if a district lost one of only two teachers in low-supply vacancies.
Figure 9. Teacher mobility across Wisconsin, by labor supply category
Figure 10. Teacher attrition (nonretirement) across Wisconsin, by labor supply category
Teacher Supply and Demand
14
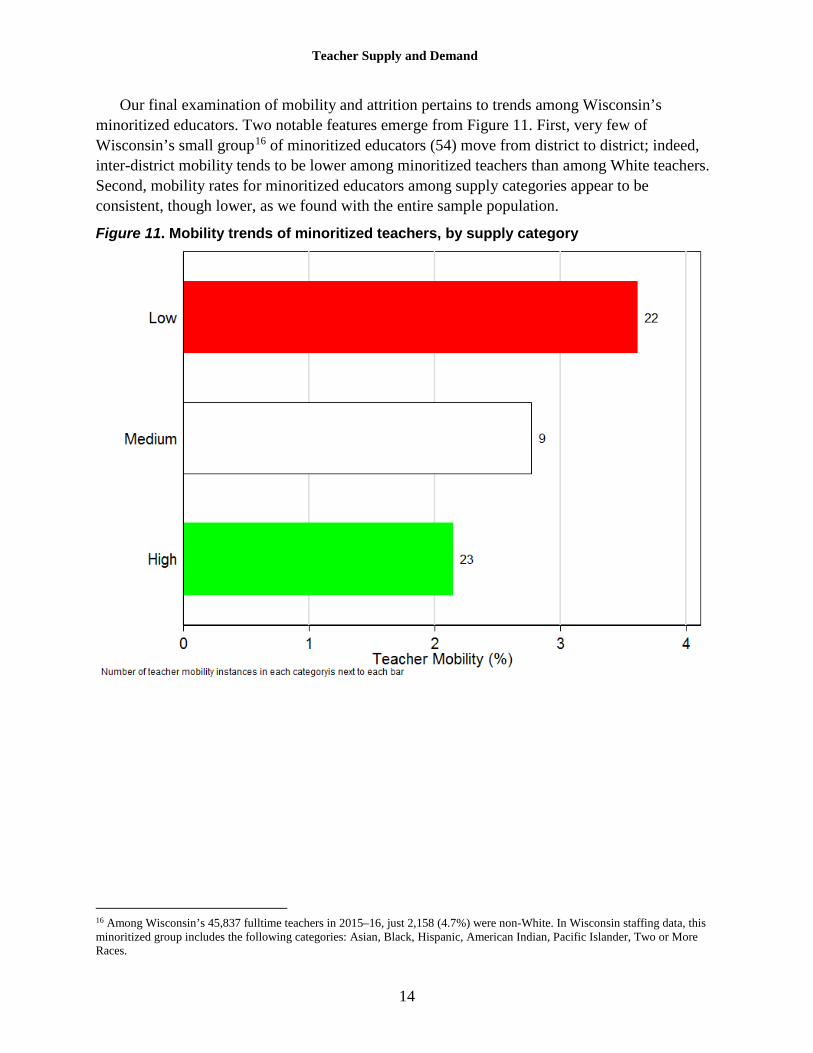
Our final examination of mobility and attrition pertains to trends among Wisconsin’s minoritized educators. Two notable features emerge from Figure 11. First, very few of Wisconsin’s small group16 of minoritized educators (54) move from district to district; indeed, inter-district mobility tends to be lower among minoritized teachers than among White teachers. Second, mobility rates for minoritized educators among supply categories appear to be consistent, though lower, as we found with the entire sample population.
Figure 11. Mobility trends of minoritized teachers, by supply category
16 Among Wisconsin’s 45,837 fulltime teachers in 2015–16, just 2,158 (4.7%) were non-White. In Wisconsin staffing data, this minoritized group includes the following categories: Asian, Black, Hispanic, American Indian, Pacific Islander, Two or More Races.

Teacher Supply and Demand
15
As for nonretirement attrition trends among minoritized educators, Figure 12 shows high attrition rates across all supply categories, especially the more than 25% in low-supply positions. These numbers are substantially higher than the nonretirement attrition rate of 8.5% for all state teachers in the low-supply category (shown previously in Figure 8), and has clear implications for recent efforts at the state and district level to diversify the state’s teaching force (see discussion below).
Figure 12. Nonretirement attrition trends of minoritized teachers, by supply category
Current Supply of Teachers
To understand the teacher labor market, we need a clear picture of its supply. Quantifying the number of applicants across vacancies is a useful start. Yet, the raw number of applicants could be misleading. If, for example, the majority of applicants to a given position were current teachers in Wisconsin, the teacher who was hired would leave behind another state vacancy to be filled. If, by contrast, a position was filled by a candidate who was not currently teaching in a Wisconsin public school (whether a recent college graduate, a private school teacher, an educator from out of state, or someone entering teaching from another profession), the state teacher labor market overall would not incur another vacancy. Thus, as we examined the teacher labor market, we distinguished between internal applicants (those teaching in Wisconsin public schools) and external applicants (those not working as public school educators in Wisconsin). Note that we have used the terms internal and external to refer to the position of the applicant relative to the

Teacher Supply and Demand
16
statewide system, and do not convey that an internal candidate is from within the district and an external candidate is applying from outside the district.
Using WECAN application and vacancy data, we divided external applicants into four origin categories to develop a more comprehensive understanding of the teacher pipeline:
1. Novice applicants are those without teaching experience in recent Wisconsin administrative data (typically, these are recent graduates of educator preparation programs).
2. Prior Public encompasses teachers who worked for a Wisconsin public school within the previous 5 years and are re-entering the state’s labor market.
3. Private indicates educators who taught at a Wisconsin private school in the prior year. 4. Out of State comprises experienced applicants (public or private) from outside
Wisconsin.
Figure 13 summarizes this framework of applicant supply origin. The boxes represent hiring districts and other organizations, and the circles represent the origin types of applicants seeking positions for the 2014–15 school year. Taking this perspective, we see the overall teacher labor supply in Wisconsin is split roughly into thirds, with the single largest group (37% of applicants) being internal candidates (who are already teaching in a different Wisconsin public school). Novice applicants make up 32% of the applicant pool. The final third comprises experienced external applicants. Of this group, 14% were onetime Wisconsin public school teachers, 5% were from private Wisconsin schools, and 9% were teachers from out of state.
Figure 13. Wisconsin teacher labor supply: Origins of internal and external applicants
Note: Percentages do not add to 100 due to a small number of instances where the categories are not mutually exclusive.
Given the seminal role of novice teachers in the teacher pipeline, we also disaggregated this group of aspiring educators using WECAN data to determine the extent to which Wisconsin attracts applications from within Wisconsin compared to other states. We classified novice teachers into four origin subtypes:
External Applicants
Vacancy
Applicant
Application
District
Prior Public
Teacher Supply and Demand
17
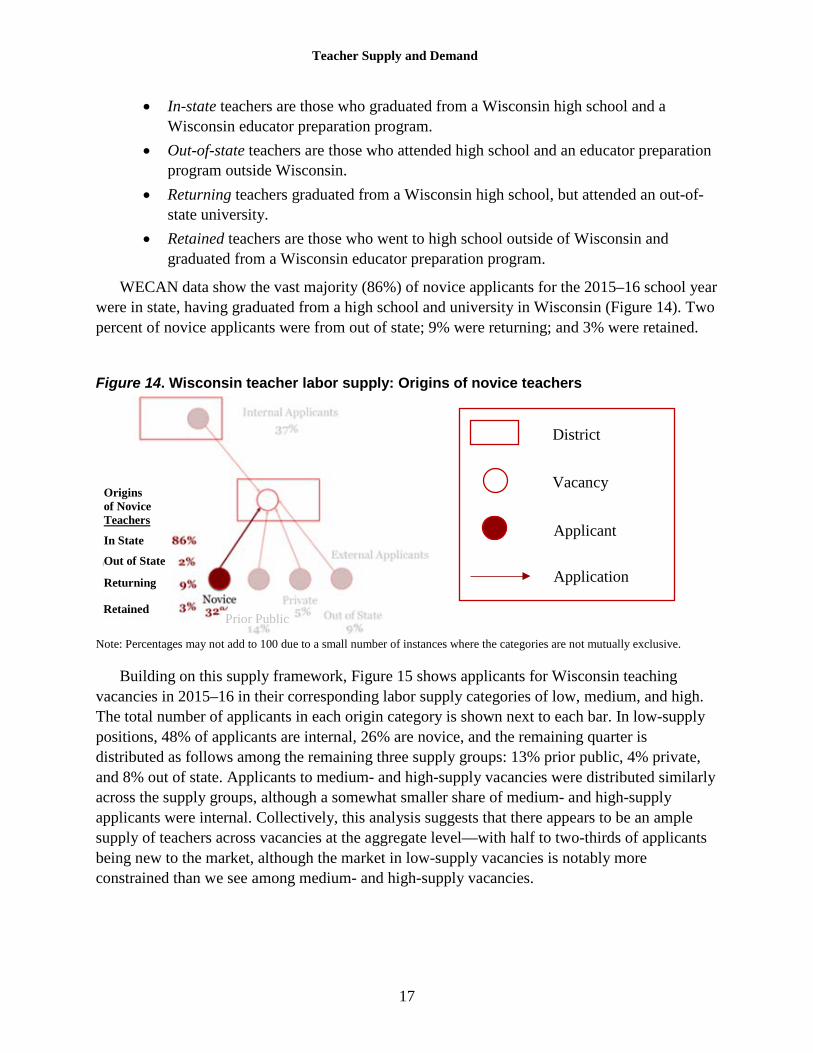
• In-state teachers are those who graduated from a Wisconsin high school and a Wisconsin educator preparation program.
• Out-of-state teachers are those who attended high school and an educator preparation program outside Wisconsin.
• Returning teachers graduated from a Wisconsin high school, but attended an out-of-state university.
• Retained teachers are those who went to high school outside of Wisconsin and graduated from a Wisconsin educator preparation program.
WECAN data show the vast majority (86%) of novice applicants for the 2015–16 school year were in state, having graduated from a high school and university in Wisconsin (Figure 14). Two percent of novice applicants were from out of state; 9% were returning; and 3% were retained.
Figure 14. Wisconsin teacher labor supply: Origins of novice teachers
Note: Percentages may not add to 100 due to a small number of instances where the categories are not mutually exclusive.
Building on this supply framework, Figure 15 shows applicants for Wisconsin teaching vacancies in 2015–16 in their corresponding labor supply categories of low, medium, and high. The total number of applicants in each origin category is shown next to each bar. In low-supply positions, 48% of applicants are internal, 26% are novice, and the remaining quarter is distributed as follows among the remaining three supply groups: 13% prior public, 4% private, and 8% out of state. Applicants to medium- and high-supply vacancies were distributed similarly across the supply groups, although a somewhat smaller share of medium- and high-supply applicants were internal. Collectively, this analysis suggests that there appears to be an ample supply of teachers across vacancies at the aggregate level—with half to two-thirds of applicants being new to the market, although the market in low-supply vacancies is notably more constrained than we see among medium- and high-supply vacancies.
Vacancy
Applicant
Application
District
Prior Public Retained
Origins of Novice Teachers
In State
Out of State
Returning

Teacher Supply and Demand
18
Figure 15. Estimated teacher labor supply, by origin category Internal refers to applicants currently working as teachers in Wisconsin public schools; novice refers to applicants with no teaching experience. Prior public indicates individuals who worked as teachers in a Wisconsin public school in previous 5 years, but not in prior year. Private refers to teachers working in private schools in Wisconsin. Out of state refers to applicants teaching outside of Wisconsin.
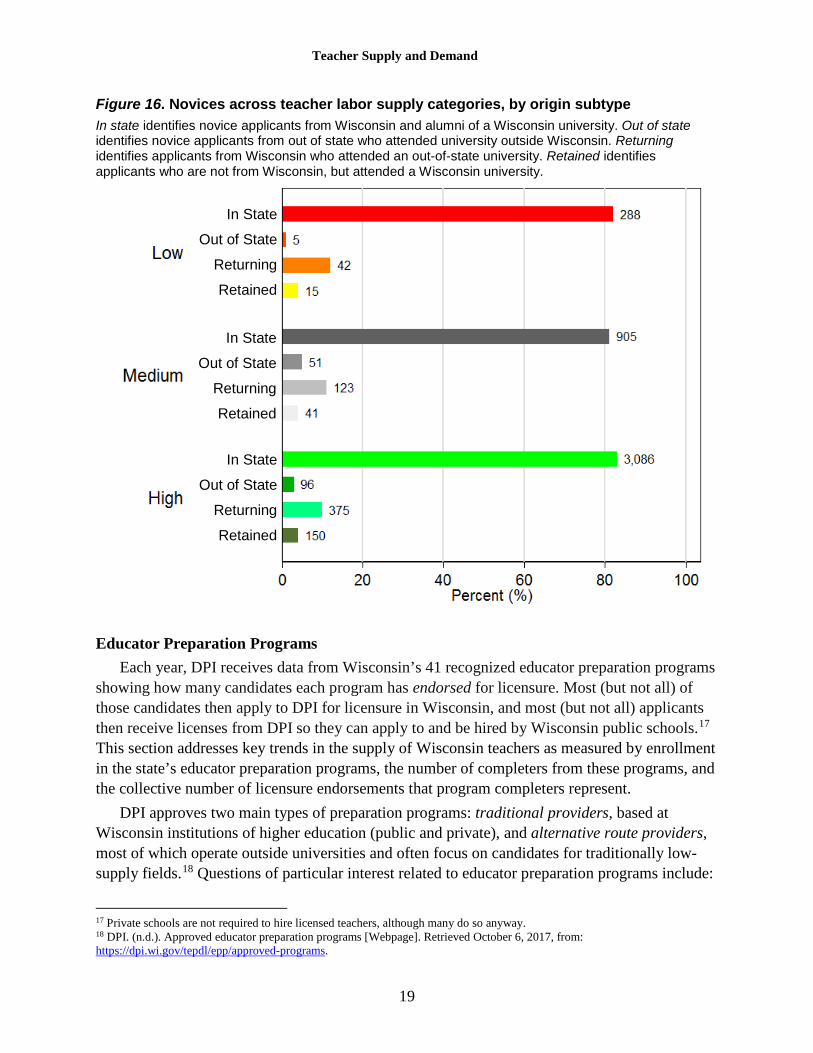
Focusing on novice applicants, Figure 16 shows the proportion of candidates from each origin subtype (in state, out of state, returning, and retained) that applied to low-, medium-, and high-supply teaching vacancies in 2015–16. The distribution is similar across the three supply categories, which suggests that factors beyond labor demand (e.g., wanting to live close to where they grew up) were likely driving the job search behaviors of novice teachers.
Prior Public
Prior Public
Prior Public
Out of State
Out of State
Out of State
Teacher Supply and Demand
19
Figure 16. Novices across teacher labor supply categories, by origin subtype In state identifies novice applicants from Wisconsin and alumni of a Wisconsin university. Out of state identifies novice applicants from out of state who attended university outside Wisconsin. Returning identifies applicants from Wisconsin who attended an out-of-state university. Retained identifies applicants who are not from Wisconsin, but attended a Wisconsin university.
Educator Preparation Programs Each year, DPI receives data from Wisconsin’s 41 recognized educator preparation programs
showing how many candidates each program has endorsed for licensure. Most (but not all) of those candidates then apply to DPI for licensure in Wisconsin, and most (but not all) applicants then receive licenses from DPI so they can apply to and be hired by Wisconsin public schools.17 This section addresses key trends in the supply of Wisconsin teachers as measured by enrollment in the state’s educator preparation programs, the number of completers from these programs, and the collective number of licensure endorsements that program completers represent.
DPI approves two main types of preparation programs: traditional providers, based at Wisconsin institutions of higher education (public and private), and alternative route providers, most of which operate outside universities and often focus on candidates for traditionally low-supply fields.18 Questions of particular interest related to educator preparation programs include:
17 Private schools are not required to hire licensed teachers, although many do so anyway. 18 DPI. (n.d.). Approved educator preparation programs [Webpage]. Retrieved October 6, 2017, from: https://dpi.wi.gov/tepdl/epp/approved-programs.
In State
Out of State
Returning
Retained
In State
Out of State
Returning
Retained
In State
Out of State
Returning
Retained

Teacher Supply and Demand
20
• How many students are enrolled in Wisconsin’s educator preparation programs, and how have they added to the supply of teachers in recent years, both in terms of unduplicated individuals as well as the collective licensure endorsements these individuals represent (because many completers have multiple licensure endorsements)? o How many program completers are novice educators compared to those who are
already teaching in Wisconsin but seeking additional license endorsements)? o Which subject-area licensure endorsements are possessed by the largest numbers of
recent program completers, and how do these licensures compare to areas of high, medium, and low teacher labor supply in Wisconsin public schools?
o Which Wisconsin educator preparation programs produce the most completers and licensure endorsements, and what, if any, are the notable differences between traditional vs. alternative route providers?
• How many people who complete educator preparation programs teach in Wisconsin the following year?
Figure 17 shows three related but distinct measures of teacher supply in Wisconsin, based on Title II data and categories DPI reported to the U.S. Department of Education:19 total enrollment (unduplicated headcounts of enrollees in educator preparation programs), total licensure endorsements produced (containing duplicate individuals because some receive multiple areas of endorsement), and individual program completers (unduplicated). Each shows a decrease in recent years, although specific years of available data and the percentage declines for each indicator differ somewhat. From 2010 to 2016, enrollment in Wisconsin’s educator preparation programs declined 35.4% (from 12,323 to 7,956), and unduplicated program completers decreased by 14.5% (from 4,007 to 3,426). From 2012 to 2016, total licensure endorsements decreased by 17.2% (from 8,815 to 7,301). With these declines beginning in earnest following the enactment of Act 10 in 2011, it is tempting to label this law as the cause of the declines, although trends for similar timeframes show parallel decreases nationally for all three indicators of teacher supply: from 2013 to 2016, total enrollment in educator preparation programs nationwide decreased 33.6%, total licensure endorsements decreased 15.7%, and total program completers decreased 11.5%.
19 U.S. Department of Education (n.d.). 2016 Title II Reports [Webpage]. Retrieved September 18, 2017, from: https://title2.ed.gov/Public/Home.aspx.

Teacher Supply and Demand
21
Figure 17. Enrollment, licensure endorsements, and completers of Wisconsin educator preparation programs
Several characteristics of people who complete educator preparation programs can strengthen understanding of Wisconsin’s supply of teachers. These questions identify the characteristics:
• What percentage of program completers have one area of licensure endorsement as opposed to multiple endorsements?
• What percentage of program completers are novices as opposed to current Wisconsin educators seeking additional areas of licensure?20
• What percentage of program completers remain in Wisconsin to teach in public schools the year following program completion?21
Figure 18 below shows trend data over 4 years for each question. Per DPI teacher licensure data, approximately 50% of program completers from 2012–13 through 2015–16 earned one licensure. Those earning multiple licensure endorsements potentially become more valuable in the teacher labor market than candidates with just one licensure (particularly if one licensure endorsement is in a low-supply field such as several special education specializations or bilingual education). The share of novice educators completing educator preparation programs decreased to 60% in 2015–16; the remaining 40% were already working in Wisconsin schools seeking additional licenses. Nearly two-thirds of recent program completers taught in Wisconsin public schools the year after they acquired their new credentials. DPI cannot track educators
20 We used DPI’s teacher licensure data to differentiate novice educators from current educators. We compared the agency’s file of people who completed Wisconsin educator preparation programs to its file of all public school staff for that same year to determine those already working in Wisconsin public schools. The remainder (i.e., those not matched) is estimated to be novice educators (i.e., first-time program completers). 21 This analysis was similar to the previous footnote (matching program completer files to the All Staff file), only with a 1-year lag (e.g., comparing program completers in Year X to the All Staff file for Year X+1).
12,323 12,62411,780
10,998
9,5618,867
7,9568,815 8,659
8,474
7,903 7,301
4,007 4,128 4,306 4,075 3,965 3,741 3,426
0
2,000
4,000
6,000
8,000
10,000
12,000
14,000
2010 2011 2012 2013 2014 2015 2016
Enrollment Licensures Completers

Teacher Supply and Demand
22
outside Wisconsin public schools. Some of the 40% of program completers are who aren’t teaching in Wisconsin public schools after credentialing are likely teaching in other states, in Wisconsin private schools, or are working in noneducation professions. Wisconsin’s recent expansion of publicly funded private school vouchers is apt to draw more Wisconsin teachers away from public schools. Legislators may want to consider requiring private schools who accept vouchers to submit a roster of their teachers to mitigate this problem, which would improve the state’s ability to measure its teacher labor supply and demand.
Figure 18. Selected trends among Wisconsin educator preparation program completers
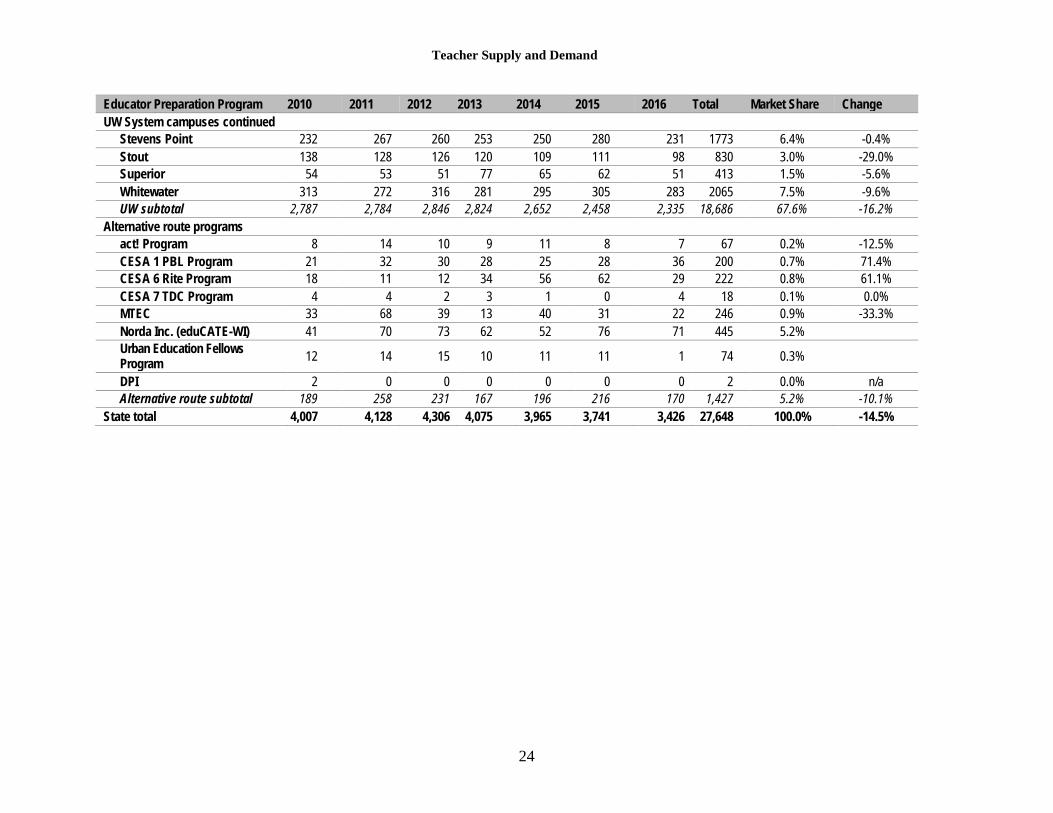
Looking at the “market share” for program completers in Wisconsin, the number of completers for each of Wisconsin’s approved educator preparation programs in recent years is shown in Table 1. Wisconsin has a diversified supply of providers, with no individual program producing more than 10% of all completers for 2010–16. The top six producers are all University of Wisconsin (UW) System campuses; in order of market share, the largest is UW–Milwaukee (9.8%), followed by UW–Madison (8.1%), UW–Eau Claire (7.6%), UW–Whitewater (7.5%), UW–Oshkosh (6.5%), and UW–Stevens Point (6.4%). The 13 UW System campuses produced two-thirds of the multiyear total, whereas the state’s 20 private college programs account for 27.3% of all completers (led by Cardinal Stritch University, with a market share of 4.0%). Wisconsin’s alternative route programs produced 5.2% of all completers. Embedded within the overall 14.5% decline statewide in program completers from 2010 to 2016 are moderate differences by provider type: Private campuses had a 10.7% decrease, UW System campuses saw a 16.2% decrease, and alternative route programs had a 10.1% decrease.
0% 10% 20% 30% 40% 50% 60% 70% 80%
Multiple Licensures
Initial Educators
Teaching in WI Public School Next Year
2015-16 2014-15 2013-14 2012-13
Multiple Licensure Endorsements
Novice Educators
Teaching in a Wisconsin Public School the Next Year
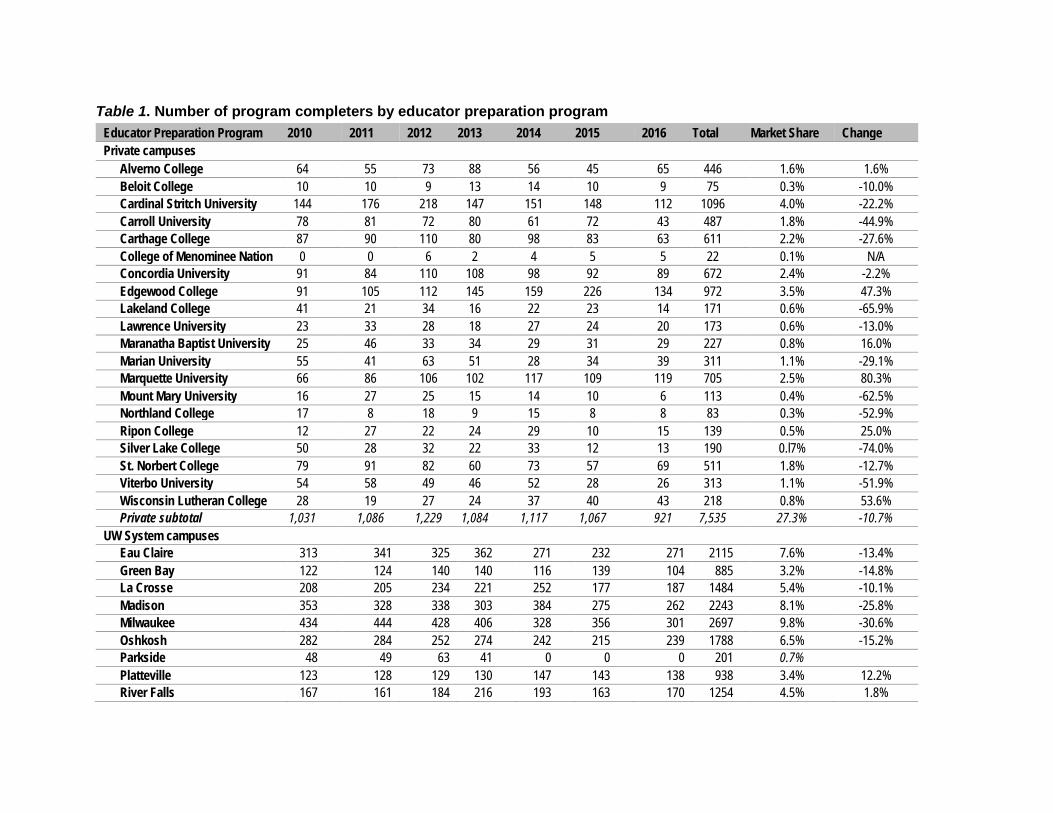
Table 1. Number of program completers by educator preparation program Educator Preparation Program 2010 2011 2012 2013 2014 2015 2016 Total Market Share Change Private campuses
Alverno College 64 55 73 88 56 45 65 446 1.6% 1.6% Beloit College 10 10 9 13 14 10 9 75 0.3% -10.0% Cardinal Stritch University 144 176 218 147 151 148 112 1096 4.0% -22.2% Carroll University 78 81 72 80 61 72 43 487 1.8% -44.9% Carthage College 87 90 110 80 98 83 63 611 2.2% -27.6% College of Menominee Nation 0 0 6 2 4 5 5 22 0.1% N/A Concordia University 91 84 110 108 98 92 89 672 2.4% -2.2% Edgewood College 91 105 112 145 159 226 134 972 3.5% 47.3% Lakeland College 41 21 34 16 22 23 14 171 0.6% -65.9% Lawrence University 23 33 28 18 27 24 20 173 0.6% -13.0% Maranatha Baptist University 25 46 33 34 29 31 29 227 0.8% 16.0% Marian University 55 41 63 51 28 34 39 311 1.1% -29.1% Marquette University 66 86 106 102 117 109 119 705 2.5% 80.3% Mount Mary University 16 27 25 15 14 10 6 113 0.4% -62.5% Northland College 17 8 18 9 15 8 8 83 0.3% -52.9% Ripon College 12 27 22 24 29 10 15 139 0.5% 25.0% Silver Lake College 50 28 32 22 33 12 13 190 0.l7% -74.0% St. Norbert College 79 91 82 60 73 57 69 511 1.8% -12.7% Viterbo University 54 58 49 46 52 28 26 313 1.1% -51.9% Wisconsin Lutheran College 28 19 27 24 37 40 43 218 0.8% 53.6% Private subtotal 1,031 1,086 1,229 1,084 1,117 1,067 921 7,535 27.3% -10.7%
UW System campuses Eau Claire 313 341 325 362 271 232 271 2115 7.6% -13.4% Green Bay 122 124 140 140 116 139 104 885 3.2% -14.8% La Crosse 208 205 234 221 252 177 187 1484 5.4% -10.1% Madison 353 328 338 303 384 275 262 2243 8.1% -25.8% Milwaukee 434 444 428 406 328 356 301 2697 9.8% -30.6% Oshkosh 282 284 252 274 242 215 239 1788 6.5% -15.2% Parkside 48 49 63 41 0 0 0 201 0.7% Platteville 123 128 129 130 147 143 138 938 3.4% 12.2% River Falls 167 161 184 216 193 163 170 1254 4.5% 1.8%
Teacher Supply and Demand
24
Educator Preparation Program 2010 2011 2012 2013 2014 2015 2016 Total Market Share Change UW System campuses continued
Stevens Point 232 267 260 253 250 280 231 1773 6.4% -0.4% Stout 138 128 126 120 109 111 98 830 3.0% -29.0% Superior 54 53 51 77 65 62 51 413 1.5% -5.6% Whitewater 313 272 316 281 295 305 283 2065 7.5% -9.6% UW subtotal 2,787 2,784 2,846 2,824 2,652 2,458 2,335 18,686 67.6% -16.2%
Alternative route programs act! Program 8 14 10 9 11 8 7 67 0.2% -12.5% CESA 1 PBL Program 21 32 30 28 25 28 36 200 0.7% 71.4% CESA 6 Rite Program 18 11 12 34 56 62 29 222 0.8% 61.1% CESA 7 TDC Program 4 4 2 3 1 0 4 18 0.1% 0.0% MTEC 33 68 39 13 40 31 22 246 0.9% -33.3% Norda Inc. (eduCATE-WI) 41 70 73 62 52 76 71 445 5.2% Urban Education Fellows Program 12 14 15 10 11 11 1 74 0.3%
DPI 2 0 0 0 0 0 0 2 0.0% n/a Alternative route subtotal 189 258 231 167 196 216 170 1,427 5.2% -10.1%
State total 4,007 4,128 4,306 4,075 3,965 3,741 3,426 27,648 100.0% -14.5%

Teacher Supply and Demand
25
Table 2 shows which licensure endorsements (based on labels used by the U.S. Department of Education’s Title II data) Wisconsin program completers most frequently acquired for the 2012–13 through 2015–16 school years. A complete listing of licensure endorsements for the 4-year period appears as Appendix A. To correlate these federal credential categories to our 28 positions in Figure 4, the most common licensure endorsements represent a mix of low-supply fields (such as visual or emotional special education) and high-supply fields (such as regular middle and elementary education and social studies/history).
Table 2. Most common teacher licensure endorsements by year and subject, all providers 2012–13 2013–14 2014–15 2015–16 Total
Social studies, broad field 227 175 194 169 765 Cross categorical special education 482 792 699 834 2,807 Emotional disturbance (special education) 114 201 151 253 719 English 265 239 229 208 941 English as a second language 172 230 213 311 926 History 270 214 231 197 912 Mathematics 320 314 302 279 1,215 Reading 129 241 171 238 779 Regular education 1,719 1,656 1,615 1,524 6,514 Special education (general) 127 144 160 173 604
Many of Wisconsin’s alternative route providers have had a strong focus on licensing of teachers in special education; nearly 60% of teacher licensure endorsements from alternative route providers across the 4-year period were in cross categorical special education (776 total endorsements), emotional disturbance (238), and other special education fields combined (331). Other low-supply areas in which endorsement came from alternative route providers include English as a second language (77 endorsements) and bilingual/bicultural (69). While the number of Wisconsin alternative route program completers has been fairly stable during the 4 years (as seen in Table 1), the total number of provider endorsements increased by 357% in the same time period. This finding indicates a large share of alternative route completers receive endorsements for licensure in multiple areas, more so than Wisconsin program completers in general.
Emergency Credentials Emergency credentials represent another form of educator supply. These licenses or permits
are designed to be short term, with districts submitting requests to DPI attesting that (a) no acceptable fully licensed candidates were available, and (b) the emergency-credentialed educator is working toward full licensure. Using emergency credential data collected and reported by DPI, we examine several questions:
• How many educators worked in Wisconsin under emergency credentials in recent years, and in which areas of teaching?
• Which districts utilize emergency credentials most often, both in an absolute sense and as a percentage of a district’s total teaching force?
• How many educators working under emergency credentials do so across multiple years?

Teacher Supply and Demand
26
Wisconsin has two types of emergency credentials: • An emergency license may be issued to an applicant who holds a valid Wisconsin educator
license but is being asked to teach outside of the subject and/or grade level of her/his license; an emergency license is issued for the specific assignment in a specific school year.
• An emergency permit may be issued to an applicant who holds a bachelor’s degree from an accredited college or university but has no teaching certification in any field.
Figure 19 shows the number of teaching emergency credentials Wisconsin public schools used for 2012–13 through 2016–17. The data include the total number of credentials and the unduplicated count of individuals (as with people who complete education preparation programs, the latter is always smaller than the former because some educators teach under multiple emergency credentials at the same time).
Figure 19. Teaching emergency credentials in Wisconsin public schools, 2012–13 to 2016–17
Wisconsin districts’ use of emergency credentials for teaching more than doubled, in terms of both number of credentials and number of individuals, during the past 5 years. The rapid rise in emergency credentials may be caused at least in part by the introduction of new teacher licensing exams in Wisconsin (the Foundations of Reading Test and edTPA), which were introduced in 2014 and are required as part of the licensing process. While state-level pass rates on the new exams are not yet publicly available for Wisconsin (overall or by teacher subgroup), other reports have documented that pass rates for the new exams nationwide are lower than for previous licensure exams such as the Praxis, and in particular are lower for some subgroups of teaching candidates (such as those seeking to teach in rural settings and African American candidates) than for others.22 As noted below, we recommend further inquiry and discussion into
22 See, for example, Stanford University. (2014). By the numbers: Educative assessment & meaningful support: 2014 edPTA Annual Administrative Report [Brief]. Retrieved from https://scale.stanford.edu/sites/default/files/edTPA%20By%20the%20Numbers%20929%20Final.pdf
988 928
17051947
2435
943 869
15941793
2037
0
500
1000
1500
2000
2500
3000
2012-13 2013-14 2014-15 2015-16 2016-17
School Year
Teaching Emergency Credentials (total)
Teaching Emergency Credentials (unduplicated)
Teacher Supply and Demand
27
the role that new licensure exams play in terms of the delicate balance between improving teacher quality (the intended goal) and possibly exacerbating teacher supply and diversity issues (both unintended consequences).
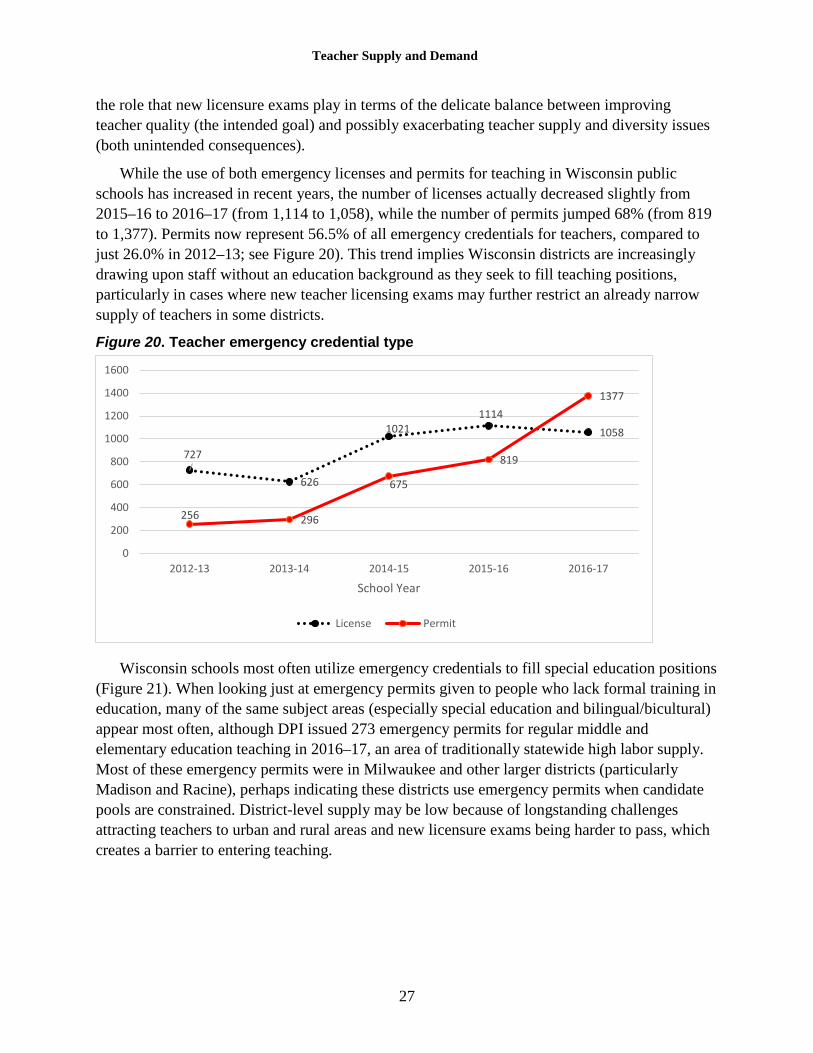
While the use of both emergency licenses and permits for teaching in Wisconsin public schools has increased in recent years, the number of licenses actually decreased slightly from 2015–16 to 2016–17 (from 1,114 to 1,058), while the number of permits jumped 68% (from 819 to 1,377). Permits now represent 56.5% of all emergency credentials for teachers, compared to just 26.0% in 2012–13; see Figure 20). This trend implies Wisconsin districts are increasingly drawing upon staff without an education background as they seek to fill teaching positions, particularly in cases where new teacher licensing exams may further restrict an already narrow supply of teachers in some districts.
Figure 20. Teacher emergency credential type
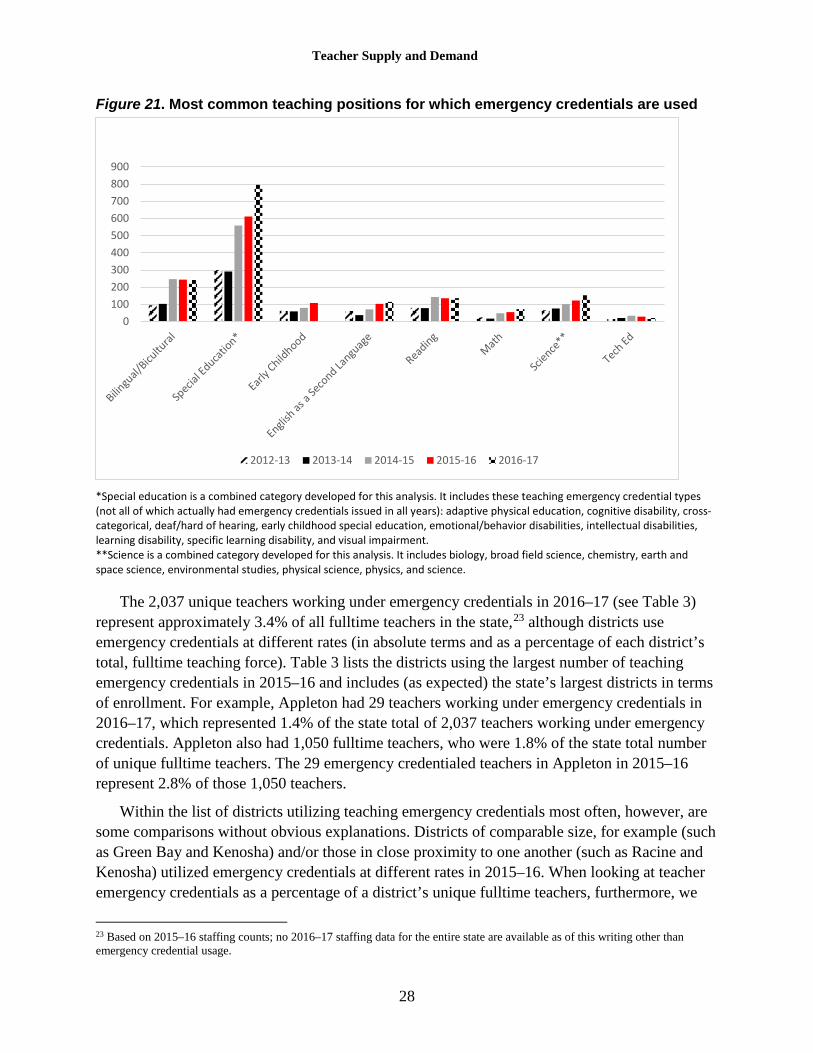
Wisconsin schools most often utilize emergency credentials to fill special education positions (Figure 21). When looking just at emergency permits given to people who lack formal training in education, many of the same subject areas (especially special education and bilingual/bicultural) appear most often, although DPI issued 273 emergency permits for regular middle and elementary education teaching in 2016–17, an area of traditionally statewide high labor supply. Most of these emergency permits were in Milwaukee and other larger districts (particularly Madison and Racine), perhaps indicating these districts use emergency permits when candidate pools are constrained. District-level supply may be low because of longstanding challenges attracting teachers to urban and rural areas and new licensure exams being harder to pass, which creates a barrier to entering teaching.
727
626
10211114
1058
256 296
675
819
1377
0
200
400
600
800
1000
1200
1400
1600
2012-13 2013-14 2014-15 2015-16 2016-17
School Year
License Permit
Teacher Supply and Demand
28
Figure 21. Most common teaching positions for which emergency credentials are used
*Special education is a combined category developed for this analysis. It includes these teaching emergency credential types (not all of which actually had emergency credentials issued in all years): adaptive physical education, cognitive disability, cross-categorical, deaf/hard of hearing, early childhood special education, emotional/behavior disabilities, intellectual disabilities, learning disability, specific learning disability, and visual impairment. **Science is a combined category developed for this analysis. It includes biology, broad field science, chemistry, earth and space science, environmental studies, physical science, physics, and science.
The 2,037 unique teachers working under emergency credentials in 2016–17 (see Table 3) represent approximately 3.4% of all fulltime teachers in the state,23 although districts use emergency credentials at different rates (in absolute terms and as a percentage of each district’s total, fulltime teaching force). Table 3 lists the districts using the largest number of teaching emergency credentials in 2015–16 and includes (as expected) the state’s largest districts in terms of enrollment. For example, Appleton had 29 teachers working under emergency credentials in 2016–17, which represented 1.4% of the state total of 2,037 teachers working under emergency credentials. Appleton also had 1,050 fulltime teachers, who were 1.8% of the state total number of unique fulltime teachers. The 29 emergency credentialed teachers in Appleton in 2015–16 represent 2.8% of those 1,050 teachers.
Within the list of districts utilizing teaching emergency credentials most often, however, are some comparisons without obvious explanations. Districts of comparable size, for example (such as Green Bay and Kenosha) and/or those in close proximity to one another (such as Racine and Kenosha) utilized emergency credentials at different rates in 2015–16. When looking at teacher emergency credentials as a percentage of a district’s unique fulltime teachers, furthermore, we
23 Based on 2015–16 staffing counts; no 2016–17 staffing data for the entire state are available as of this writing other than emergency credential usage.
0100200300400500600700800900
2012-13 2013-14 2014-15 2015-16 2016-17

Teacher Supply and Demand
29
see substantial differences across districts. For example, Milwaukee’s 354 teachers working under emergency credentials in 2016–17 represented 12.6% of the district’s total number of fulltime teachers, while Kenosha’s 38 teachers working under emergency credentials represented just 2.9% of fulltime teachers.
Table 3. 2016–17 emergency credentials (teachers only) and total fulltime teacher counts
2016–17
Student Enrollment
2016–17 Number of Teachers with
Emergency Credentials
2016–17 District Share of State Total
of Teacher Emergency Credentials
2015–16 Number of Unique
Fulltime Teachers
2015–16 District Share of State Total
of Unique Fulltime Teachers
2016–17 Teacher Emergency
Credentials as % of Unique Fulltime Teachers 2015–16
Appleton 16,366 29 1.4% 749 1.6% 3.9% Beloit 6,943 39 1.9% 388 0.8% 10.1% Green Bay 21,149 62 3.0% 1,222 2.7% 5.1% Kenosha 21,825 38 1.8% 1,326 2.9% 2.9% Madison 26,999 164 8.1% 1,660 3.6% 9.9% Milwaukee 76,207 354 17.4% 2,816 6.1% 12.6% Racine 19,109 107 5.3% 1,283 2.8% 8.3% Tomah 2,919 19 0.9% 192 0.4% 9.9% Wausau 8,405 51 2.5% 501 1.1% 10.2% State total 863,881 2,037 100.0% 45,833 100.0% 4.4%
Emergency licenses and permits are intended to be used for 1 year only, and data from 2012–13 through 2014–15 indicate Wisconsin districts were in most cases utilizing emergency credentials in this manner. Starting in 2014–15, however, there was a substantial increase in the number of emergency credential holders who remained working into a second consecutive year under emergency credentials. Table 4 shows that of the 1,594 individual teachers working under emergency credentials in 2014–15, nearly one-third (543) were still working under emergency credentials in 2015–16. The following year, the “carryover” was even greater: of the 1,793 unique teachers working under emergency credentials in 2015–16, 769 (42.9%) were also teaching under this same status in 2016–17. This dramatic rise in emergency credentials across multiple years is likely related, at least in part, to the new teacher licensing exams. More in-depth inquiry is needed in order to fully understand this issue.
Table 4. Teaching emergency credentials across multiple years
Academic Year Number of Emergency Teaching
Credentials 2013–14 2014–15 2015–16 2016–17
2012–13 943 84 (8.9%) 86 (9.1%) 68 (7.2%) 68 (7.2%) 2013–14 869 53 (6.1%) 43 (4.9%) 40 (4.6%) 2014–15 1,594 543 (30.9%) 317 (18.1%) 2015–16 1,793 769 (42.9%)

Teacher Supply and Demand
30
Teacher Diversity and “Diversity Gaps” in Wisconsin In looking at trends in teacher supply, it is also useful to examine data regarding the diversity
of Wisconsin teachers, particularly as districts across the state try to increase the diversity of their teachers and reduce “diversity gaps” between the percentages of non-White students compared to staff. Figure 22 and Table 5 show the racial/ethnic diversity of fulltime teachers in Wisconsin public schools in 2012–13 and 2015–16. Despite efforts to diversify the state’s teachers,24 the percentage of fulltime Wisconsin teachers who are White has increased from 95.3% to 95.8%. Meanwhile, “diversity gaps” (the difference between the percentage of teachers and the percentage of students of a particular race/ethnicity) remained relatively unchanged among African Americans and grew larger for Hispanics. The total number of teachers working in Wisconsin in 2015–16 was virtually identical to 2012–13, although the number of fulltime teachers increased by 3.3% despite a slight drop in student enrollment over the same period of time.
Figure 22. Diversity of fulltime teachers and students in Wisconsin
24 Numerous Wisconsin districts have partnered with teacher training programs to increase teacher diversity, including the Madison Metropolitan School District’s partnership with UW–Madison (see https://www.madison.k12.wi.us/recruiting-9th-10th-graders-precollege-program-0) and the School District of La Crosse’s partnership with UW–La Crosse (see http://www.wxow.com/story/31561127/2016/03/Thursday/new-initiative-works-to-increase-teacher-diversity-in-la-crosse).
95.3%
73.1%
1.9%9.7%
1.6%10.1%
95.8%
71.2%
1.7%9.4%
1.7%
11.3%
0%
20%
40%
60%
80%
100%
120%
Teachers % White Students % White Teachers % Black Students % Black Teachers %Hispanic
Students %Hispanic
2012-13 2015-16

Teacher Supply and Demand
31
Table 5. Diversity of students and fulltime teachers in Wisconsin
2012–13 2013–14 2014–15 2015–16
% change 2012–13
to 2015–16 Total student enrollment 871,551 873,531 870,652 867,137 -0.5% Special education students 121,088 120,172 117,917 118,417 -2.2% English learners 48,188 47,417 46,954 46,851 -2.8% Recipients of free or reduced-price lunch
360,787 366,300 361,122 342,653 -5.0%
Female 48.5% 48.5% 48.5% 48.5% 0.0% Black 9.7% 9.7% 9.6% 9.4% -0.3% Hispanic 10.1% 10.5% 10.9% 11.3% +1.2% Asian American 3.6% 3.6% 3.7% 3.8% +0.2% Native 1.3% 1.2% 1.2% 1.2% -0.1% White 73.1% 72.4% 71.9% 71.2% -1.9%
Fulltime teachers 44,665 45,704 46,952 46,125 +3.3% Female 77.1% 76.9% 76.9% 77.1% 0.0% Black 1.9% 1.8% 2.0% 1.7% -1.2% Hispanic 1.6% 1.6% 1.8% 1.7% +0.1% Asian American 0.7% 0.7% 0.7% 0.7% 0.0% Native 0.3% 0.3% 0.3% 0.3% 0.0% White 95.3% 95.4% 94.9% 95.8% +0.5%
Total teachers 59,946 60,344 60,403 59,982 0.0%
Demand for Educators This section describes different ways of to think about the demand for teachers and discusses
the strategies Wisconsin districts use to combat staffing challenges, and district administrator perceptions of teacher quantity and quality concurrently.
Summarizing the “true” demand for teachers in Wisconsin presents notable challenges, not all of which can be adequately addressed with currently available data. The most notable of these challenges arise as a result of the dynamic, interdependent nature of the labor market and the coupling between labor supply and demand. A tempting but ultimately naïve estimate of teacher demand is simply the number of vacancies posted for teaching positions. In Wisconsin in 2015–16, this figure was 6,218. Such an approach, however would overstate the “true,” aggregate demand for teachers, because (as we have shown) a substantial number of applicants for these vacancies are “internal” candidates already teaching in Wisconsin public schools. An internal candidate’s acceptance of a new teaching job in another school or district creates a vacancy for the former position, showing up as two vacancies in an annual summary. Current WECAN data list only who applies for each posted vacancy, not who is actually hired—a shortcoming we recommend addressing. Yet, if we assume internal candidates are hired for existing teaching vacancies at least in proportion to their share of applicants, then this situation (a zero-sum game whereby one teaching vacancy is filled while another is created) occurs frequently. For example, we can imagine District A opening a vacancy and subsequently hiring Mrs. Muñoz. However, Mrs. Muñoz had
Teacher Supply and Demand
32
been employed in District B, meaning that now District B has to post a vacancy to replace her. If District B fills its vacancy by hiring yet another internal candidate (e.g., someone who also worked at another district), we can see that a simple count of the number of vacancies posted (three, in this case) would overestimate the true labor demand, which is a single teaching position.
Another approach would be to assume that the vacancy chain of internal applicants exemplified in the paragraph above ends when a district hires an external applicant. If this should be the case, our identification of all hired external applicants might serve as a measure of actual demand by districts. As with the first approach, this strategy also has limitations. Extending the example above, if District B did not replace Mrs. Muñoz, perhaps because of declining enrollment or because Mrs. Muñoz was in a low-supply position, the hiring chain would start and end with the vacancy District A filled with Mrs. Muñoz. However, because Mrs. Muñoz was a Wisconsin public school teacher in the prior year, we could not identify her as an external applicant,25 and the vacancy into which she had been hired would be overlooked under the assumptions in this approach. Should this occurrence be commonplace, we would systematically underestimate labor demand.
From a labor demand standpoint, districts face interesting challenges when hiring teachers. On one hand, districts have an incentive to hire early from their applicant pools; every day they wait is an additional day that another district may hire away the best candidates. On the other hand, waiting may increase opportunities for additional applicants to apply, potentially increasing the chances of landing the ideal candidate. Wisconsin teaching applicants are on the job market for just over 2 months, based on the time between the submission of their first and final applications, as Figure 23 shows.
25 WECAN’s application and vacancy data do not identify the individual who was hired; hiring must be inferred from changes in the DPI licensure and staffing data.

Teacher Supply and Demand
33
Figure 23. How long applicants are on the job market This sample omits candidates who submitted only one application.
As Figure 24 suggests, districts often snatch up candidates applying to low-supply positions as soon as they hit the market. The median number of days on the job market for low-supply positions is 57, compared to 72 days for high-supply positions. We use the median here rather than the mean to limit distortion that occurs in outlier instances when candidates remain on the job for very long (or short) periods.

Teacher Supply and Demand
34
Figure 24. Teachers’ duration on the job market for low-supply and high-supply positions
For low- and high-supply teaching positions, Figure 25 shows when candidates begin their job searches, with most submitting their initial applications in March and April for high-supply vacancies (with a dip in activity during spring break). Job candidates for medium- and low-supply positions spread out their initial applications but also tend to start their searches in March and April. In terms of when teaching applicants begin their job searches, Figure 25 shows this information for both low- and high-supply teaching positions. The largest share of applicants submit initial application in March and April for high supply vacancies (with a temporary dip in activity during spring break); this is also true for medium-supply and low-supply positions, although in the latter two groups the date of first application is more evenly spread out.

Teacher Supply and Demand
35
Figure 25. Timing for applicants entering the labor market
To complement this perspective of labor market activity, Figure 26 shows the overall range of teaching applications by date (as opposed to when a candidate submits the first application, as shown in Figure 25). The application season starts to peak earlier (mid-April) for low-supply vacancies, compared to early May for medium- and high-supply vacancies.
Num
ber o
f ini
tial a
pplic
atio
ns

Teacher Supply and Demand
36
Figure 26. Teaching applications submitted over time
Strategies Wisconsin Districts Use to Hire Educators To meet demand for teaching vacancies survey results show that districts employ multiple
strategies, including: making interim hires, eliminating program/position, increasing class sizes, requesting emergency licensure, hiring long-term substitute teachers, recruiting retired staff, assigning existing teachers additional classes (overload), sharing positions with another district, contracting with a cooperative educational services agency, offering courses online or externally, targeting the recruitment of teachers, offering financial incentives, and providing tuition assistance.
For all high- and low-supply positions, survey data show that emergency licensure is the most common district strategy and the second most common (after financial incentives) for medium-supply vacancies. To request an emergency license, a district must assert it attempted to fill the vacancy with a traditionally licensed teacher but was unsuccessful. To the best of our knowledge, there is little to no oversight from the state to verify such assertions.
The high use of emergency licensure can be problematic. A district might employ emergency licensure because—despite a large applicant pool—it could not recruit any high-quality candidates, which suggests districts perceived a lack of quality among traditionally certified teachers within their applicant pools. A second rationale may be that a district does have what it perceives to be a high-quality candidate but is not able to hire her or him because s/he does not pass the Foundations of Reading Test and edTPA licensing exams. A third explanation could be that
Teacher Supply and Demand
37
districts use emergency licensure as a tool of convenience and do not adhere to the DPI policy requirement that emergency licensure is to be requested when the district lacks viable candidates. This scenario suggests a future research question: Why do districts elect to hire unlicensed teachers for high-supply positions when they have ample candidates in their applicant pools?
As the hiring of teachers is costly, time-consuming, and high-quality information by which to select exceptional educators is rare, districts may privilege local information on teacher quality over the relative uncertainty of commonly available proxies for teacher quality typically used on the job market. Future research could explore in depth why districts place a priority on emergency licensure use. The increased reliance on emergency licensure may reflect a district’s greater faith in the ability of a known individual to acquire the requisite skills and knowledge for the open position than in the district’s ability to invest the financial and human capital in the hiring process to identify requisite skills and knowledge of applicants. Perhaps districts use emergency licensure as a strategy to invest in the human capital of current faculty. Perhaps districts choose the known costs of supporting teachers obtaining new licenses against the unknown costs of mentoring and potential attrition of a new, albeit traditionally licensed, teacher. Although investigating these hypotheses are beyond the scope of this report, answering these questions is important to better understand how emergency licensure meets demand for labor, how it affects labor supply and demand, and how labor supply influences the use of emergency licensure.
For each labor supply category illustrated in Figures 27–29, we present the three most commonly reported strategies for recruiting teachers. Because recurring dialogue regarding the prevalence of teacher “poaching” around the state, we include in the figures how often districts said they used “targeted recruitment” and “financial incentives” to attract educators. Given the negative connotation of “targeted recruitment” among Wisconsin school leaders, we suspect that reported use of this tactic likely represents a lower bound of actual behaviors.

Teacher Supply and Demand
38
To staff high-supply vacancies (Figure 27)—those with the greatest number of applicants—districts surveyed filled 30% of vacancies by requesting emergency licenses from DPI, then by assigning a long-term substitute to teach the course (12%), or tapping a retired staff member (11%). Financial incentives were offered 8% of the time, and recruitment was targeted 6% of the time.
Figure 27. Top three strategies, plus targeted recruitment and financial incentives, districts reported using to staff high-supply vacancies

Teacher Supply and Demand
39
For medium-supply positions such as art, science, reading, math, and English, financial incentives (Figure 28) are the most frequently-used strategy to fill vacancies. Here too we note a reliance on emergency licensure for 17% of vacancies. Assigning a current district teacher an overload assignment (13%) and tapping retired staff (10%) were also used to recruit for medium-supply vacancies. Targeted recruitment was used only sparingly (7%), at levels comparable to high-supply vacancies.
Figure 28. Top three strategies, plus targeted recruitment and financial incentives, that districts reported using to staff medium-supply vacancies
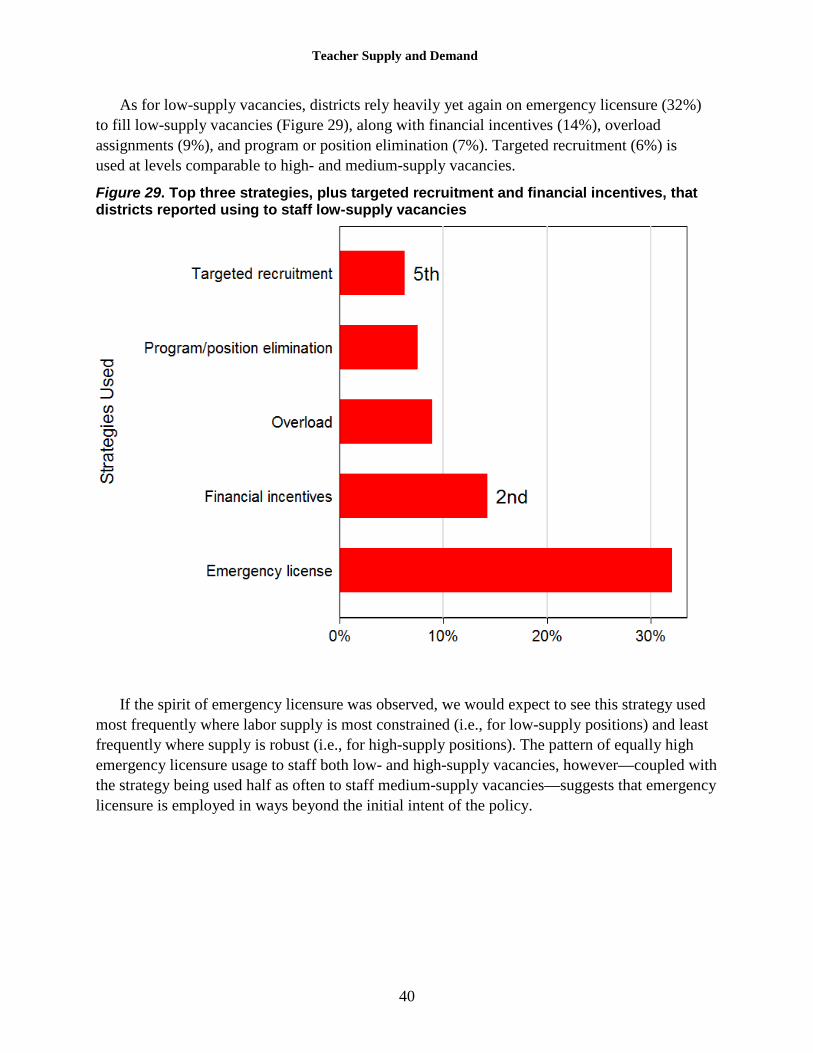
Teacher Supply and Demand
40
As for low-supply vacancies, districts rely heavily yet again on emergency licensure (32%) to fill low-supply vacancies (Figure 29), along with financial incentives (14%), overload assignments (9%), and program or position elimination (7%). Targeted recruitment (6%) is used at levels comparable to high- and medium-supply vacancies.
Figure 29. Top three strategies, plus targeted recruitment and financial incentives, that districts reported using to staff low-supply vacancies
If the spirit of emergency licensure was observed, we would expect to see this strategy used most frequently where labor supply is most constrained (i.e., for low-supply positions) and least frequently where supply is robust (i.e., for high-supply positions). The pattern of equally high emergency licensure usage to staff both low- and high-supply vacancies, however—coupled with the strategy being used half as often to staff medium-supply vacancies—suggests that emergency licensure is employed in ways beyond the initial intent of the policy.
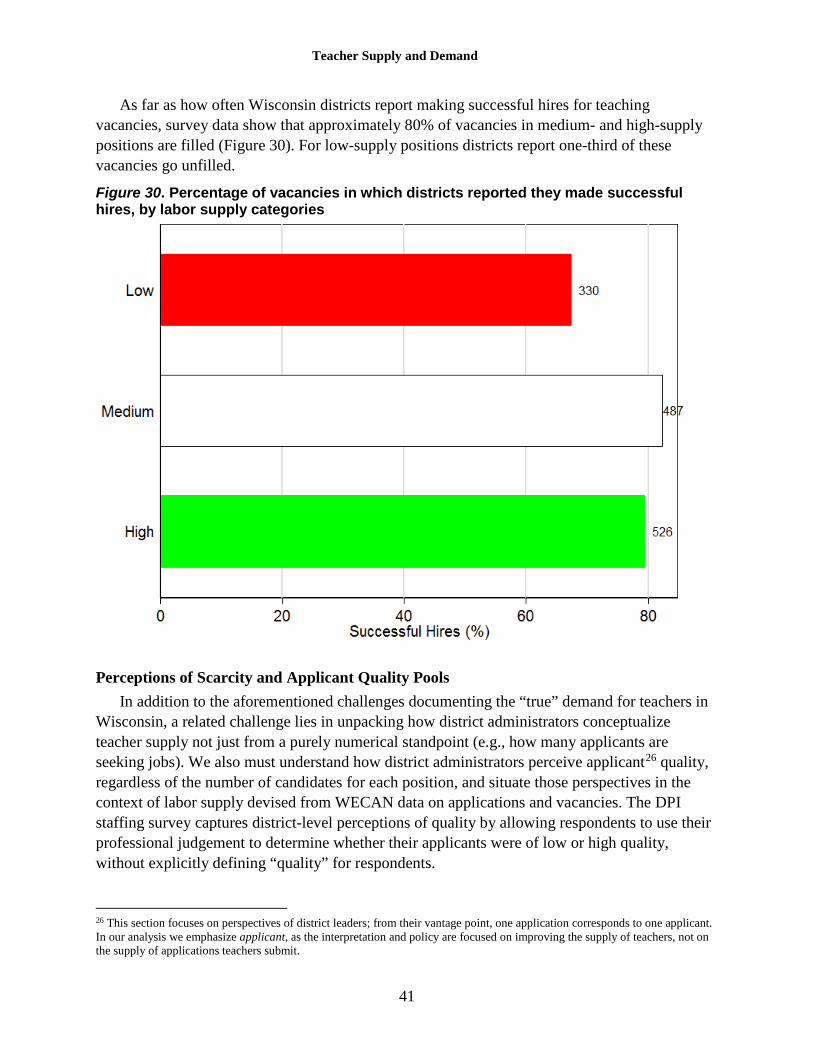
Teacher Supply and Demand
41
As far as how often Wisconsin districts report making successful hires for teaching vacancies, survey data show that approximately 80% of vacancies in medium- and high-supply positions are filled (Figure 30). For low-supply positions districts report one-third of these vacancies go unfilled.
Figure 30. Percentage of vacancies in which districts reported they made successful hires, by labor supply categories
Perceptions of Scarcity and Applicant Quality Pools In addition to the aforementioned challenges documenting the “true” demand for teachers in
Wisconsin, a related challenge lies in unpacking how district administrators conceptualize teacher supply not just from a purely numerical standpoint (e.g., how many applicants are seeking jobs). We also must understand how district administrators perceive applicant26 quality, regardless of the number of candidates for each position, and situate those perspectives in the context of labor supply devised from WECAN data on applications and vacancies. The DPI staffing survey captures district-level perceptions of quality by allowing respondents to use their professional judgement to determine whether their applicants were of low or high quality, without explicitly defining “quality” for respondents.
26 This section focuses on perspectives of district leaders; from their vantage point, one application corresponds to one applicant. In our analysis we emphasize applicant, as the interpretation and policy are focused on improving the supply of teachers, not on the supply of applications teachers submit.

Teacher Supply and Demand
42
For each position posted in WECAN in spring and summer 2015, DPI’s survey asked district administrators to identify whether the applicant pool consisted of (a) many applicants who were largely of high quality; (b) few total applicants but largely of high quality; (c) many applicants who were largely of low quality; or (d) few applicants who were largely of low quality. Figure 31 shows the responses across the three supply categories.
District leaders saw low-supply vacancies as attracting the weakest pool of applicants, as illustrated in Figure 31. In three of every four low-supply vacancies, administrators reported there were few applicants and these applicants were typically of poor quality. For all three supply types (low, medium, high), fewer than half of the teaching vacancies attracted applicant pools administrators perceived as high quality, regardless of the number of applications. In other words, the labor pools deemed weakest in terms of quality and quantity combined are most prevalent among low-supply vacancies, and least prevalent among high-supply vacancies (38%). The hardest-to-fill positions attract the lowest-quality applicants, from the district leaders’ perspective.
Figure 31. Perceived quality and quantity of applicant pools across labor supply categories
District leaders may differ in their perceptions of what constitutes “many applications” or
“high-quality applications.” To present the perspectives of district leaders on a common ground, we next compare their perceptions of applicant pools in the context of the number of applications submitted for each vacancy. This comparison, shown in Figure 32, reveals that the types of
Low labor
supply
Medium labor
supply
High labor
supply
Many applicants of high quality
Few applicants of high quality
Many applicants of low quality
Few applicants of low quality
Many applicants of high quality
Few applicants of high quality
Many applicants of low quality
Few applicants of low quality
Many applicants of high quality
Few applicants of high quality
Many applicants of low quality
Few applicants of low quality

Teacher Supply and Demand
43
vacancies districts seek to fill shape—in part—district leaders’ perceptions of labor supply. Specifically, we see that the number of applications in the medium- and low-supply categories are quite similar. This alignment suggests that district leaders see labor quality and quantity in a similar manner across these positions. In contrast, they see high-supply vacancies quite differently.
When district leaders receive 35–40 applications for a high-supply vacancy, they are apt to categorize this amount to be “many applicants.” When they receive 15–20 applications to the same high-supply vacancies, they see this range as “few applicants.” However, for medium- and low-supply vacancies, district leaders consider 17–22 applications to be “many” and 8–12 to be “few.” Comparing these results with the average number of applications per vacancy (see Figure 6, p. 8), we note districts seldom receive more than 10 applications per low-supply vacancy. In contrast, high-supply vacancies with fewer than 18 applicants are seen as garnering too few applicants, a scenario arising in roughly half of the positions in the high-supply category.
Regardless of the size of the applicant pool, district leaders also voiced notable concern over the quality of the applicants on the market; 83% of applicant pools for low-supply positions, 64% of applicant pools for medium-supply positions, and 50% of applicant pools for high-supply positions were seen to be largely filled with low-quality applicants.
Figure 32. Alignment of number of applications and perceptions of district leaders
Many applicants of high quality
Few applicants of high quality
Many applicants of low quality
Few applicants of low quality
Low labor
supply
Many applicants of high quality
Few applicants of high quality
Many applicants of low quality
Few applicants of low quality
Medium labor
supply
Many applicants of high quality
Few applicants of high quality
Many applicants of low quality
Few applicants of low quality
High labor
supply
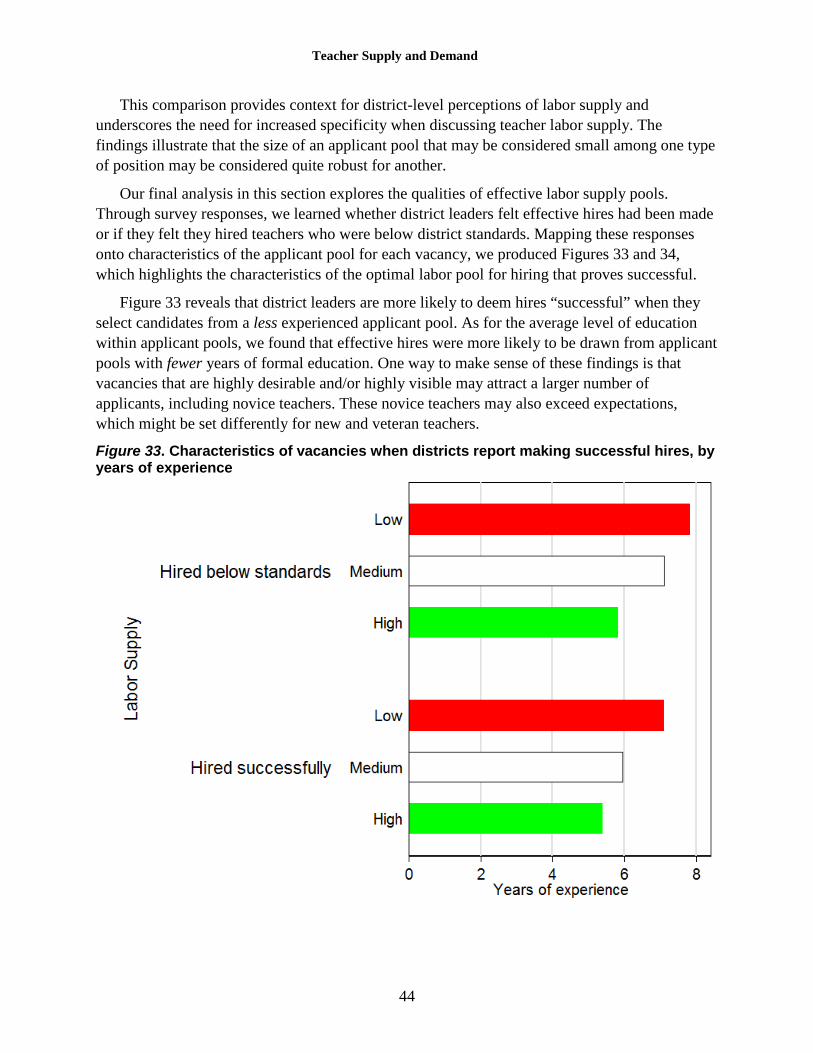
Teacher Supply and Demand
44
This comparison provides context for district-level perceptions of labor supply and underscores the need for increased specificity when discussing teacher labor supply. The findings illustrate that the size of an applicant pool that may be considered small among one type of position may be considered quite robust for another.
Our final analysis in this section explores the qualities of effective labor supply pools. Through survey responses, we learned whether district leaders felt effective hires had been made or if they felt they hired teachers who were below district standards. Mapping these responses onto characteristics of the applicant pool for each vacancy, we produced Figures 33 and 34, which highlights the characteristics of the optimal labor pool for hiring that proves successful.
Figure 33 reveals that district leaders are more likely to deem hires “successful” when they select candidates from a less experienced applicant pool. As for the average level of education within applicant pools, we found that effective hires were more likely to be drawn from applicant pools with fewer years of formal education. One way to make sense of these findings is that vacancies that are highly desirable and/or highly visible may attract a larger number of applicants, including novice teachers. These novice teachers may also exceed expectations, which might be set differently for new and veteran teachers.
Figure 33. Characteristics of vacancies when districts report making successful hires, by years of experience

Teacher Supply and Demand
45
Across the three labor supply categories, survey respondents were more likely to identify successful hires when selecting from slightly larger supply pools, as Figure 34 shows. The optimal size of the applicant pool changes in relation to the labor supply category. When applicants from low-supply positions were hired successfully, we note an average applicant pool size of about 11 candidates, as compared to nine when an applicant was hired below district standards. In contrast, high-supply vacancies were successfully filled when applicant pools averaged 24 applicants versus 17 when an applicant was hired below district standards.
Given our results regarding the timing of hiring and the duration of optimal duration of the search process, district leaders may want to abandon establishing a set duration for a vacancy and instead use these figures as a recruitment guideline. That is, districts may want to continue recruiting for a given vacancy until they have attracted at least 11 applicants for low-supply vacancies, 12 for medium-supply vacancies, or 24 for high-supply vacancies.
Figure 34. Hiring outcomes as a function of the number of applicants to a given vacancy, across labor supply categories.
Low labor supply
Medium labor supply
High labor supply
Low labor supply
Medium labor supply
High labor supply
Hired below
standards
Successful hires
Number of applicants
Teacher Supply and Demand
46
Conclusion and Recommendations
This report set out to address four questions central to the Wisconsin teacher labor market. These questions and their answers are summarized below.
1. What are the prevailing trends in teacher attrition and mobility? Educator mobility rates in Wisconsin are modest and comparable to similar states. Teacher
mobility may be fundamentally different in post-Act 10 Wisconsin as teachers are more likely to change districts in the years since 2011 than before this major policy change. We also note that the financial rewards for those who change districts are four to five times greater than if they change schools within their districts or remain in their current positions. When developing compensation plans, district leaders should think carefully if they want to encourage this pattern.
Overall rates of nonretirement teacher attrition are similarly modest; however, attrition among teachers in low-supply vacancies and minority educators are excessive and an inquiry into the causes merits immediate attention. Continued attrition in these areas induces further strain on staffing challenges and diversity initiatives.
Neither attrition nor mobility by themselves are inherently problematic. The key to discerning between a healthy and a failing labor market lies instead in uncovering trends in differential attrition and mobility: Who specifically is coming and going in terms of educator quality and effectiveness? Currently, the lack of measures to ascertain the quality of mobile and exiting educators is a sizable shortfall of these analyses. The inclusion of quality measures, such as those from Wisconsin’s educator effectiveness system, would greatly enhance the utility of attrition and mobility analyses. We anticipate integrating these measures into future iterations of this report.
2. What is the current supply of teachers? Most teaching vacancies in Wisconsin attract two applicants external to the state’s public
schools for every one applicant who is already teaching in a Wisconsin public school. Among low-supply positions, these proportions approach a 1:1 ratio of external to internal applicants, reinforcing the constrained nature of this segment of the labor market.
Novice teachers, primarily those from and educated in Wisconsin, make up nearly a third of all applicants. Cultivating a pipeline of in-state novice educators should be a strategic priority for all district leaders.
Although not alone nationally,27 Wisconsin suffers substantial “leaks” at multiple points in its educator pipeline, including potential educators who complete college in an education field but don’t seek entry into the teaching labor force. In light of heightened concerns of declining enrollment in educator preparation programs nationwide,28 policymakers should monitor this gap and seek solutions to help students matriculate into the teaching workforce. An increase in this
27 See, for example, Barth, P., Dillon, N., Hull, J., & Higgins, B. H. (2016). Fixing the holes in the teacher pipeline: An overview of teacher shortages. Alexandria, VA: Center for Public Education. 28 For example, total enrollment in teacher preparation programs nationwide declined from more than 700,000 in 2008–09 to fewer than 500,000 in 2012–13; see https://title2.ed.gov/Public/44077_Title_II_Issue_Brief_Enrollment.pdf

Teacher Supply and Demand
47
gap would suggest that college students who choose not to enroll in educator preparation programs may be likely to not pursue teaching once licensure is conferred. A reduction in this gap should raise serious concerns regarding the stability of the labor supply and should motivate policy at the state level and among educator preparation programs to improve recruitment. The programs could collaborate in the development of matriculation metrics—comparable to the systems developed for dropout prevention in high schools—to identify the characteristics of college students most likely to become professional educators.
To address demand, at least in the short term, Wisconsin districts appear to use emergency credentials (licensure and permits) at a rapidly increasing rate. Some districts, in fact, use emergency credentialing at rates five to 10 times greater than their faculty population would predict. Instances of individuals who continue teaching under emergency credentials beyond the intended 1-year timeframe have increased substantially; this trend may be related to recent changes in Wisconsin’s required exams for teacher licensure and merits further inquiry.
3. How are districts responding to staffing challenges? Low-supply teachers remain a central yet elusive goal for many district leaders, and
navigating the hiring game can be challenging. Educators remain active on the labor market for just over 2 months, with many beginning their search in early March. The market tends to peak in early to mid-May. These dates represent the optimal time for districts to find candidates across all three labor supply categories.
District leaders report using emergency credentialing to fill 30% of high-supply vacancies, a use likely incongruous with policy intent. Financial incentives are also a common strategy used to fill low- and middle-supply vacancies.
Staffing low-supply vacancies is challenging, with nearly one-third of all vacancies going unfilled in 2015–16. Increasing the teaching load of other teachers and program or position elimination are the most prevalent strategies used.
4. Is there a teacher shortage in Wisconsin? Wisconsin is not experiencing a statewide teacher shortage.
Our report shows that the number and perceived quality of applicants vary across positions, but it does not suggest that the entirety of district-level staffing challenges constitute a statewide teacher labor shortage. Variation in hiring success across districts shows that many districts do make successful hires and there is often an excess of applicants across positions. Given the available evidence, it would be premature to focus exclusively on statewide supply-side solutions to local problems without considering how demand-side factors may exacerbate staffing challenges. Staffing challenges can arise due to supply-side limitations (e.g., insufficient labor supply), demand-side limitations (e.g., weak recruitment), or a confluence of the two. Certain types of teaching positions (including those with a low supply of applicants) are more challenging to fill. Certain types of teachers (those who are certified and highly effective) are more difficult to recruit and hire, and certain types of districts (including rural and urban) do face greater challenges in filling vacant teaching positions than others. This analysis shows the reality

Teacher Supply and Demand
48
is more complex than a sweeping, across-the-board proclamation of a teacher shortage and should help policymakers better align policies with district demand for teachers.
A local teacher shortage exists when a district employing the best practices of human capital management consistently fails to attract the requisite talent. University of Pennsylvania professor Richard Ingersoll has provided compelling evidence that schools’ staffing challenges are often more a function of retaining teachers than they are a product of an insufficient teachers supply.29 Statewide supports and university partnerships could help districts improve their human capital management—to overcome weak retention, antiquated recruitment strategies, disjointed hiring procedures, lack of mentoring, substandard compensation, weak leadership, etc. These problems are not the result of a teacher shortage. Any organization can suffer from demand-side limitations through imperfect human capital management, and while these will undoubtedly exacerbate staffing challenges, they are not the result of a teacher shortage.
The increasing importance of human capital management for school and district leaders is evident in the 2015 release of the Professional Standards for Educational Leaders30 (formerly the Interstate School Leaders Licensure Consortium Standards) that feature recruitment, hiring, evaluation, and retention. Education leadership preparation programs are beginning to integrate courses on human capital management; however, leaders without formal training must rely on the knowledge, processes, and organizational structures in their schools or districts. Districts should critically reflect on their capacity to develop, implement, and maintain effective human capital management strategies. As districts begin this localized work, the Wisconsin DPI can collaborate with Wisconsin’s regional cooperative educational service agencies to provide direction, standardization, and education needed to build or revise districts’ human capital management plans.
Some aspects of staffing lie beyond the reach of school and district leaders, such as community demographics, geography, and poverty. Although pecuniary compensation cannot solve all staffing ills, it has been linked to increases in recruitment and retention. However, Wisconsin’s current school funding structure provides no direct financial support to increase salaries for educators working in these schools. Wisconsin’s general aid program has not been updated in several years, and inflation has eroded the revenue base available to supplement salaries. Voting to increase revenue limits, thereby increasing the tax burden on a locality, is a district’s only avenue for increasing general funds; however, the districts that are plagued by employment hardships are precisely those least able to initiate or pass referenda. Recent legislation in Wisconsin limiting the times at which referenda can be voted upon further undermines local revenue control as a strategy to address local staffing challenges. Advocating for updating, if not outright revising, the Wisconsin school finance system has been a priority for citizens, politicians, professional organizations, and education leaders across the state. Ensuring districts have resources to recruit and retain effective educators to meet local needs is a key
29 See, for example, Ingersoll, R. M., & Smith, T. M. (2003). The wrong solution to the teacher shortage. Educational Leadership, 60(8), 30–33. 30 http://npbea.org/psel/

Teacher Supply and Demand
49
component of the state’s constitutional responsibility to provide an adequate and equitable education.
To be clear, a labor shortage is the primary culprit of staffing challenges in some areas. For example, if proportional representation of students across demographic groups is the goal, then we have a shortage of teachers. Regardless of what measures are used, the statewide system lacks African American or Hispanic educators, as does the teacher preparation pipeline, if historical numbers continue to hold. We can ascertain this demand because we have a clear benchmark (proportional representation) that identifies a set demand.
Our results represent the complexity of the labor market. The supply data show a net excess of applicants across nearly all positions. However, variation in teacher preferences tempers this supply, with some districts receiving more applications than others. Of the districts that have enough applicants, many struggle with perceived quality of applicants, and this concern is most acute for low-supply vacancies. Thus, any policies focused on addressing the labor supply must be targeted to increase the quantity of teachers in low-supply positions while ensuring that the quality of teachers produced is high, as well.
Policies that aim to increase labor supply by opening the floodgates to teaching via reducing or eliminating licensure do nothing to address the quality dynamic of the staffing challenges or to increase the number of applications in some fields or areas of the state. These policies likely exacerbate inequality among districts because affluent districts have fewer staffing challenges and the less wealthy districts that “benefit” from the increased teacher supply must find the time and resources to provide necessary pedagogic support for untrained, unlicensed individuals. In addition, these districts must have the organizational capacity to identify uncertified individuals who will blossom into successful teachers—a tall order, given the multitude of challenges that exist when identifying and hiring experienced teachers.
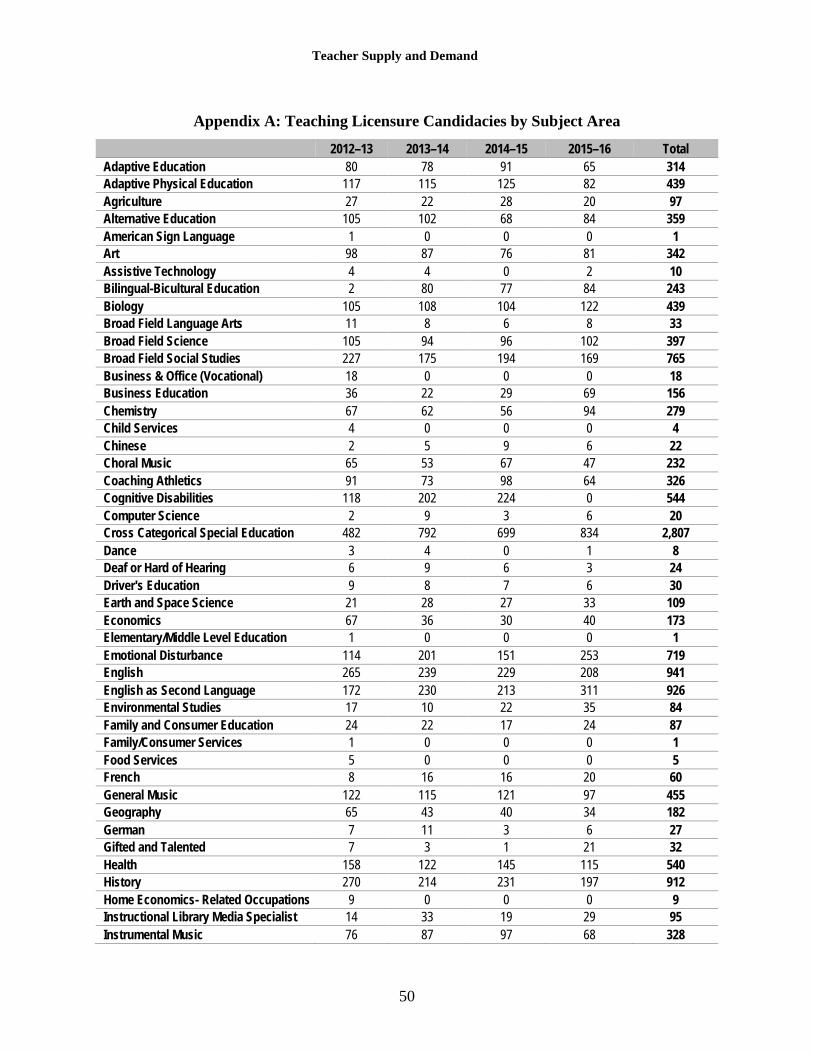
Teacher Supply and Demand
50
Appendix A: Teaching Licensure Candidacies by Subject Area 2012–13 2013–14 2014–15 2015–16 Total
Adaptive Education 80 78 91 65 314 Adaptive Physical Education 117 115 125 82 439 Agriculture 27 22 28 20 97 Alternative Education 105 102 68 84 359 American Sign Language 1 0 0 0 1 Art 98 87 76 81 342 Assistive Technology 4 4 0 2 10 Bilingual-Bicultural Education 2 80 77 84 243 Biology 105 108 104 122 439 Broad Field Language Arts 11 8 6 8 33 Broad Field Science 105 94 96 102 397 Broad Field Social Studies 227 175 194 169 765 Business & Office (Vocational) 18 0 0 0 18 Business Education 36 22 29 69 156 Chemistry 67 62 56 94 279 Child Services 4 0 0 0 4 Chinese 2 5 9 6 22 Choral Music 65 53 67 47 232 Coaching Athletics 91 73 98 64 326 Cognitive Disabilities 118 202 224 0 544 Computer Science 2 9 3 6 20 Cross Categorical Special Education 482 792 699 834 2,807 Dance 3 4 0 1 8 Deaf or Hard of Hearing 6 9 6 3 24 Driver's Education 9 8 7 6 30 Earth and Space Science 21 28 27 33 109 Economics 67 36 30 40 173 Elementary/Middle Level Education 1 0 0 0 1 Emotional Disturbance 114 201 151 253 719 English 265 239 229 208 941 English as Second Language 172 230 213 311 926 Environmental Studies 17 10 22 35 84 Family and Consumer Education 24 22 17 24 87 Family/Consumer Services 1 0 0 0 1 Food Services 5 0 0 0 5 French 8 16 16 20 60 General Music 122 115 121 97 455 Geography 65 43 40 34 182 German 7 11 3 6 27 Gifted and Talented 7 3 1 21 32 Health 158 122 145 115 540 History 270 214 231 197 912 Home Economics- Related Occupations 9 0 0 0 9 Instructional Library Media Specialist 14 33 19 29 95 Instrumental Music 76 87 97 68 328

Teacher Supply and Demand
51
2012–13 2013–14 2014–15 2015–16 Total Intellectual Disabilities 0 0 0 171 171 Italian 0 0 0 1 1 Japanese 1 0 0 4 5 Journalism 4 3 2 1 10 Language Arts Elem Minor 68 71 59 67 265 Latin 1 3 1 0 5 Learning Disabilities 165 295 281 0 741 Library Media Specialist Nonrenewable 37 16 20 12 85 Life and Environmental Science 6 9 8 24 47 Marketing Education 15 8 7 6 36 Mathematics 320 314 302 279 1,215 Other Foreign Language 0 0 1 0 1 Physical Education 166 140 151 103 560 Physical Science 4 3 2 2 11 Physics 35 32 22 41 130 Political Science 125 83 86 86 380 Portuguese 0 0 0 1 1 Psychology 73 69 72 70 284 Reading Teacher 129 241 171 238 779 Regular Education 1,719 1,656 1,615 1,524 6,514 Science (Elementary Minor) 103 80 69 79 331 Social Studies (Elementary Minor) 112 85 93 99 389 Sociology 53 45 42 48 188 Spanish 102 88 95 93 378 Special Education 127 144 160 173 604 Specific Learning Disabilities 0 0 0 329 329 Speech and Language Pathology 77 78 87 79 321 Speech Communications 15 4 10 8 37 Technology Education 29 29 21 36 115 Theater 10 13 10 16 49 Visual Impairment 0 8 0 6 14 Total 6,704 7,039 6,812 7,036 2,7591