supply chain and blade manufacturing considerations in - nrel
TRANSCRIPT
1
More information about the U.S. Department of Energy’s Clean Energy Manufacturing Initiative is available online: http://www1.eere.energy.gov/energymanufacturing/index.html
2
3
4
5

Global manufacturing capacity for wind turbines has doubled since 2008, and worldwide installations of wind power reached new highs in 2012, adding more than 46 GW of capacity to electric grids (BNEF 2013). While wind power is the lowest cost energy source in some locations, demand is still driven by policy support in many markets and the magnitude of deployment opportunities can fluctuate significantly in response to incentives and regulatory changes (IPCC 2011). The United States experienced record‐breaking deployment in 2012 (13.1 GW), in part due to the anticipated expiration of the federal production tax credit (PTC) (AWEA 2013). Manufacturers in the United States were mostly able to respond to domestic demand, yet imports did contribute to the U.S. market despite the relatively high transportation costs associated with large wind equipment.
6
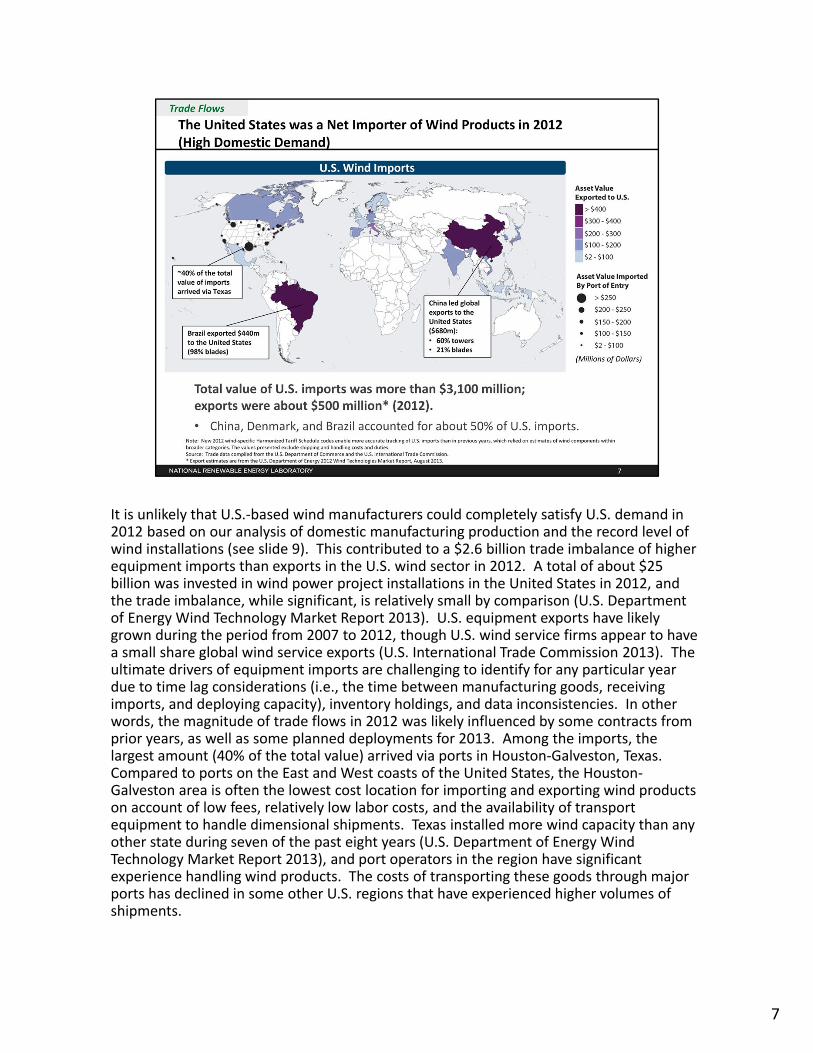
It is unlikely that U.S.‐based wind manufacturers could completely satisfy U.S. demand in 2012 based on our analysis of domestic manufacturing production and the record level of wind installations (see slide 9). This contributed to a $2.6 billion trade imbalance of higher equipment imports than exports in the U.S. wind sector in 2012. A total of about $25 billion was invested in wind power project installations in the United States in 2012, and the trade imbalance, while significant, is relatively small by comparison (U.S. Department of Energy Wind Technology Market Report 2013). U.S. equipment exports have likely grown during the period from 2007 to 2012, though U.S. wind service firms appear to have a small share global wind service exports (U.S. International Trade Commission 2013). The ultimate drivers of equipment imports are challenging to identify for any particular year due to time lag considerations (i.e., the time between manufacturing goods, receiving imports, and deploying capacity), inventory holdings, and data inconsistencies. In other words, the magnitude of trade flows in 2012 was likely influenced by some contracts from prior years, as well as some planned deployments for 2013. Among the imports, the largest amount (40% of the total value) arrived via ports in Houston‐Galveston, Texas. Compared to ports on the East and West coasts of the United States, the Houston‐Galveston area is often the lowest cost location for importing and exporting wind productson account of low fees, relatively low labor costs, and the availability of transport equipment to handle dimensional shipments. Texas installed more wind capacity than any other state during seven of the past eight years (U.S. Department of Energy Wind Technology Market Report 2013), and port operators in the region have significant experience handling wind products. The costs of transporting these goods through major ports has declined in some other U.S. regions that have experienced higher volumes of shipments.
7
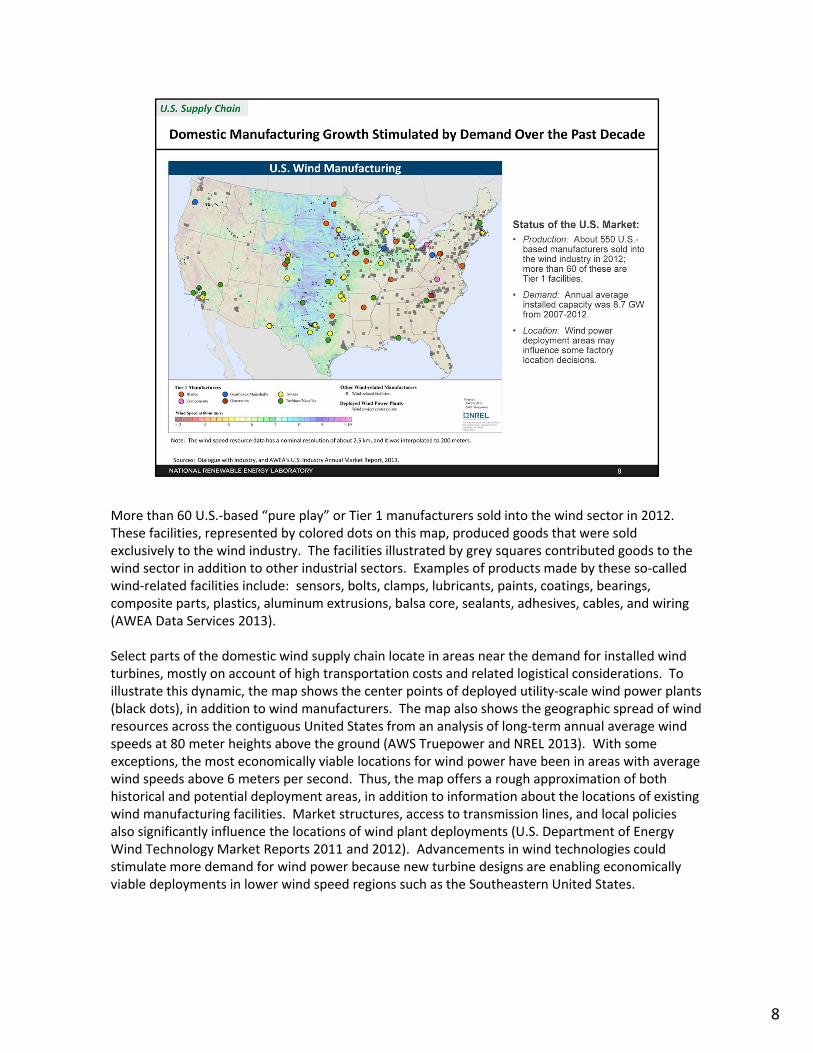
More than 60 U.S.‐based “pure play” or Tier 1 manufacturers sold into the wind sector in 2012. These facilities, represented by colored dots on this map, produced goods that were sold exclusively to the wind industry. The facilities illustrated by grey squares contributed goods to the wind sector in addition to other industrial sectors. Examples of products made by these so‐called wind‐related facilities include: sensors, bolts, clamps, lubricants, paints, coatings, bearings, composite parts, plastics, aluminum extrusions, balsa core, sealants, adhesives, cables, and wiring (AWEA Data Services 2013).
Select parts of the domestic wind supply chain locate in areas near the demand for installed wind turbines, mostly on account of high transportation costs and related logistical considerations. To illustrate this dynamic, the map shows the center points of deployed utility‐scale wind power plants (black dots), in addition to wind manufacturers. The map also shows the geographic spread of wind resources across the contiguous United States from an analysis of long‐term annual average wind speeds at 80 meter heights above the ground (AWS Truepower and NREL 2013). With some exceptions, the most economically viable locations for wind power have been in areas with average wind speeds above 6 meters per second. Thus, the map offers a rough approximation of both historical and potential deployment areas, in addition to information about the locations of existing wind manufacturing facilities. Market structures, access to transmission lines, and local policies also significantly influence the locations of wind plant deployments (U.S. Department of Energy Wind Technology Market Reports 2011 and 2012). Advancements in wind technologies couldstimulate more demand for wind power because new turbine designs are enabling economically viable deployments in lower wind speed regions such as the Southeastern United States.
8

Historically, the demand for wind power in the United States has been strongly influenced by the short‐term extensions and expirations of the federal production tax credit (Schwabe, et al. 2009),which has created varied levels of deployment as shown in this figure. In addition to illustrating historical deployment, this chart also highlights the U.S.‐based manufacturing production levels for major wind components (nacelles, blades, and towers) in 2012 and near‐term demand forecasts under current (2013) policies, which range from less than 2 GW per year to nearly 8 GW per year. Policies assessed in these market forecasts include state renewable portfolio standards (RPSs) and the federal PTC. The survey‐based estimates of domestic wind equipment production for 2012 provide a top‐down perspective about the overall scale of today’s U.S.‐based wind manufacturing. While comprehensive data about U.S.‐based manufacturing capacity and plant utilization is not available, the production data alone offer important insights about domestic capabilities to respond to demand. For comparison purposes, the production numbers for blades and towers are listed in terms of capacity (GW). These values were derived from actual production data in 2012: 12,500 blades and 3,800 towers (AWEA 2013). The ranges of demand forecasts illustrated in the figure are from the market reports listed. Despite a short‐term extension of the federal PTC in January 2013, which is included in these forecasts, it is anticipated that average annual demand through 2017 will be consistently lower than the past five year annual average of 8.7 GW. Expected low natural gas prices and continued stagnant electricity demand contribute to these lower forecasts, and the impacts of these market conditions on wind manufacturers are already apparent; some firms have published information about negative operating margins (resulting from reduced sales, lower margins, and restructurings) and/or announced reduced plant operations. Some closures were also announced in 2012 and early 2013 (e.g., Nordex, Clipper, Nordic, DMI, Trinity, and others).
9

Wind turbines are composed of more than 8,000 individual components, and about 90% of the value is captured in three main parts: blades, towers, and nacelles (Tegen, et al. 2013). Blades are typically made of fiberglass and epoxy composites, and include some carbon fiber materials. Towers are mainly composed of rolled steel, and in some large‐scale designs, the tower base may be made of concrete. Nacelles house the drivetrain/gear box components and the generator, and a range of technologies are available in the market.
Many types of corporate structures exist among today’s wind power manufacturers. Some firms, like Vestas, are vertically integrated, producing most parts of turbine systems; other firms, like GE, work with a range of suppliers to acquire individual parts such as blades. Wind turbine parts are not often interchangeable, however. Some components are designed for specific turbine systems, and a breadth of turbine system designs are available today to both serve customer needs and sustain firm‐level competitive advantages.
10

11

12

13
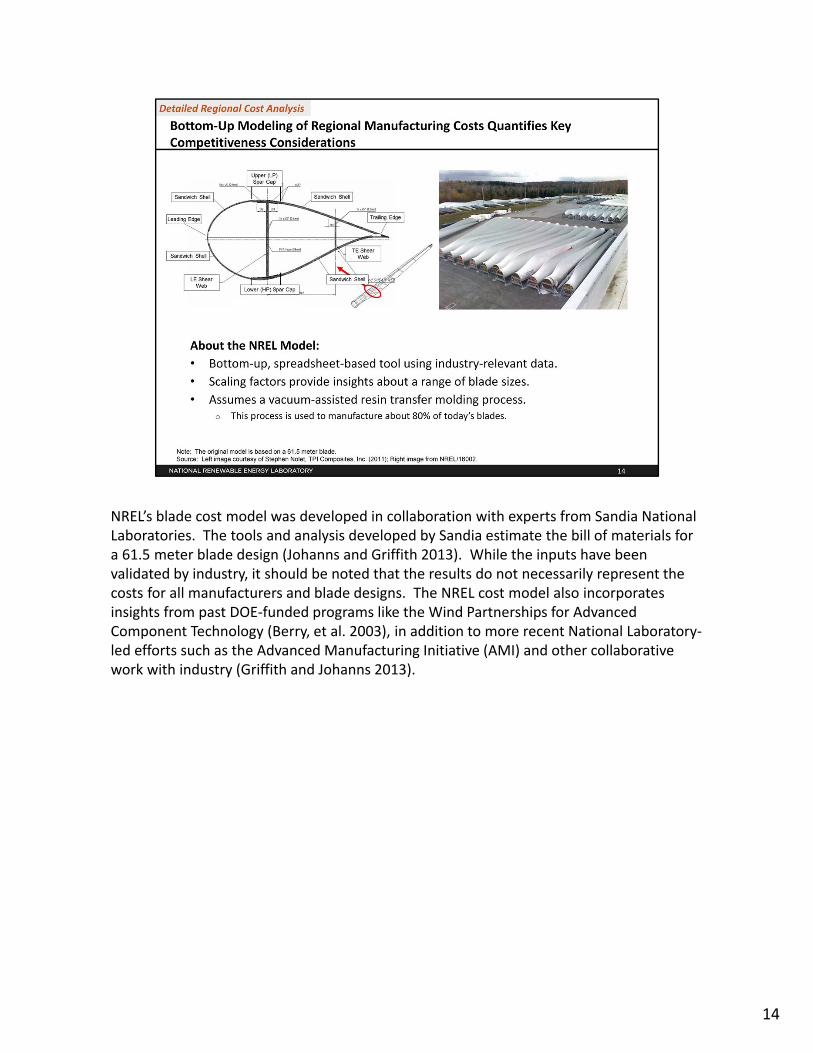
NREL’s blade cost model was developed in collaboration with experts from Sandia National Laboratories. The tools and analysis developed by Sandia estimate the bill of materials for a 61.5 meter blade design (Johanns and Griffith 2013). While the inputs have been validated by industry, it should be noted that the results do not necessarily represent the costs for all manufacturers and blade designs. The NREL cost model also incorporates insights from past DOE‐funded programs like the Wind Partnerships for Advanced Component Technology (Berry, et al. 2003), in addition to more recent National Laboratory‐led efforts such as the Advanced Manufacturing Initiative (AMI) and other collaborative work with industry (Griffith and Johanns 2013).
14

The NREL blade model includes every step of the manufacturing process–from kitting to hand overlays to painting and final check‐off–for the vacuum‐assisted resin transfer molding process (VARTM). The model is adaptable and structured to use a range of wage rates for skilled and unskilled laborers, materials pricing, tooling costs, electricity costs, and financing considerations. This methodology includes the capability to estimate the minimum sustainable price (i.e., the price that provides investors with a return that overcomes capital costs) for manufacturers based in each region using industry‐accepted discounted free cash flow methods. The weighted average cost of capital (i.e., the discount rate) is calculated from a combination of representative corporate leverage, the cost of debt, and the cost of equity. The cost of equity, which companies do not report, is calculated from an equity market risk premium and risk free rate with the risk premium being adjusted for sector‐specific factors. More information on the methodology behind the financing assumptions is available in Goodrich, et al. 2013.
15

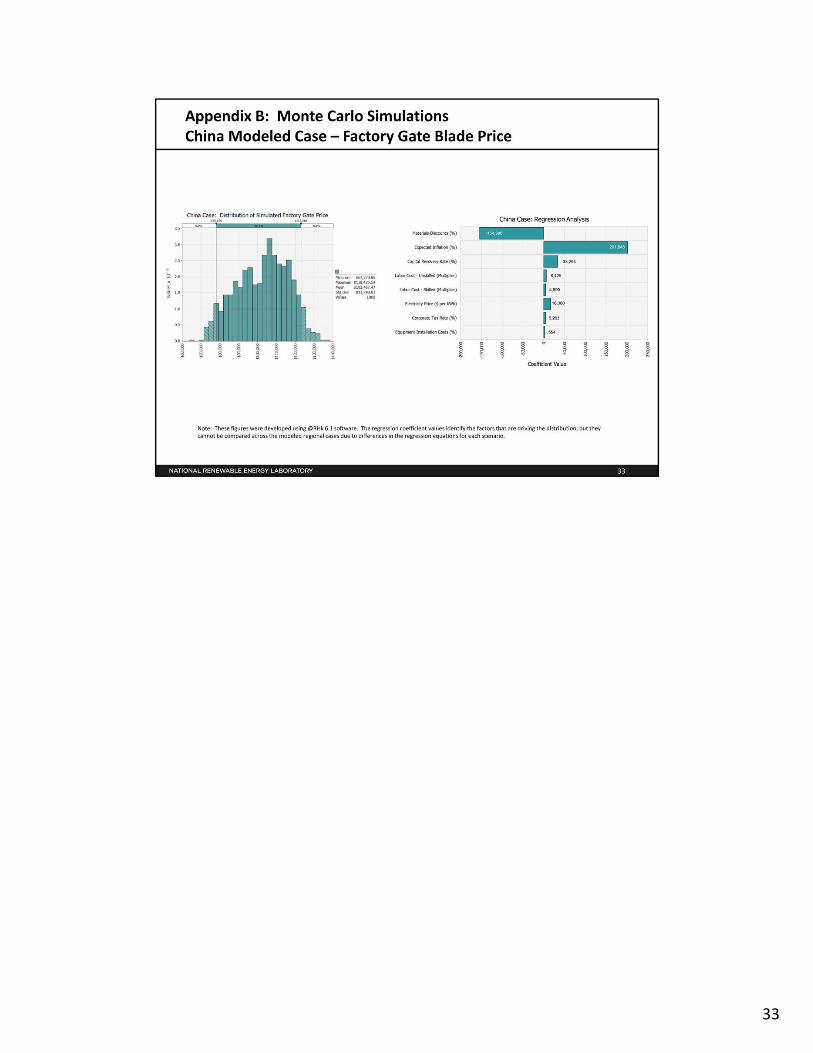
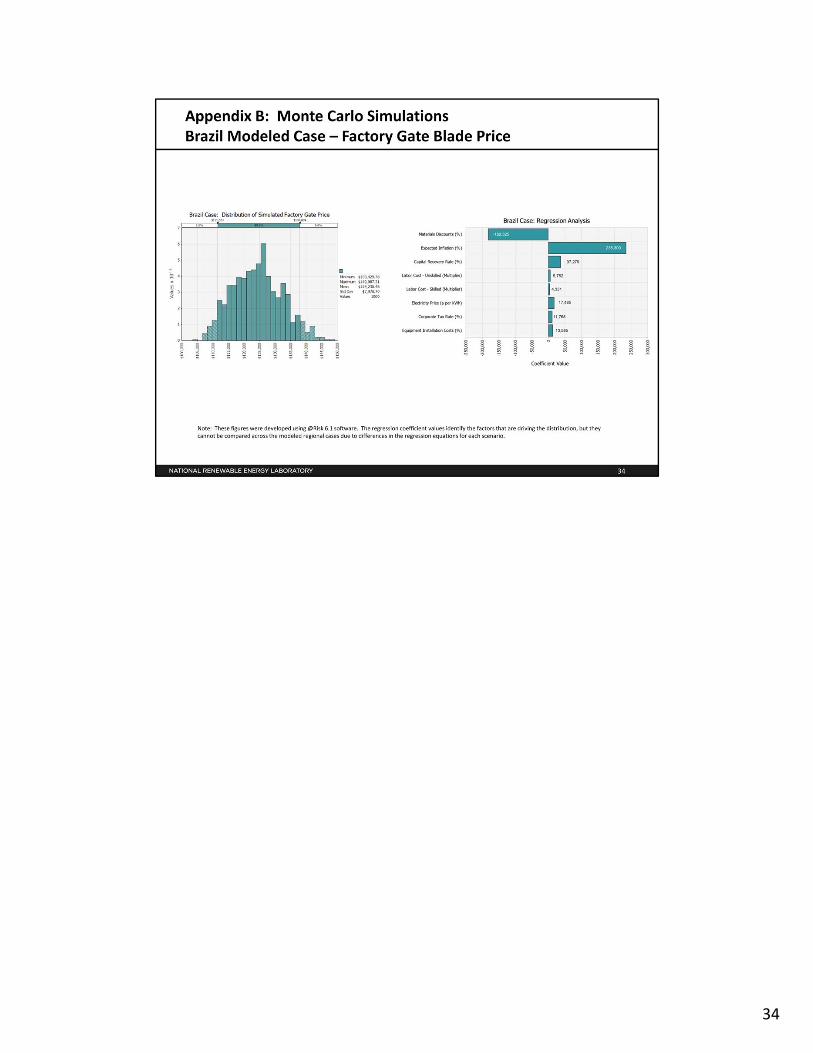
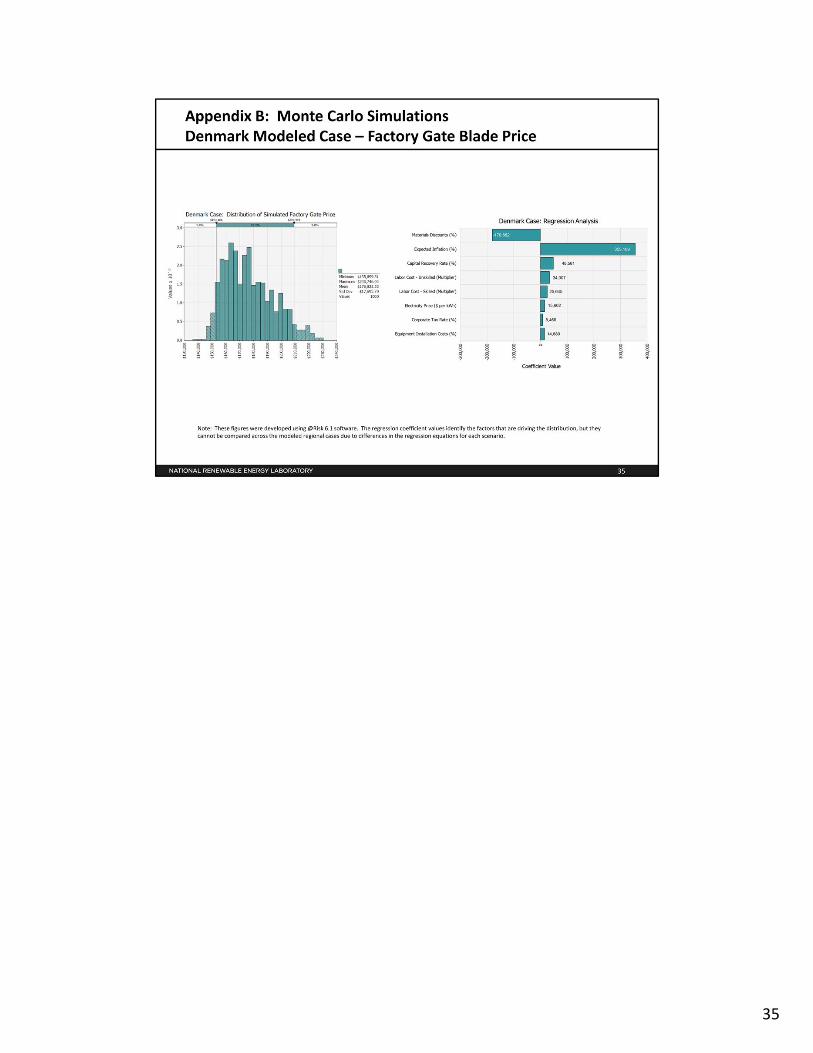
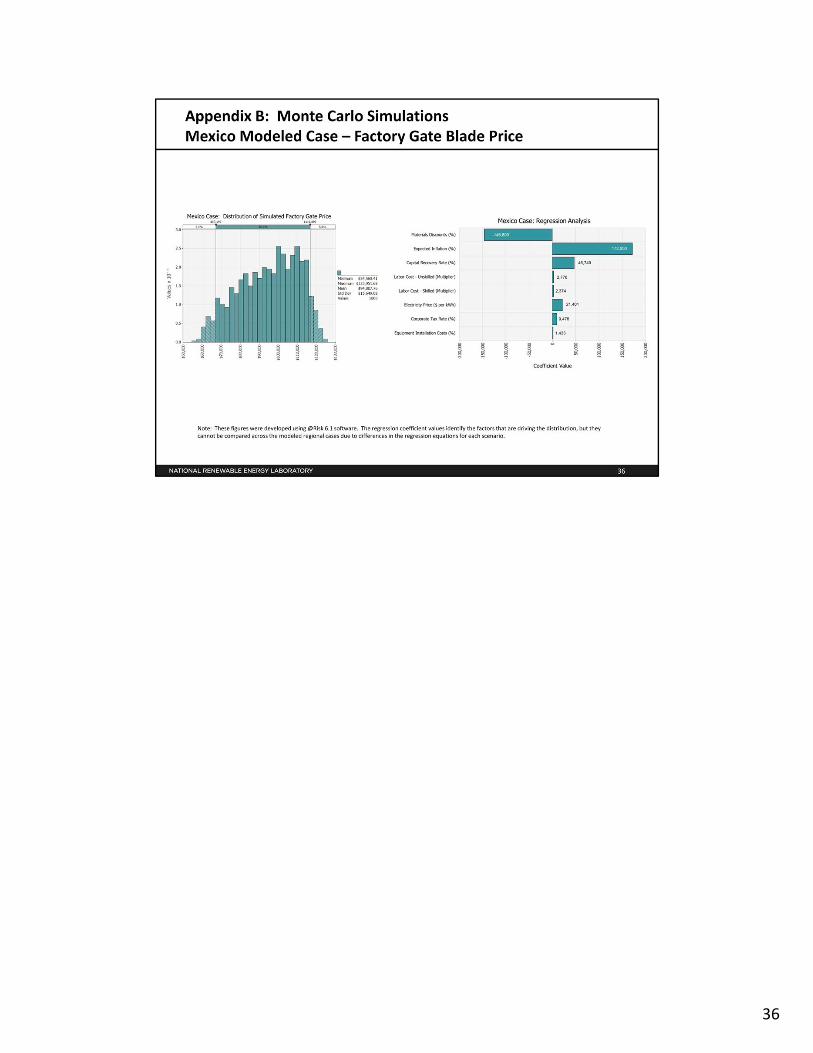
Based on our analysis of manufacturing costs, as calculated at the factory gate, we conclude that materials and labor are the most significant factors that differentiate blade costs among regions. The cost of capital, which is reflected in the margin requirements, also influences disparities in factory gate prices, but to a lesser extent than materials and labor. In the U.S. case analyzed, materials and labor costs account for 53% and 21% of the factory gate price, respectively (see slide 17). Due to uncertainties associated with materials pricing differences, we used power purchasing parity ratios to inform the input ranges of the uncertainty analysis. Factors affecting regional materials prices may include manufacturers’ economies of scale, buyers’ leverage over suppliers, brand recognition, and quality considerations. The values listed in the figure represent the mean expected values from an uncertainty analysis using Monte Carlo simulations, and the error bars denote 90% confidence for the selected model inputs (see Appendices for more information).
Due to its proximity to the United States and lower labor costs than many other regions, we included a Mexico scenario in this analysis. Unlike the other regions analyzed, however, we are not aware of significant blade manufacturing in Mexico at this time – in 2012, for example, the United States imported less than $5 million of blades and hubs from Mexico compared to approximately $145 million, $430 million, and $105 million from China, Brazil, and Denmark, respectively. In this context, our analysis of Mexico is differentiated from the other regional scenarios, and we consider it to be a longer‐term case. Our finding of possible low cost blade manufacturing opportunities in Mexico aligns with other analyses about cost competitive manufacturing in Mexico for a number of industries (BCG 2012). The limited availability of infrastructure, skilled workers, and suppliers supporting the production of blades, in addition to concerns about the ease of doing business (e.g., safety concerns), however, may limit Mexico’s ability to rapidly scale‐up wind turbine blade manufacturing in the near‐term.
16

Using the scaling factors that Sandia National Laboratories developed in partnership with industry, our modeling indicates that as blade sizes increase, labor costs become less significant. As shown in the figure on the right, labor costs become a substantially lower share of factory gate prices as blade sizes increase from 35 meters to 100 meters – thereby decreasing overseas manufacturing advantages, and introducing potential U.S. manufacturing opportunities. It is possible that step functions in these costs may occur, particularly for materials, as advancements in larger blades are developed, but the general relationships illustrated in the figure on the right will likely persist. Over the past 30 years, blade sizes have increased 6‐fold (see slide 19), and this trend is continuing since turbines with larger blades and higher hub heights are often better designed for cost effective deployment in lower wind speed environments (IMS Research 2013). In addition to increasing U.S.‐based manufacturing opportunities, larger blade sizes hold promise to significantly increase downstream domestic market opportunities for wind power since they may more effectively generate power in regions with lower wind speed resources.
17
18

Transportation considerations are becoming more important as blade sizes continue to increase. In the 1980s, wind turbine blades were typically between 5–15 meters in length. By 2010, average blade sizes had grown to 40–43.5 meters. And today, some blade lengths are much greater than 45 meters (Caduff, et al. 2012). As blade sizes have grown, so havethe challenges for shipping and logistics providers who must navigate the constraints of tunnels, overpasses, and available turning radius areas. For example, today’s 43‐meter blades require turning radius areas of about 40–46 meters. Trucking companies must sometimes add soil, aggregate, and culverts to expand cornering areas when transporting blades, especially on small rural roads. In some cases, companies must also temporarily remove road signs. Common width and height restrictions on U.S. roadways are about 4 meters and 4.3 meters, respectively (Dvorak 2011). Generally, it can be more difficult to move large dimensional shipments like blades in areas with older infrastructure such as the Northeastern United States.
In addition to infrastructure constraints, logistics companies must carefully synchronize the delivery of wind equipment to deployment sites to effectively manage overall project costs. Logistics experts must assess the trade‐offs of using different modes of transport (trucking, rail, barge, and ocean freight), incurring local expenses for permitting and police escorts, and balancing well‐coordinated deliveries for all turbine components. Local factors such as wait times for permitting and police escorts, and mechanical issues like truck breakdowns can also affect transport costs and planning.
19

Limited information is published about the transport costs for wind equipment. The price ranges presented in the table are common for transporting today’s utility‐scale blades designed for land‐based turbines in the United States. They do not include high‐end prices that occur with market distortions such as demand spikes tied to policy schedules or for addressing unique project characteristics. Because costs for these dimensional shipments vary on account of route selections, blade technologies (i.e., size and weight considerations), and the supply and demand for specialized transport equipment and skilled laborers, logistics providers often generate pricing quotations through individual consultations. Transporting some large blade types, for example, may require temporaryroad and/or rail lane closures, and ground construction to accommodate loading and intermediary storage. Different modes of transport also have different risk profiles and attributes; for instance, shipping blades long distances via barge is often cheaper than using trucking, but it is slower. When using rail, costs can vary depending on volume (unit trains typically include at least 30 rail cars) and whether a company owns its rail equipment orleases from a railroad company. Overall permitting costs are often lower with rail transport, but infrastructure constraints along specific rail routes can increase costs. For every mode of transportation, fuel prices and distance affect total transport costs. With these considerations in mind, the blade transport costs listed in the table provide approximations of common pricing in the United States.
20
21

This map illustrates viable transportation routes for moving wind turbine blades from U.S.‐based manufacturers (red dots) and import terminals (black stars) for overseas‐based manufacturers for wind power deployments in Texas and Iowa (yellow stars). The largest wind power plant in Iowa is located near the town of Massena, and we use this location for one of our case studies of landed costs–i.e., the cost of blades delivered to project sites–for blades manufactured in various locations. The other end‐market scenario we analyze is Horse Hollow, Texas, which is located near the town of Abilene. As noted on slide 20, producers of blades generally prefer trucking to transport blades if manufacturing facilities are within 500 miles of project sites, and the red ring around Massena, Iowa, indicates a 500 mile trucking distance. The shape of the ring is not circular because it is calculated from available road networks, as opposed to Euclidean distances. To determine likely transport routes for each case, we used a database from the U.S. Department of Homeland Security, filtering for infrastructure constraints such as low overpasses, bridges, and tunnels.
22

Using the route selections mapped on the previous slide, this figure represents the estimated landed costs for blades delivered to Massena, Iowa from manufacturing locations in the United States, China, Brazil, and Mexico. We arrived at these estimates by combining our assessment of transport costs with our analysis of regional factory gate blade prices (see slide 16). Our modeling shows that for turbine deployments in locations like Iowa, the United States is a cost competitive manufacturing location compared to China and Brazil due to shipping costs. The Mexico scenario highlights potential longer‐term risks to U.S.‐based blade manufacturing opportunities on account of both low cost labor and the proximity to U.S. end‐markets. Yet, as described earlier, the costs of the Mexico scenario are less certain due to the lack of existing industry production capacity.Overall, the figure illustrates that while the United States is at a cost disadvantage in terms of factory gate blade prices, blades manufactured in the United States are competitive if deployment occurs near production facilities and far from ports. This detailed analysis aligns with other market reporting that describes the co‐location of wind manufacturing in regions with significant deployment, and the general trend of capital flows (i.e., foreign direct investment), as opposed to product flows, in the global wind industry (Kirkegaard2009). Cost analysis provides insights about this key competitiveness driver, though companies often weigh many other factors when making factory location decisions. Issues such as the ease of doing business, supply‐chain relationships, and policy support are among other important considerations, and Slide 26 provides more information about qualitative factors.
23

Similar to the previous slide, this figure illustrates the modeled landed costs for blades manufactured in four different regions for turbine deployments in central Texas. Compared to manufacturing facilities in China and Brazil, our analysis shows that U.S.‐based manufacturing facilities may be cost competitive if U.S. turbine deployments are occurring near production facilities. This Texas end‐market scenario, when compared to the Iowa end‐market scenario on Slide 23, also illustrates that U.S. manufacturing opportunities may be more competitive in the middle of the country if deployments are proximal to production facilities. Again, costs of the Mexico case are less certain due to limited industry experience, but we present it for comparison purposes due to its proximity to U.S. end‐markets. While our modeling illustrates the potential for cost competitive U.S. manufacturing to serve select markets in Texas, the analysis also identifies Mexico as a possible low cost provider of blades in the longer‐term. The figures in Slides 16, 17, 23 and 24 show that materials prices, manufacturing labor costs, and transportation considerations largely drive landed blade costs.
24

25
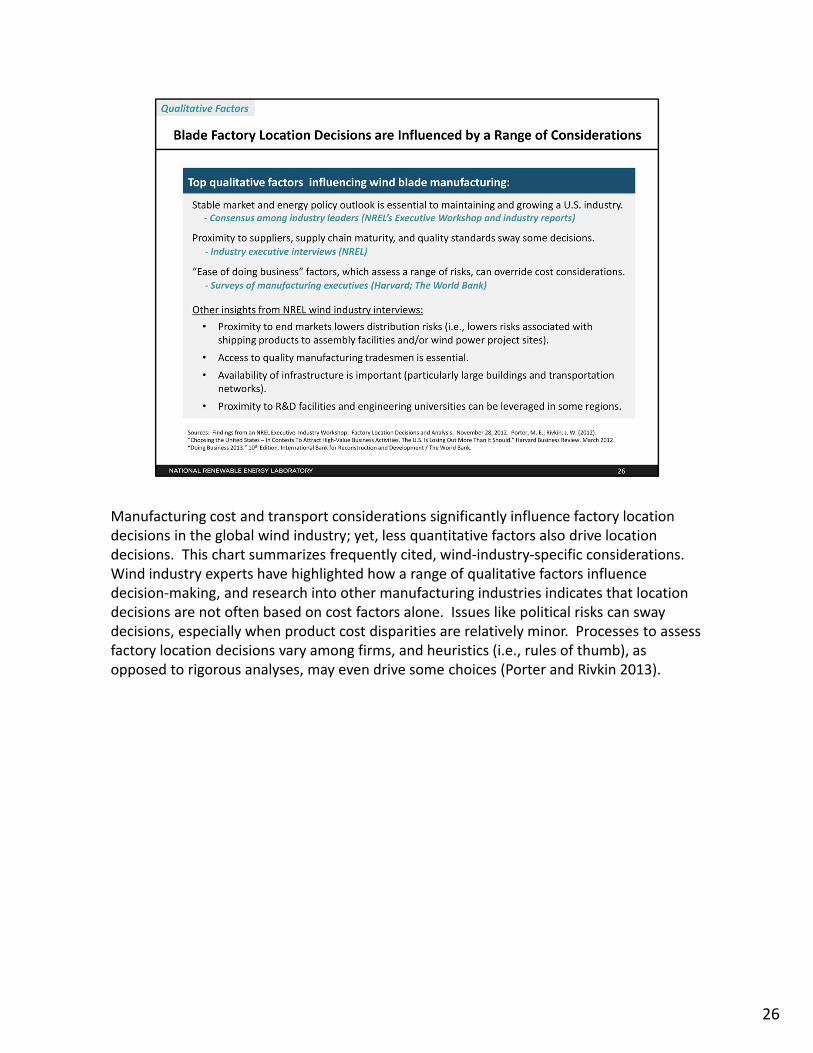
Manufacturing cost and transport considerations significantly influence factory location decisions in the global wind industry; yet, less quantitative factors also drive location decisions. This chart summarizes frequently cited, wind‐industry‐specific considerations. Wind industry experts have highlighted how a range of qualitative factors influence decision‐making, and research into other manufacturing industries indicates that location decisions are not often based on cost factors alone. Issues like political risks can sway decisions, especially when product cost disparities are relatively minor. Processes to assess factory location decisions vary among firms, and heuristics (i.e., rules of thumb), as opposed to rigorous analyses, may even drive some choices (Porter and Rivkin 2013).
26

27
28

29

30

31

32
33
34
35
36