supply chain barometer 2012 insights on supply chain agility
TRANSCRIPT

Supply Chain Barometer 2012Insights on Supply Chain AgilityFluctuating demand and market uncertainty: How to meet the challenge?
in collaboration with:
A shift in supply chain paradigm p. 3
Demand and market uncertainty confirmed as a key challenge p. 5
Causes of fluctuations: usual suspects and growing concerns p. 6
Ability to deal with demand & market uncertainty p. 10
7 Initiatives to improve Supply Chain Agility p. 13
About the survey p. 33
Our business up and down cycles used to last 2 to 3 years. Now they last only 2 to 3 months. This exposes our production to huge variations.
A shift in supply chain paradigm
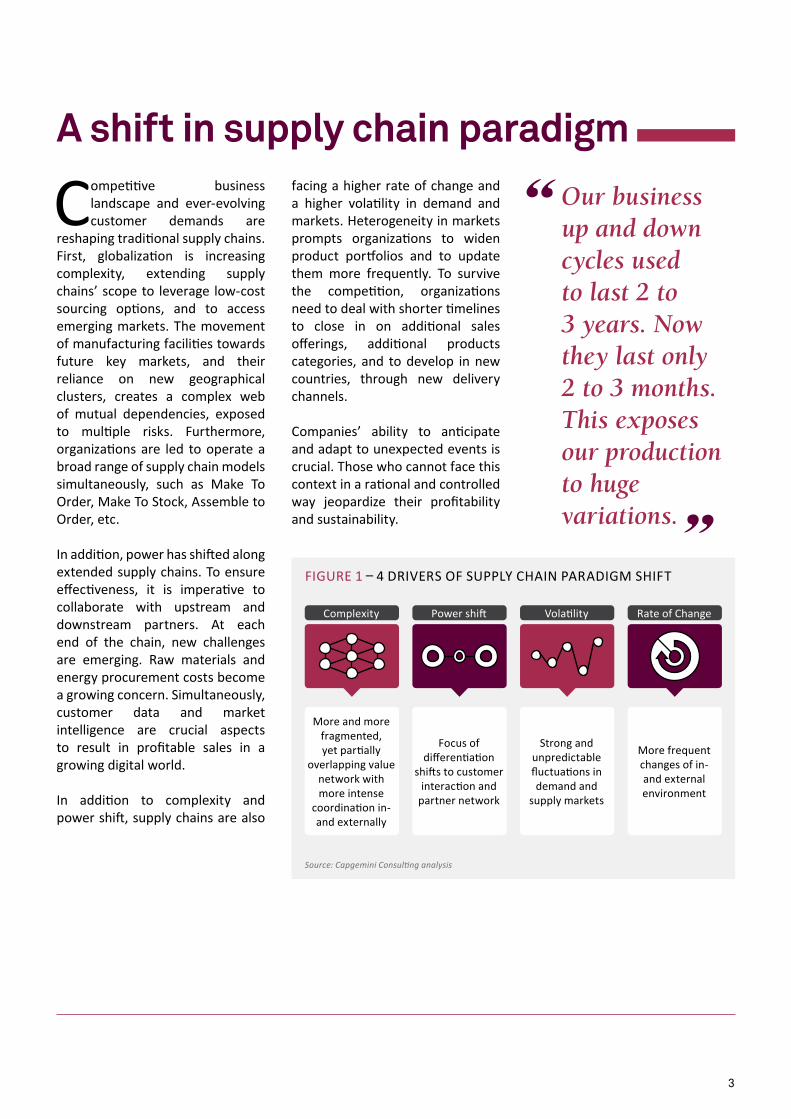
Competitive business landscape and ever-evolving customer demands are
reshaping traditional supply chains. First, globalization is increasing complexity, extending supply chains’ scope to leverage low-cost sourcing options, and to access emerging markets. The movement of manufacturing facilities towards future key markets, and their reliance on new geographical clusters, creates a complex web of mutual dependencies, exposed to multiple risks. Furthermore, organizations are led to operate a broad range of supply chain models simultaneously, such as Make To Order, Make To Stock, Assemble to Order, etc.
In addition, power has shifted along extended supply chains. To ensure effectiveness, it is imperative to collaborate with upstream and downstream partners. At each end of the chain, new challenges are emerging. Raw materials and energy procurement costs become a growing concern. Simultaneously, customer data and market intelligence are crucial aspects to result in profitable sales in a growing digital world.
In addition to complexity and power shift, supply chains are also
facing a higher rate of change and a higher volatility in demand and markets. Heterogeneity in markets prompts organizations to widen product portfolios and to update them more frequently. To survive the competition, organizations need to deal with shorter timelines to close in on additional sales offerings, additional products categories, and to develop in new countries, through new delivery channels.
Companies’ ability to anticipate and adapt to unexpected events is crucial. Those who cannot face this context in a rational and controlled way jeopardize their profitability and sustainability.
Source: Capgemini Consulting analysis
Volatility
Strong and unpredictable fluctuations in demand and
supply markets
Rate of Change
More frequent changes of in- and external environment
Complexity
More and more fragmented, yet partially
overlapping value network with more intense
coordination in- and externally
Power shift
Focus of differentiation
shifts to customer interaction and
partner network
FIguRe 1 – 4 dRIVeRS OF SuPPly CHAIn PARAdIgM SHIFT
3
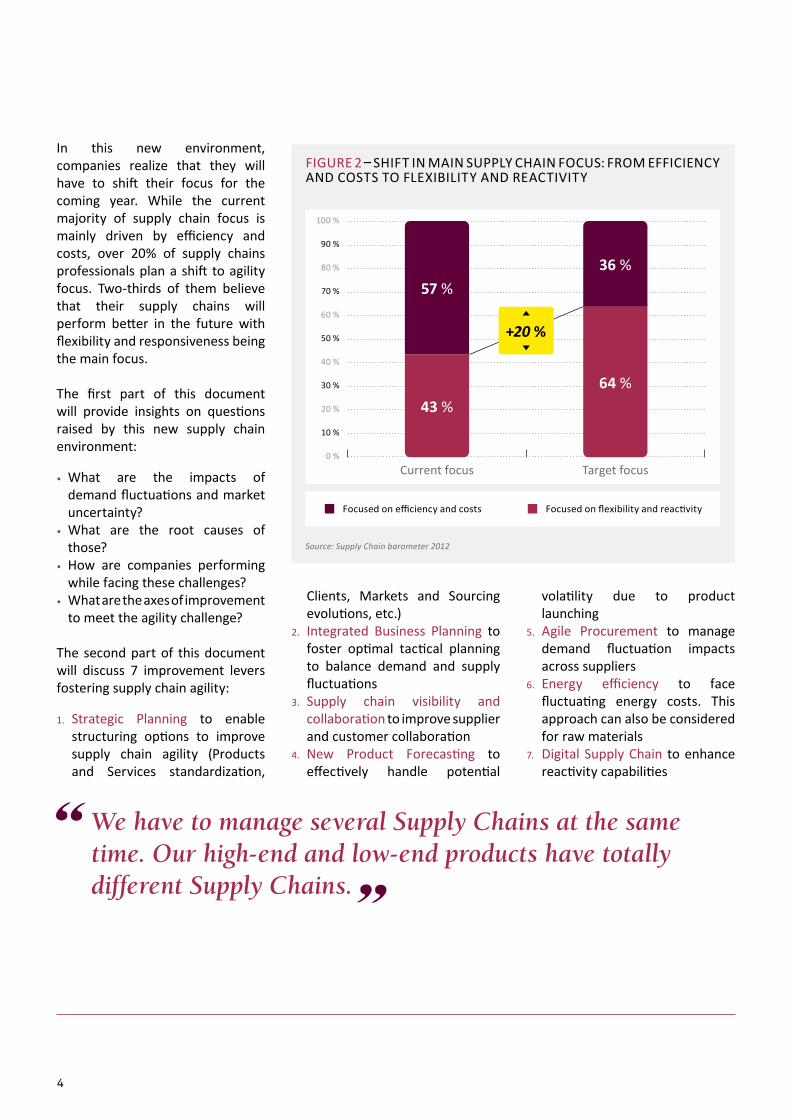
In this new environment, companies realize that they will have to shift their focus for the coming year. While the current majority of supply chain focus is mainly driven by efficiency and costs, over 20% of supply chains professionals plan a shift to agility focus. Two-thirds of them believe that their supply chains will perform better in the future with flexibility and responsiveness being the main focus.
The first part of this document will provide insights on questions raised by this new supply chain environment:
• What are the impacts of demand fluctuations and market uncertainty?
• What are the root causes of those?
• How are companies performing while facing these challenges?
• What are the axes of improvement to meet the agility challenge?
The second part of this document will discuss 7 improvement levers fostering supply chain agility:
1. Strategic Planning to enable structuring options to improve supply chain agility (Products and Services standardization,
We have to manage several Supply Chains at the same time. Our high-end and low-end products have totally different Supply Chains.
Clients, Markets and Sourcing evolutions, etc.)
2. Integrated Business Planning to foster optimal tactical planning to balance demand and supply fluctuations
3. Supply chain visibility and collaboration to improve supplier and customer collaboration
4. new Product Forecasting to effectively handle potential
volatility due to product launching
5. Agile Procurement to manage demand fluctuation impacts across suppliers
6. energy efficiency to face fluctuating energy costs. This approach can also be considered for raw materials
7. digital Supply Chain to enhance reactivity capabilities
Source: Supply Chain barometer 2012
Focused on efficiency and costs Focused on flexibility and reactivity
100 %
90 %
80 %
70 %
60 %
50 %
40 %
30 %
20 %
10 %
0 %
57 %
43 %
36 %
64 %
Current focus Target focus
+20 %
FIguRe 2 – SHIFT In MAIn SuPPly CHAIn FOCuS: FROM eFFICIenCy And COSTS TO FlexIBIlITy And ReACTIVITy
4
Demand and market uncertainty confirmed as a key challenge
Over 250 supply chain professionals answered our survey “2012 Supply
Chain Barometer”. They assessed the impact of demand variation and market contingencies on their revenues, inventories, lead times, service levels, and relationships with suppliers. They clearly confirmed demand and market uncertainty as being key drivers for supply chain performance.
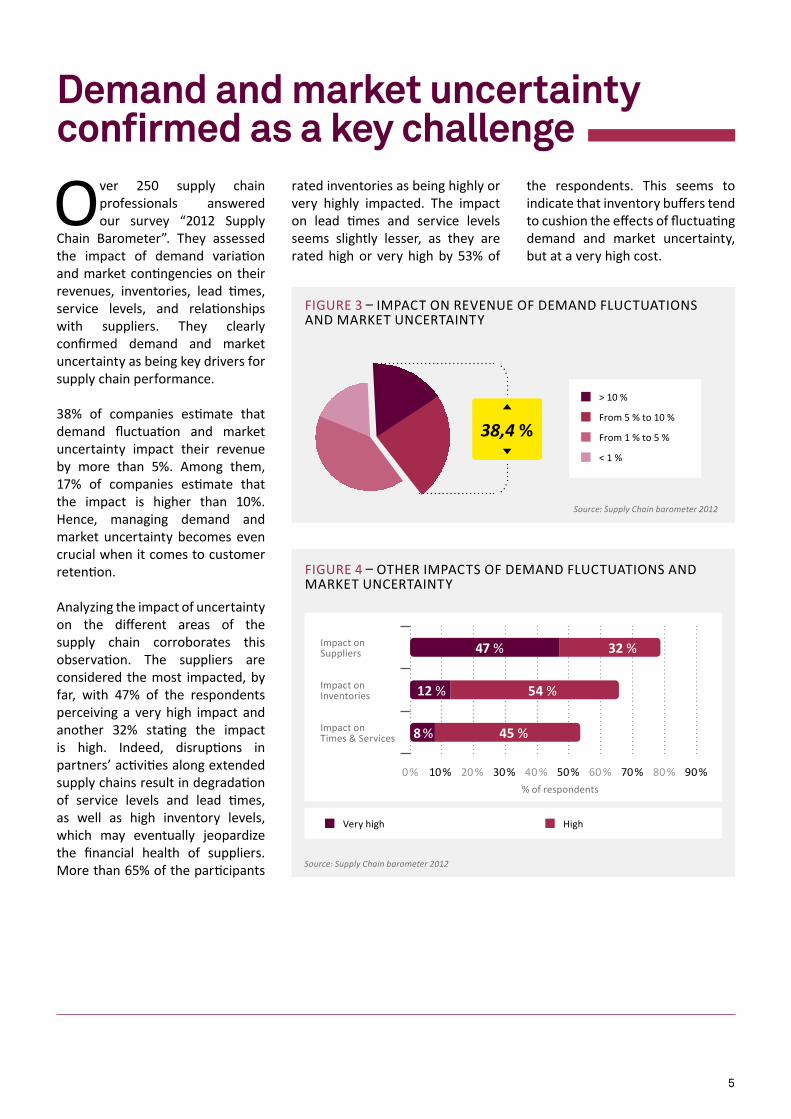
38% of companies estimate that demand fluctuation and market uncertainty impact their revenue by more than 5%. Among them, 17% of companies estimate that the impact is higher than 10%. Hence, managing demand and market uncertainty becomes even crucial when it comes to customer retention.
Analyzing the impact of uncertainty on the different areas of the supply chain corroborates this observation. The suppliers are considered the most impacted, by far, with 47% of the respondents perceiving a very high impact and another 32% stating the impact is high. Indeed, disruptions in partners’ activities along extended supply chains result in degradation of service levels and lead times, as well as high inventory levels, which may eventually jeopardize the financial health of suppliers. More than 65% of the participants
rated inventories as being highly or very highly impacted. The impact on lead times and service levels seems slightly lesser, as they are rated high or very high by 53% of
the respondents. This seems to indicate that inventory buffers tend to cushion the effects of fluctuating demand and market uncertainty, but at a very high cost.
> 10 %
< 1 %
From 5 % to 10 %
From 1 % to 5 %
Source: Supply Chain barometer 2012
38,4 %
FIguRe 3 – IMPACT On ReVenue OF deMAnd FluCTuATIOnS And MARkeT unCeRTAInTy
Source: Supply Chain barometer 2012
90 %80 %70 %60 %50 %40 %30 %20 %10 %0 %
Impact on Suppliers
% of respondents
Impact on Inventories
Impact onTimes & Services
47 %
12 %
8 %
32 %
54 %
45 %
Very high High
FIguRe 4 – OTHeR IMPACTS OF deMAnd FluCTuATIOnS And MARkeT unCeRTAInTy
5
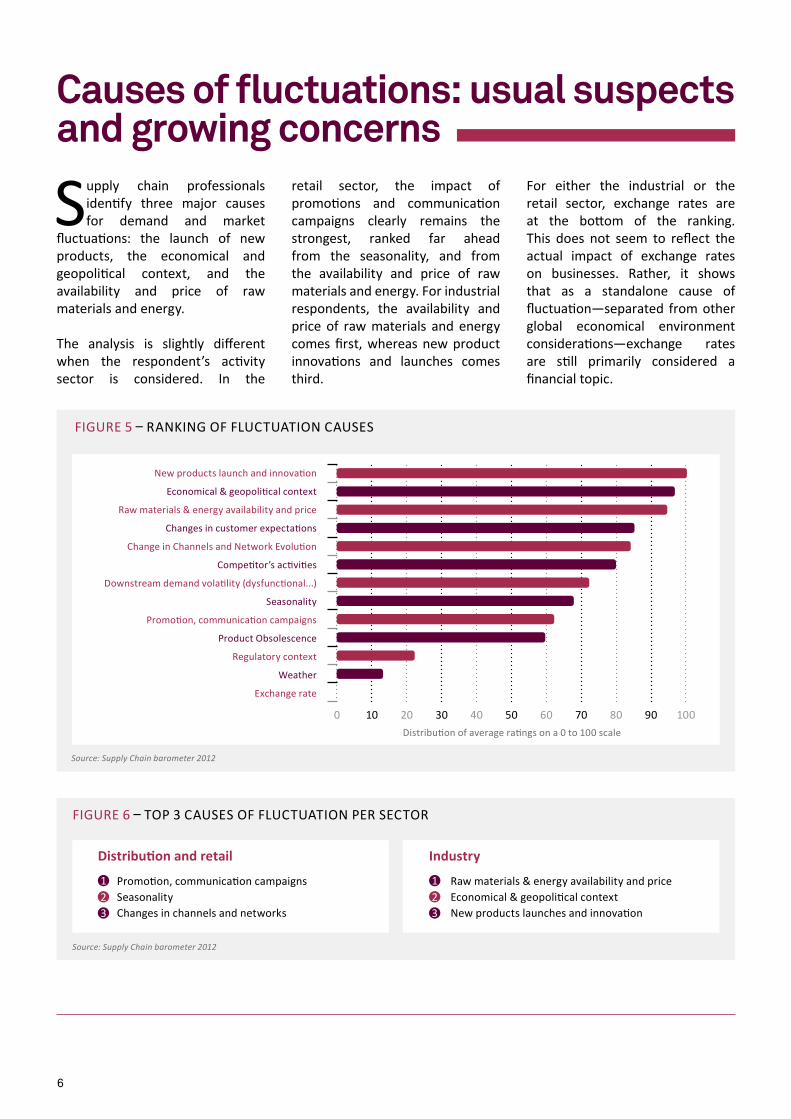
Causes of fluctuations: usual suspects and growing concerns
Supply chain professionals identify three major causes for demand and market
fluctuations: the launch of new products, the economical and geopolitical context, and the availability and price of raw materials and energy.
The analysis is slightly different when the respondent’s activity sector is considered. In the
retail sector, the impact of promotions and communication campaigns clearly remains the strongest, ranked far ahead from the seasonality, and from the availability and price of raw materials and energy. For industrial respondents, the availability and price of raw materials and energy comes first, whereas new product innovations and launches comes third.
For either the industrial or the retail sector, exchange rates are at the bottom of the ranking. This does not seem to reflect the actual impact of exchange rates on businesses. Rather, it shows that as a standalone cause of fluctuation—separated from other global economical environment considerations—exchange rates are still primarily considered a financial topic.
FIguRe 6 – TOP 3 CAuSeS OF FluCTuATIOn PeR SeCTOR
Source: Supply Chain barometer 2012
Distribution and retail Industry
Promotion, communication campaignsSeasonalityChanges in channels and networks
123
Raw materials & energy availability and priceeconomical & geopolitical contextnew products launches and innovation
123
90 10080706050403020100
new products launch and innovation
economical & geopolitical context
Raw materials & energy availability and price
Changes in customer expectations
Change in Channels and network evolution
Competitor’s activities
downstream demand volatility (dysfunctional...)
Seasonality
Promotion, communication campaigns
Product Obsolescence
Regulatory context
Weather
exchange rate
distribution of average ratings on a 0 to 100 scale
Source: Supply Chain barometer 2012
FIguRe 5 – RAnkIng OF FluCTuATIOn CAuSeS
6
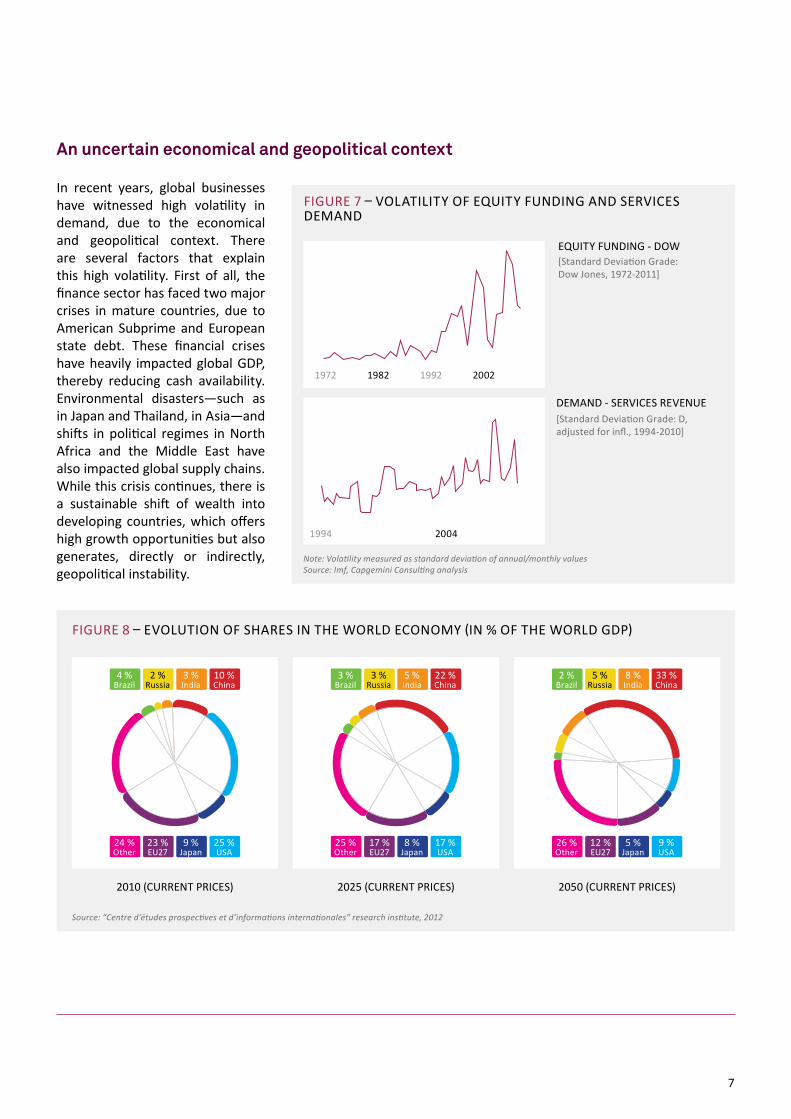
An uncertain economical and geopolitical context
In recent years, global businesses have witnessed high volatility in demand, due to the economical and geopolitical context. There are several factors that explain this high volatility. First of all, the finance sector has faced two major crises in mature countries, due to American Subprime and european state debt. These financial crises have heavily impacted global gdP, thereby reducing cash availability. environmental disasters—such as in Japan and Thailand, in Asia—and shifts in political regimes in north Africa and the Middle east have also impacted global supply chains. While this crisis continues, there is a sustainable shift of wealth into developing countries, which offers high growth opportunities but also generates, directly or indirectly, geopolitical instability.
FIguRe 7 – VOlATIlITy OF equITy FundIng And SeRVICeS deMAnd
Note: Volatility measured as standard deviation of annual/monthly valuesSource: Imf, Capgemini Consulting analysis
equITy FundIng - dOW
deMAnd - SeRVICeS ReVenue
[Standard deviation grade: dow Jones, 1972-2011]
[Standard deviation grade: d, adjusted for infl., 1994-2010]
20041994
1972 19921982 2002
FIguRe 8 – eVOluTIOn OF SHAReS In THe WORld eCOnOMy (In % OF THe WORld gdP)
2025 (CuRRenT PRICeS) 2050 (CuRRenT PRICeS)
Source: “Centre d’études prospectives et d’informations internationales” research institute, 2012
4 %Brazil
2 %Russia
3 %India
10 %China
24 %Other
23 %eu27
25 %uSA
9 %Japan
3 %Brazil
3 %Russia
5 %India
22 %China
25 %Other
17 %eu27
17 %uSA
8 %Japan
2 %Brazil
5 %Russia
8 %India
33 %China
26 %Other
12 %eu27
9 %uSA
5 %Japan
2010 (CuRRenT PRICeS)
7
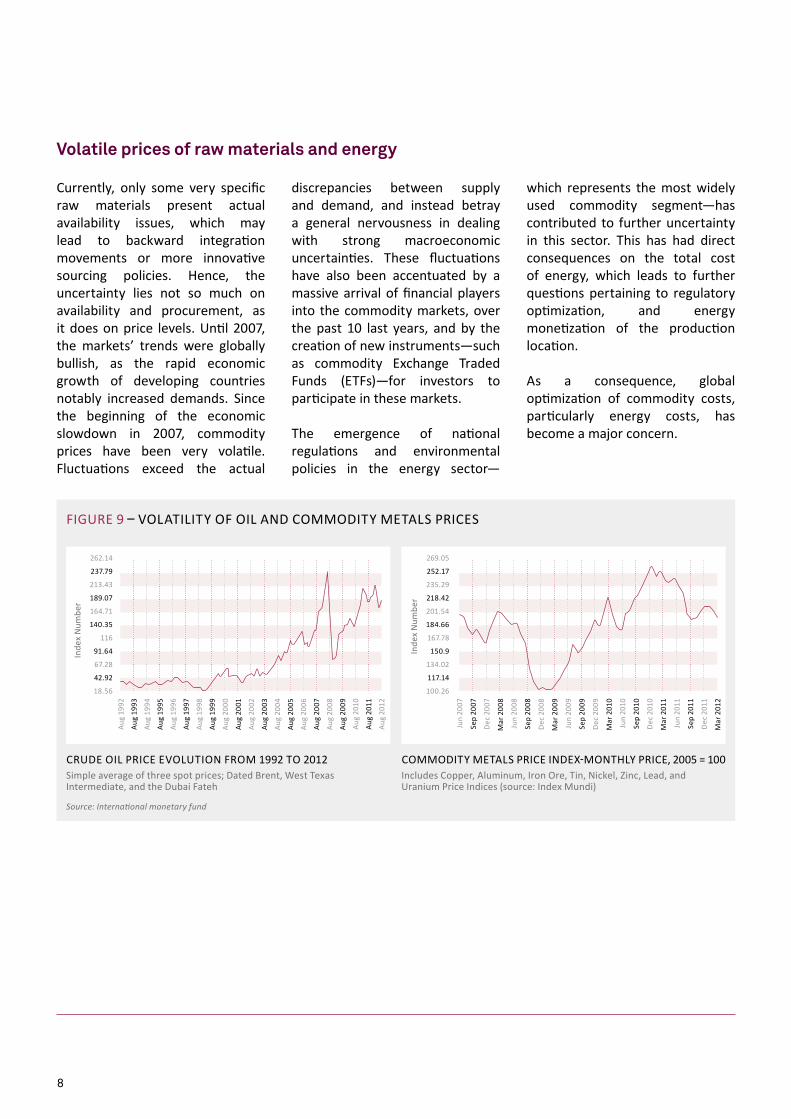
Currently, only some very specific raw materials present actual availability issues, which may lead to backward integration movements or more innovative sourcing policies. Hence, the uncertainty lies not so much on availability and procurement, as it does on price levels. until 2007, the markets’ trends were globally bullish, as the rapid economic growth of developing countries notably increased demands. Since the beginning of the economic slowdown in 2007, commodity prices have been very volatile. Fluctuations exceed the actual
Volatile prices of raw materials and energy
discrepancies between supply and demand, and instead betray a general nervousness in dealing with strong macroeconomic uncertainties. These fluctuations have also been accentuated by a massive arrival of financial players into the commodity markets, over the past 10 last years, and by the creation of new instruments—such as commodity exchange Traded Funds (eTFs)—for investors to participate in these markets.
The emergence of national regulations and environmental policies in the energy sector—
which represents the most widely used commodity segment—has contributed to further uncertainty in this sector. This has had direct consequences on the total cost of energy, which leads to further questions pertaining to regulatory optimization, and energy monetization of the production location.
As a consequence, global optimization of commodity costs, particularly energy costs, has become a major concern.
Inde
x n
umbe
r
FIguRe 9 – VOlATIlITy OF OIl And COMMOdITy MeTAlS PRICeS
Source: International monetary fund
CRude OIl PRICe eVOluTIOn FROM 1992 TO 2012Simple average of three spot prices; dated Brent, West Texas Intermediate, and the dubai Fateh
Inde
x n
umbe
r
262.14
237.79
213.43
189.07
164.71
140.35
116
91.64
67.28
42.92
18.56
269.05
252.17
235.29
218.42
201.54
184.66
167.78
150.9
134.02
117.14
100.26
Jun
2007
Sep
2007
dec
200
7
Jun
2008
Sep
2008
dec
200
8
Mar
200
9
Mar
200
8
Jun
2009
Sep
2009
dec
200
9
Mar
201
0
Jun
2010
Sep
2010
dec
201
0
Mar
201
1
Jun
2011
Sep
2011
dec
201
1
Mar
201
2
Aug
1992
Aug
1993
Aug
1994
Aug
1995
Aug
1996
Aug
1997
Aug
1998
Aug
1999
Aug
2000
Aug
2001
Aug
2002
Aug
2003
Aug
2004
Aug
2005
Aug
2006
Aug
2007
Aug
2008
Aug
2009
Aug
2010
Aug
2011
Aug
2012
COMMOdITy MeTAlS PRICe Index-MOnTHly PRICe, 2005 = 100Includes Copper, Aluminum, Iron Ore, Tin, nickel, Zinc, lead, and uranium Price Indices (source: Index Mundi)
8
In recent times, the pace of strategic innovation and required adaptation has accelerated significantly.
The music industry is an example of how enhanced innovation and digitization resulted in quicker adoption and shorter product lifecycles. For instance, it had taken music tapes 20 years to reach the mass market. digitization
Acceleration in New Product Launches and Innovation
accelerated the adoption cycle with Cds taking close to 12 years to reach the mass market, followed by MP3 formats taking close to 3 years. Today, the streaming music model has taken only 2 years to reach mass market status.
In the automotive industry, while timelines for model lifecycles have reduced, the number of segments
has increased rapidly, resulting in accelerated product development. For example, in europe, whereas Volkswagen had launched 7 new models in the 80’s, on 6 different passenger car segments, it has launched 23 new models across 11 segments over the past 10 years.
Product innovation and changing customer behaviors have led companies to develop multiple channels and to reconfigure their distribution networks. The most common evolution is of e-Business, which used to be viewed as “just another” channel to be served by already complex supply chains. In the retail industry, online sales—which are already 5-15% of total sales—are expected to grow up to 25-30%, reshuffling power amongst stakeholders. Taking advantage
Changes in Channels and Networks
of this direct channel, CPg businesses, such as danone Waters (evianChezVous), are starting to extend their business models from B2B to B2C. In the high-tech business segment, dell is making an opposite move from B2C to B2B, after facing a commoditization of the personal computer industry. To follow these evolutions, companies often need to consistently operate across multiple supply chain models such as Make to Order, Make to Stock, etc.
The effect of promotions becomes harder to forecast as their frequency increases.
Sales promotions multiplied over the past few years. For example, the share of revenue for promotions in the French supermarkets has grown from 13% to 20% in 10 years, and exceeds 50% for some products such as shower gels. In the uk, close to 50% of the revenue of medium and large supermarkets is generated through promotions. It is around 25% in Spain and Italy. At the same time, promotional mechanisms
Increased Focus on Promotions and Communication Campaigns
have become increasingly complex: “physical” promotional kits as well as virtual ones, cash back programs, targeted offers for loyalty cards holders, and coupons and special offers provided through multiple channels, including websites, email and social networks. At any given moment, up to one-fifth of a retailer’s references may be governed by two or more promotions.
Just like new products, promotions, too, are designed to create positive disruptions in sales levels. Therefore, just as it is the case with product launches, forecasting and effective market data collection are key processes in order to successfully deliver superior service to customers and high profit margins to shareholders.
9
Ability to deal with demand & market uncertainty
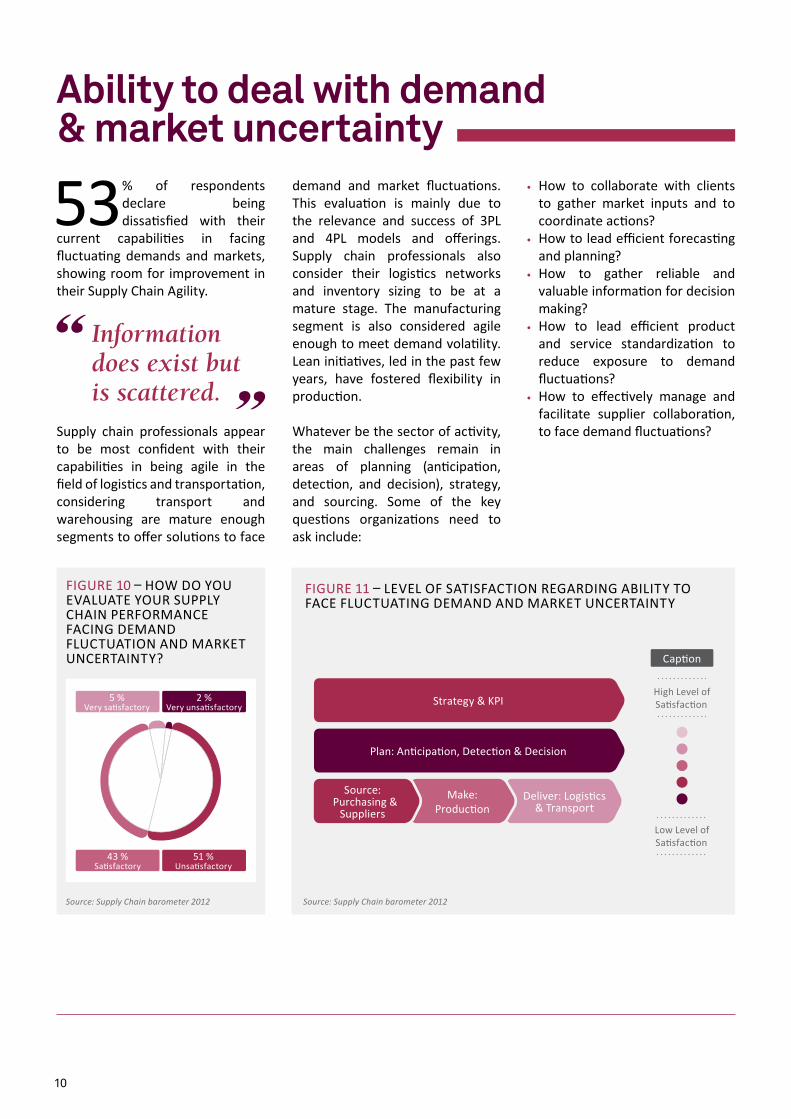
53% of respondents declare being dissatisfied with their
current capabilities in facing fluctuating demands and markets, showing room for improvement in their Supply Chain Agility.
Supply chain professionals appear to be most confident with their capabilities in being agile in the field of logistics and transportation, considering transport and warehousing are mature enough segments to offer solutions to face
Information does exist but is scattered.
demand and market fluctuations. This evaluation is mainly due to the relevance and success of 3Pl and 4Pl models and offerings. Supply chain professionals also consider their logistics networks and inventory sizing to be at a mature stage. The manufacturing segment is also considered agile enough to meet demand volatility. lean initiatives, led in the past few years, have fostered flexibility in production.
Whatever be the sector of activity, the main challenges remain in areas of planning (anticipation, detection, and decision), strategy, and sourcing. Some of the key questions organizations need to ask include:
Source: Supply Chain barometer 2012
FIguRe 10 – HOW dO yOu eVAluATe yOuR SuPPly CHAIn PeRFORMAnCe FACIng deMAnd FluCTuATIOn And MARkeT unCeRTAInTy?
5 %Very satisfactory
2 %Very unsatisfactory
43 %Satisfactory
51 %unsatisfactory
FIguRe 11 – leVel OF SATISFACTIOn RegARdIng ABIlITy TO FACe FluCTuATIng deMAnd And MARkeT unCeRTAInTy
Source: Supply Chain barometer 2012
Strategy & kPI
Plan: Anticipation, detection & decision
deliver: logistics& Transport
Make:Production
Source:Purchasing &
Suppliers
Caption
High level of Satisfaction
low level of Satisfaction
• How to collaborate with clients to gather market inputs and to coordinate actions?
• How to lead efficient forecasting and planning?
• How to gather reliable and valuable information for decision making?
• How to lead efficient product and service standardization to reduce exposure to demand fluctuations?
• How to effectively manage and facilitate supplier collaboration, to face demand fluctuations?
10
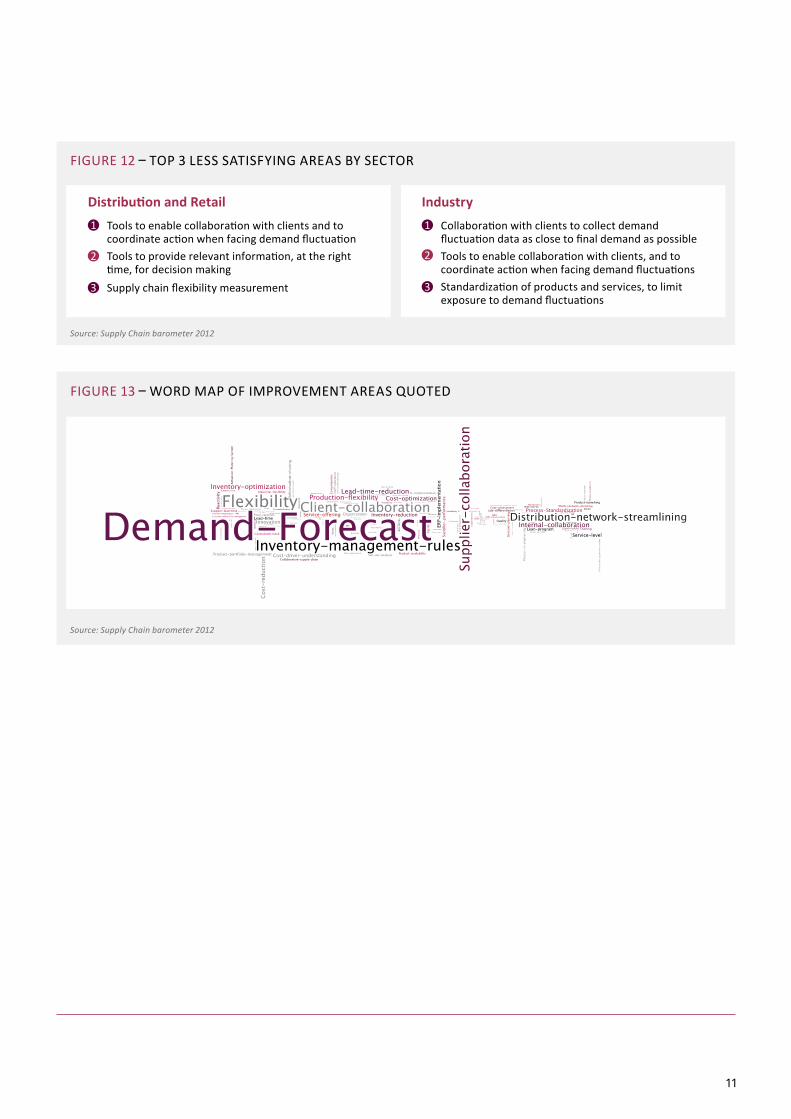
FIguRe 12 – TOP 3 leSS SATISFyIng AReAS By SeCTOR
Source: Supply Chain barometer 2012
Distribution and Retail IndustryTools to enable collaboration with clients and to coordinate action when facing demand fluctuationTools to provide relevant information, at the right time, for decision makingSupply chain flexibility measurement
1
2
3
Collaboration with clients to collect demand fluctuation data as close to final demand as possibleTools to enable collaboration with clients, and to coordinate action when facing demand fluctuationsStandardization of products and services, to limit exposure to demand fluctuations
1
2
3
FIguRe 13 – WORd MAP OF IMPROVeMenT AReAS quOTed
Source: Supply Chain barometer 2012
11
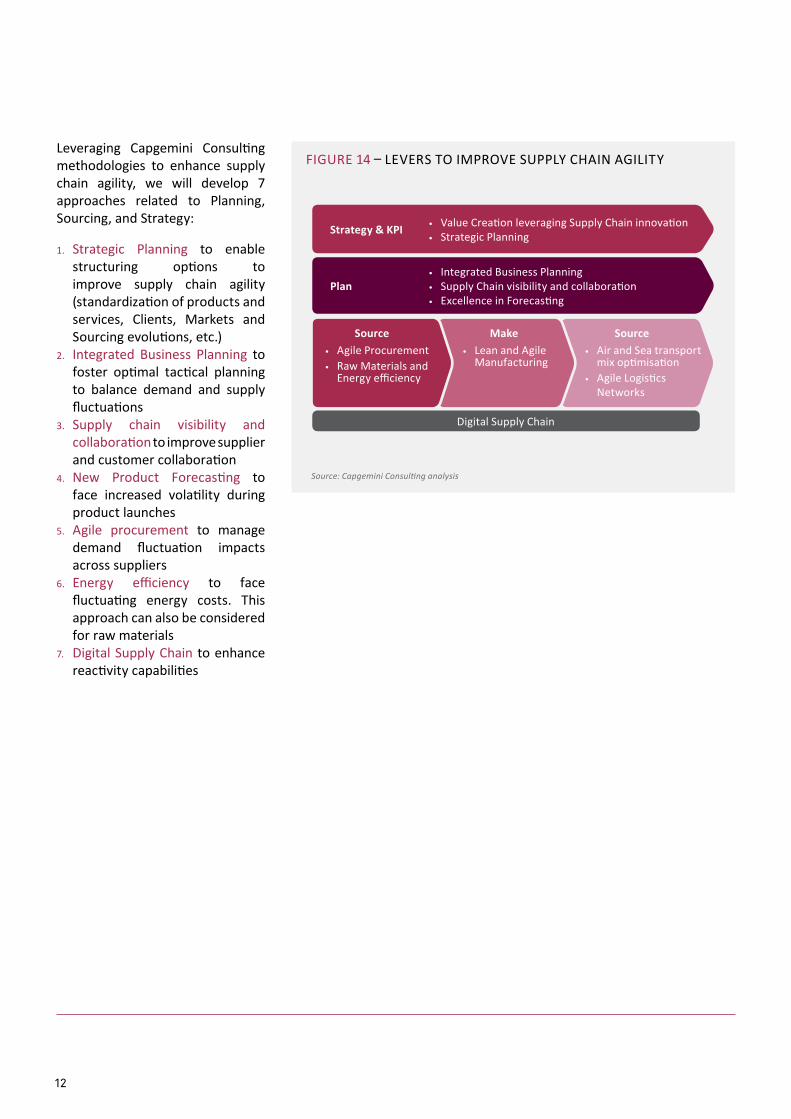
leveraging Capgemini Consulting methodologies to enhance supply chain agility, we will develop 7 approaches related to Planning, Sourcing, and Strategy:
1. Strategic Planning to enable structuring options to improve supply chain agility (standardization of products and services, Clients, Markets and Sourcing evolutions, etc.)
2. Integrated Business Planning to foster optimal tactical planning to balance demand and supply fluctuations
3. Supply chain visibility and collaboration to improve supplier and customer collaboration
4. new Product Forecasting to face increased volatility during product launches
5. Agile procurement to manage demand fluctuation impacts across suppliers
6. energy efficiency to face fluctuating energy costs. This approach can also be considered for raw materials
7. digital Supply Chain to enhance reactivity capabilities
FIguRe 14 – leVeRS TO IMPROVe SuPPly CHAIn AgIlITy
Source: Capgemini Consulting analysis
digital Supply Chain
Strategy & KPI
Plan
Source SourceMake
• Value Creation leveraging Supply Chain innovation• Strategic Planning
• Integrated Business Planning• Supply Chain visibility and collaboration• excellence in Forecasting
• Agile Procurement• Raw Materials and
energy efficiency
• Air and Sea transport mix optimisation
• Agile logistics networks
• lean and Agile Manufacturing
12
7 initiatives to improve supply chain agility
While in the past, strategic issues concerning supply chains could be
answered once every few years, today’s volatile environment requires most companies to set up Strategic Planning processes operated on a regular basis. Some e-Business companies operate strategic planning processes on a weekly basis.
In the past decade, companies have obtained from improvements in tactical planning. Sales and Operations Planning (S&OP), and, more recently, Integrated Business Planning (IBP), have enhanced capabilities to balance demand and supply. But some key questions surrounding the supply chain core operating model remain unique to these processes:
The Supply Chain function should be able to provide insights on strategic decisions’ impact on margin, and on assets utilization.
• Which target clients and markets should be addressed?
• Which optimal range of products should be sold? What is the optimal level of standardization?
• Which service offerings should be sold (such as order lead time, additional services, etc.)?
• Which sourcing, manufacturing, and distribution networks should be developed?
These questions, which set the framework for supply chain capabilities, are not always challenged on a regular basis, which leads to suboptimal situations. Some companies become unprofitable while dealing with large product and services portfolios. Other companies struggle to deliver highly demanding service offerings that
How often do you update your Strategic Planning?
1. Strategic Planning
require costly market reactivity and inventories even when customers do not necessarily always need it. excellence from S&OP to execution will never counterbalance such structural weaknesses. Companies that embrace higher complexity and costs than what customers are willing to pay for, are always defeated by competition that is focused, and that offers low-cost products. On the other hand, some successful companies are capable to develop quick responses to the market on profitable segments. Supply chain needs to be a part of the Strategic Planning process, both to model the impact of decisions made, and to propose innovation so as to reach new profitable markets.
13
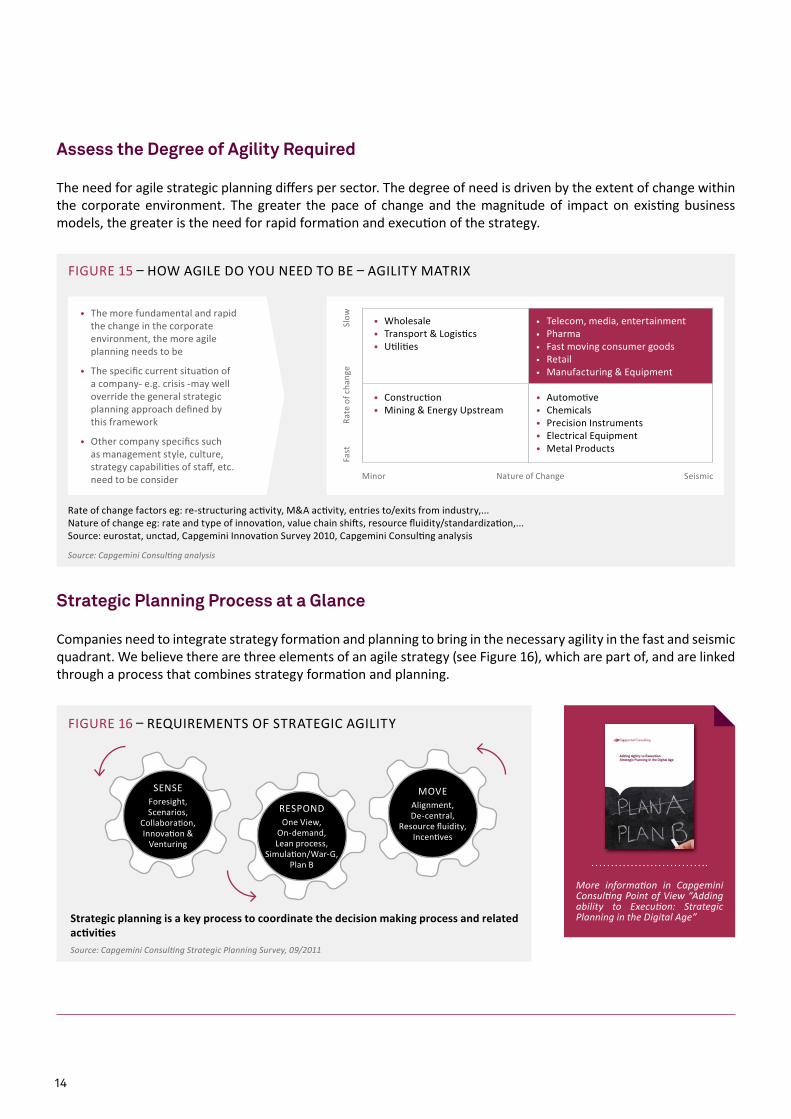
The need for agile strategic planning diff ers per sector. The degree of need is driven by the extent of change within the corporate environment. The greater the pace of change and the magnitude of impact on existi ng business models, the greater is the need for rapid formati on and executi on of the strategy.
Assess the Degree of Agility Required
Rate of change factors eg: re-structuring acti vity, M&A acti vity, entries to/exits from industry,...nature of change eg: rate and type of innovati on, value chain shift s, resource fl uidity/standardizati on,...Source: eurostat, unctad, Capgemini Innovati on Survey 2010, Capgemini Consulti ng analysis
nature of ChangeMinor
Slow
Rate
of c
hang
eFa
st
Seismic
• The more fundamental and rapid the change in the corporate environment, the more agile planning needs to be
• The specifi c current situati on of a company- e.g. crisis -may well override the general strategic planning approach defi ned by this framework
• Other company specifi cs such as management style, culture, strategy capabiliti es of staff , etc. need to be consider
• Wholesale• Transport & logisti cs• uti liti es
• Telecom, media, entertainment• Pharma• Fast moving consumer goods• Retail• Manufacturing & equipment
• Automoti ve• Chemicals• Precision Instruments• electrical equipment• Metal Products
• Constructi on• Mining & energy upstream
FIguRe 15 – HOW AgIle dO yOu need TO Be – AgIlITy MATRIx
Source: Capgemini Consulti ng analysis
Strategic Planning Process at a Glance
Companies need to integrate strategy formati on and planning to bring in the necessary agility in the fast and seismic quadrant. We believe there are three elements of an agile strategy (see Figure 16), which are part of, and are linked through a process that combines strategy formati on and planning.
Strategic planning is a key process to coordinate the decision making process and related acti viti esSource: Capgemini Consulti ng Strategic Planning Survey, 09/2011
FIguRe 16 – RequIReMenTS OF STRATegIC AgIlITy
ReSPOndOne View,
On-demand,lean process,
Simulati on/War-g, Plan B
MOVeAlignment,de-central,
Resource fl uidity,Incenti ves
SenSeForesight,Scenarios,
Collaborati on,Innovati on &
Venturing
More informati on in Capgemini Consulti ng Point of View “Adding ability to Executi on: Strategic Planning in the Digital Age”
14
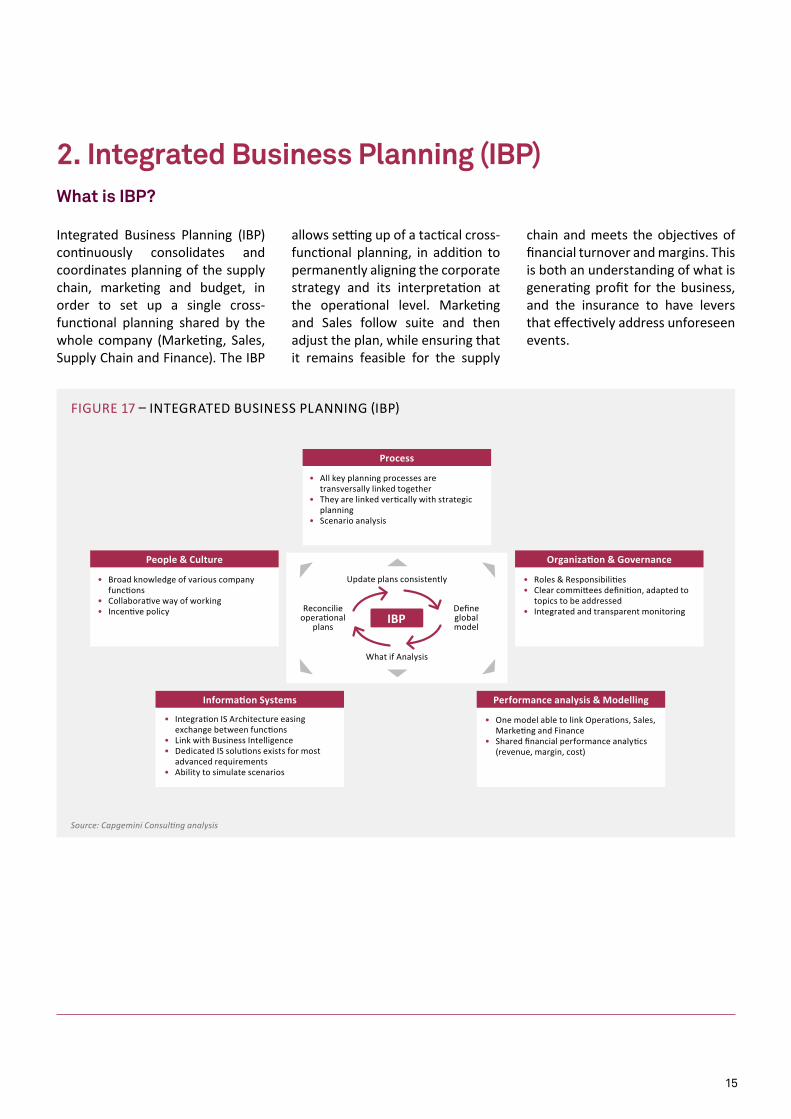
Integrated Business Planning (IBP) continuously consolidates and coordinates planning of the supply chain, marketing and budget, in order to set up a single cross-functional planning shared by the whole company (Marketing, Sales, Supply Chain and Finance). The IBP
allows setting up of a tactical cross-functional planning, in addition to permanently aligning the corporate strategy and its interpretation at the operational level. Marketing and Sales follow suite and then adjust the plan, while ensuring that it remains feasible for the supply
What is IBP?
2. Integrated Business Planning (IBP)
chain and meets the objectives of financial turnover and margins. This is both an understanding of what is generating profit for the business, and the insurance to have levers that effectively address unforeseen events.
FIguRe 17 – InTegRATed BuSIneSS PlAnnIng (IBP)
Source: Capgemini Consulting analysis
• Broad knowledge of various company functions
• Collaborative way of working• Incentive policy
People & Culture
• Integration IS Architecture easing exchange between functions
• link with Business Intelligence• dedicated IS solutions exists for most
advanced requirements• Ability to simulate scenarios
Information Systems
• One model able to link Operations, Sales, Marketing and Finance
• Shared financial performance analytics (revenue, margin, cost)
Performance analysis & Modelling
• All key planning processes are transversally linked together
• They are linked vertically with strategic planning
• Scenario analysis
Process
• Roles & Responsibilities• Clear committees definition, adapted to
topics to be addressed• Integrated and transparent monitoring
Organization & Governance
update plans consistently
Reconcilie operational
plans
define global model
What if Analysis
IBP
15
The IBP fulfi lls strategic goals, setti ng up common goals for all the organizati on’s functi ons, in order to align individual eff orts towards meeti ng these goals. Companies maximize their profi tability, using fi nancial modeling and simulati on, to ensure that the impact on margins is considered each ti me a decision is made jointly involving the executi ve Board, Producti on, Sales, Marketi ng, and the Finance department. Moreover, they are able to deal with unpredictable changes in demand by anti cipati ng conti ngencies, building miti gati on plans around core scenarios, and using an effi cient decision making support tool. It takes more than
simply luck or just bett er foresight for a business to reach its fi nancial forecasts. Indeed, the idea that the sales and marketi ng teams can provide a perfectly accurate forecast of customer buying behavior at an individual product level is clearly a myth. Commercial organizati ons, therefore, need an operati ng model that is capable of detecti ng changes in customer demand and sales trends, and then fl exing the sales acti viti es and producti on to secure the equivalent fi nancial result. The IBP approach to cope with demand volati lity consists of:
• Shaping demand to maximize
What are the key principles of IBP?
margin - for example, using price and promoti ons
• Opti mizing the product mix to maximize profi tability
• Adjusti ng supply, and communicati ng to customers according to the demands of the integrated plan
• Forecasti ng more accurately and reporti ng more frequently
• Being prepared to communicate the bad news to customers
The IBP improves fi nancial performance, expressing plans into P&l and balance sheet structure, and assessing the impact of one or more factors on the organizati on’s profi t margins.
IBP implementati on provides tangible and measurable results beyond the scope of the supply chain, and benefi ts the enti re company: costs of the supply chain are objecti fi ed, sales order revenue, and operati ng margins are increased; marketi ng and direct labor cost are reduced, customer sati sfacti on is improved through bett er service levels and fewer stock-outs. By implementi ng IBP, companies can also improve their agility in quickly implementi ng alternati ve soluti ons, and quickly
and effi ciently execute the decision-making process, based on a cross-functi onal vision of the company.
Achieving these benefi ts is only possible if the company is implementi ng a new governance, new ways of collaborati on amongst its operati onal divisions, or an eff ecti ve informati on system, and brings to all its employees a culture of economic and fi nancial performance.
What Benefi ts can you Expect from IBP?
More informati on in Capgemini Consulti ng Point of View “Integrated Business Planning: Steering Towards Profi t”
16
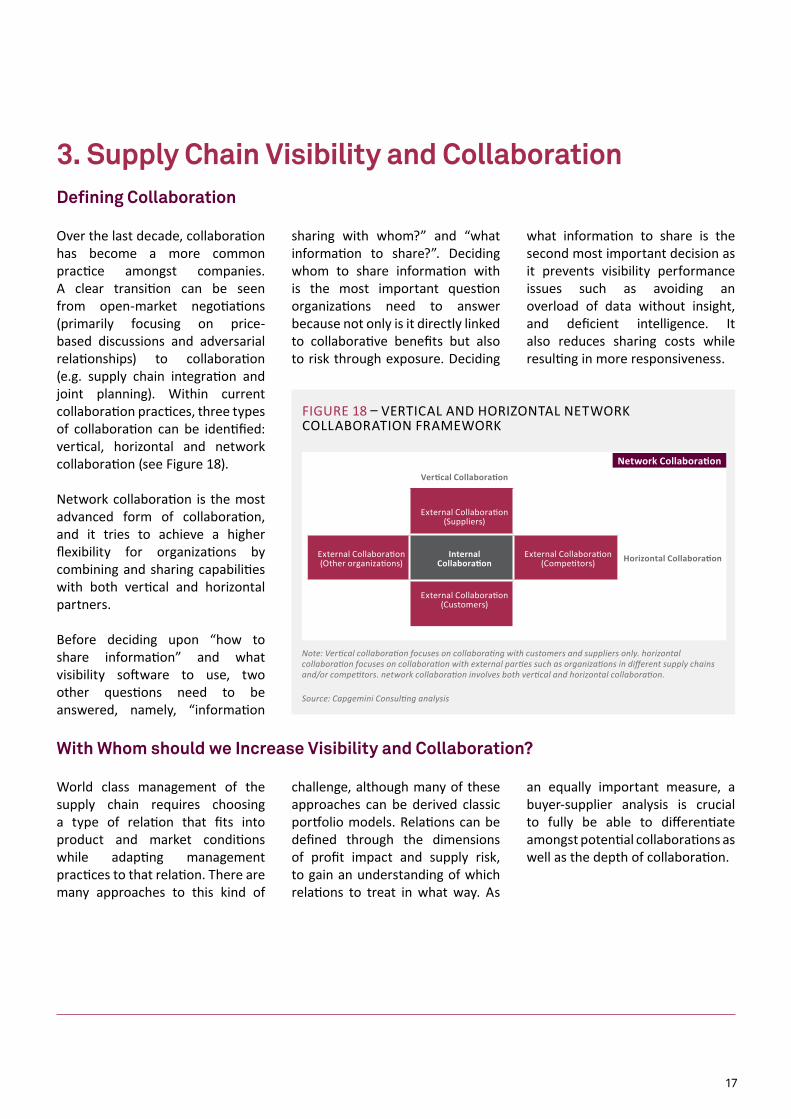
Over the last decade, collaboration has become a more common practice amongst companies. A clear transition can be seen from open-market negotiations (primarily focusing on price-based discussions and adversarial relationships) to collaboration (e.g. supply chain integration and joint planning). Within current collaboration practices, three types of collaboration can be identified: vertical, horizontal and network collaboration (see Figure 18).
network collaboration is the most advanced form of collaboration, and it tries to achieve a higher flexibility for organizations by combining and sharing capabilities with both vertical and horizontal partners.
Before deciding upon “how to share information” and what visibility software to use, two other questions need to be answered, namely, “information
Defining Collaboration
3. Supply Chain Visibility and Collaboration
Network Collaboration
FIguRe 18 – VeRTICAl And HORIZOnTAl neTWORk COllABORATIOn FRAMeWORk
Note: Vertical collaboration focuses on collaborating with customers and suppliers only. horizontal collaboration focuses on collaboration with external parties such as organizations in different supply chains and/or competitors. network collaboration involves both vertical and horizontal collaboration.
Source: Capgemini Consulting analysis
Vertical Collaboration
Horizontal Collaboration
external Collaboration (Suppliers)
external Collaboration (Customers)
external Collaboration(Other organizations)
external Collaboration (Competitors)
Internal Collaboration
sharing with whom?” and “what information to share?”. deciding whom to share information with is the most important question organizations need to answer because not only is it directly linked to collaborative benefits but also to risk through exposure. deciding
what information to share is the second most important decision as it prevents visibility performance issues such as avoiding an overload of data without insight, and deficient intelligence. It also reduces sharing costs while resulting in more responsiveness.
World class management of the supply chain requires choosing a type of relation that fits into product and market conditions while adapting management practices to that relation. There are many approaches to this kind of
challenge, although many of these approaches can be derived classic portfolio models. Relations can be defined through the dimensions of profit impact and supply risk, to gain an understanding of which relations to treat in what way. As
With Whom should we Increase Visibility and Collaboration?
an equally important measure, a buyer-supplier analysis is crucial to fully be able to differentiate amongst potential collaborations as well as the depth of collaboration.
17
The choice of what information to share can be as hard to figure out as whom to share with. The selection of what information to share—through visibility software—needs to be in line with the target audience you are sharing it with. There are cases of companies with dual intentions to increase visibility as well as collaboration, and who fail since current business models and incentives create barriers and counterproductive behavior. Risk exposure increases if there is only a one-way sharing of sensitive and private information. The recipient of this information may not have the best interests of the organization, and may be tempted to use the information as a
powerful negotiation tool, against the company.
It is important to be doubly sure as to what operational, tactical and strategic information is to be shared. Sharing too little information decreases the collaboration’s true potential, and sharing too much information will raise intelligence costs, without any positive effect. It is also crucial that data and insights shared through digitalization and visibility software are standardized and interpreted as per mutual consensus of all parties concerned.
The benefits of collaboration range from tangible benefits, such
What Information to Share?
as profit maximization and cost decreases, to intangible benefits, such as risk mitigation, increased data availability/accuracy, and increased flexibility. Possible examples of the scope of visibility include sharing long-term planning and status information with high-priority suppliers, while only sharing status information with relatively low-priority suppliers. Other examples of what information to share with whom might be to provide event and status information to customers, while sharing planning and status information with primary logistics service providers.
Control Towers are cross-divisional organizations with system integrated “information hubs” that provide more visibility into the supply chain. Supply Chain Visibility software is used for gathering, distributing information, and facilitating quicker detection and action on risks or opportunities. Control Towers are typically set up to monitor, measure, and manage transport and inventory movements across the supply chain.
Supply Chain Visibility software offers great possibilities for collaboration through the use of portals and (standard/custom) interfaces to other tools. Supplier, customer and 3Pl portals are widely available for visibility software packages, enabling these parties to retrieve and input data. Another important functionality is the ability to interface with other systems (e.g. eRP, TMS, APS, etc.), and the ability to receive and send
Collaboration through Control Towers and Supply Chain Visibility Software
different file formats (e.g. xMl, edI, etc.).
As a result, Supply Chain Visibility software enables and compels companies to collaborate with partners, exchange information, and increase visibility throughout the supply chain.
Point-of-sales data is key: when pulling the whole supply chain, it enables maximization of on-shelf availability and to understand the actual effect of promotions.
18
Short-term demand management is always a pain point for organizations when there is growing uncertainty of demand. Supply Chain Visibility software is based on key concepts that are particularly useful in mitigating issues created by uncertain demand:
• Control Towers have embedded alert management systems: when demand evolution deviates significantly enough to modify expected trends (demand shape or new product ramp-up), the system triggers alerts for further action.
• Control Towers feature strong Business Analytics capabilities: these features allow organizations to take rapid decisions to handle issues highlighted by the alert system. essentially, it presents the information, at the right level, in the right format, for the right people.
Moreover, Control Towers must
be operated by dedicated teams such as “Supply Chain Traffic Controllers” who have the right skills to manage such dynamic systems and who have the right culture to work in a collaborative way, either with external partners or with the company departments when joint actions need to be taken (e.g. promotional updates from the marketing department, based on sell-out information tracked by the Control Tower). As levels of complexity increase, competencies become even more critical to result in efficient decisions. Supply Chain Visibility software provides relevant information, but since all possible trade-offs cannot be identified and evaluated by the computer, skilled people are required—more than ever—to manage Control Towers.
For example, Samsung, with its presence in 24 locations and with a staff of more than 11,000 people in europe, had a fragmented and complex landscape of logistics
Control Towers & Supply Chain Visibility support Demand Management in Fluctuating Environments
service providers (lSP). They redesigned the operating model to integrate the lSP organizations with Samsung. A centralized function was set up to plan and control the product flow from port to customer, through automated processes. Cost data was automatically made available, without manual intervention and delays. Additionally, the carrier (selection, evaluation, invoicing) and inbound flow (terminal planning, customs status) information was integrated with the system. This solution helped Samsung build a flexible and integrated organization, while increasing load efficiency, improving tracking and customer service, enhancing transport efficiency using best-in-class carriers, and redesigning transport solutions (Source: Samsung Homepage, “Annual Reports” 2007 to 2009).
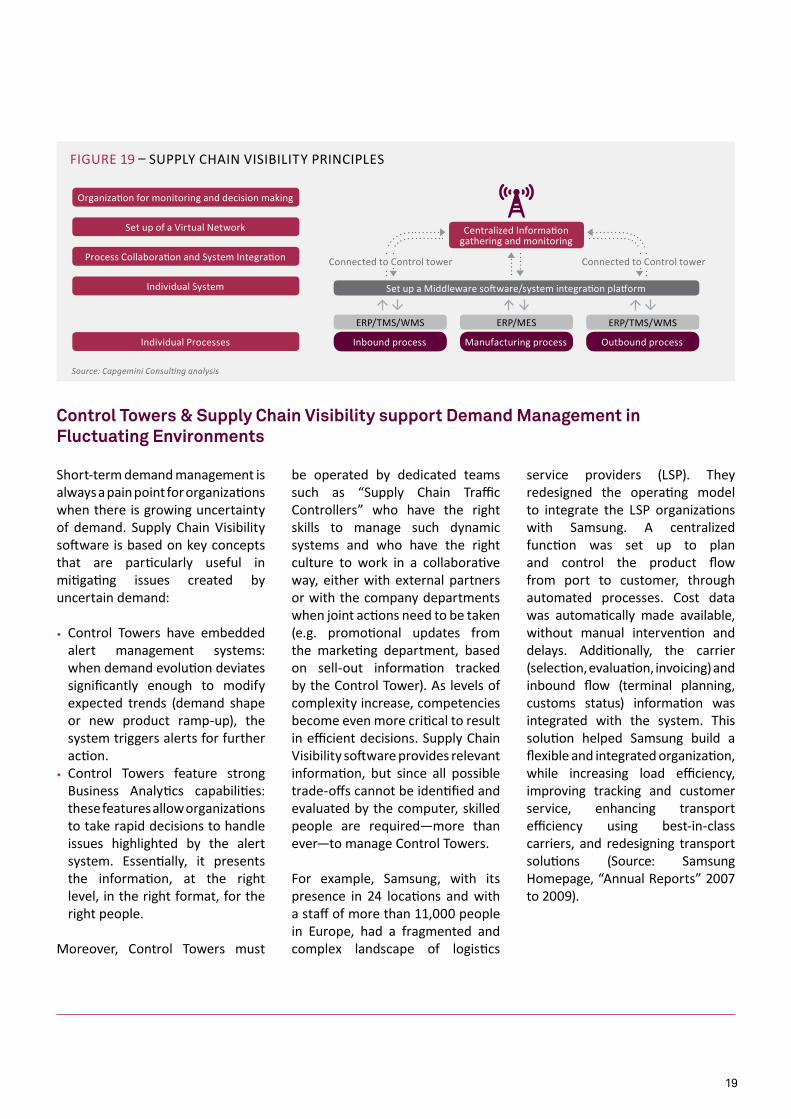
FIguRe 19 – SuPPly CHAIn VISIBIlITy PRInCIPleS
Source: Capgemini Consulting analysis
Organization for monitoring and decision making
Set up of a Virtual network
Process Collaboration and System Integration
Centralized Information gathering and monitoring
eRP/TMS/WMS eRP/MeS eRP/TMS/WMS
Inbound process Manufacturing process Outbound process
Set up a Middleware software/system integration platformIndividual System
Individual Processes
Connected to Control towerConnected to Control tower
19
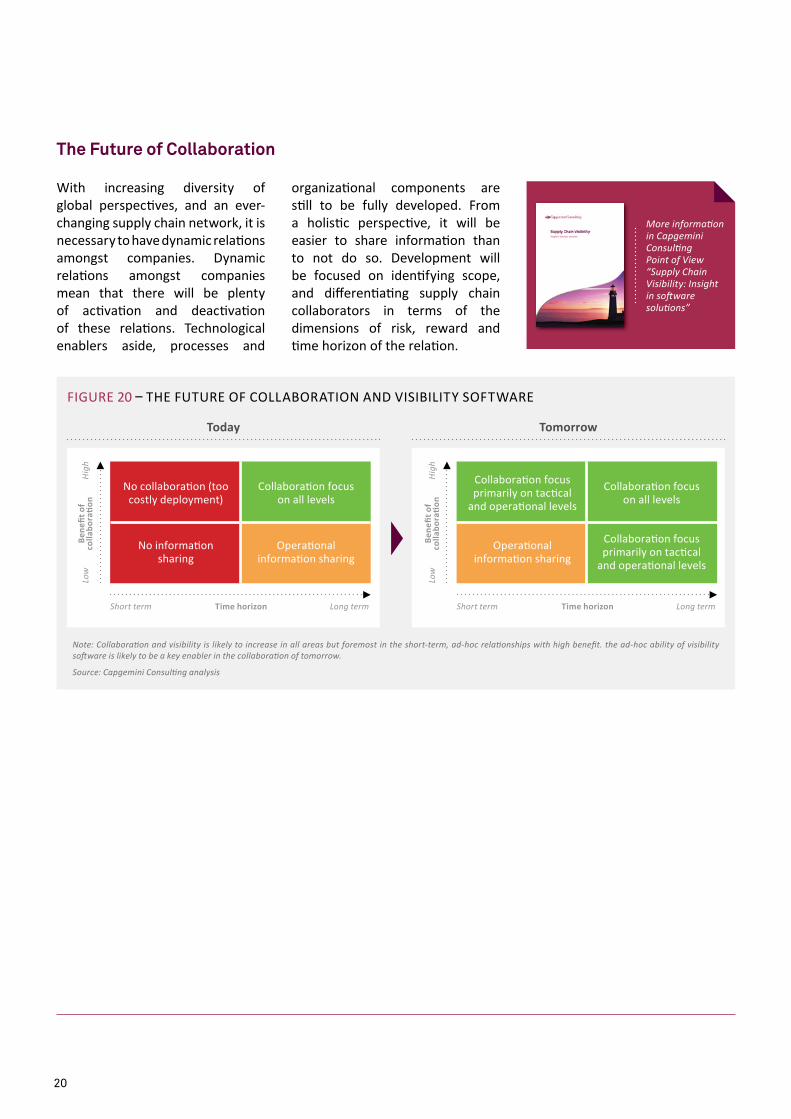
With increasing diversity of global perspecti ves, and an ever-changing supply chain network, it is necessary to have dynamic relati ons amongst companies. dynamic relati ons amongst companies mean that there will be plenty of acti vati on and deacti vati on of these relati ons. Technological enablers aside, processes and
organizati onal components are sti ll to be fully developed. From a holisti c perspecti ve, it will be easier to share informati on than to not do so. development will be focused on identi fying scope, and diff erenti ati ng supply chain collaborators in terms of the dimensions of risk, reward and ti me horizon of the relati on.
The Future of Collaboration
More informati on in Capgemini Consulti ng Point of View “Supply Chain Visibility: Insight in soft ware soluti ons”
Note: Collaborati on and visibility is likely to increase in all areas but foremost in the short-term, ad-hoc relati onships with high benefi t. the ad-hoc ability of visibility soft ware is likely to be a key enabler in the collaborati on of tomorrow.
Source: Capgemini Consulti ng analysis
Today Tomorrow
Collaborati on focus primarily on tacti cal
and operati onal levels
Low
Short term Long termTime horizon
Hig
h
Operati onal informati on sharing
Collaborati on focus primarily on tacti cal
and operati onal levels
Collaborati on focus on all levels
Bene
fi t o
f co
llabo
rati o
n
FIguRe 20 – THe FuTuRe OF COllABORATIOn And VISIBIlITy SOFTWARe
Low
Short term Long termTime horizon
Hig
h
no collaborati on (too costly deployment)
no informati on sharing
Operati onal informati on sharing
Collaborati on focus on all levels
Bene
fi t o
f co
llabo
rati o
n
20
We identified 5 best practices to increase supply chain performance on new products through forecasting.
4. New Product Forecasting
The impact of new products on the existing product portfolio must be systematically identified. The impact can be analyzed from two perspectives. The first one is the product market: does the product target an existing customer segment for an existing service/
functionality, or does it extend to new customer uses and segments? The second scenario pertains to the sales channel: will the new product hinder actual sales channels or will it help them extend and open up new sales channels?
Anticipate impacts on existing product portfolio and evaluate trends on market segments, regardless of product replacement
Second, past sales and past launches can provide valuable lessons when forecasting new products. Building a sales history, and compiling various past and existing products allows companies to evaluate trends and launch profiles for new products.
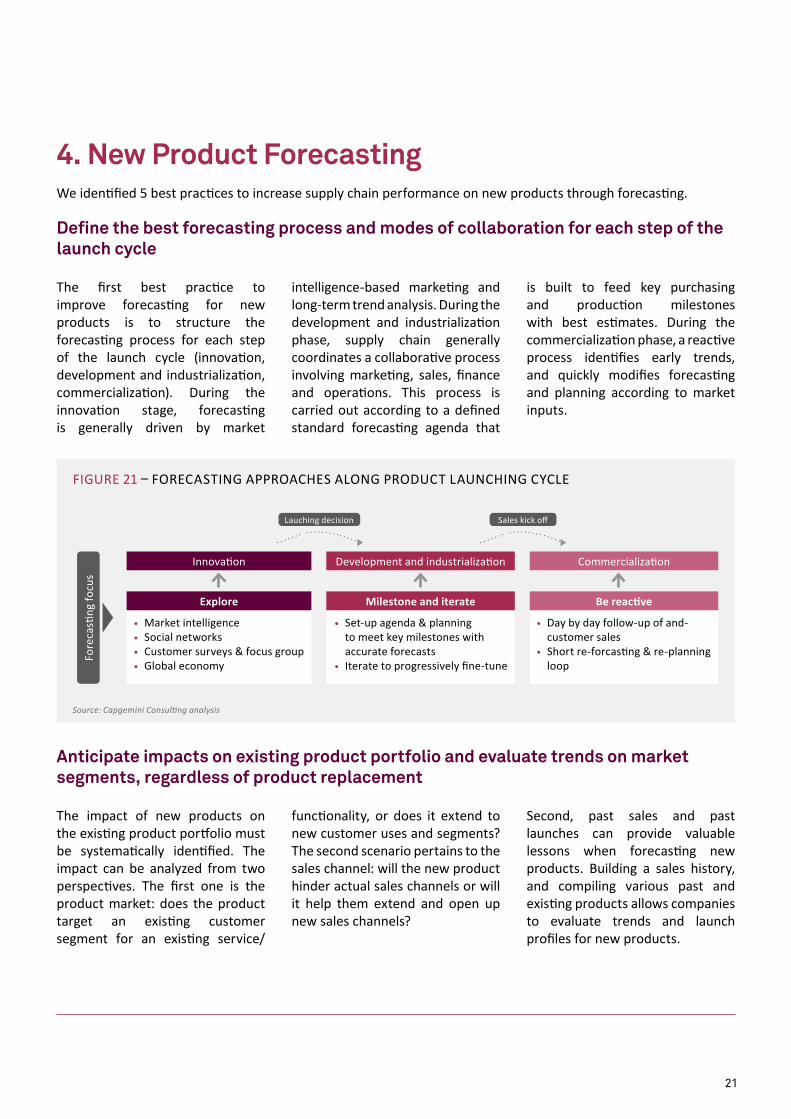
The first best practice to improve forecasting for new products is to structure the forecasting process for each step of the launch cycle (innovation, development and industrialization, commercialization). during the innovation stage, forecasting is generally driven by market
Define the best forecasting process and modes of collaboration for each step of the launch cycle
intelligence-based marketing and long-term trend analysis. during the development and industrialization phase, supply chain generally coordinates a collaborative process involving marketing, sales, finance and operations. This process is carried out according to a defined standard forecasting agenda that
is built to feed key purchasing and production milestones with best estimates. during the commercialization phase, a reactive process identifies early trends, and quickly modifies forecasting and planning according to market inputs.
FIguRe 21 – FOReCASTIng APPROACHeS AlOng PROduCT lAunCHIng CyCle
Source: Capgemini Consulting analysis
Fore
casti
ng fo
cus
Innovation
Explore
• Market intelligence• Social networks• Customer surveys & focus group• global economy
development and industrialization
Milestone and iterate
• Set-up agenda & planning to meet key milestones with accurate forecasts
• Iterate to progressively fine-tune
Commercialization
Be reactive
• day by day follow-up of and-customer sales
• Short re-forcasting & re-planning loop
lauching decision Sales kick off
21
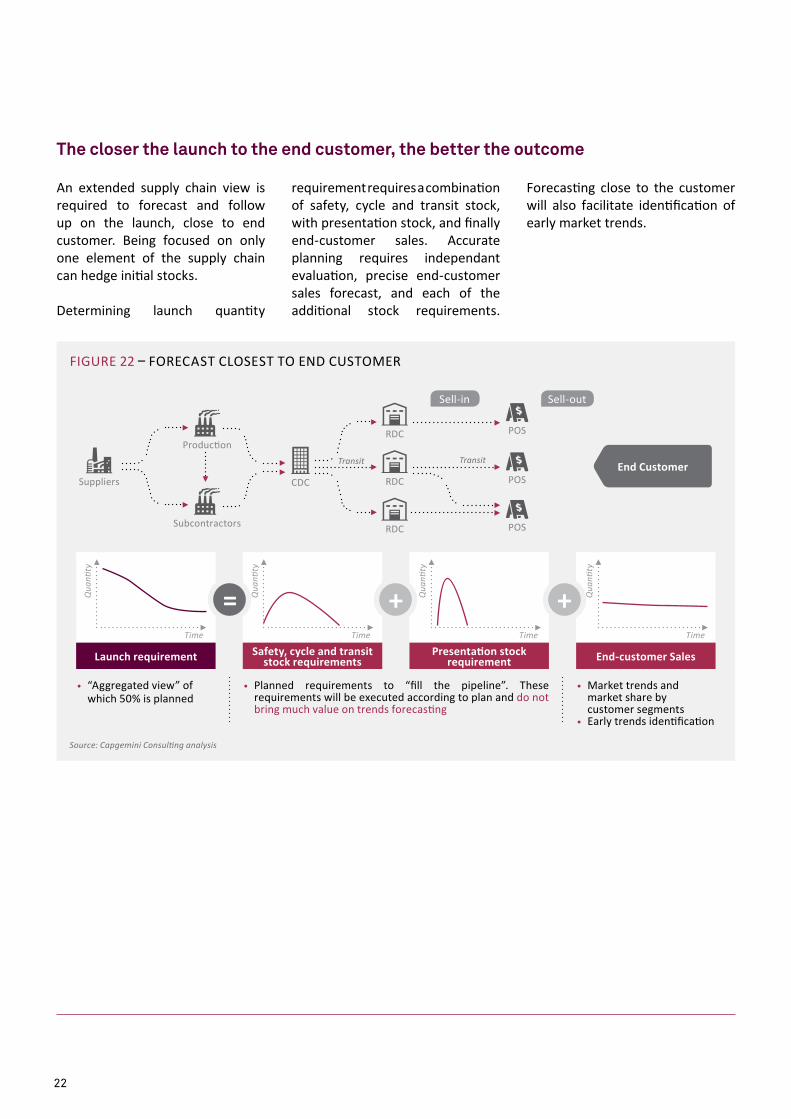
An extended supply chain view is required to forecast and follow up on the launch, close to end customer. Being focused on only one element of the supply chain can hedge initial stocks.
determining launch quantity
requirement requires a combination of safety, cycle and transit stock, with presentation stock, and finally end-customer sales. Accurate planning requires independant evaluation, precise end-customer sales forecast, and each of the additional stock requirements.
The closer the launch to the end customer, the better the outcome
Forecasting close to the customer will also facilitate identification of early market trends.
FIguRe 22 – FOReCAST ClOSeST TO end CuSTOMeR
Source: Capgemini Consulting analysis
TransitTransit End Customer
Sell-in Sell-out
• “Aggregated view” of which 50% is planned
• Planned requirements to “fill the pipeline”. These requirements will be executed according to plan and do not bring much value on trends forecasting
• Market trends and market share by customer segments
• early trends identification
Launch requirement Safety, cycle and transit stock requirements
Presentation stock requirement End-customer Sales
++=Qua
ntity
Time
Qua
ntity
Time
Qua
ntity
Time
Qua
ntity
Time
Suppliers
Production
CdC RdC POS
POS
POSRdC
RdCSubcontractors
22
When replenishment quantities are allocated according to forecasts, sales stakeholders feel compelled to conduct accurate forecasting. But in this scenario, service and inventory levels might be suboptimal due to high and low-volume sales not being compensated by adequate stock. When replenishment quantities are allocated according to real sales,
service and inventory levels are optimized, but sales stakeholders might not feel compelled to conduct accurate forecasting.
The best practice consists of balancing both approaches. Replenishment quantities can be allocated according to real sales requirements, to optimize on execution levels in the supply
Build commitment on forecast while optimizing the supply chain
chain (until a switch to allocation is required, in case of product shortage). But, at the same time, key stakeholders have individual incentives on forecast accuracy, or have their own P&l impacted according to forecasting errors (i.e. “charge” for quantity forecasted but not sold, placing a hold on central stock).
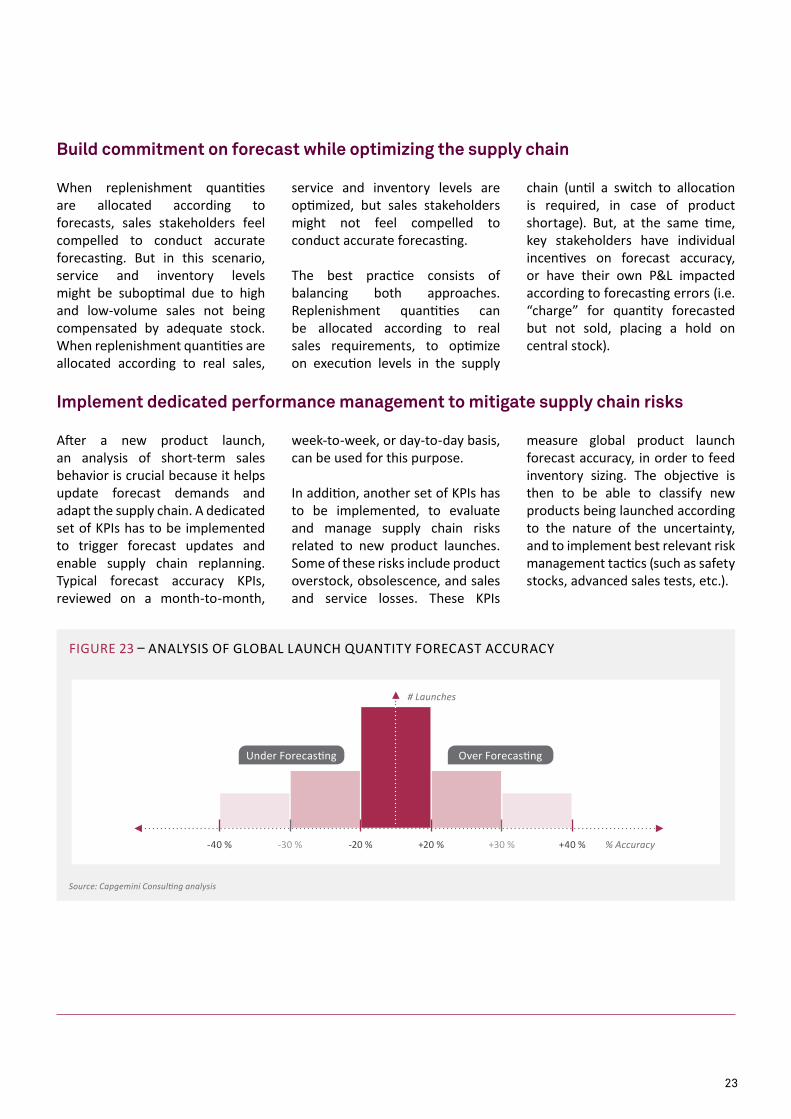
After a new product launch, an analysis of short-term sales behavior is crucial because it helps update forecast demands and adapt the supply chain. A dedicated set of kPIs has to be implemented to trigger forecast updates and enable supply chain replanning. Typical forecast accuracy kPIs, reviewed on a month-to-month,
week-to-week, or day-to-day basis, can be used for this purpose. In addition, another set of kPIs has to be implemented, to evaluate and manage supply chain risks related to new product launches. Some of these risks include product overstock, obsolescence, and sales and service losses. These kPIs
Implement dedicated performance management to mitigate supply chain risks
measure global product launch forecast accuracy, in order to feed inventory sizing. The objective is then to be able to classify new products being launched according to the nature of the uncertainty, and to implement best relevant risk management tactics (such as safety stocks, advanced sales tests, etc.).
FIguRe 23 – AnAlySIS OF glOBAl lAunCH quAnTITy FOReCAST ACCuRACy
Source: Capgemini Consulting analysis
Over Forecastingunder Forecasting
% Accuracy
# Launches
-40 % -30 % -20 % +20 % +30 % +40 %
23
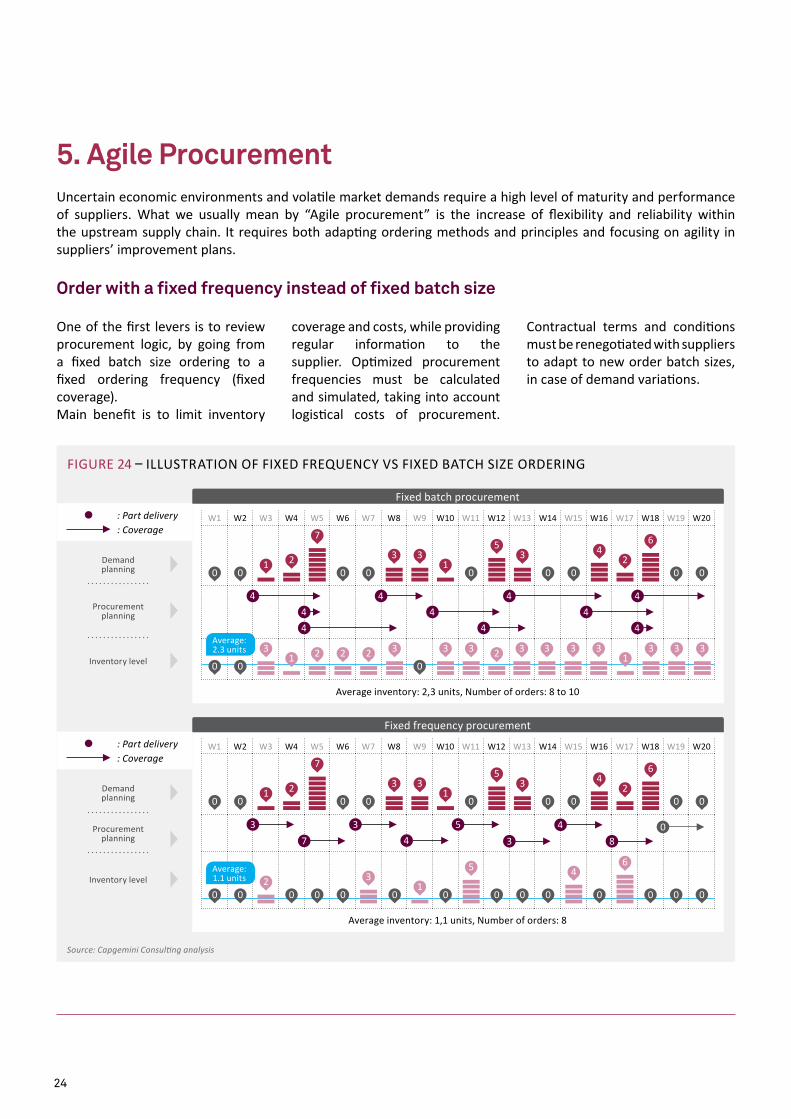
One of the first levers is to review procurement logic, by going from a fixed batch size ordering to a fixed ordering frequency (fixed coverage). Main benefit is to limit inventory
coverage and costs, while providing regular information to the supplier. Optimized procurement frequencies must be calculated and simulated, taking into account logistical costs of procurement.
Order with a fixed frequency instead of fixed batch size
Contractual terms and conditions must be renegotiated with suppliers to adapt to new order batch sizes, in case of demand variations.
uncertain economic environments and volatile market demands require a high level of maturity and performance of suppliers. What we usually mean by “Agile procurement” is the increase of flexibility and reliability within the upstream supply chain. It requires both adapting ordering methods and principles and focusing on agility in suppliers’ improvement plans.
5. Agile Procurement
FIguRe 24 – IlluSTRATIOn OF FIxed FRequenCy VS FIxed BATCH SIZe ORdeRIng
Source: Capgemini Consulting analysis
W1 W2 W3 W4 W5 W6 W7 W8 W9 W10 W11 W12 W13 W14 W15 W16 W17 W18 W19 W20
W1 W2 W3 W4 W5 W6 W7 W8 W9 W10 W11 W12 W13 W14 W15 W16 W17 W18 W19 W20
Average inventory: 2,3 units, number of orders: 8 to 10
Average inventory: 1,1 units, number of orders: 8
Fixed batch procurement
Fixed frequency procurement
0
0
0
0 0 0 0
0
0
0
0
0
0
0
0
0
0
0
0 0 0 00 0 00
0
0 0
0
0
0
0
0
0
1
1
1
1
2
2
3
3
3
3
3
3
2
2
7
7
6
6
5
5
4
4
3 33
3
3 3 3 3 3 3 3 32
2
2 2 2
1
1 1
44 4
44
44
44
3 33
08
57
4
44
Average: 2.3 units
Average: 1.1 units
: Part delivery
: Part delivery
: Coverage
: Coverage
Procurement planning
Procurement planning
Inventory level
Inventory level
demand planning
demand planning
65 4
24
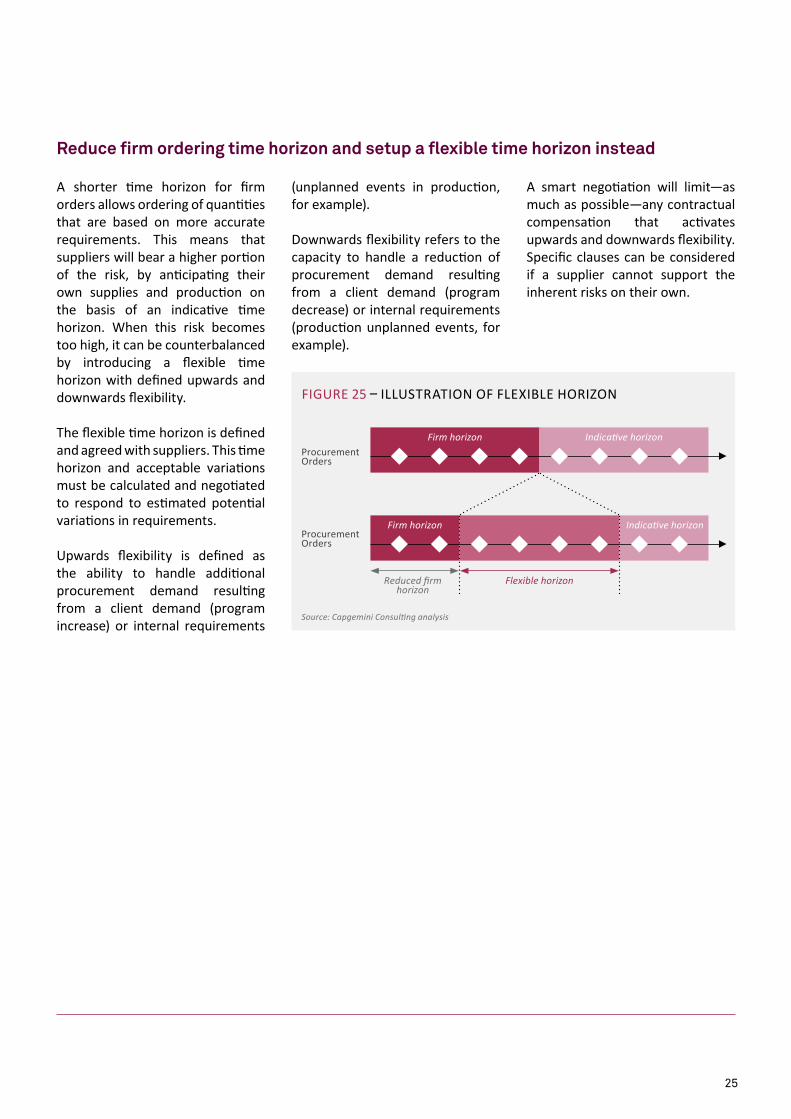
A shorter time horizon for firm orders allows ordering of quantities that are based on more accurate requirements. This means that suppliers will bear a higher portion of the risk, by anticipating their own supplies and production on the basis of an indicative time horizon. When this risk becomes too high, it can be counterbalanced by introducing a flexible time horizon with defined upwards and downwards flexibility.
The flexible time horizon is defined and agreed with suppliers. This time horizon and acceptable variations must be calculated and negotiated to respond to estimated potential variations in requirements. upwards flexibility is defined as the ability to handle additional procurement demand resulting from a client demand (program increase) or internal requirements
Reduce firm ordering time horizon and setup a flexible time horizon instead
(unplanned events in production, for example).
downwards flexibility refers to the capacity to handle a reduction of procurement demand resulting from a client demand (program decrease) or internal requirements (production unplanned events, for example).
A smart negotiation will limit—as much as possible—any contractual compensation that activates upwards and downwards flexibility. Specific clauses can be considered if a supplier cannot support the inherent risks on their own.
FIguRe 25 – IlluSTRATIOn OF FlexIBle HORIZOn
Source: Capgemini Consulting analysis
ProcurementOrders
Reduced firm horizon
Flexible horizon
ProcurementOrders
Firm horizon
Firm horizon
Indicative horizon
Indicative horizon
25
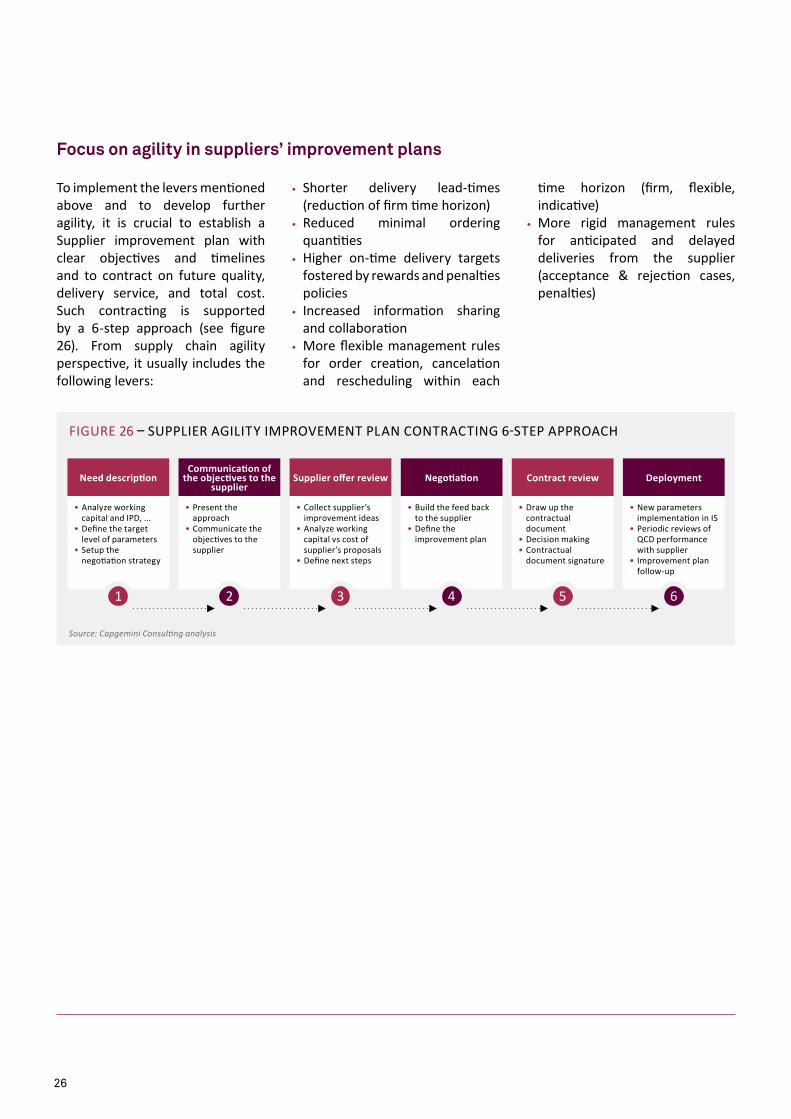
To implement the levers mentioned above and to develop further agility, it is crucial to establish a Supplier improvement plan with clear objectives and timelines and to contract on future quality, delivery service, and total cost. Such contracting is supported by a 6-step approach (see figure 26). From supply chain agility perspective, it usually includes the following levers:
• Shorter delivery lead-times (reduction of firm time horizon)
• Reduced minimal ordering quantities
• Higher on-time delivery targets fostered by rewards and penalties policies
• Increased information sharing and collaboration
• More flexible management rules for order creation, cancelation and rescheduling within each
Focus on agility in suppliers’ improvement plans
time horizon (firm, flexible, indicative)
• More rigid management rules for anticipated and delayed deliveries from the supplier (acceptance & rejection cases, penalties)
Source: Capgemini Consulting analysis
• Analyze working capital and IPd, ...
• define the target level of parameters
• Setup the negotiation strategy
Need description
• Present the approach
• Communicate the objectives to the supplier
Communication of the objectives to the
supplier
• Collect supplier’s improvement ideas
• Analyze working capital vs cost of supplier’s proposals
• define next steps
Supplier offer review
• Build the feed back to the supplier
• define the improvement plan
Negotiation
• draw up the contractual document
• decision making• Contractual
document signature
Contract review
• new parameters implementation in IS
• Periodic reviews of qCd performance with supplier
• Improvement plan follow-up
Deployment
FIguRe 26 – SuPPlIeR AgIlITy IMPROVeMenT PlAn COnTRACTIng 6-STeP APPROACH
1 2 3 4 5 6
26
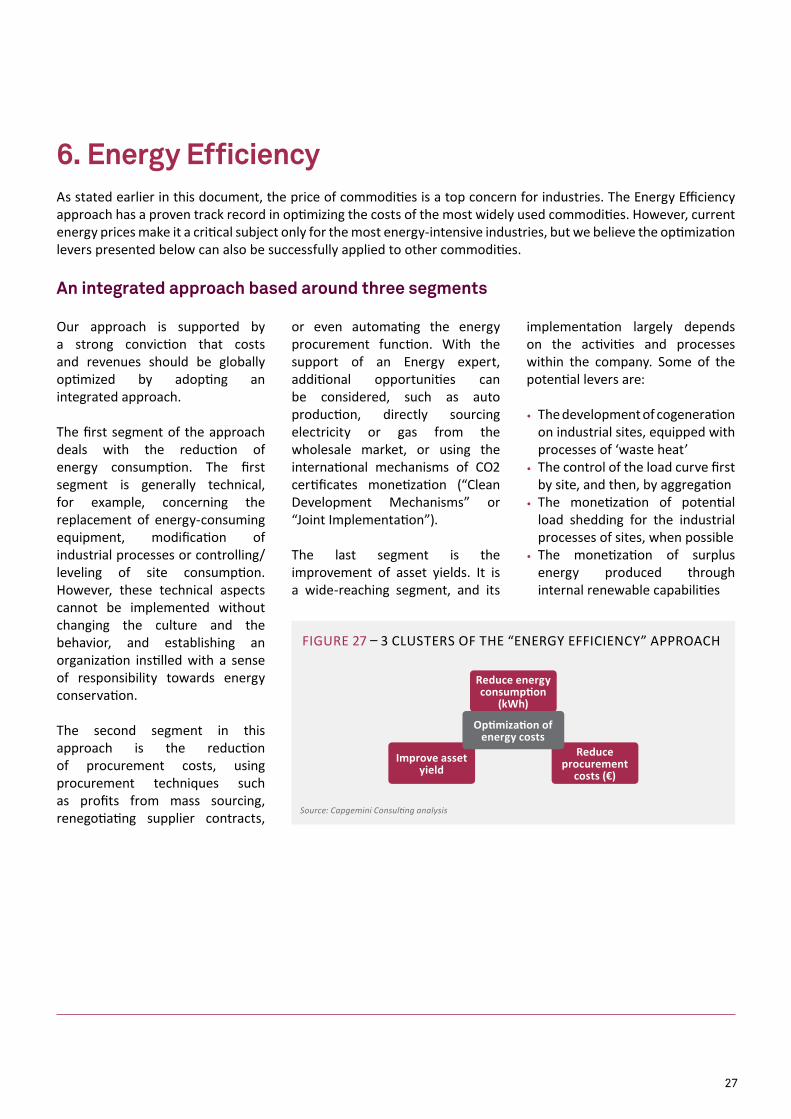
Our approach is supported by a strong conviction that costs and revenues should be globally optimized by adopting an integrated approach.
The first segment of the approach deals with the reduction of energy consumption. The first segment is generally technical, for example, concerning the replacement of energy-consuming equipment, modification of industrial processes or controlling/leveling of site consumption. However, these technical aspects cannot be implemented without changing the culture and the behavior, and establishing an organization instilled with a sense of responsibility towards energy conservation.
The second segment in this approach is the reduction of procurement costs, using procurement techniques such as profits from mass sourcing, renegotiating supplier contracts,
As stated earlier in this document, the price of commodities is a top concern for industries. The energy efficiency approach has a proven track record in optimizing the costs of the most widely used commodities. However, current energy prices make it a critical subject only for the most energy-intensive industries, but we believe the optimization levers presented below can also be successfully applied to other commodities.
or even automating the energy procurement function. With the support of an energy expert, additional opportunities can be considered, such as auto production, directly sourcing electricity or gas from the wholesale market, or using the international mechanisms of CO2 certificates monetization (“Clean development Mechanisms” or “Joint Implementation”).
The last segment is the improvement of asset yields. It is a wide-reaching segment, and its
An integrated approach based around three segments
6. Energy Efficiency
implementation largely depends on the activities and processes within the company. Some of the potential levers are:
• The development of cogeneration on industrial sites, equipped with processes of ‘waste heat’
• The control of the load curve first by site, and then, by aggregation
• The monetization of potential load shedding for the industrial processes of sites, when possible
• The monetization of surplus energy produced through internal renewable capabilities
Source: Capgemini Consulting analysis
Reduce energy consumption
(kWh)
Improve asset yield
Reduce procurement
costs (€)
Optimization of energy costs
FIguRe 27 – 3 CluSTeRS OF THe “eneRgy eFFICIenCy” APPROACH
27
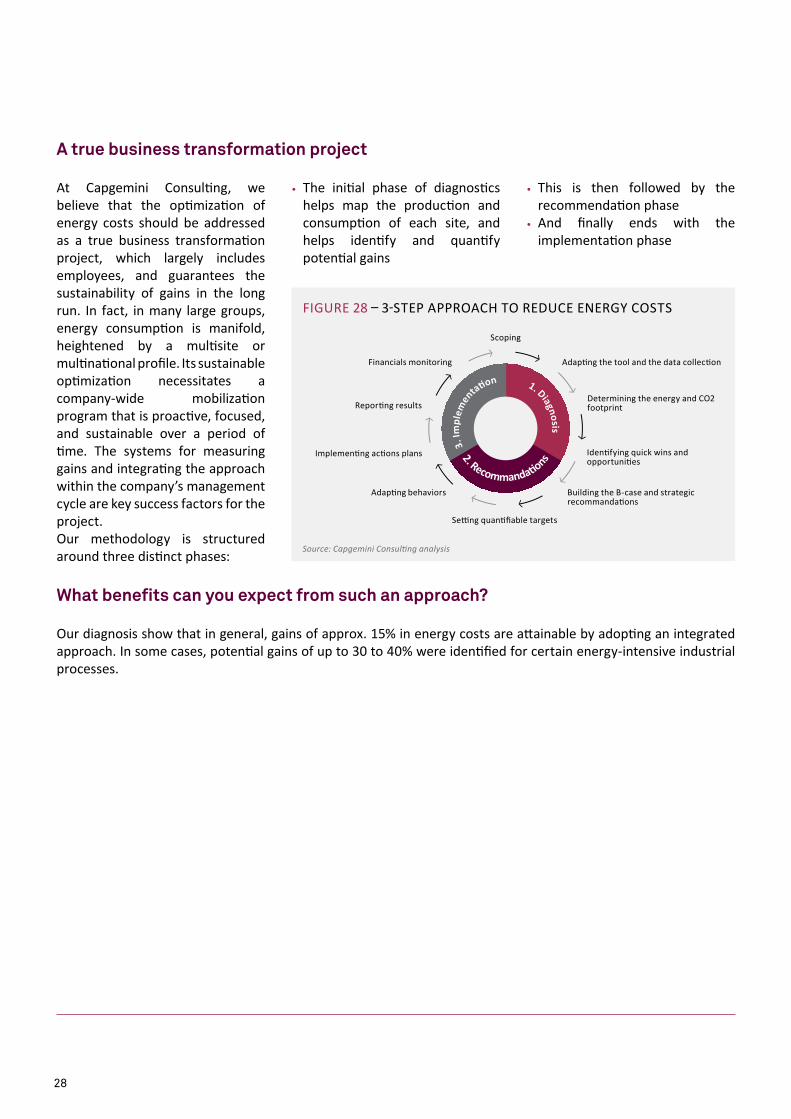
At Capgemini Consulting, we believe that the optimization of energy costs should be addressed as a true business transformation project, which largely includes employees, and guarantees the sustainability of gains in the long run. In fact, in many large groups, energy consumption is manifold, heightened by a multisite or multinational profile. Its sustainable optimization necessitates a company-wide mobilization program that is proactive, focused, and sustainable over a period of time. The systems for measuring gains and integrating the approach within the company’s management cycle are key success factors for the project. Our methodology is structured around three distinct phases:
• The initial phase of diagnostics helps map the production and consumption of each site, and helps identify and quantify potential gains
A true business transformation project
• This is then followed by the recommendation phase
• And finally ends with the implementation phase
Our diagnosis show that in general, gains of approx. 15% in energy costs are attainable by adopting an integrated approach. In some cases, potential gains of up to 30 to 40% were identified for certain energy-intensive industrial processes.
What benefits can you expect from such an approach?
Source: Capgemini Consulting analysis
1. Diagnosis
3
. Im
plem
en
tati on
2. Recommandati o
ns
Scoping
Adapting the tool and the data collection
determining the energy and CO2 footprint
Identifying quick wins and opportunities
Building the B-case and strategic recommandations
Setting quantifiable targets
Adapting behaviors
Implementing actions plans
Reporting results
Financials monitoring
FIguRe 28 – 3-STeP APPROACH TO ReduCe eneRgy COSTS
28

Deficits of Hybrid Supply Chains
digitization has touched upon all aspects of businesses, including supply chains and operating models. Today, technologies such as RFId, gPS, and sensors have enabled organizations to transform their existing hybrid (combination of paper-based and IT-supported processes) supply chain structures into more flexible, open, agile, and collaborative digital models. unlike hybrid supply chain models—which have resulted in rigid organizational structures, inaccessible data, and fragmented
7. Digital Supply Chainrelationships with partners—digital supply chains enable business process automation, organizational flexibility, and digital management of corporate assets.
In order to reap maximum benefits from digital supply chain models, it is important that companies internalize it as an integral part of the overall business model and organizational structure. localized disconnected initiatives and silo-based operations pose a serious threat to competitiveness in an
increasingly digital world.
We believe a holistic approach to the digital transformation of the supply chain—starting with a digital strategy and a digital operating model—will set the direction for integrated execution. This will not only enable organizations to realize the untapped potential of existing capabilities, but to also achieve higher performance, and ultimately create greater value.
Today, most organizations operate on hybrid supply chain models that combine paper-based and IT-supported processes. As paper-based information is only locally available, organizational design is largely based on local factories or branches that serve local customers. Coordination and governance is based on local profit centers, which optimize the performance of a region, country or branch. These local profit centers often do not openly share information with other organizational units. Profit Center heads often wield strong organizational power, and hence applications are designed to support local processes or functional islands. These divergent local processes and IT applications lead to inconsistent and redundant data at the corporate level, and create several inefficiencies.
FIguRe 29 – key deFICITS OF HyBRId SuPPly CHAInS
Source: Capgemini Consulting analysis
Overly complex IT landscapes
lack of end-to-end
process integration
lack of transparency
lack of agility
Sub-optimal use of locations
Sub-optimal use of labor cost differences
Sub-optimal bundling of
tasks key limitations
29
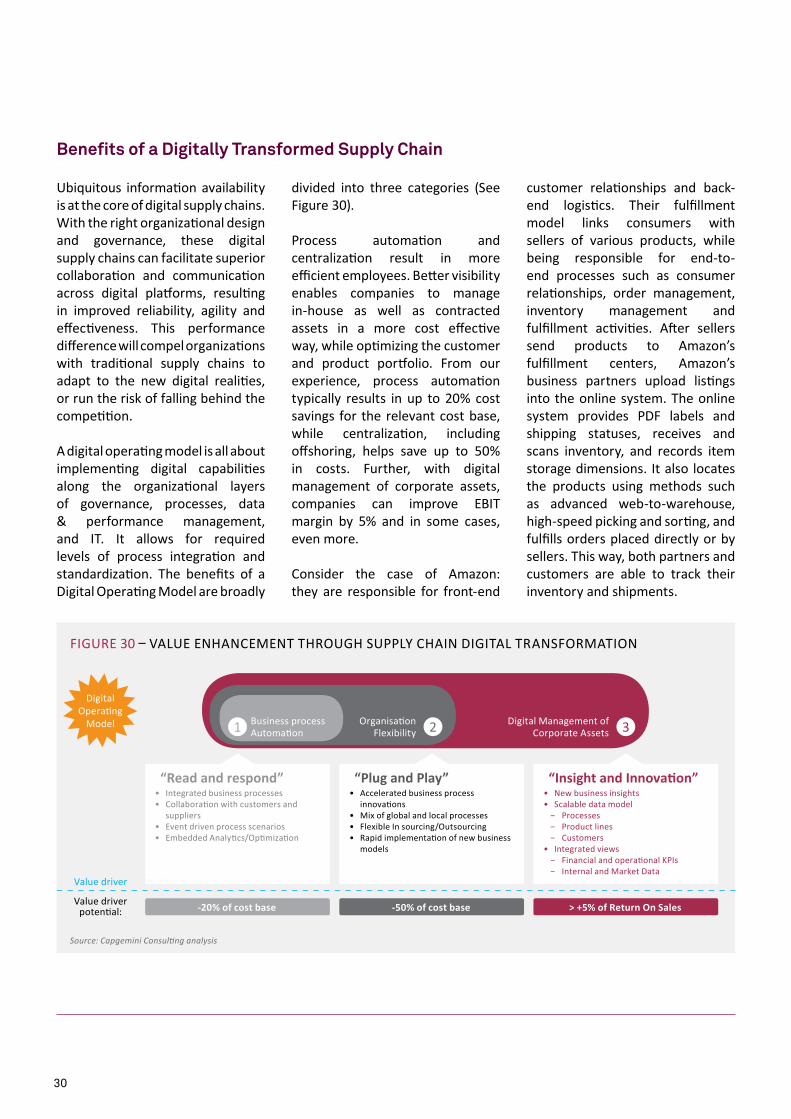
ubiquitous information availability is at the core of digital supply chains. With the right organizational design and governance, these digital supply chains can facilitate superior collaboration and communication across digital platforms, resulting in improved reliability, agility and effectiveness. This performance difference will compel organizations with traditional supply chains to adapt to the new digital realities, or run the risk of falling behind the competition.
A digital operating model is all about implementing digital capabilities along the organizational layers of governance, processes, data & performance management, and IT. It allows for required levels of process integration and standardization. The benefits of a digital Operating Model are broadly
divided into three categories (See Figure 30).
Process automation and centralization result in more efficient employees. Better visibility enables companies to manage in-house as well as contracted assets in a more cost effective way, while optimizing the customer and product portfolio. From our experience, process automation typically results in up to 20% cost savings for the relevant cost base, while centralization, including offshoring, helps save up to 50% in costs. Further, with digital management of corporate assets, companies can improve eBIT margin by 5% and in some cases, even more.
Consider the case of Amazon: they are responsible for front-end
Benefits of a Digitally Transformed Supply Chain
customer relationships and back-end logistics. Their fulfillment model links consumers with sellers of various products, while being responsible for end-to-end processes such as consumer relationships, order management, inventory management and fulfillment activities. After sellers send products to Amazon’s fulfillment centers, Amazon’s business partners upload listings into the online system. The online system provides PdF labels and shipping statuses, receives and scans inventory, and records item storage dimensions. It also locates the products using methods such as advanced web-to-warehouse, high-speed picking and sorting, and fulfills orders placed directly or by sellers. This way, both partners and customers are able to track their inventory and shipments.
FIguRe 30 – VAlue enHAnCeMenT THROugH SuPPly CHAIn dIgITAl TRAnSFORMATIOn
Source: Capgemini Consulting analysis
digital Operating
Model Business process Automation
digital Management of Corporate Assets
Organisation Flexibility
Value driver potential:
Value driver
-50% of cost base-20% of cost base > +5% of Return On Sales
“Read and respond”• Integrated business processes• Collaboration with customers and
suppliers• event driven process scenarios• embedded Analytics/Optimization
“Plug and Play”• Accelerated business process
innovations• Mix of global and local processes• Flexible In sourcing/Outsourcing• Rapid implementation of new business
models
“Insight and Innovation”• new business insights• Scalable data model
− Processes − Product lines − Customers
• Integrated views − Financial and operational kPIs − Internal and Market data
1 2 3
30
One of the most common problems faced in the digital transformati on journey, is the temptati on to implement digital initi ati ves in silos, or through a technology-centric approach.
When organizati ons implement disconnected digital initi ati ves across functi ons, it oft en results in a shortage of resources, resulti ng in ineffi ciencies and inter-departmental confl icts. This creates a risk that the initi ati ve will be viewed as a one-off project rather than as a holisti c transformati on program. In our view, digital transformati on is more about an enterprise-wide business transformati on and less about technology.
It is important that a digital supply chain strategy be an integral part of the overall business model and organizati onal structure of a company. Transforming the enti re organizati on to a digital Operati ng Model clearly has the highest potenti al, but also bears the highest complexity and risk.
Regardless of the scope of the transformati on, we believe there are fi ve transformati on dimensions
to be considered: (See Figure 31):
• digital Supply Chain Strategy• Supply Chain Operati ng &
governance Model• Integrated executi on• Integrated Supply Chain
Performance Management• Supply Chain Technology
Architecture & Infrastructure
digital Supply Chain Strategy is the starti ng point of the journey. It is essenti al for an organizati on to integrate digital initi ati ves into the overall supply chain strategy in order to generate and measure long-term value. A thorough analysis phase will highlight the value creati on potenti al in the existi ng supply chain. The identi fi cati on of business benefi ts requires top management experti se and inputs regarding currently perceived pain points and industry best practi ces.
Typical outcomes of an analysis of current pain points and opportuniti es are the identi fi cati on of broken or improvable processes, local instead of global opti mizati on, low visibility (for example, on product/customer profi tability, or process quality), or subcriti cal size of local business units. For
A Holistic Approach to Digital Transformation of the Supply Chain
example, on the processes front, four main types of opportuniti es can be investi gated:
• Traceability soluti ons (RFId, gPS, etc.)
• Mobility soluti ons (Mobility devices, Smartphones, PdA, etc.)
• digital informati on sharing and process digitalizati on (edI, electronic platf orms, etc.)
• Business Intelligence and dynamic Analyti cs
Advanced digital soluti ons (Movements tracking, Face recogniti on, 3d dynamic capture, etc.)
A synthesis of these pain points and opportuniti es will directly lead to the design principles and value potenti al of a digital Operati ng Model.
More informati on in Capgemini Consulti ng Point of View “Digital Transformati on of Supply Chain: Creati ng Value – When Digital meets Physical”
31
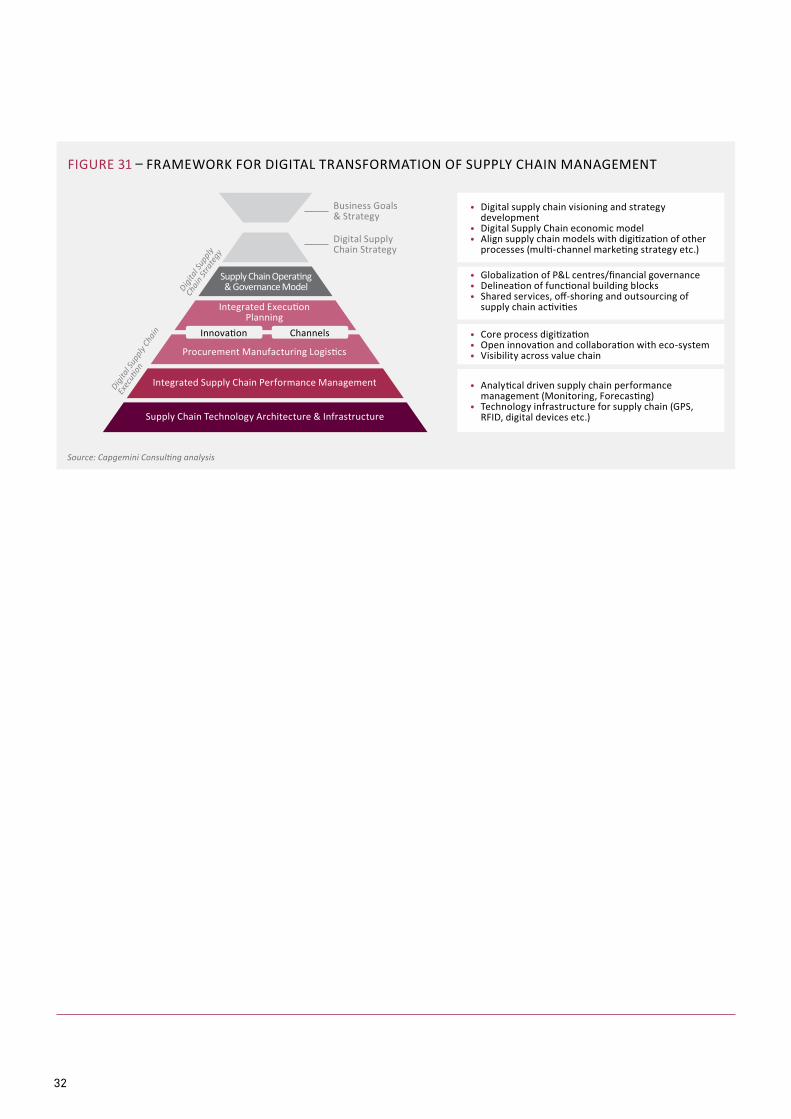
FIguRe 31 – FRAMeWORk FOR dIgITAl TRAnSFORMATIOn OF SuPPly CHAIn MAnAgeMenT
Source: Capgemini Consulting analysis
Supply Chain Technology Architecture & Infrastructure
Integrated Supply Chain Performance Management
Innovation Channels
Procurement Manufacturing logistics
Integrated executionPlanning
Supply Chain Operating & governance Model
Business goals & Strategy
digital Supply Chain Strategy
• digital supply chain visioning and strategy development
• digital Supply Chain economic model• Align supply chain models with digitization of other
processes (multi-channel marketing strategy etc.)
• globalization of P&l centres/financial governance• delineation of functional building blocks• Shared services, off-shoring and outsourcing of
supply chain activities
• Core process digitization• Open innovation and collaboration with eco-system• Visibility across value chain
• Analytical driven supply chain performance management (Monitoring, Forecasting)
• Technology infrastructure for supply chain (gPS, RFId, digital devices etc.)
Digita
l Sup
ply Ch
ain
Exec
ution
Digita
l Sup
ply
Chain
Stra
tegy
32
About the survey
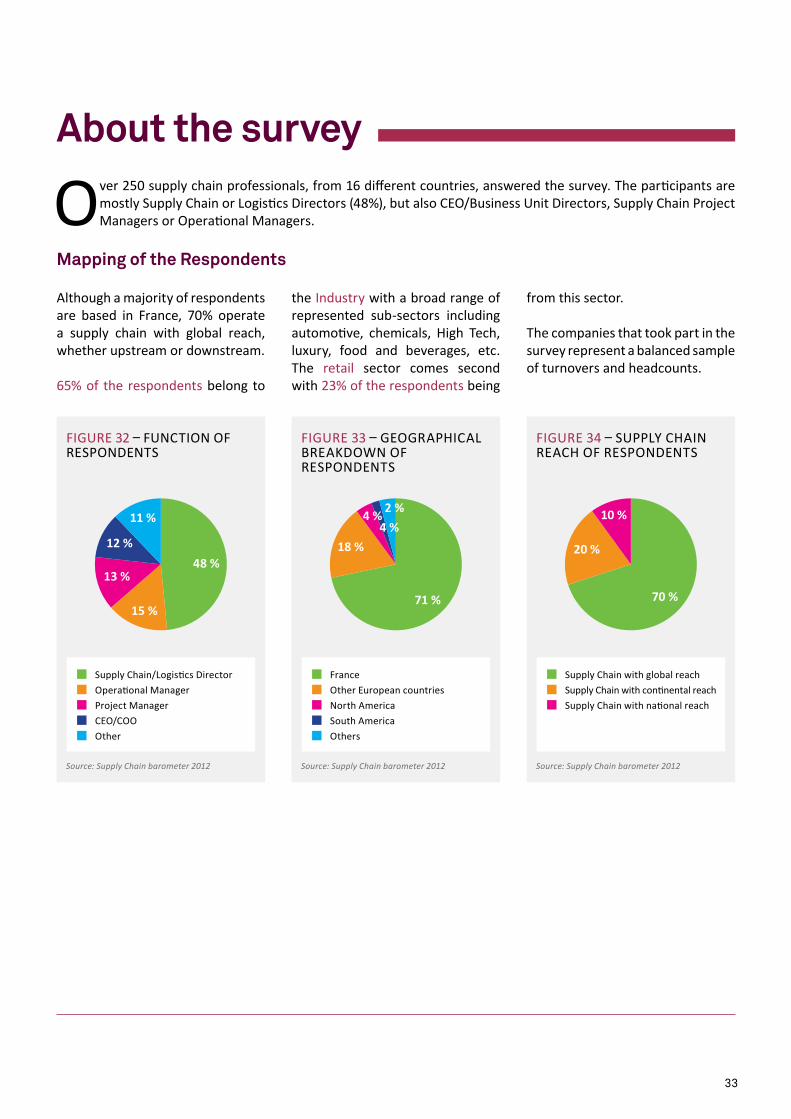
Over 250 supply chain professionals, from 16 different countries, answered the survey. The participants are mostly Supply Chain or logistics directors (48%), but also CeO/Business unit directors, Supply Chain Project Managers or Operational Managers.
Although a majority of respondents are based in France, 70% operate a supply chain with global reach, whether upstream or downstream.
65% of the respondents belong to
Mapping of the Respondents
the Industry with a broad range of represented sub-sectors including automotive, chemicals, High Tech, luxury, food and beverages, etc. The retail sector comes second with 23% of the respondents being
from this sector.
The companies that took part in the survey represent a balanced sample of turnovers and headcounts.
FIguRe 32 – FunCTIOn OF ReSPOndenTS
FIguRe 33 – geOgRAPHICAl BReAkdOWn OF ReSPOndenTS
FIguRe 34 – SuPPly CHAIn ReACH OF ReSPOndenTS
48 %
11 %
12 %
13 %
15 %70 %
10 %
20 %
71 %
2 %4 %
4 %
18 %
Supply Chain/logistics director
OtherCeO/COO
Operational ManagerProject Manager
Source: Supply Chain barometer 2012 Source: Supply Chain barometer 2012
Supply Chain with global reachSupply Chain with continental reachSupply Chain with national reach
Source: Supply Chain barometer 2012
France
Others
Other european countriesnorth AmericaSouth America
33
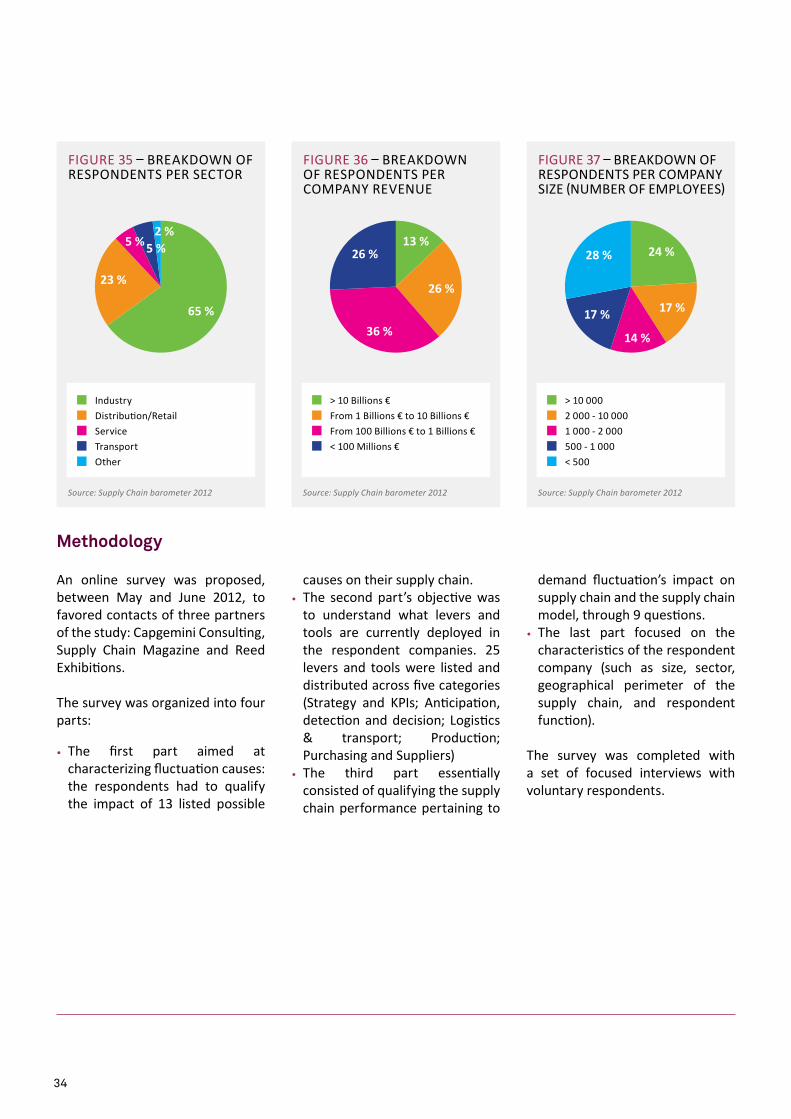
FIguRe 35 – BReAkdOWn OF ReSPOndenTS PeR SeCTOR
FIguRe 36 – BReAkdOWn OF ReSPOndenTS PeR COMPAny ReVenue
FIguRe 37 – BReAkdOWn OF ReSPOndenTS PeR COMPAny SIZe (nuMBeR OF eMPlOyeeS)
Industry
TransportOther
distribution/RetailService
65 %
2 %5 %5 %
23 %
> 10 Billions €
< 100 Millions €
From 1 Billions € to 10 Billions €From 100 Billions € to 1 Billions €
26 %
13 %26 %
36 %
> 10 000
500 - 1 000< 500
2 000 - 10 0001 000 - 2 000
Source: Supply Chain barometer 2012 Source: Supply Chain barometer 2012 Source: Supply Chain barometer 2012
24 %28 %
17 %
14 %
17 %
An online survey was proposed, between May and June 2012, to favored contacts of three partners of the study: Capgemini Consulting, Supply Chain Magazine and Reed exhibitions.
The survey was organized into four parts:
• The first part aimed at characterizing fluctuation causes: the respondents had to qualify the impact of 13 listed possible
Methodology
causes on their supply chain.• The second part’s objective was
to understand what levers and tools are currently deployed in the respondent companies. 25 levers and tools were listed and distributed across five categories (Strategy and kPIs; Anticipation, detection and decision; logistics & transport; Production; Purchasing and Suppliers)
• The third part essentially consisted of qualifying the supply chain performance pertaining to
demand fluctuation’s impact on supply chain and the supply chain model, through 9 questions.
• The last part focused on the characteristics of the respondent company (such as size, sector, geographical perimeter of the supply chain, and respondent function).
The survey was completed with a set of focused interviews with voluntary respondents.
34
About the sponsors
Since its foundation in 1829, ecole Centrale Paris has followed the same calling: training engineers capable of meeting the greatest challenges of their era. The quality and commitment of its 2100 students (1400 engineering students, 130 Master of Science students, 250 Professional Master students and 225 doctoral students), 180 permanent faculty members and its international network represent for ecole Centrale Paris essential assets. The area of Supply Chain management which
exhibits a growing interest at ecole Centrale Paris in the recent years gathers more than 150 students per year, including forty students belonging to the 3rd year Specialized Training Program “Parcours Supply Chain Management”, co-managed by Ms. evren Sahin and M. Zied Jemai.
Find out more at: www.ecp.fr
Capgemini Consulting is the global strategy and transformation consulting organization of the Capgemini group, specializing in advising and supporting enterprises in significant transformation,
from innovative strategy to execution and with an unstinting focus on results. With the new digital economy creating significant disruptions and opportunities, our global team of over 3,600 talented individuals work with leading companies and governments to master digital Transformation, drawing on our understanding of the digital economy and our leadership in business transformation and organizational change.Our Supply Chain Management practice offers high-end management consulting services to help drive strategy formulation and execution, transform supply chains and accelerate results. Our expertise includes: Planning, logistics and fulfilment, Operational excellence and lean, Procurement and digital supply chain transformation.
Find out more at: www.capgemini-consulting.com
eSSCA School of management is one of France’s reference business schools. Students enter after High School for a 5 year officially approved Master’s program. Four tracks are open: Marketing, Finance, Management and International business.located in Angers, Paris, Budapest and Shanghai, eSSCA is the first French school to have received the ePAS accreditation for the excellence of its program, its opening abroad and its proximity to firms.
eSSCA’s pedagogical project carries strong humanistic values, nurturing every student’s personal accomplishment and search for excellence.
Find out more at: www.essca.fr
Supply Chain Magazine offers free access to professional Supply Chain information: latest news, feature articles, special reports and testimonies from professionals. Multiple media—paper magazine, website, daily newsletter, conferences,
directory—and a high audience, make it the French reference for industry and distribution decision-makers. SupplyChain Magazine also organizes several events among which the FORuM d’eTe, leS ROIS de lA SuPPly CHAIn and, in partnership with Reed exhibitions France, the SuPPly CHAIn eVenT. SupplyChain Magazine is also the press partner of the CluB AgORA du SuPPly CHAIn MAnAgeMenT, leading network of French Supply Chain directors.
Find out more at: www.supplychainmagazine.fr
Reed exhibitions and Supply Chain Magazine have joined forces to create a new concept: the SuPPly CHAIn eVenT, an international exhibition for solutions and tools to optimise the flow of goods. The first edition in 2012 brought together
70 exhibitors and 3,000 professionals in Paris.
Find out more at: www.supplychain-event.com
Most important business gathering in transport and logistics in France, SITl trade show has been bringing together all the products and innovative services dedicated to the supply, distribution and the supply chain of tomorrow for the benefit of the goods transportation and logistics services community. Its next gathering, 26 to 28 March 2013, will be its 30th edition.
Find out more at: www.sitl.eu
35

Contacts
Australiadave [email protected]
BelgiumPierre [email protected]
ChinaBin [email protected]
Finland – SwedenBo [email protected]
FranceMathieu [email protected]
GermanyMartin [email protected]
NetherlandsTon van [email protected]
North Americadan [email protected]
NorwayAstrid [email protected]
SpainPedro Provedo [email protected]
United Kingdom – IrelandJames [email protected]
www.capgemini-consulting.com