supply chain development - chalmers publication library...
TRANSCRIPT

Department of Technology Management and Economics Division of Service Management and Logistics CHALMERS UNIVERSITY OF TECHNOLOGY Gothenburg, Sweden 2017 Report No. E2016:022
Supply Chain Development Examining the logistics service offering in a medical device company: A Case Study Master of Science Thesis in the Quality and Operations Management Programme
DANAR DARA MUSTAFA


MASTER’S THESIS E2016:022
Supply Chain Development Examining the logistics service offering in a medical device company:
A Case Study
DANAR DARA MUSTAFA
Examiner: Gunnar Stefansson
Department of Technology Management and Economics
Division of Service Management and Logistics
CHALMERS UNIVERSITY OF TECHNOLOGY
Gothenburg, 2017
Supply Chain Development
Examining the logistics service offering in a medical device company: A case study
DANAR DARA MUSTAFA
© DANAR DARA MUSTAFA, 2017.
Master’s Thesis E2016:022
Department of Technology Management and Economics
Division of Service Management and Logistics
CHALMERS UNIVERSITY OF TECHNOLOGY
SE-412 96 Gothenburg Sweden
Telephone + 46 (0)31-772 1000
Cover: Illustrating the management of the supply chain as one integrated unit in order to make
the cog wheel spinning.
Source: Microsoft Office 2010 Clipart
Printed by Chalmers Reproservice
Gothenburg, Sweden 2017
ACKNOWLEDGEMENTS
I would like to start by thanking my supervisor at Mölnlycke Healthcare, Staffan Bröte for
initiating and supporting this thesis work. This thesis has been realized with the effective
guidance and assistance of Staffan Bröte and Niklas Jakobsson. Within the company, I want
to thank all employees for their support and willingness for answering questions. I would also
like to thank my supervisor at Chalmers University of Technology, Gunnar Stefansson, for his
support throughout this thesis work.
To my family, thank you for encouraging me of pursuing my dreams. To my brothers, Dawan
and Dyar, thank you for inspiring me. I am especially grateful to my parents, Dara and Nasrin,
for their guiding me as a person and for always believing in me.
Gothenburg, January, 2017
Danar Dara Mustafa

ABSTRACT
The management of supply chains is getting more complex in terms of coordination and
shifting of customer needs and requirements. Therefore organizations need to continuously
improve in order to satisfy these needs and requirements. Mölnlycke Healthcare (the medical
device company) design and supply products and solutions in a range of areas such as wound
treatment, pressure ulcer, and surgery. The healthcare setting is complex and its supply chain
characteristics differ from manufacturing setting. Healthcare supply chain focuses on patient
safety with a high volume of transactions and high process variations. One solution to meet
the complexity in today’s supply chains is a supply chain which moves beyond the thinking of
“one-size-fits-all” approach. The new approach is based on the trend of a differentiated
supply chain strategy.
Supply Chain Differentiation starts with the customer, understanding the structure, behavior,
and strategies of what the customer sees as value. This thesis is focusing on examining the
logistics service offer between different customers and to identify its values. Understanding
the customers’ needs and what value is for the customer is critical in the segmentation
journey. The researcher worked in the company’s main office in Gothenburg together with
company representatives in order to get a deeper insight into supply chain processes.
The researcher collected data during two phases and combined several data collection
methods. The findings from contracts, internal documents and interviews showed how the
different values differed between the different customer segments. The conclusion is that
today the customers have a variety of different logistics needs and requirements. Taking a step
further and combining this finding with statistical data, differences between customers in
terms of the amount of order, demand variability, and product varieties was identified. This
finding concludes the need to match the right supply chain strategy for different customers in
order satisfy all customers and be more efficient. The recommendations for the organization
are to have differentiated supply strategy matching different customer needs and
requirements. Further, providing a standard logistics offer matching the different strategies
can reduce complexity and improve efficiency. The final recommendation is to continue to
improve the supply chain together with stakeholders to ensure the mission of patient safety. In
the last part of the thesis, both recommendation and suggestions for future work are presented.
Keywords:
Supply Chain Development; Supply Chain Strategy; Supply Chain Management; Supply
Chain Differentiation; Agile Supply Chain Strategy; Lean Supply Chain Strategy; Healthcare
Logistics; Logistics Service Offering

TABLE OF CONTENTS
1. INTRODUCTION ................................................................................................................. 1
1.1 Background .................................................................................................................... 1
1.2 Purpose .......................................................................................................................... 1
1.3 Limitations ...................................................................................................................... 2
1.4 Research questions ...................................................................................................... 2
1.5 Dissertation structure ................................................................................................... 3
1.6 About Mölnlycke Health Care ..................................................................................... 3
2. THEORETICAL FRAME OF REFERENCE ................................................................... 4
2.1.1 What is Supply Chain Management? ..................................................................... 4
2.1.2 Logistic Service Offering and Quality ..................................................................... 6
2.1.3 Supply Chain Quality in Healthcare ........................................................................ 7
2.1.4 The Product Lifecycle: An Short introduction ........................................................ 9
2.1.5 DMV³ Variables ........................................................................................................ 10
2.1.5 Push and Pull: An overview ................................................................................... 10
2.1.6 Decoupling point ...................................................................................................... 11
2.1.8 The Lean, Agile and Leagile Strategy .................................................................. 12
2.2 Supply Chain Segmentation .......................................................................................... 13
2.2.1 Setting the scene: Introduction .............................................................................. 13
2.2.2 Different approaches to Supply Chain Segmentation ........................................ 15
2.2.3 Tools for supply chain segmentation: Customer analysis ................................. 18
2.2.4 Linking to Lean, Agile and Leagile Strategy ........................................................ 21
3. RESEARCH METHODOLOGY ...................................................................................... 22
3.1 Research Approach ........................................................................................................ 22
3.2 Research Method ............................................................................................................ 23
3.3 Research Design ............................................................................................................. 23
3.4 Data collection methods ................................................................................................. 24
3.4.1 Literature studies ..................................................................................................... 24
3.4.3 Interviews .................................................................................................................. 25
3.2.4 Observations ............................................................................................................ 25
3.4.5 Cost-to-Serve (CTS) Methodology ....................................................................... 25
3.4.6 The Kano Model ....................................................................................................... 25
3.4.6 Validity and Reliability ............................................................................................. 26
3.5 Reasons and Applications for the Selected Methodology ........................................ 27
3.5.1 Phase 1: The reviewing of contracts .................................................................... 27
3.5.2 Phase 2: Linking to the right supply chain strategy ............................................ 28
3.5.3. Method discussion .................................................................................................. 28
4. RESULTS & ANALYSIS ................................................................................................. 30
4.1 Phase 1: The reviewing of contracts ............................................................................ 30
4.2 Phase 2: Linking to the right Supply Chain Strategy ................................................. 32
5. CONCLUSIONS AND RECOMMENDATIONS ........................................................... 36
5.1 Conclusions ................................................................................................................. 36
5.2 Recommendations ...................................................................................................... 36
5.3 Future research ........................................................................................................... 37

TABLE OF FIGURES:
Figure 1. The logistcs processes of focus ................................................................................... 2
Figure 2. Dissertation structure .................................................................................................. 3
Figure 3. Mölnlycke Health Care products. Source: Internal company document (2014) ........ 3
Figure 4. The SCOR Model Source: (Supply Chain Council (2008, p.3) .................................. 5
Figure 5 Value Metrics in Supply Chain Source: (Naylor et al. 1999, p.3) ............................... 6
Figure 6 The Healthcare Supply Chain Source: (Smith et al. 2011, p.2) ................................... 8
Figure 7 The Product Lifecycle Source :(Hofstrand, 2007, p.1) ................................................ 9
Figure 8 Different Supply Chain Strategies Source: Hoekstra (1992 cited in Naylor et al.
1999, p.7) .................................................................................................................................. 11
Figure 9 Difference between Agile and Lean Source: (Christopher 2001, p.2) ....................... 12
Figure 10 Segmented vs Not Segmented Supply Chain Source: (Hoffman et al. 2012, p.4) .. 14
Figure 11 The view of Dell’s Supply Chain Differentiation Source: (Hofmann 2012, p.6) .... 16
Figure 12 Supply Chain Differentiation framework Source: (Beck et al. 2012, p.8) .............. 18
Figure 13 Example of two-axis analysis Source: (Becks 2012, p.3) ........................................ 19
Figure 14 An example of three axis analysis (Becks 2012, p.4) .............................................. 19
Figure 15 An example of analysis and linking to supply chain strategies Source:
(Childerhouse et al. 2002, p.681) ............................................................................................. 20
Figure 16 Product lifecycle and different strategies Source: (Aitken et al. 2005, p.15) .......... 21
Figure 17 Characteristic of Supply Chain Strategies Source: (Hofmann 2012, p .67) ............ 21
Figure 18 The Kano Model (Office Clipart 2010) ................................................................... 26
Figure 19 The research design for the study ............................................................................ 27
Figure 20 Categorization by customers, product category and attributes ................................ 28
Figure 21 Data analysis between different customers .............................................................. 33
Figure 22 Data analysis between three customers ................................................................... 33
Figure 23 Cluster matrix for comparing volume and gross contribution between customers . 34
TABLE OF TABLES:
Table 1. Healthcare Supply Chain ........................................................................................................................... 6
Table 2. The differences between Lean and Agile ................................................................................................ 13
Table 3 An approach to Supply Chain Segmentation Source: (Davis, 2010)........................................................ 15
Table 4 An approach to Supply Chain Segmentation (Ops Rules, 2010) ............................................................. 16
Table 5 Five ways to approach segmentation Source: (Tathagata, 2012) ............................................................. 17
Table 6. The rule, case and result for three research approaches Source: (Svennevig, 2003 cited in Mustafa, 2014
p.26) ...................................................................................................................................................................... 22
Table 7. Differences between qualitative method and quantitative method. Source: (Mack et al., 2011 cited in
Mustafa, 2014) ...................................................................................................................................................... 23
Table 8. Variation of approaches to conduct a case study. Source: (Menya, 2010 cited in Mustafa, 2014) ........ 24
Table 9 The framework build to link to the right supply strategy ......................................................................... 28
Table 10 Results of the categorization and different factors in the contracts ........................................................ 30
Table 11 Three different quality attributes ............................................................................................................ 34
Table 12 he result of framework for choosing the right supply strategy ............................................................... 34

1
1. INTRODUCTION
1.1 Background
Mölnlycke Healthcare is one of the world-leading medical product and solutions company.
The company design and supply products and solutions in a range of areas such as wound
treatment, pressure ulcer, and surgery. Today, 7500 employees reaching over 90 countries are
working towards the mission to “outstanding solutions for safe, efficient surgical procedures
and gentle, effective wound care”. The headquarters is located in Gothenburg, Sweden.
Today, Mölnlycke healthcare has 15 manufacturing sites and sales through distributors in 63
countries. The management of the supply chain is getting more complex in terms of
coordination and efficiency and requires continuous improvements efforts to stay competitive
and satisfying the customer’s needs.
In 1974, Wickham Skinner wrote the “The Focused Factory” where he described that
factories can be more competitive if they have focused operations. The “one-size fits all”
model means that a factory cannot perform well on every measure and that competence can be
created by simplicity and repetition. Today, globalization and outsourcing have made supply
chains more complex to handle and supply chain teams need to execute a set of processes and
handle many performance metrics (Culey, 2012).
In every organization, it is needed to understand the customer requirements and find ways to
satisfy their needs. Hoffman (2012) argues that this means that one single supply chain cannot
satisfy all customer requirements as they vary across various marketplaces. Add to this mix is
product volume and variety, different service levels and different planning and scheduling
tool and the need for segmentation increases (Culey 2012; Hoffman 2012; Aitken et al.,
2003). Excellent logistics customer service can be seen as a competitive advantage and one
key step is to determine the customer needs and respond to them (Huiskonen & Pirttilä, 1998).
This has led to the relevance of supply chain differentiation which means that companies
segment their supply chain. One of the most promising journeys was made by Dell that went
from a single supply chain to a customer segmentation supply chain approach. As from 2008
to 2010 Dell could lower operational cost by approximately $1.5 billion (Davis, 2010). The
approach to segmentation starts with the customer, understanding the structure, behavior, and
strategies of what the customer sees as value (Culey, 2012)
1.2 Purpose
The purpose of this thesis work is to examine and map the current logistics service elements
in contracts and tenders. This is the first step of understanding customer needs and
requirements. The researcher will attempt to go one step further and present a possible supply
chain strategy based on the elements identified.
2
1.3 Limitations
This thesis work is done in Mölnlycke Healthcare head office in Gothenburg and the data
collected are for the Swedish market and customers. To complete this thesis work a broad
range of business, supply chain and marketing theories were studied. However, this thesis
work is not examining the follow areas within company: The reasons for this limitation were
set together with different stakeholders and takes to account of the balancing of time and
resources.
Supply or Business networks
Purchasing management
Supplier or transportation relationship
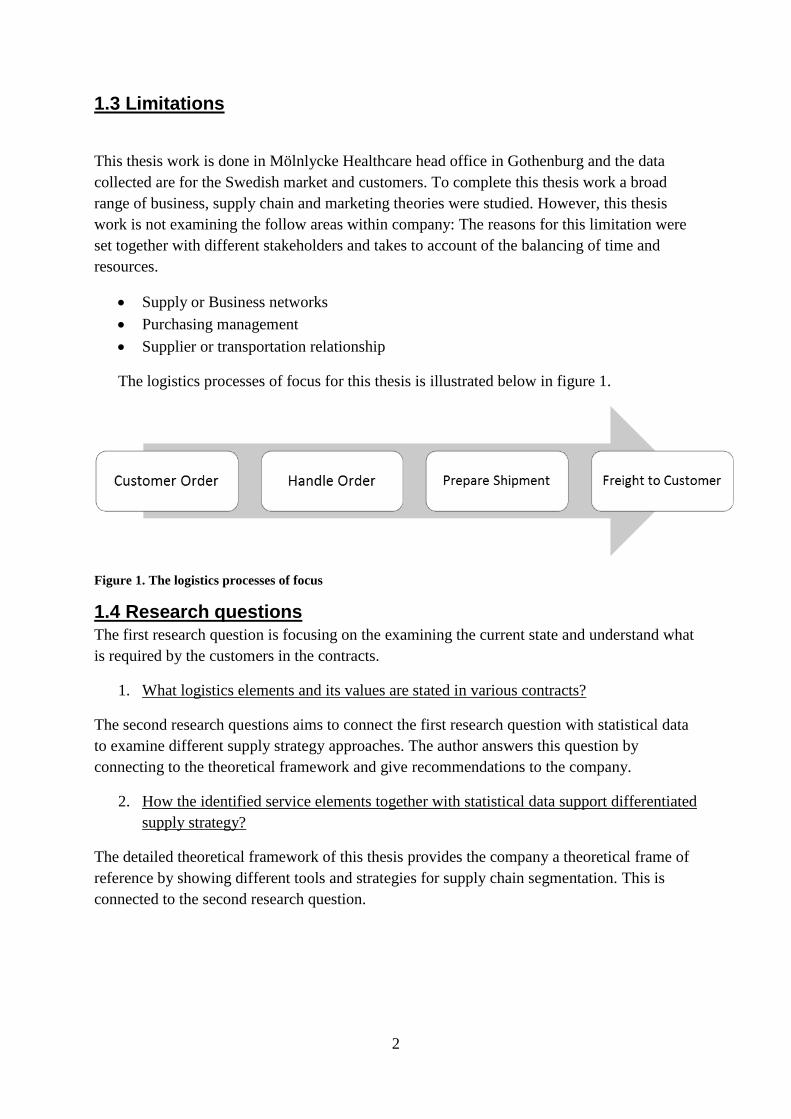
The logistics processes of focus for this thesis is illustrated below in figure 1.
Figure 1. The logistics processes of focus
1.4 Research questions The first research question is focusing on the examining the current state and understand what
is required by the customers in the contracts.
1. What logistics elements and its values are stated in various contracts?
The second research questions aims to connect the first research question with statistical data
to examine different supply strategy approaches. The author answers this question by
connecting to the theoretical framework and give recommendations to the company.
2. How the identified service elements together with statistical data support differentiated
supply strategy?
The detailed theoretical framework of this thesis provides the company a theoretical frame of
reference by showing different tools and strategies for supply chain segmentation. This is
connected to the second research question.

3
1.5 Dissertation structure
In order to fulfill the academic requirements the structure as shown in figure 2 below was
created
Figure 2. Dissertation structure
1.6 About Mölnlycke Health Care
Mölnlycke Healthcare is one of the world-leading medical product and solutions company.
The company was founded in 1849 as a textile manufacturer. In the 1900s the company had
become a main supplier to Swedish hospitals. Through product inventions the company has a
broad product portfolio within surgical gowns, wound management and as well turning and
positioning systems for the health care settings. Figure 3 below shows example of three
products categories in the company’s product portfolio.
Figure 3. Mölnlycke Health Care products. Source: Internal company document (2014)
The company design and supply products and solutions in a range of areas such as wound
treatment, pressure ulcer, and surgery. Today, 7500 employees reaching over 90 countries are
working towards the mission to “outstanding solutions for safe, efficient surgical procedures
and gentle, effective wound care”. The headquarters is located in Gothenburg, Sweden.
Mölnlycke healthcare has 15 manufacturing sites and sales through distributors in 63
countries.
4
2. THEORETICAL FRAME OF REFERENCE
This chapter will focus on presenting the theoretical framework that is needed in order to
understand the following chapters in this thesis work. This chapter is divided into two
sections: Supply Chain Management Overview and Supply Chain Segmentation. The first
section will give the reader an introduction to supply chain management and present some
underlying methods used in this work. In order to understand supply chain segmentation,
some basic topics regarding supply chain strategy and manufacturing will be covered shortly
in order to provide necessary insights. The second section will build upon the first section and
present the supply chain segmentation process.
2.1.1 What is Supply Chain Management?
The concept of Supply Chain Management (SCM) is getting more attraction and gaining in
importance. In recent studies, many executives stated the importance of SCM from a
practitioner’s point of view. Also in the academics, the number of SCM articles continue to
grow since the 1990s. The Supply Chain Council, the worldwide professional association of
supply chain management defines a supply chain as:
“All product (physical material and service) transactions from your supplier’s supplier to
your customer’s customer, including equipment, supplies, spare parts, bulk products,
software etc.”
(Supply Chain Council, 2008, p.3)
The research of Stock and Bayer (2009, p.706), gives a definition of supply chain
management as:
“The management of a network of relationships within a firm and between interdependent
organizations and business units consisting of material suppliers, purchasing, production
facilities, logistics, marketing and related systems that facilitate the forward and reverse flow
of materials, services, finances and information from the original producer to final customer
with the benefits of adding value, maximizing profitability through efficiencies, and achieving
customer satisfaction.”
(Stock and Bayer, 2009, p.706)
Huan et al. (2004), states that SCM research can be classified into three categories:
Operational, Design and Strategic. The authors explain that the operational area is
focusing with the daily operation of a plant or a distribution center. The goal is to make sure
to find the most profitable way to fulfill customer order. The ways to execute this can include
inventory management or planning and scheduling with mathematical tools. The design of a
supply chain is focusing on the location and the objectives of the chain (Mourits and Evers,
1995 cited in Huan et al. 2004) The authors explains: “a good design should integrate various
5
elements of the supply chain and strive for optimization of the entire chain rather than
individual entities” (Huan et al. 2005, p.23)
The strategic focus is decision that are made by business managers and this requires
understanding of the dynamic of the whole supply chain (Gopal, 1992 cited in Huan et al.
2004). Also, this requires critical evaluation of the alternative supply chain configurations and
enhance that the firm is competitive among the network of supply chains.
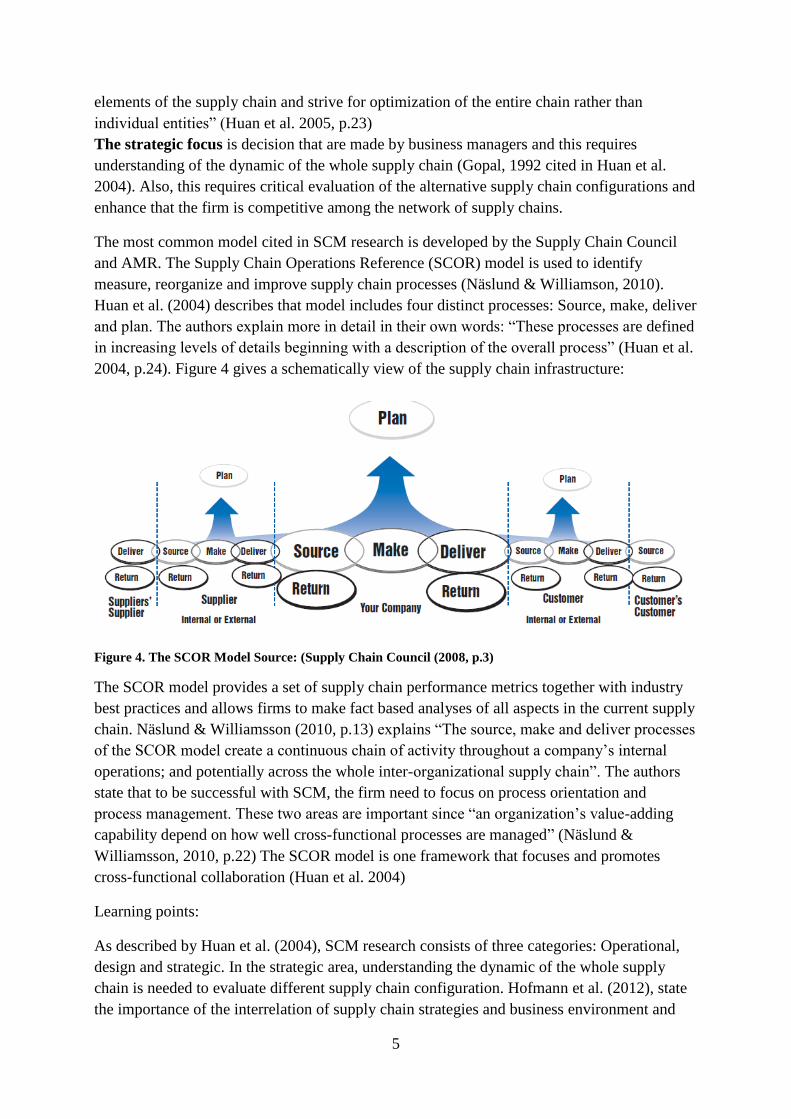
The most common model cited in SCM research is developed by the Supply Chain Council
and AMR. The Supply Chain Operations Reference (SCOR) model is used to identify
measure, reorganize and improve supply chain processes (Näslund & Williamson, 2010).
Huan et al. (2004) describes that model includes four distinct processes: Source, make, deliver
and plan. The authors explain more in detail in their own words: “These processes are defined
in increasing levels of details beginning with a description of the overall process” (Huan et al.
2004, p.24). Figure 4 gives a schematically view of the supply chain infrastructure:
Figure 4. The SCOR Model Source: (Supply Chain Council (2008, p.3)
The SCOR model provides a set of supply chain performance metrics together with industry
best practices and allows firms to make fact based analyses of all aspects in the current supply
chain. Näslund & Williamsson (2010, p.13) explains “The source, make and deliver processes
of the SCOR model create a continuous chain of activity throughout a company’s internal
operations; and potentially across the whole inter-organizational supply chain”. The authors
state that to be successful with SCM, the firm need to focus on process orientation and
process management. These two areas are important since “an organization’s value-adding
capability depend on how well cross-functional processes are managed” (Näslund &
Williamsson, 2010, p.22) The SCOR model is one framework that focuses and promotes
cross-functional collaboration (Huan et al. 2004)
Learning points:
As described by Huan et al. (2004), SCM research consists of three categories: Operational,
design and strategic. In the strategic area, understanding the dynamic of the whole supply
chain is needed to evaluate different supply chain configuration. Hofmann et al. (2012), state
the importance of the interrelation of supply chain strategies and business environment and

6
the need to be considered from the customer’s and the firm’s perspective. Achieving a
differentiated supply chain build upon aligning suitable supply chain strategy to given
customer segment. (Hofmann et al. 2012). In order to understand supply chain segmentation,
some basic topics regarding supply chain strategy, manufacturing and finance will be covered
shortly in order to provide necessary insights.
2.1.2 Logistic Service Offering and Quality
Understanding the marketplace and customer requirements is needed to adjust supply chains
to match the requirements of the customers. However, Hoffman et al. (2012) state that this is a
complex process which requires resources and time. To provide an overview of customer
requirements, Naylor et al (1999) categories four strategic needs: Lead time, quality,
flexibility and price. This is shown in the figure 5 below and also shows some performance
metrics in each category.
Figure 5 Value Metrics in Supply Chain Source: (Naylor et al. 1999, p.3)
In summary, lead time can be described as the speed of a company and include the time for
delivery. Quality can be defined as what the customer requires and is willing to pay for.
Flexibility includes being adaptable to market changes and the range of customer support.
And the final dimension, cost, is referring to the actual price of the product or service
Theory about service offering is to be found in service management and marketing. Atkacuna
& Furlan (2009) have reviewed number of sources and found that service package consists of
core and supplementary service. A core service is related to the company being on the market
and from the customer’s perspective as vital (Grönroos 2000 cited in Atkacuna & Furlan,
2009). The supplementary service or augmented service offering can be seen as basic service
package and three other elements. The three elements are: accessibility of the service,
interaction with the service organization and customer participation. As one example,

7
accessibility of the service can be the service provider’s office hours (Grönroos 2000 cited in
Atkacuna & Furlan, 2009)
Adding to aspect of service elements, the service quality is important and connects to
customer satisfaction and loyalty. Kasper et al (2006 cited in Atkacuna & Furlan, 2009)
describes five dimension of service quality: Reliability, assurance, tangibles, empathy and
responsiveness.
In today’s business environment many companies have outsourced logistics functions to third
party logistics providers (3PL) and take advance of their knowledge and economies of scale
(Atkacuna & Furlan, 2009). Bask (2000 cited in Atkacuna & Furlan, 2009, p.1) defines the
term third-party logistics as a situation “where the logistics provider servers two parties in the
supply chain”. There are number of frameworks focusing on the activities of logistics service
provides and their classifications of functions. Ahl and Johansson (2002 cited in Atkacuna &
Furlan, 2009) defines four parts: basic service, value-added services, administrative
service and IT-services. The term value-adding is defined as a service adding extra feature,
form or functions to the basic service and is not traditionally offered by 3PL provider
(Atkacuna & Furlan, 2009). Ahl and Johansson (2002 cited in Atkacuna & Furlan, 2009)
gives two examples of value-adding services: Value-added service included in the contract
such as labeling and value-added services such as dealing with goods damage during
transportation.
Excellent logistics customer service can be seen as a competitive advantage and one key is to
determine the customer needs and respond to them (Huiskonen & Pirttilä, 1998). The authors
state that logistics customer service planning is carried out at strategic, tactical and
operational level. On the strategic level decision is focused on customer segments and their
service requirements. One way to offer a more detailed description of different service
elements and their behaviors is by suing the Kano Model to identify logistics customer
service. The reason is described by the authors: “Moreover, classification facilitates the
recognition of different customer requirements, and hence improves customer service
differentiation decisions” (Huiskonen & Pirttilä, 1998, p.254)
2.1.3 Supply Chain Quality in Healthcare This section aims to present studies about supply chain quality metrics in the healthcare. The
author sees this as a field for better understanding the customers from the healthcare setting
and their requirements and complements the data collected in this thesis work.
Smith et al. (2011) describes in their study the increasing cost of providing healthcare in the
US. One of the underlying factors was found to be healthcare supply chain to be immature.
The authors explain that healthcare supply chain is different to other industries. They provide
an illustrative view of the healthcare supply chain as shown in figure 6 below.

8
Figure 6 The Healthcare Supply Chain Source: (Smith et al. 2011, p.2)
Usually, the hospitals, clinics or pharmacies get goods directly from a producer or through a
distributor or Group purchasing organization (GPO). From the healthcare perspective it is
complex to manage the supply chain, issues such as visibility across the supply chain,
regulatory issues and lack of planning both upstream and downstream are mentioned by the
authors (Smith et al,. 2011). One way could be to measure and improve performance across
the healthcare supply chain. Smith et al. (2011) however found in their research that there is a
gap in the literature in regards to supply quality metrics and what it means. While healthcare
focuses on “patient safety”, manufacturing companies focus on “profit” as factor in supply
chain quality. In their study they present the findings of factors influencing quality of the
healthcare supply chain according to healthcare experts. The findings present both internal
and external factors. These factors are illustrated in the table 1 below.
Table 1: Different factors in Healthcare Supply Chain Source: (Smith et al.2011)
Factor Description
Availability of materials Have what they need to the job at the time
they need it
High volume of transactions It is over 4000 or more transaction per month
in a typical healthcare inventory system
Integrity of the supply chain Understanding what happened to a product
between the point of manufacture and the
point of use is critical
Poor product traceability If a product is recalled then problem arise in
product identification and tracking
Process variation In the healthcare supply chain a product can

9
arrive at an organization in many different
ways
Quality of information and its exchange Rework because data is lacking integrity
from manufacturer to bedside
In recent studies, the healthcare supply chain has gained more attraction and Kwon et al.
(2016) shows three areas where supply chain operation can improve. The author’s mentions
supplier relationship management, logistics operational tools and process improvement.
These areas are also in line with studies from Swedish healthcare settings. The Swedish
healthcare system has attracted the methodology and principles from Lean and Agile
philosophy (Arvidsson, 2007). The term “vårdlogistik” combines tools usually used in
manufacturing settings to be applied within to healthcare for improving patient and product
flow.
2.1.4 The Product Lifecycle: An Short introduction
The product lifecycle model defines four stages during a product lifetime (Hofstrand, 2007).
The four stages are: Introduction, growth, mature and decline and is shown in figure 7.
Figure 7 The Product Lifecycle Source :(Hofstrand, 2007, p.1)
In the introduction stage, the product needs to be introduced to buyers and sales are small. In
the growth stage, buyers are familiar to the product and sales are increasing and competitors
may enter the market (Hofstrand, 2007). In the mature stage, the markets have become
saturated and sales are from repeat buyer. In the last stage, decline, buyers seek new product
and fierce competition is leading to narrow profit margins (Hofstrand, 2007).

10
2.1.5 DMV³ Variables
In the section above four dimensions was presented to understand customer requirements.
Adding to this, Christopher and Towill (2005) describes five variables that influence the
design of supply strategies by the DMV³ variables. The variables encompass duration of life
cycle, time window for delivery, volume, variety and variability. The different variables has
link to the product life cycle characteristics and are summarized below.
Duration of life cycle: Depending on the stage of the product life cycle, different demand
chain types can be used. Aitken et al., (2005), states that rapid-to-market can be used for short
life cycles and lead times can be matched to the different stages.
Time Window for delivery: Identifying how quickly the supply chain should react to
demand can give understanding what kind of strategy should be used for products. Also, there
is a difference time window between standardized product compared to more complex and
customized (Aitken et al., 2005)
Volume: Different strategies apply for mass produced product compared with products with
smaller volumes. The volume will determine make-to-forecast strategies and flexibility in the
demand chain (Hofmann et al., 2012)
Variety: The variety variable is considering the firms range of products and understand the
variety demanded by the marketplace (Aitken et al., 2005). The variety and demand
variability will effect stocking keeping units and high variety will influence both the supply
chain and manufacturing processes.
Variability: The variability in demand is about the variation in demand and its
unpredictability. If the demand forecast is uncertain then this will influence the production
process (Hofmann et al., 2012).
2.1.5 Push and Pull: An overview
According to Kong & Allan (2007), push and pull model are two predominant systems in
supply chain operation. Zhang & Zhao (2008) describes that the push supply chain as:
“Push supply chain takes manufacturers as core enterprises, sells commodities to consumers
designedly according to the production and repertory of products, which drive roots from the
production of manufacturers in the upper of supply chain” (Kong & Allan, 2007, p.2). In this
system, production and distribution decision are made based on the result of long-term
forecast and looks to meet determined demand. Kong & Allan (2007) describe that in a push
model: “stock is pushed up the supply chain” in order to ensure customer demand. The push
system uses material requirement planning to build the reorder point and to plan production.
In contrast, Kong & Allan (2007) state that the pull system moves inventory down in the
supply chain to manufacturer. Pull supply chain focuses on consumers and is organize
demand and production based on consumer demand. The pull system will have effect on
inventory as this will create smaller batch size orders and the delivery frequency will be
increased (Zhang & Zhao, 2008). The pull system uses tools based on Just-in-time and zero
11
inventory techniques. These two models can be used in supply chain operation and depend
different factors such as on product characteristics, demand variability and customer drivers
(Zhang & Zhao, 2008).
2.1.6 Decoupling point
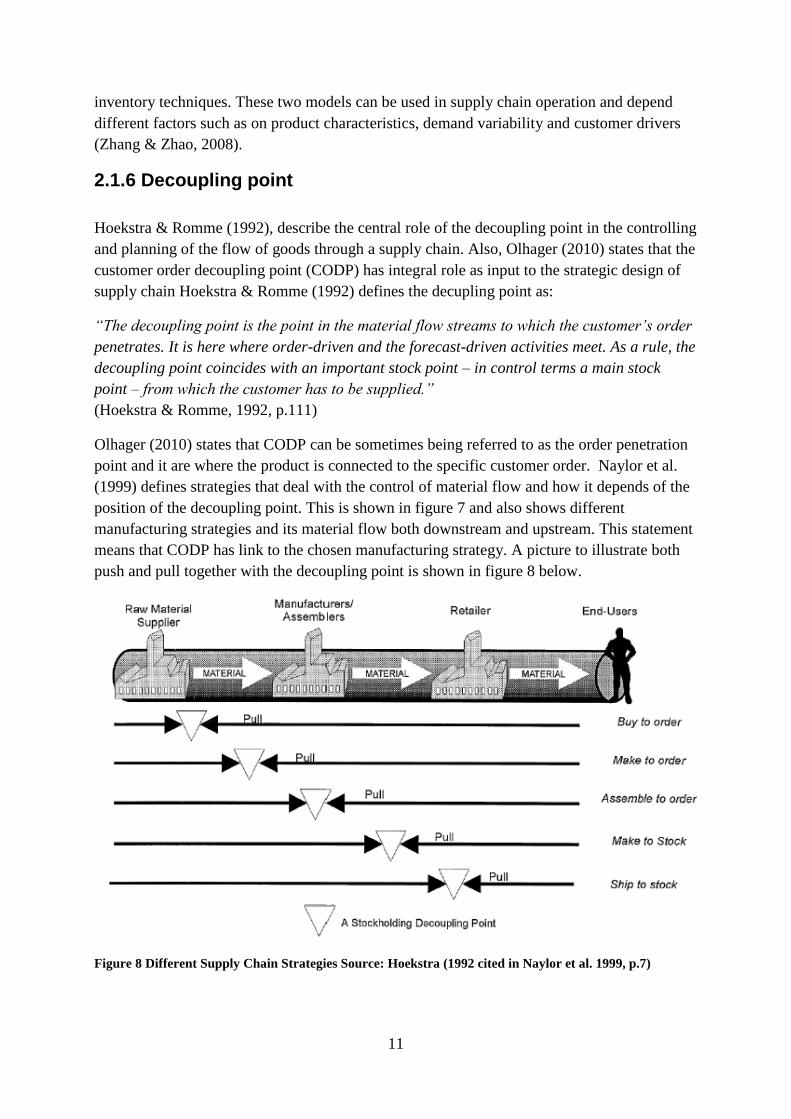
Hoekstra & Romme (1992), describe the central role of the decoupling point in the controlling
and planning of the flow of goods through a supply chain. Also, Olhager (2010) states that the
customer order decoupling point (CODP) has integral role as input to the strategic design of
supply chain Hoekstra & Romme (1992) defines the decupling point as:
“The decoupling point is the point in the material flow streams to which the customer’s order
penetrates. It is here where order-driven and the forecast-driven activities meet. As a rule, the
decoupling point coincides with an important stock point – in control terms a main stock
point – from which the customer has to be supplied.”
(Hoekstra & Romme, 1992, p.111)
Olhager (2010) states that CODP can be sometimes being referred to as the order penetration
point and it are where the product is connected to the specific customer order. Naylor et al.
(1999) defines strategies that deal with the control of material flow and how it depends of the
position of the decoupling point. This is shown in figure 7 and also shows different
manufacturing strategies and its material flow both downstream and upstream. This statement
means that CODP has link to the chosen manufacturing strategy. A picture to illustrate both
push and pull together with the decoupling point is shown in figure 8 below.
Figure 8 Different Supply Chain Strategies Source: Hoekstra (1992 cited in Naylor et al. 1999, p.7)

12
2.1.8 The Lean, Agile and Leagile Strategy
As described in sections above, supply chain design and strategy includes many factors. As
complexity increases there is a need to improve performance for meeting demand and
synchronize the supply chain (Christopher, 2001). The paradigms about Lean and Agile have
been developed in the manufacturing setting, with the origins of Lean linking to the Toyota
Production System. Table 2 below summarizes the lean and agile characteristics and some
key points are described below
Naylor et al., (1999) provide a definition of leanness as: Leanness means developing a value
stream to eliminate all waste, including time, and to ensure a level schedule”. Lean focuses
on reduction and elimination of waste and implies “zero inventory” and “just-in-time”
approaches (Christopher, 2001). In supply chain characteristics, lean have emphasize on
efficiency and the goal is to have minimum stock holding.
One of the crucial characteristics of agility is flexibility and in the manufacturing setting this
was enabled be automation, reduced set-uptimes and greater responsiveness in volume.
Naylor et al., (1999) defines agility as: “Agility means using market knowledge and a virtual
corporation to exploit profitable opportunities in a volatile market place”.
Christopher (2001) defines two important aspects in agility: Variety and Variability. If an
organization is embracing agility, it is focusing on responding rapidly in changes in terms of
volume and variety. This distinction between lean and agile is shown in the figure 9 below.
Figure 9 Difference between Agile and Lean Source: (Christopher 2001, p.2)
Christopher (2001) discusses an important issue, namely the common problem of limited
visibility of real demand in supply chains. The authors suggest that supply chains tend to be
forecast driven rather than demand driven, this due multiple levels of inventory looking from
production to the final marketplace. As discussed in the section about decoupling point,
enabling lean and agile supply chains will have different effect of the decoupling point.
Christopher (2001) explains that in agile strategy it is desirable to carry inventory (semi-
finished products) and postpone until final assembly or localization. Combining this strategy

13
with the benefits of level scheduling and high level efficiency creates the approach called
leagile. The definition of leagile is defined by Naylor et al., (1999) as:
“Leagile is the combination of the lean and agile paradigms within a total supply chain
strategy by positioning the decoupling point so as to best suit the need of a volatile demand
downstream yet providing level scheduling upstream from the marketplace” (Naylor et al.
1997)
The figure below describes the leagile supply chain, combining both lean processes and agile
processes. Christopher (2001) point out the importance of understanding that there are two
decoupling points, the first is the “material” decoupling point and the second is the
“information decoupling point”. Table 2 below summarizes the differences between lean and
agile methodology.
Table 2. The differences between Lean and Agile
Lean Agile
Objectives Low Cost
High Utilization
Minimum stocks
Fast response
Buffer capacity
Deployed stock
Process Characteristics Elimination of waste
Smooth operation flow
High level of efficiency
Quality assurance
Flexibility
Market sensitivity
A virtual network
Postponement
Product Characteristics Functional product
Low variety
Low margin
Innovative products
High variety
High margin
2.2 Supply Chain Segmentation
2.2.1 Setting the scene: Introduction
Becks (2010) mention the globalization and outscoring as reasons for companies with more
single-supply chain not meeting requirement of their major customers. As complexity and
interdependence raises the need for a modern and adaptable supply chain processes increases
Becks present supply chain segmentation as grouping customers with similar fulfillment
needs and then develop an individual supply chain operation to meet these requirements. In
the authors words: “As its core, supply chain segmentation is a process of grouping customers
by shared sets of values, then developing supply chains that can profitability meet the needs
of each customer group in its own terms”(Becks, 2010, p.2). A view of the segmented supply
chain is shown in figure 10 below.
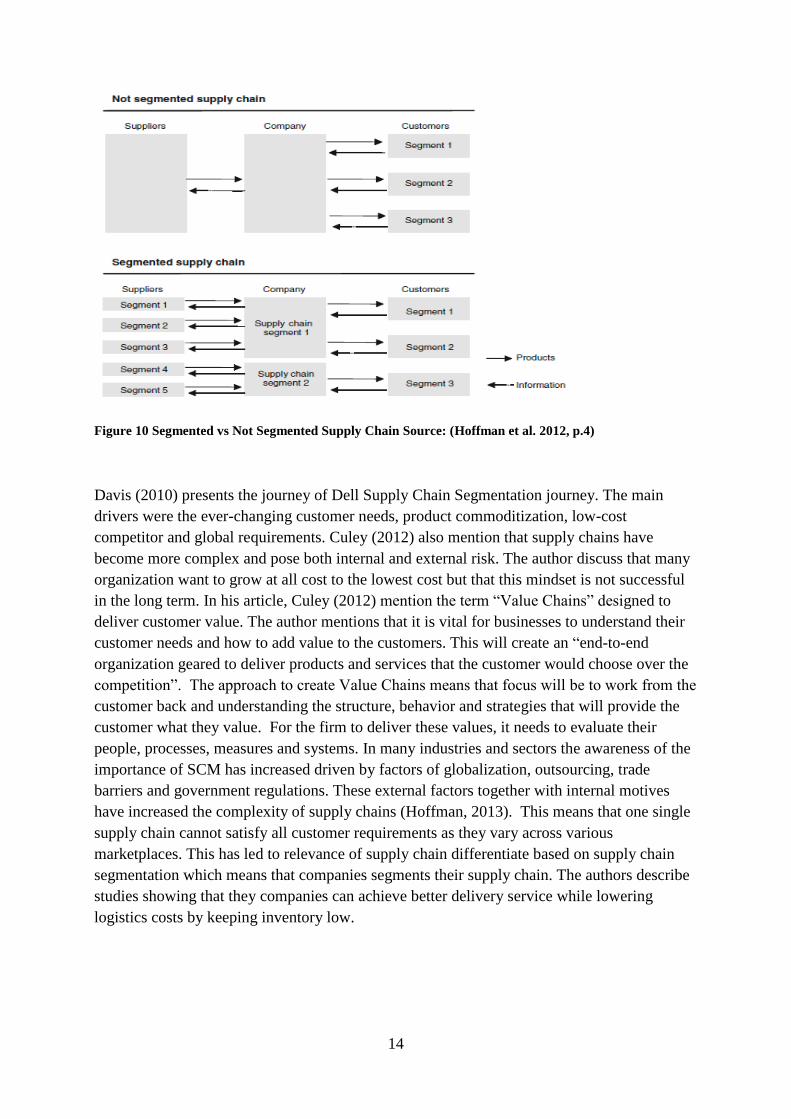
14
Figure 10 Segmented vs Not Segmented Supply Chain Source: (Hoffman et al. 2012, p.4)
Davis (2010) presents the journey of Dell Supply Chain Segmentation journey. The main
drivers were the ever-changing customer needs, product commoditization, low-cost
competitor and global requirements. Culey (2012) also mention that supply chains have
become more complex and pose both internal and external risk. The author discuss that many
organization want to grow at all cost to the lowest cost but that this mindset is not successful
in the long term. In his article, Culey (2012) mention the term “Value Chains” designed to
deliver customer value. The author mentions that it is vital for businesses to understand their
customer needs and how to add value to the customers. This will create an “end-to-end
organization geared to deliver products and services that the customer would choose over the
competition”. The approach to create Value Chains means that focus will be to work from the
customer back and understanding the structure, behavior and strategies that will provide the
customer what they value. For the firm to deliver these values, it needs to evaluate their
people, processes, measures and systems. In many industries and sectors the awareness of the
importance of SCM has increased driven by factors of globalization, outsourcing, trade
barriers and government regulations. These external factors together with internal motives
have increased the complexity of supply chains (Hoffman, 2013). This means that one single
supply chain cannot satisfy all customer requirements as they vary across various
marketplaces. This has led to relevance of supply chain differentiate based on supply chain
segmentation which means that companies segments their supply chain. The authors describe
studies showing that they companies can achieve better delivery service while lowering
logistics costs by keeping inventory low.

15
2.2.2 Different approaches to Supply Chain Segmentation
In the case study of Dell, Davis (2010) presents key findings about Dell’s journey. The need
to change market and business strategies required the company to rethink their supply chain
approach. The transformation required cross-functional collaboration between different
functions within the company. For instance, the segmentation started with a Cost-to Serve
methodology where supply chain worked with finance. In the end-result Dell went from a
single supply chain approach to a customer segmentation supply chain approach. As from
2008 to 2010 Dell could lower operational cost by approximately $1.5 billion.
Davis (2010) describes the transformation and present six different phases. In table 3 below,
the different phases are summarized.
Table 3 An approach to Supply Chain Segmentation Source: (Davis, 2010)
Phase Recommendation on what to do
1.Identify Customer Values Use historical customer information from
contracts and surveys
2.Understand the firms Strength Understand what needs to be changed and
what customer values needs to be retained
3.Understand the External Environment Use benchmark to find best practice’s from a
variety of industries
4.Chart Clear Course and Benefit Create a basic framework and design the new
supply chain
5.Engange the Entire Organization The transformation require cross-functional
collaboration, for example, supply chain
need to work with finance
6.Continue to Govern and Refine Portfolio Continuous improvement by lean
methodologies to maintain a focus on
customer values
The authors describes that the first step of the segmentation was by understanding the
company’s customers and channel in order to understand demand rhythms and cycles.
Further, analysis of isolating and quantifying costs was done by looking at Cost-to-Serve
methodology to understand profitability and costs to each business decisions.
Becks et al., (2012) provides a schematic view of the basic principle of Dell’s supply chain
differentiation as shown in figure 11 below.

16
Figure 11 The view of Dell’s Supply Chain Differentiation Source: (Hofmann 2012, p.6)
According to one of the leading consultant firms on supply chain segmentation, Ops Rules
supply chain segmentation is described as:
“The dynamic alignment of customer channel demands and supply response capabilities
optimized for net profitability across each segment” (Bender, 2014, p.1)
Ops rules focuses on consultation of supply chain transformation, presents a six step to
perform supply chain segmentation (Bender, 2014). These are summarized in Table 4 below.
Table 4 An approach to Supply Chain Segmentation (Bender, 2014)
Phase Recommendation on what to do
1.Ensure your customer value proposition
is clear across segments
Ask and understand the firms unique value
proposition and evaluate customers
preference and needs
2.Match Operations Strategy to Customer
Value
Balance the firm’s operations strategy to
meet the customer needs.
3.Reduce Complexity Use customer analysis to understand
purchasing and profitable levels.
4.Design for Supply Chain By using and placing processes and tools
evaluate the supply chain design
5.Discover synergies Examine the value proposition to customer
segments and find synergies
6.Expand End-to-End Integration Align and integrate Sales and Operation
Planning process across all supply chain
segments
In the first steps as shown in the figure, calculating and understand cost and variability is seen
a critical component. The assessment should focus on logistics costs, costs to configure or
assemble and lead time analysis.
17
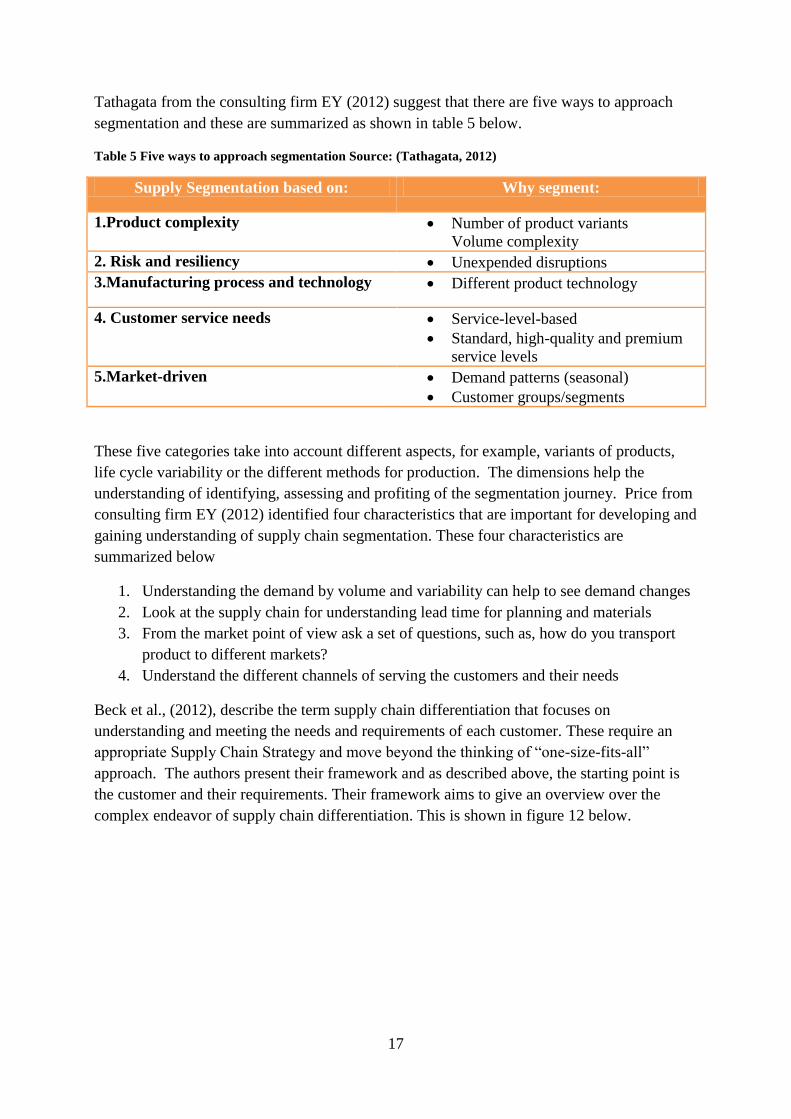
Tathagata from the consulting firm EY (2012) suggest that there are five ways to approach
segmentation and these are summarized as shown in table 5 below.
Table 5 Five ways to approach segmentation Source: (Tathagata, 2012)
Supply Segmentation based on: Why segment:
1.Product complexity Number of product variants
Volume complexity
2. Risk and resiliency Unexpended disruptions
3.Manufacturing process and technology Different product technology
4. Customer service needs Service-level-based
Standard, high-quality and premium
service levels
5.Market-driven Demand patterns (seasonal)
Customer groups/segments
These five categories take into account different aspects, for example, variants of products,
life cycle variability or the different methods for production. The dimensions help the
understanding of identifying, assessing and profiting of the segmentation journey. Price from
consulting firm EY (2012) identified four characteristics that are important for developing and
gaining understanding of supply chain segmentation. These four characteristics are
summarized below
1. Understanding the demand by volume and variability can help to see demand changes
2. Look at the supply chain for understanding lead time for planning and materials
3. From the market point of view ask a set of questions, such as, how do you transport
product to different markets?
4. Understand the different channels of serving the customers and their needs
Beck et al., (2012), describe the term supply chain differentiation that focuses on
understanding and meeting the needs and requirements of each customer. These require an
appropriate Supply Chain Strategy and move beyond the thinking of “one-size-fits-all”
approach. The authors present their framework and as described above, the starting point is
the customer and their requirements. Their framework aims to give an overview over the
complex endeavor of supply chain differentiation. This is shown in figure 12 below.

18
Figure 12 Supply Chain Differentiation framework Source: (Beck et al. 2012, p.8)
To support managerial implications the identified four different triggers for supply chain
differentiation. To illustrate an example, the authors present a schematic view of supply chain
differentiation. It consists of the terms introduced in previous section such as: manufacturing
strategy, supply chain strategy and demand forecasting. Becks et al., (2012) states that
“several intra-as well as inter-organizational aspects have to be considered” when designing a
segmented supply chain (Becks et al., 2012, p.9)
2.2.3 Tools for supply chain segmentation: Customer analysis
In the previous sections, the importance of starting with analyzing the customer needs and
requirements has been stated in different studies. Becks (2010) describe supply chain
segmentation focal point to be about grouping customer by shared values and then design
supply chain to meet their requirements. Davis (2010) describes the Dell transformation
journey and the first step was to identify customer values. This was done by using following
methods and tools: Customer knowledge from contract, Surveys, Business Intelligence data
and platform sales (Davis, 2010).
Becks (2010), suggest that the simplest way to segmentation model are by two-by-two matrix.
Here the authors give two suggestions as shown in figure 13.

19
Figure 13 Example of two-axis analysis Source: (Becks 2012, p.3)
Another possible way to map the customers is by using three-axis models or by radar
diagram. A three-axis model is shown below in figure 14.
Figure 14 An example of three axis analysis (Becks 2012, p.4)
This enables to see how customers will value key attributes. The data can be extracted by
using customer interviews, surveys, financial data and internal company knowledge (Becks,
2012).
20
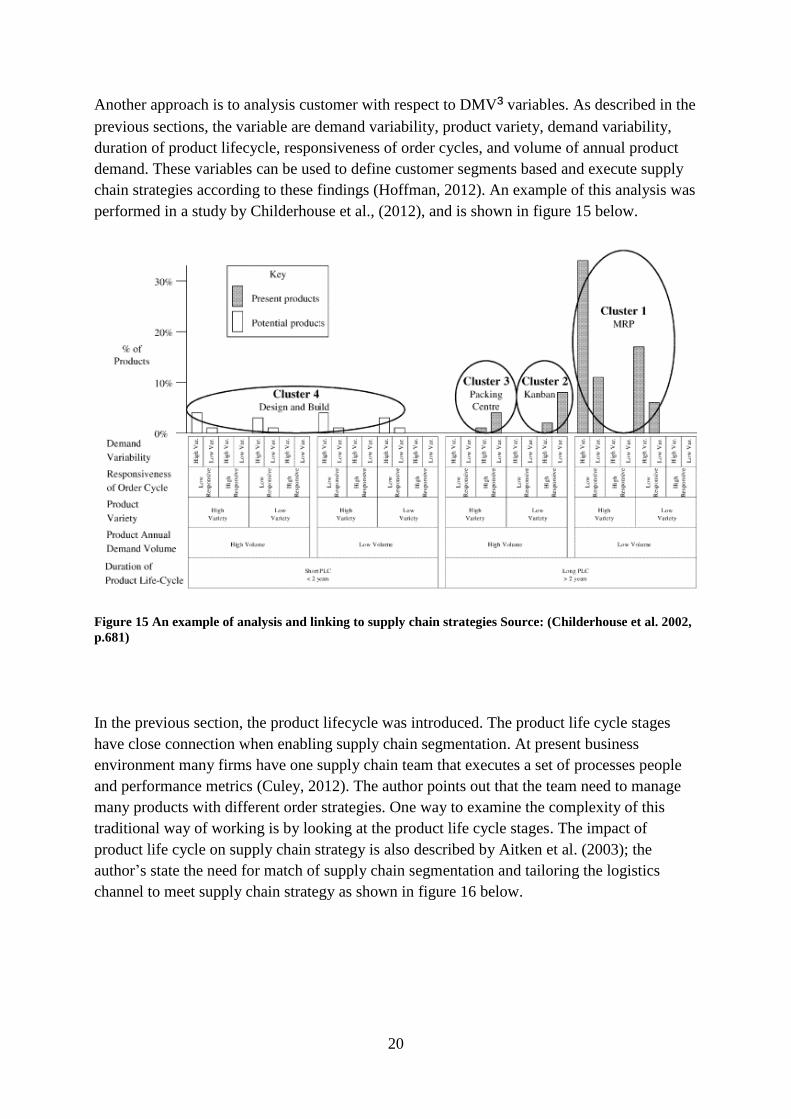
Another approach is to analysis customer with respect to DMV³ variables. As described in the
previous sections, the variable are demand variability, product variety, demand variability,
duration of product lifecycle, responsiveness of order cycles, and volume of annual product
demand. These variables can be used to define customer segments based and execute supply
chain strategies according to these findings (Hoffman, 2012). An example of this analysis was
performed in a study by Childerhouse et al., (2012), and is shown in figure 15 below.
Figure 15 An example of analysis and linking to supply chain strategies Source: (Childerhouse et al. 2002,
p.681)
In the previous section, the product lifecycle was introduced. The product life cycle stages
have close connection when enabling supply chain segmentation. At present business
environment many firms have one supply chain team that executes a set of processes people
and performance metrics (Culey, 2012). The author points out that the team need to manage
many products with different order strategies. One way to examine the complexity of this
traditional way of working is by looking at the product life cycle stages. The impact of
product life cycle on supply chain strategy is also described by Aitken et al. (2003); the
author’s state the need for match of supply chain segmentation and tailoring the logistics
channel to meet supply chain strategy as shown in figure 16 below.

21
Figure 16 Product lifecycle and different strategies Source: (Aitken et al. 2005, p.15)
2.2.4 Linking to Lean, Agile and Leagile Strategy
Linking customer segments to the right supply chain strategy is also in focus when
segmenting the supply chain. Christopher (2001) explains that three critical dimensions can be
used to determine the correct approach. These dimensions are variety, variability and volume.
Hoffman et al., (2012) also discuss these variables and present some descriptive
characteristics for matching to right supply chain strategies. These are shown in figure 17
below.
Figure 17 Characteristic of Supply Chain Strategies Source: (Hofmann 2012, p .67)

22
3. RESEARCH METHODOLOGY
This chapter aims to present and evaluate the research methods. Further, this chapter is
focusing to include a scientific basis and methods to answer the research questions of this
thesis work.
3.1 Research Approach
Researchers have stated that they use either inductive or deductive research approach. The
research approach used can determine the creation of well based arguments and therefore a
logical approach should be chosen. The deductive approach is sometimes referred as a top-
down approach and works from more general reasoning to the more specific (Burney, 2008).
The process for deductive approach starts with theory and the conclusions is based on
available facts. This is explained by Holmqvist et al., (2009, cited in Mustafa 2014, p.26) as:
“The deductive approach explains by theory for general solutions or occurrences how an
empirical problem in one case can be described”. The deductive principle can be seen as an
experiment. The approach starts with forming a hypothesis and then test to it to verify or
falsity the theory (Johansson, 2003). The inductive approach is instead a bottom-up approach
starting from specific observation to a broader generalizations and theories (Burney, 2008).
Induction is the opposite, starting with theory and uses a set of related concepts. This is
suitable to verify a rule is applying in similar cases.
In the research made by Dubois & Gadde (2002); Pierce cited in Fisher (2005) show that in
realty that both approaches are used. This type of research approach is identified as an
abductive approach. Johansson (2003) describes abduction as: “the process of facing an
unexpected fact, applying some rule and, as a result, positing a case that may be” (Johansson,
2003, p.9). The abduction reasoning is making generalization based on from cases to a case.
In table 6 below, the three approaches are summarized and an example of the order of rule,
case and result changes are showed.
Table 6. The rule, case and result for three research approaches Source: (Svennevig, 2003 cited in
Mustafa, 2014 p.26)
Deduction Induction Abduction
Rule All the beans
from this bag
are white
Case These beans
are from this
bag
Rule All the
beans from
this bag are
white
Case These beans
are from this
bag
Result These beans
are white Result These beans
are white
Result These beans
are white Rule All the beans
from this bag
are white
Case These beans
are from
this bag
Holmqvist et al., (2009, cited in Mustafa 2014, p.26) describes the abduction approach as

23
forming process of hypotheses where the approach is opened to new ideas. Dubois & Gadde
(2002) adds the systematic combining process to the abductive approach and is described as:
“Systematic combining is a process where theoretical framework, empirical fieldwork and
case analysis evolve simultaneously, and it is particularly useful for development of new
theories.”
- (Dubois & Gadde, 2002, p.554)
3.2 Research Method
According to Cohen (2011), all researcher methods are either qualitative or quantitative. The
qualitative method collects, analyzes and interpret data by observing what people say and do
(Andersson, 2006). This method does not use statistical procedures and therefore is more
“exploratory and open-ended” (Andersson, 2006). The quantitative method uses structured
methods and explain the collected data by using mathematically based methods (Aliaga and
Gunderson (2005, n.d.). Höst et.al, (2011, p.30), states that: “the study design is stable from
beginning to end” which makes the method less flexible. The differences between the two
methods are shown in the table 7 below.
Table 7. Differences between qualitative method and quantitative method. Source: (Mack et al., 2011 cited
in Mustafa, 2014)
Quantitative Qualitative
General framework Structured methods Semi-structured methods
Analytical objectives Quantify variations Describe variations
Question format Close-ended Open-ended
Data format Numerical Textual
Flexibility in study design Stable from beginning to end Some aspects are flexible
Creswell (2014) present the possibility to combine both qualitative and quantitative research
data in a research study. This method allows the research to collect, analyze and mix both
qualitative and quantitative data (Creswell & Clark, 2011). This form a mixed method design
is referred to as convergent parallel mixed methods and is explained by Creswell (2014,
p.219) described as: “The researcher collects both forms of data at roughly the same time and
then integrates the information in the interpretation of the overall results”.
3.3 Research Design
The definition of a case study is according to Yin (2009) the following:
“An empirical inquiry about a contemporary phenomenon (e.g., a “case”), set within its real-
world context—especially when the boundaries between phenomenon and context are not
clearly evident (Yin, 2009, p. 18)”. According to Denscombe (2007 cited in Mustafa, 2014,
p.35), case studies can be useful if the researcher wants depth and detail. However, the
disadvantages with case studies are may not be the best method of for collecting data and the
24
researcher most make choices from among a number of events to people (Denscombe, 2007).
Also, the trustiness of the investigation can be questioned because the results only have been
collected from one study (Menyah, 2010 cited in Mustafa, 2014, p.35). To carry out a case
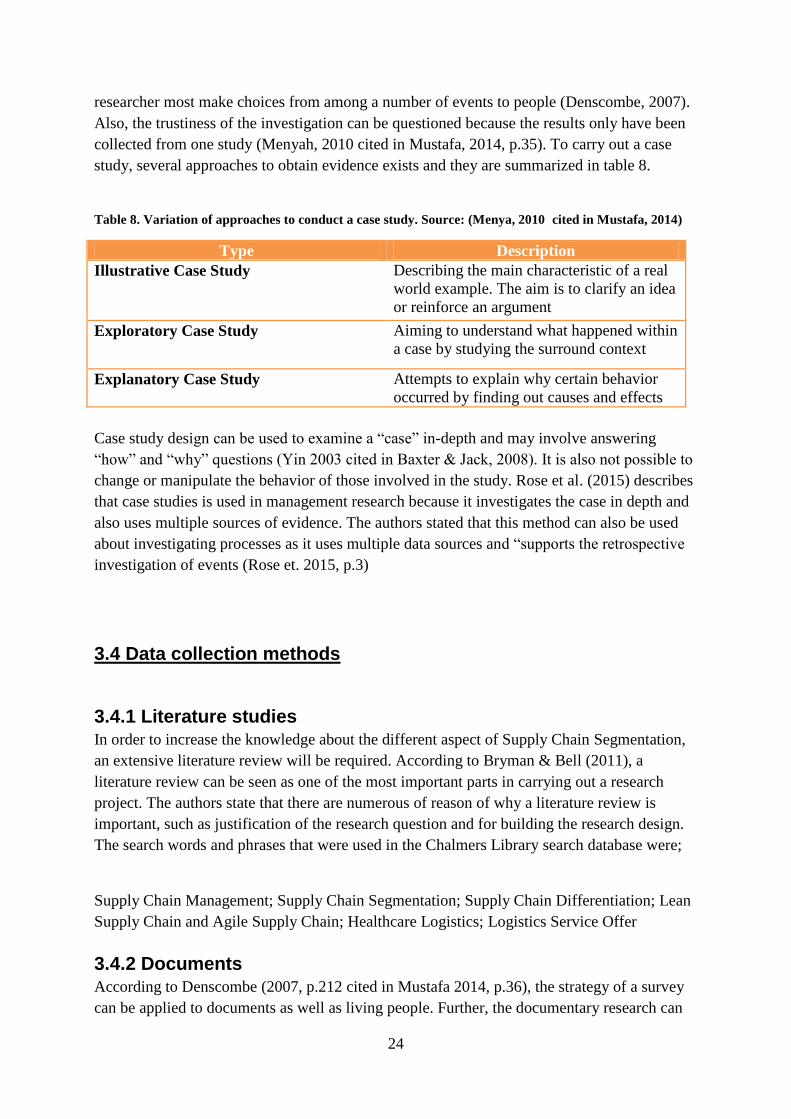
study, several approaches to obtain evidence exists and they are summarized in table 8.
Table 8. Variation of approaches to conduct a case study. Source: (Menya, 2010 cited in Mustafa, 2014)
Type Description
Illustrative Case Study Describing the main characteristic of a real
world example. The aim is to clarify an idea
or reinforce an argument
Exploratory Case Study Aiming to understand what happened within
a case by studying the surround context
Explanatory Case Study Attempts to explain why certain behavior
occurred by finding out causes and effects
Case study design can be used to examine a “case” in-depth and may involve answering
“how” and “why” questions (Yin 2003 cited in Baxter & Jack, 2008). It is also not possible to
change or manipulate the behavior of those involved in the study. Rose et al. (2015) describes
that case studies is used in management research because it investigates the case in depth and
also uses multiple sources of evidence. The authors stated that this method can also be used
about investigating processes as it uses multiple data sources and “supports the retrospective
investigation of events (Rose et. 2015, p.3)
3.4 Data collection methods
3.4.1 Literature studies In order to increase the knowledge about the different aspect of Supply Chain Segmentation,
an extensive literature review will be required. According to Bryman & Bell (2011), a
literature review can be seen as one of the most important parts in carrying out a research
project. The authors state that there are numerous of reason of why a literature review is
important, such as justification of the research question and for building the research design.
The search words and phrases that were used in the Chalmers Library search database were;
Supply Chain Management; Supply Chain Segmentation; Supply Chain Differentiation; Lean
Supply Chain and Agile Supply Chain; Healthcare Logistics; Logistics Service Offer
3.4.2 Documents According to Denscombe (2007, p.212 cited in Mustafa 2014, p.36), the strategy of a survey
can be applied to documents as well as living people. Further, the documentary research can

25
be used when “background information needs to be used as a platform for a research project
or when secondary data need to be collected”. As a result of reviewing documents, the
researcher can easy obtain data from a wide range of documents recorded (Wharton, 2006
cited in Mustafa 2014, p.36). However, the disadvantage of document research is the fact that
the credibility or the source can be questioned (Walker, 1999 cited in Mustafa 2014, p.36)
3.4.3 Interviews In general, interviews are most commonly made face-to-face and the researcher and the
person interviewed can see each other and be near each other (Denscombe, 2007 cited in
Mustafa 2014, p.36). Creswell & Clark (2011), states the advantages of interviews to be:
flexible; give good insight in people’s experience; opinions and attitudes. For this thesis work
the interviews have been unstructured interviews. It is cost efficient than depth interviews but
can lack the means to produce creative explanations. Its flexibility has allowed the author to
make conversations with employees within the organization during the workday. The author
took notes during the conversations and did not record any conversation to make the
interviewee feel comfortable and share valuable insights.
3.2.4 Observations According to Zikmund et al., (2013, par.3 cited in Mustafa, 2014, p.35), observation is
described as: “A systematic process of recording behavioral patterns of people, objectives and
occurrences as they happen”. This indicates the less need of questioning or communicating.
The data is collected through witness and recorded information while watching a certain event
take place (Zikmund et al., 2013 cited in Mustafa, 2014 p.35). Further, there are according to
Zikmund et al., (2013), two types of observations: visible observation and hidden observation.
The main difference is that in the visible observation, presence of the observer in the subject
is known (Zikmund et al., 2013).
3.4.5 Cost-to-Serve (CTS) Methodology Understanding the cost to serve customer is needed to get insight of the drivers for
profitability (Joshi et al., 2014). A CTS analysis provides an insight to the dimension of cost
to serve for a particular product or product category. It also takes several dimensions into
account, such as, procurement, manufacturing, distribution, logistics and sales (Joshi et al.,
2014). The calculations for the cost to serve are derived from activity-based methodology.
The activity-based costing traces cost related to activities and then to producing the product.
The strength of cost to serve is it includes all activities to complete the customer delivery and
considers end-to-end overview of the whole supply chain (Joshi et al., 2014). It can also help
companies to adjust their service level they provide to each customer, identify areas of cost
reduction and generate more profitability. The company had already built most of it database
and the research utilized the data available.
3.4.6 The Kano Model The Kano Model was developed by professor Kano and his coworkers in 1984. The model is
used to better understand how the customer evaluate and perceive quality attributes (Lofgren

26
& Witell, 2005). In the model, there are five categories of perceived quality: attractive, must-
be, reverse, one-dimensional and indifferent. Looking closer of three of these dimensional,
must-be quality are taken for granted when fulfilled but if not fulfilled it leads to
dissatisfaction (Lofgren & Witell, 2005). The one-dimensional quality attributes leads to
satisfaction when fulfilled and often those attributes are which companies compete
(Gustafsson 1998 cited in Lovgren & Witell 2005). The attractive quality attributes will
surprise and delight customers when they are fully achieved but don’t cause dissatisfaction
when they are not fulfilled. Lofgren and Witell (2005) describes that the quality attributes are
dynamic and changes over time, for example attractive quality will become one-dimensional
and finally become must-be. The Kano Model, see figure 18 is created by an in-depth
investigation of customer needs via a Kano questionnaire (Lofgren & Witell, 2005)
Figure 18 The Kano Model (Office Clipart 2010)
3.4.6 Validity and Reliability Creswell (2014) defines the term qualitative validity as “the researcher checks for the
accuracy of the finding by employing certain procedures” (Creswell, 2014, p.201). In contrast
there is the qualitative reliability which is defined as following: “qualitative reliability
indicates that the researcher’s approach is consistent across different researchers and
different projects” (Gibson, 2007 cited in Creswell, 2014). Research validity is about how
accurate the findings are of the researcher or the participants. Creswell (2014) explain the
terms associated with validity are for example trustworthiness or authenticity. In this master
thesis four strategies will be used for increasing validity and reliability (Creswell, 2014).
1. By examining different sources the triangulation of data can be increased
2. For every finding, provide a detailed description and offer many perspective about a
theme
3. In the study, be not afraid to present contradictory evidence in order to give many
perspectives
4. Set up a well-structured way to document the findings, procedures and the steps they
consist of

27
3.5 Reasons and Applications for the Selected Methodology
Case study design can be used to examine a “case” in-depth and may involve answering
“how” and “why” questions (Yin 2003 cited in Baxter & Jack, 2008). It is also not possible to
change or manipulate the behavior of those involved in the study. The author used multiple
sources of data collection methods to strengthen evidence. As shown in the figure collecting
and reflecting about the data was a cyclic process. For example, when the researcher found
interesting information in the contracts, the CTS methodology was used to examine the
information further. Figure 19 shows the design of this research
Figure 19 The research design for the study
Phase 1 was a chance for the researcher to get an introduction to the company’s way of
working. This was done be starting to review documents and get familiar with the company’s
logistics processes. Parallel to this step was an extensive literature research and unstructured
interviews or conversations with the company representatives. Phase 1 continued with the
review of contracts and tenders from the customers. In phase 2, the findings from phase 1
were combined with statistical data and interviews. It was a cyclic procedure where the
researcher needed to go back to reviewing and comparing data from both phases. Phase 2
used the theoretical methodology to identify a possible supply chain strategy for different
customer segments.
3.5.1 Phase 1: The reviewing of contracts
The researcher needed to look for logistics terms in the contract and categorize them
accordingly. In total 15 contracts were examined and the researcher used the SCOR
performance metrics and adapted them for categorizing the contracts. The categories were:
Payment terms, delivery agreements, packaging requirement, conformance, order
responsiveness and penalty agreement. All data were sorted in Microsoft Excel software
and in each category different attributes were identified. Figure 20 shows an example of the
design of the categorization. Due to a confidential agreement, the researcher will not present
the detailed insight of the logistics attributes identified.

28
Figure 20 Categorization by customers, product category and attributes
The researcher used the Kano Model to better visualize the different categories found in the
contracts. The researcher didn’t develop an in-depth Kano Model Analysis by questionnaire,
rather used the model to make an analysis of expected, normal and exciting attributes. This
analysis was made by collecting data from contracts, internal documents and interviews.
3.5.2 Phase 2: Linking to the right supply chain strategy
In phase 2, the researcher used the models described by Mason-Jones et al (2000);
(Christopher, 2000); Beck et al., (2012) and Hoffman et al., (2012). Adapting the attributes
for choosing the right supply chain strategy for the customers, the researcher created a
framework as shown in table 9. As already discussed in the theory section, different strategies
can be used depending one performance metrics, demand variability, and volume order.
Table 9 The framework build to link to the right supply strategy
In phase 2, the researcher used statistical data to identify demand variability, orders and
combined the results from phase 1. In this way, customers could be categorized into either
agile, leagile or lean supply chain strategy.
3.5.3. Method discussion
As stated before, the methods applied in this thesis were designed to be suitable for collecting
a large amount of data during a relatively short time. The researcher used and combined
29
several data collection methods for answering the research questions. Due to the
confidentiality agreement, only a number of written documents were investigated. As always,
reliability and validity can be an issue when conducting a project in a large company because
information is global. For example, some documents were requested by e-mail from different
locations and it was not possible to make face-to-face interviews. Many of the participants
chosen in this study were recommended by the supervisor at the company and it could have
beneficial to interview a larger group of unknown participants. As a final comment, the
researcher would like to add to the discussion of the dependable of quantitative data such as
the financial data for sales and demand. As the business environment is always changing and
many factors can affect today’s business, the researcher thinks it is beneficial to state that the
data collected was focused on this particular study. Perhaps closer analyses of the statistical
data would strengthen the reliability and validity of this study. As this study was based on a
single case study design, more case studies in different locations would strengthen the
transferability of the findings.
30
4. RESULTS & ANALYSIS
The aim of this chapter is to present the findings from Phase 1 and Phase 2. It follows the
same outline presented for the selected methodology. First, the researcher presents the results
from phase 1 and then for phase 2. Due to confidentially agreement, the researcher will not
present detailed insight of the company’s customers, suppliers, sales data or processes.
4.1 Phase 1: The reviewing of contracts
From the initial interviews, it was clear that the logistics process for a medical device
company is complex and involves many actors. From the internal documents, the researcher
got more understanding of the different product categories and customer segments. These
documents focused on the Swedish market and in this market, the customers are public and
private acute care, pharmaceutical wholesalers and medical resellers. From the interview with
the Value Chain Development Director, it was stated: “Customers having different
requirement, and value performance differently”. The Customer Support Director said: “We
need to get a better grasp of our standard offering and understand what extra services we
provide”. This approach is in line with Hofmann (2012) stating that meeting all customer
requirements in one supply chain “one-size fit all approach” may no longer be profitable.
The reviewing of the contracts showed several logistics attributes and the diversity of
different attributes between different customers. In overall, all of the customers required basic
order management and had clearly defined packaging and logistics terms. For example, the
importance of traceability and cleanliness was seen from the customers in the contracts. An
example of the different attributes identified is shown in table 10.
Table 10 Results of the categorization and different factors in the contracts.

31
Culey (2012) describes that it is vital for businesses to understand their customer needs and
how to add value to the customers. The researcher found different attributes and its values
between the different customer segments. In this way, the researcher could get an overview of
what was stated in the contracts. The researcher also reviewed complaint reports from
customers during the year 2015 and used the data to understand the customer feedback for
improvements. The data analysis was in accordance with the principle that in today’s business
environment many companies have outsourced logistics functions to third-party logistics
providers (3PL) and collaboration between the company and 3PL are an integral part of
delivering value to the customer and meeting their needs. (Ahl & Johansson, 2002 cited in
Atkacuna & Furlan, 2009). Therefore many of the complaints can be seen as an opportunity
for improvement between the company and 3PL. The reviews of contracts showed that
different customer has different requirements on the logistics service. All customers have
some basic requirements in order management and packaging, these are essential for product
traceability and product safety. These two dimensions can be seen as important from the
healthcare supply chain that focuses on patient safety (Smith et al. 2011). The contracts also
showed different terms regarding order responsiveness, labeling, and distribution. Beck et al.
(2012) describe the necessity to serve customers according to their requirements and needs.
At the same time, an organization need to adapt the right supply chain strategy according to
market and product attributes (Christopher and Towill, 2002). The contract also showed
penalty agreements, e.g. for late deliveries and damage during transportation. The agreed
penalty agreements emphasize the need to deliver the right product at the right time to the
customers. This adds to the already complicated management of supply chains with the aim to
deliver different products to different customers. This shows the difficulty of a single supply
chain in order to satisfy all customer requirements as they vary across various marketplaces
(Hofmann, 2012)
The key findings from phase 1 are:
1. The identification of different logistics terms in the contracts and its values
2. How the identified values differs between the customers
The researcher wanted to put the identified logistic terms in relation to how customer evaluate
and perceive these attributes. By using the Kano Model and comparing the collected data with
studies focusing on healthcare supply chain a model was created. Table 11 below shows the
three different categories in the model.

32
Table 11. Three different categories of quality attribute
Huiskonen & Pirttilä (1996) describes the expected element as unnoticed by customers but it
is needed to recognize them and their minimum acceptable level of expected services. If a
company under exceeding the level, the customer will be dissatisfied. On the other hand, if
the company has higher service level it will increase cost without adding to customer value.
As the healthcare supply chain is changing and adopting digital technology to improve
traceability and minimize process variation the normal attributes will lead to satisfaction when
fulfilled. These attributes are seen to be those the companies will be competing with and is in
line with the theory of the model presented by (Gustafsson 1998 cited in Lovgren & Witell
2005). Huiskonen & Pirttilä (1996) mention that customer reaction will depend on the level of
service offered. The better the company offer a service the more satisfied will the customer
be.
The exciting attributes will delight the customers and the Kano Model suggests that these will
become must-be attributes in the future (Lofgren 2005). Huiskonen & Pirttilä (1996) describe
that attractive or exciting attributes can overpass the customer expectation but their absence
will not create dissatisfaction. The reason for the latter is because customers are not used to
getting them. Further on, looking at supply chain trends in healthcare these attributes can be
used to differentiate the service offering from competitors (Huiskonen & Pirttilä, 1996)
4.2 Phase 2: Linking to the right Supply Chain Strategy
As Christopher (2001) describes, lean supply chain strategy works best in high volume, low
variety, and predictable environments. While agility focuses on flexibility, lean focuses on
minimizing waste. Combining data and the results identified in phase 1, some customers
valued quality and cost compared with quality and lead time. Agility strategy is a way to meet

33
volatile service demand and provides high availability (Christopher and Towill, 2001). The
researcher completed the framework presented in the method chapter. For one segment the
customer’s required high availability and their demand variability was higher compared with
the other segments. With the identified logistics attributes in the contracts, the researcher now
focused on understanding the financial data for serving these customers. The first step was to
examine the number of orders and the number of deliveries for the Swedish market. The data
available was for the second quarter (Q2) in 2016. The researcher identified different
customer clusters and mapped the difference between customers and compared their sales for
Q2. This is shown in figure 21.
Figure 21 Data analysis between different customers
In figure 21 it can be seen that customer A have more orders and deliveries than customer C..
The researcher then created a case focusing on customers in the following segments: Hospital
distributors, wholesalers, and pharmacy. In total two customers in each segment was
analyzed. An example of analysis between three customers from different segments is shown
in figure 22.
Figure 22 Data analysis between three customers
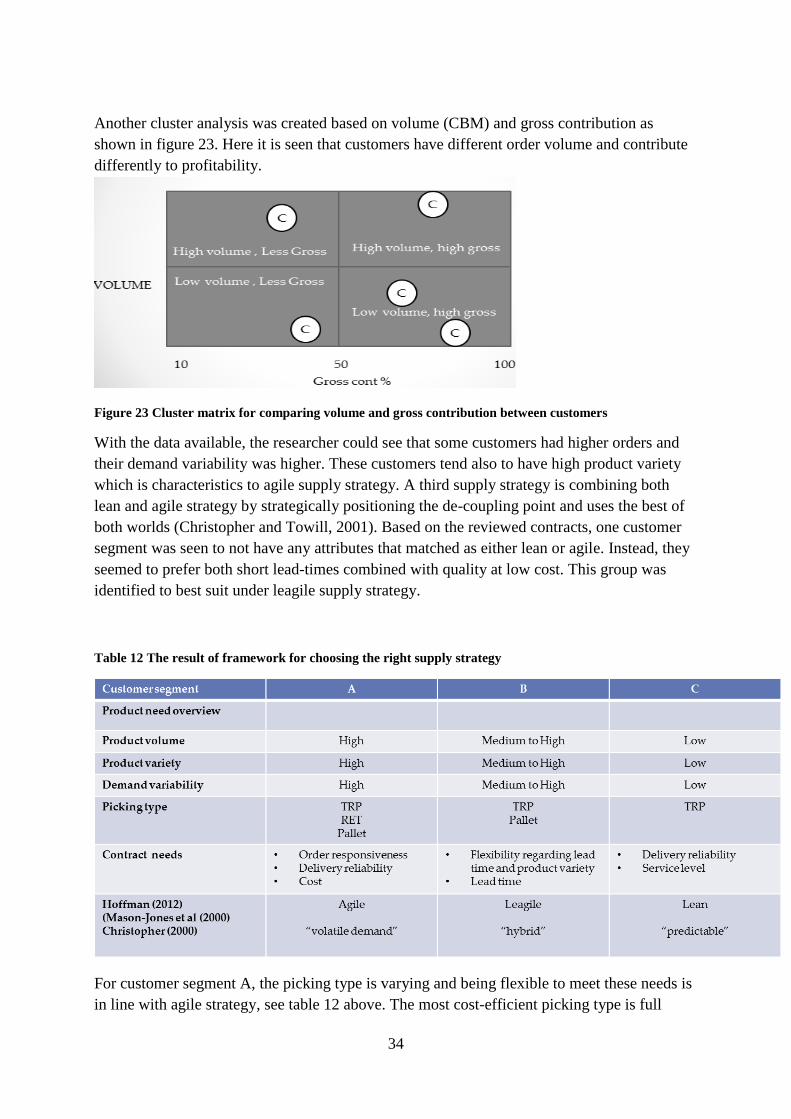
34
Another cluster analysis was created based on volume (CBM) and gross contribution as
shown in figure 23. Here it is seen that customers have different order volume and contribute
differently to profitability.
Figure 23 Cluster matrix for comparing volume and gross contribution between customers
With the data available, the researcher could see that some customers had higher orders and
their demand variability was higher. These customers tend also to have high product variety
which is characteristics to agile supply strategy. A third supply strategy is combining both
lean and agile strategy by strategically positioning the de-coupling point and uses the best of
both worlds (Christopher and Towill, 2001). Based on the reviewed contracts, one customer
segment was seen to not have any attributes that matched as either lean or agile. Instead, they
seemed to prefer both short lead-times combined with quality at low cost. This group was
identified to best suit under leagile supply strategy.
Table 12 The result of framework for choosing the right supply strategy
For customer segment A, the picking type is varying and being flexible to meet these needs is
in line with agile strategy, see table 12 above. The most cost-efficient picking type is full
35
pallet while retail packaging (RET) is the most expensive. These customers use a mix of
packaging types and require delivery reliability and fast order responsiveness. As Naylor et al
(1999) defines, the agility means responding quickly to changes in the information from the
market. For customer segment C, the orders and demand variability were less volatile than
customer segment B. The customer in segment B sees flexibility and the possibility of
ordering different products as an important factor and based on the model from (Hoffman
(2012), their profile fits the Leagile strategy. This strategy strives to drive down cost upstream
while ensuring agile response to respond to an unpredictable marketplace downstream
(Mason-Jones et al. 2000).

36
5. CONCLUSIONS AND RECOMMENDATIONS
This chapter aims to present the conclusion from Phase 1 and Phase 2. Further, the purpose of
this chapter is to give recommendations how the organization should strive forward to
continue to delight their customers and improve their supply chain. Finally, the researcher will
also present ideas for future research.
5.1 Conclusions
Supply Chain Differentiation starts with the customer, understanding the structure, behavior,
and strategies of what the customer sees as value (Culey, 2012). The first research question
was regarding what logistics service elements and its values were stated in various contracts.
The researcher reviewed contracts and internal documents in phase 1. Phase 1 revealed
different logistics terms in the contracts and its values. Also, it was shown how the different
values differed between the different customer segments. The conclusion is that today the
customers require a menu of different logistics needs and requirements. Also, they differ
between the customer segments. This increases complexity and all the customer logistics
needs and requirements cannot be met in one-size fit all supply chain.
The second research question was regarding if there was data to support differentiated supply
strategy. Data collected from phase 2 added to the differences between customers in terms of
the amount of order, demand variability, and product varieties. These findings showed the
need to match the right supply chain strategy for different customers in order satisfy all
customers and be more efficient. Matching the theoretical models presented for different
supply strategy, the customers were classified into the supply strategies. The analysis from
phase 1 and phase 2 showed a possible way on how to use different supply strategies. It is also
a way to improve the supply chain and meet future customer needs. The conclusion is that it
exist a need to match the right supply strategy to different customer segments making sure to
fully satisfy customers and improve the supply chain.
5.2 Recommendations
The recommendations for the company are, therefore:
1. Offer a standard menu of logistics service
o This would align marketing, manufacturing and supply chain on strategic,
tactical and operational level
o Offer customers to choose from additional logistics services as add-ons or
premium agreement
2. Continue to improve the supply chain together with logistics provider, partners,
and customers
o Eliminate waste in the supply chain (E.g. improvement projects for eliminating
picking errors, late deliveries, and packaging damage)
3. Match the right supply strategy to different customer segments

37
o By matching the right supply strategy the company can increase customer
service satisfaction level, eliminate non-value adding steps and assure higher
delivery reliability.
o This step would meet future supply chain trends and add to the mission of
ensuring patient safety and providing outstanding solutions for patients
5.3 Future research
This thesis was made site-specific at the company’s office in Gothenburg and didn’t cover the
reviewing of contracts and data from other locations. It can be interesting for the company to
compare this study with another geographical area to find common patterns. Another
interesting area is for the academic to study in detail the different supply chain strategies in
the medical device industry. Any contribution to give more insight into these strategies is
beneficial for supply chain practitioners. This would benefit both the industry and public
sector and contribute to the mission of better care for patients in terms of increased safety and
reduced costs.

38
6. BIBLIOGRAPHY
Aitken, J., Childerhouse, P., Christopher, M., Towill, D. (2005). “Designing and managing
multiple pipelines”. Journal of Business Logistics, vol. 26, no. 2, pp. 73-95
Aitken, J., Childerhouse, P., Towill, D. (2003). “The impact of product life cycle on supply
chain strategy”. International Journal of Production Economics, vol. 85, pp. 127-140.
Aliaga, Martha & Gunderson, Brenda. (2005). Interactive Statistics . 3rd ed. Great Britain:
Pearson. 1088.
Anderson, John. (2006). Qualitative and Quantitative research. Available:
http://www.icoe.org/webfm_send/1936. Last accessed 27th May 2014.
Arvidsson, L (2007) Vårdlogistik – rätt patient får rätt vård av rätt kvalitet, på rätt nivå, på rätt
plats, vid rätt tidpunkt, till rätt kostnad. Available:
http://webbutik.skl.se/sv/artiklar/vardlogistik-ratt-patient-far-ratt-vard-av-ratt-kvalitet-pa-ratt-
niva-pa-ratt-plats-vid-ratt-tidpunk.html. Last accessed 21th November 2016
Atkacuna, Ilze & Furlan, Karolina (2009). Value-Added Services in Third-Party Logistics.
Available http://hj.diva-portal.org/smash/get/diva2:233689/FULLTEXT01.pdf Last accessed
30th November 2016 M.sc Jönköping Business School
Baxter. P & Jack. S (2008) Available: http://nsuworks.nova.edu/tqr/vol13/iss4/2/. Last
accessed 21th November 2016
Becks, R. (2012). “Supply Chain Segmentation 2.0”. E2open, August 17. Webpage:
http://info.e2open.com/rs/e2open/images/White%2520Paper_SC%2520Segmentation%2520P
art%2520II.pdf?mkt_tok=3RkMMJWWfF9wsRonva/BZKXonjHpfsX56eUtW6C3lMI/0ER3f
OvrPUfGjI4HScF0dvycMRAVFZl5nQkKFfCQcg%3D%3D. Retrieved: 2016-10-15.
Bender, Alexander (2014) Available:
http://www.supplychain247.com/paper/supply_chain_segmentation_strategies_to_manage_co
mplexity/OPS_Rules_Management_Consultants. Last accessed 21th November 2016
Bergman, B. & Klefsjö, B. 2010, Quality from Customer needs to customer satisfaction, 3rd
edition, Studentlitteratur, Lund
Burney. A (2008) Available:
http://www.drburney.net/INDUCTIVE%20&%20DEDUCTIVE%20RESEARCH%20APPR
OACH%2006032008.pdf. Last accessed 21th November 2016
Childerhouse, P., Aitken, J., Towill, D. (2002). “Analysis and design of focused demand
chains”. Journal of Operations Management, vol. 20, pp. 675-689
Christopher, M., Towill, D. (2000). “Marrying lean and agile paradigms”. Proceedings of the
EUROMA 2000 Conference, Ghent, pp. 114-121.

39
Christopher, M., Towill, D. (2001). “An integrated model for the design of agile supply
chains”. International Journal of Physical Distribution and Logistics Management, vol. 31, no
4, pp. 235-246.
Christopher, M., Towill, D. (2002). “Developing Market Specific Supply Chain Strategies”.
International Journal of Logistics Management. vol. 13, no. 1, pp. 1-14.
Cohen, Louis (2011). Research Methods in Education . 7th ed. London: Routledge. 784.
Creswell, John W & Miller, Dana L. (2010). Determining Validity in Qualitative Inquiry.
Getting Good Qualitative Data to Improve Eductional Practice. 39 (3), 124-130.
Creswell, John W (2014). Research design : qualitative, quantitative, and mixed methods
approaches . 4th ed. Los Angeles: Sage Publication Ltd. 273
Culey, Sean (2012). Available: http://www.europeanbusinessreview.com/segmenting-for-
success-from-value-chain-theory-to-everyday-execution/. Retrieved: 2016-09-13.
Dubois, A. & Gadde, L-E., (2002) Systematic combining: an abductive approach to case
research. Journal of Business Research Volume 55 Issue 7
EY (2012). “Supply Chain Segmentation”. Available: http://performance.ey.com/wp-
content/uploads/downloads/2013/02/Supply-chain-segmentation_DC0121.pdf. Retrieved: 2013-09-13.
Godsell, J. (2008). Developing Customer Responsive Supply Chain Strategy: An Empirical
Investigation of the Relationship between Market Segmentation and Supply Chain Strategy.
PhD thesis, Cranfield University, Cranfield.
Godsell, J., Diefenbach, T., Clemmow, C., Towill, D., Christopher, M. (2011). “Enabling
supply chain segmentation through demand profiling” International Journal of Physical
Distribution & Logistics Management, vol. 41, no. 3, pp. 296-314.
Hilletofth, P., JTH. Forskningsmiljö Industriell produktion, Högskolan i Jönköping &
Tekniska Högskolan 2012, "Differentiation focused supply chain design", Industrial
Management & Data Systems, vol. 112, no. 9, pp. 1274 1291
Hoekstra, S., Romme, J. (1992). Integral Logistics Structures: Developing Customer-oriented
Goods Flow, Industrial Press, New York.
Hofmann, E., Beck, P., Füger, E. & SpringerLink (ebook collection) 2012;2013;, The supply
chain differentiation guide: a roadmap to operational excellence, 1. Aufl. edn, Springer, New
York;Heidelberg;.
Holmqvist, Anna., Norkjaer, Michael., Ullmark, Björn (2009). The Art of Turning
Relationships into Competitive Advantages: Managing direct customer relationships in China.
Msc. Kalmar University.
Höst, Martin., Regnell, Björn., Runeson,Per. (2006). Att genomföra examensarbete . 2nd ed.
Lund: Studentliterature. 153
40
Huan, S.H., Sheoran, S.K. & Wang, G. 2004, "A review and analysis of supply chain
operations reference (SCOR) model", Supply Chain Management: An International Journal,
vol. 9, no. 1, pp. 23-29
Huiskonen, J. & Pirttilä, T. 1998, "Sharpening logistics customer service strategy planning by
applying Kano's quality element classification", International Journal of Production
Economics, vol. 56, no. 1, pp. 253-260.
Jeston, J. & Nelis, J. 2006, Business process management: practical guidelines to successful
implementations, 1st edn, Butterworth-Heinemann, Burlington, MA
Joshi.N, Jain. A, Sharma. A, Mahapatra. S (2014) Available:
http://www.tcs.com/resources/white_papers/Pages/Cost-to-Serve-Analysis.aspx. Last
accessed 21th November 2016
Johansson. R (2003) Available: http://psyking.net/htmlobj-3839/case_study_methodology-
_rolf_johansson_ver_2.pdf Last accessed 21th November 2016
Kong and Allan (2007). Explaining push and pull models. Available:
http://kongandallan.com/en/us_pdf/EPPS0711U.pdf. Last accessed 21th November 2016
Kwon, I.G., Kim, S. & Martin, D.G. 2016, "Healthcare supply chain management; strategic
areas for quality and financial improvement", Technological Forecasting and Social Change
Mack, Natasha., Woodsong, Cynthia., Macqueen, Kathleen., Guset, Greg., Namey,Emily
(2005). Qualitative Reserach Methods: A Data Collector's Field Guide. North Carolina:
Family Health International. 120.
Mason-Jones, R., Naylor, B., Towill, D. (2000). “Lean, agile or leagile? Matching your
supply chain to the marketplace”. International Journal of Production Research, vol. 38, no.
17, pp. 4061-4070.
Menyah, Dave. (2010). Overview of Case Study Models and Methodology. Available:
http://www.capam.org/_documents/reportoncasestudymethodologies.pdf. Last accessed 29th
September 2016
Mustafa Danar (2014). Project Risk Management: An initiative towards opportunity
management. Bsc. Chalmers University of Technology.
Näslund, D & Williamson, S. (2006). Segmenting for Success – From Value Chain Theory to
Everyday Execution. Available: http://m.www.na-businesspress.com/JMPP/NaslundWeb.pdf.
Last accessed 21th November 2016
Näslund, D., Williamson, S. (2010). “What is Management in Supply Chain Management? –
A Critical Review of Definitions, Frameworks and Terminology”. Journal of Management
Policy and Practice, vol. 11, no. 4, pp. 11-24.

41
Naylor, B., Naim, M., Berry, D. (1999). “Leagility: Integrating the lean and agile
manufacturing paradigms in the total supply chain”. International Journal of Production
Economics, vol. 62, pp. 107-118.
Project Management Institute (2000). A Guide to the Project Management Body of
Knowledge. 2nd ed. Newton Square, United States of America: Project Management Institute
Inc.. 216.
Rose. S, Nigel.S, Ana Isabel. C (2015) Available: https://www.routledge.com/Management-
Research-Applying-the-Principles/Rose-Spinks-Canhoto/p/book/9780415628129 Last
accessed 21th November 2016
Sean, Culey. (2006). Segmenting for Success – From Value Chain Theory to Everyday
Execution. Available: http://www.europeanbusinessreview.com/segmenting-for-success-
from-value-chain-theory-to-everyday-execution/. Last accessed 21th November 2016
Smith, B.K., Nachtmann, H. & Pohl, E.A. 2011, "Quality Measurement in the Healthcare
Supply Chain", The Quality Management Journal, vol. 18, no. 4, pp. 50
Stock, J., Boyer, S. (2009). “Developing a consensus definition of supply chain management:
a qualitative study”. International Journal of Physical Distribution and Logistics
Management, vol. 39, no. 8, pp. 690-711.
Supply Chain Council (2008). SCOR Overview, version 8.0.
Svennevig, Jan. (2003). Abduction as a methodological approach to the study of spoken
interaction. Available:
http://home.bi.no/a0210593/Abduction%20as%20a%20methodological%20.pdf. Last
accessed 28th
September 2016.
Zhang, H. & Zhao, G. 2008, "Strategic Selection of Push-Pull Supply Chain", Modern
Applied Science, vol. 2, no. 1.

6(6)
1
7. APPENDIX