supply chain handling systems for premium potatoes · the visual appearance of potatoes overtime in...
TRANSCRIPT
Supply chain handling systems for premium
potatoes
Adrian Dahlenburg SA Research &
Development Institute
Project Number: PT02015
PT02015 This report is published by Horticulture Australia Ltd to pass on information concerning horticultural research and development undertaken for the potato industry. The research contained in this report was funded by Horticulture Australia Ltd with the financial support of the potato unprocessed and value-added industries. All expressions of opinion are not to be regarded as expressing the opinion of Horticulture Australia Ltd or any authority of the Australian Government. The Company and the Australian Government accept no responsibility for any of the opinions or the accuracy of the information contained in this report and readers should rely upon their own enquiries in making decisions concerning their own interests. ISBN 0 7341 1171 1 Published and distributed by: Horticulture Australia Ltd Level 1 50 Carrington Street Sydney NSW 2000 Telephone: (02) 8295 2300 Fax: (02) 8295 2399 E-Mail: [email protected] © Copyright 2005

FINAL REPORT
Horticulture Australia Project PT02015
Supply Chain Handling Systems for Premium Potatoes
A. Dahlenburg, et al.
(July 2005)
South Australian Research and Development Institute
HAL Project PT02015 Mr Adrian Dahlenburg South Australian Research and Development Plant Research Centre GPO Box 397 ADELAIDE SA 5001 Mr Michael Rettke South Australian Research and Development Plant Research Centre GPO Box 397 ADELAIDE SA 5001 Dr Nancy Leo South Australian Research and Development Plant Research Centre GPO Box 397 ADELAIDE SA 5001 Purpose of Report This report is the result of 2 years research into supply chain handling systems for white washed premium potatoes. Studies were undertaken throughout domestic supply chains as well as at the Plant Research Centre to assess current handling systems and evaluate alternative packaging, storage and handling systems. We wish to thank HAL and the Potato industry for funding and in-kind donations received for this research. July 2005 Disclaimer Any recommendations contained in this publication do not necessarily represent current HAL policy. No person should act on the basis of the contents of this publication, whether as to matters of fact or opinion or other content, without first obtaining specific, independent professional advice in respect of the matters set out in this publication.
CONTENTS MEDIA SUMMARY.....................................................................................................1
TECHNICAL SUMMARY ...........................................................................................2
INTRODUCTION TO PROJECT .................................................................................4
TECHNICAL REPORT.................................................................................................6
1 Packer Survey ........................................................................................................6
1.1 Introduction....................................................................................................6
1.2 Procedure .......................................................................................................6
1.3 Results............................................................................................................6
1.4 Summary......................................................................................................18
2 Monitoring the White Washed Premium Potato Supply Chain ...........................19
2.1 Introduction..................................................................................................19
2.2 Procedure .....................................................................................................19
2.3 Results..........................................................................................................19
2.3.1 Temperature Monitored Trial 1: June 2004 (winter) ..................................19
2.3.2 Temperature Monitored Trial 2: January 2005 (summer) ..........................22
2.4 Summary......................................................................................................25
3 Fresh White Washed Premium Potato Storage....................................................27
3.1 Introduction..................................................................................................27
3.2 Procedure .....................................................................................................27
3.2.1 External Quality Assessments.....................................................................28
3.2.2 Internal Quality Assessments......................................................................29
3.2.3 Statistical Analysis......................................................................................29
3.3 Results .........................................................................................................30
3.4 Discussion ....................................................................................................33
4 Fresh White Washed Premium Potato Packaging ...............................................35
4.1 Introduction..................................................................................................35
4.2 Procedure .....................................................................................................35
4.2.1 Potato Preparation.......................................................................................35
4.2.2 Experimental Light Set-up..........................................................................35
4.2.3 Assessments ................................................................................................36
4.2.4 Coloured Packaging Experiment ................................................................36
4.2.5 Plastic Packaging Experiment.....................................................................37
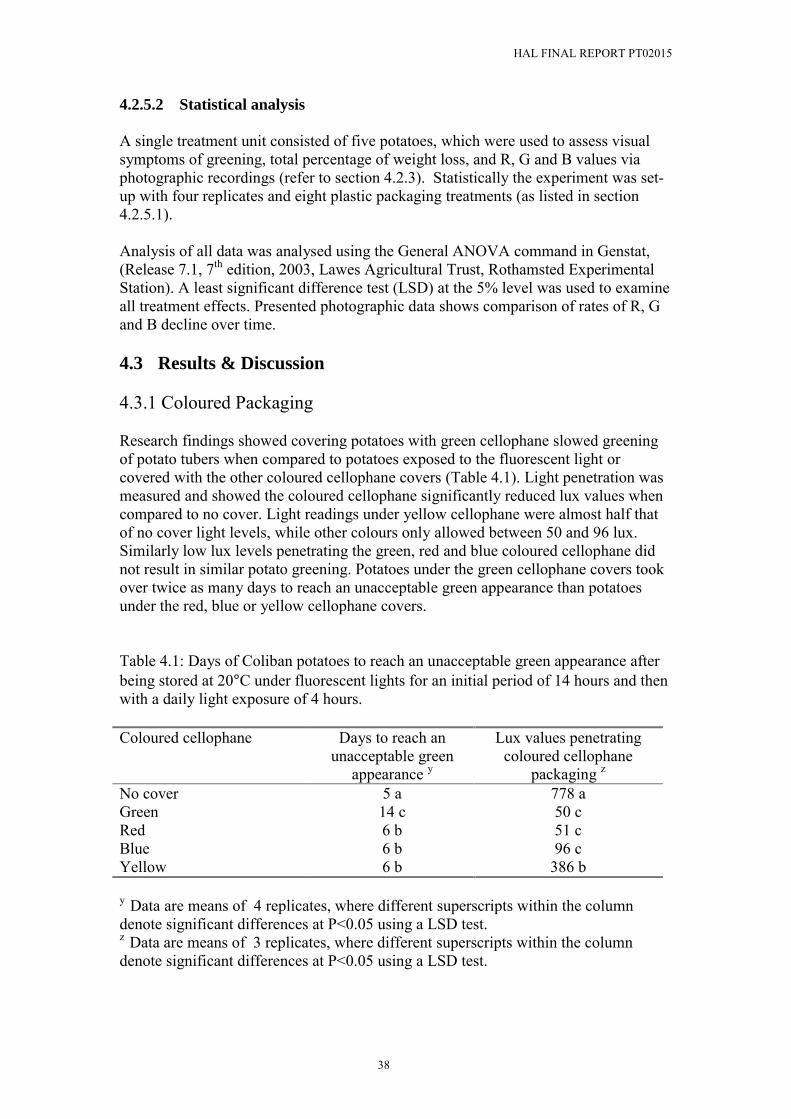
4.3 Results & Discussion ...................................................................................38
4.3.1 Coloured Packaging ....................................................................................38
4.3.2 Plastic Packaging ........................................................................................41
4.4 Summary......................................................................................................44
5 Trial of New Ventilation Packaging for Potatoes ................................................45
5.1 Introduction..................................................................................................45
5.2 Procedure .....................................................................................................45
5.2.1 Quality Assessments ...................................................................................46
5.2.2 Statistical Analysis......................................................................................47
5.3 Results & Discussion ...................................................................................48
APPENDIX 1...............................................................................................................50
APPENDIX 2...............................................................................................................52
APPENDIX 3...............................................................................................................53
APPENDIX 4...............................................................................................................54
RECOMMENDATIONS.............................................................................................55
TECHNOLOGY TRANSFER.....................................................................................58
ACKNOWLEDGEMENTS.........................................................................................59
REFERENCES ............................................................................................................60
HAL FINAL REPORT PT02015
1
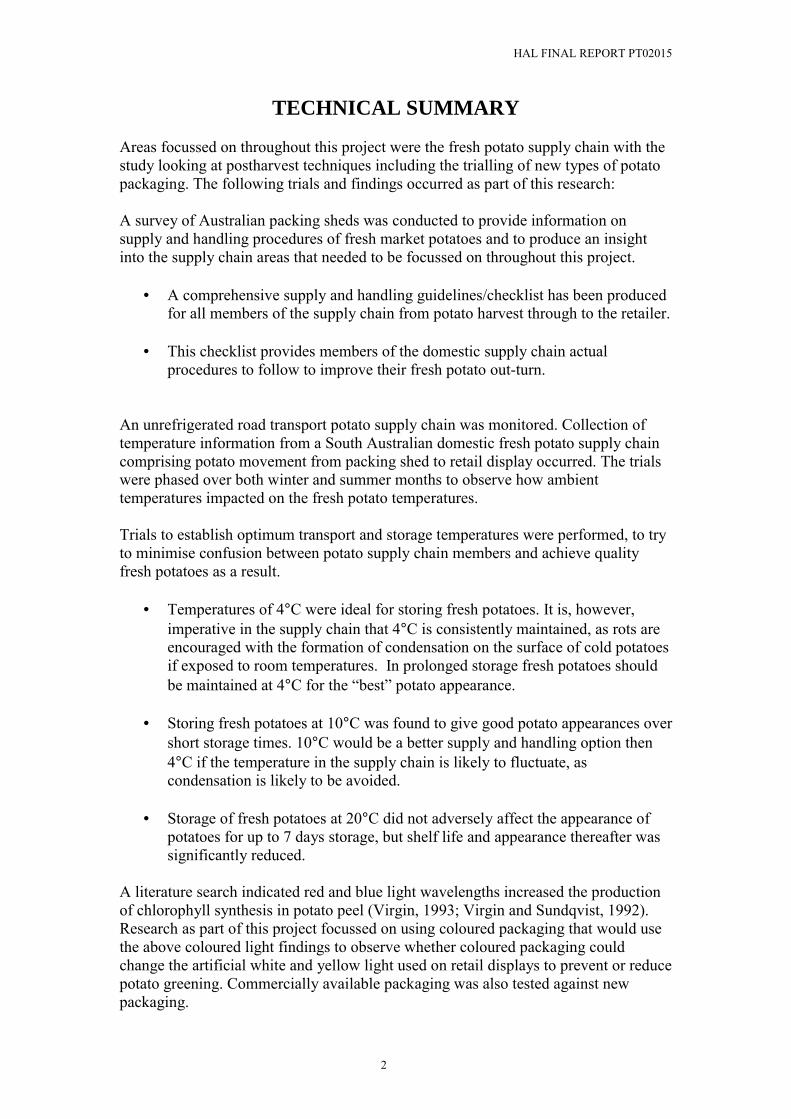
MEDIA SUMMARY Fresh potato purchases from retail outlets are often met with high consumer expectation. However, the quality of fresh potatoes does not always meet consumer demands. The lack of confidence in the quality of fresh potatoes has led to reduced purchasing, a devastating result for the Australian Potato Industry, especially with the multicultural change in Australian eating habits already increasing the appeal of other carbohydrate and non-carbohydrate substitutes. Premium grade fresh, white, washed potatoes have a high degree of consumer appeal because of their �fresh white� appearance. This �fresh white� appearance is difficult to maintain throughout the supply and handling chain. Handling temperatures of potatoes during harvest, packaging and throughout distribution vary, which impacts on the ability of potatoes to retain their fresh appearance. This project detailed the differences in supply and handling procedures currently in practice around Australia, then reported on improvements to supply and handling techniques of fresh, washed potatoes to the Australian Potato Industry. Ideal transport and storage temperatures resulting in the �freshest looking potatoes in storage� were researched with temperatures of 4°C giving the best appearance after 21 days storage. However, sweat formation on potatoes handled at 4°C when placed in ambient temperatures for short periods of time (as little as 10 minutes) was significant. Moisture in packaging is reported to be a major factor in the incidence of soft rot and general potato breakdown. Therefore, the emphasis on a consistent supply and storage temperature for potatoes is essential. If a consistent supply and handling temperature of 4°C can not be maintained throughout the potato supply chain from packing shed to consumer, then potatoes should be handled at temperatures closer to 10°C to reduce the occurrence of condensation and thus the likelihood of rots. Studies into various types of potato packaging to observe their effectiveness at reducing fresh potato greening and peel discolouration were conducted. The most effective packagings that slowed potato greening were those that blocked most of the light from going through the packaging. However, it was found that when low levels of light did penetrate packaging, green coloured packaging slowed potato greening more so then red, blue or yellow coloured packaging. Peel discolouration in relation to the various types of ventilated potato packaging used in storage was measured. Packaging with little or no ventilation did show a higher incidence of rots compared to the lower incidence of rots found on potatoes in ventilated packaging. However, it was found that current commercial plastic packaging does accumulate moisture even with ventilation holes on the front and back of it�s packaging. A recommendation for current plastic packaging would be to have additional ventilation holes on the bottom of the packaging; this may minimise rot development if supply chain temperature inconsistencies cause sweat formation.
HAL FINAL REPORT PT02015
2
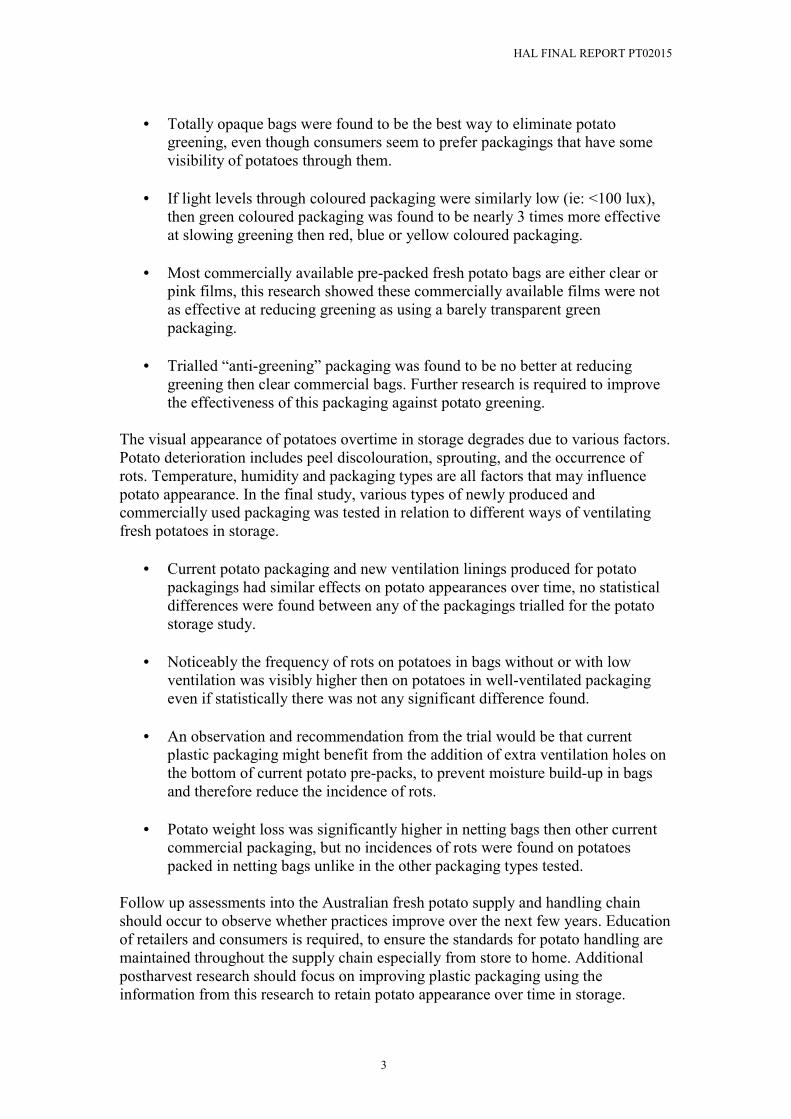
TECHNICAL SUMMARY Areas focussed on throughout this project were the fresh potato supply chain with the study looking at postharvest techniques including the trialling of new types of potato packaging. The following trials and findings occurred as part of this research: A survey of Australian packing sheds was conducted to provide information on supply and handling procedures of fresh market potatoes and to produce an insight into the supply chain areas that needed to be focussed on throughout this project.
• A comprehensive supply and handling guidelines/checklist has been produced for all members of the supply chain from potato harvest through to the retailer.
• This checklist provides members of the domestic supply chain actual
procedures to follow to improve their fresh potato out-turn. An unrefrigerated road transport potato supply chain was monitored. Collection of temperature information from a South Australian domestic fresh potato supply chain comprising potato movement from packing shed to retail display occurred. The trials were phased over both winter and summer months to observe how ambient temperatures impacted on the fresh potato temperatures. Trials to establish optimum transport and storage temperatures were performed, to try to minimise confusion between potato supply chain members and achieve quality fresh potatoes as a result.
• Temperatures of 4°C were ideal for storing fresh potatoes. It is, however, imperative in the supply chain that 4°C is consistently maintained, as rots are encouraged with the formation of condensation on the surface of cold potatoes if exposed to room temperatures. In prolonged storage fresh potatoes should be maintained at 4°C for the �best� potato appearance.
• Storing fresh potatoes at 10°C was found to give good potato appearances over
short storage times. 10°C would be a better supply and handling option then 4°C if the temperature in the supply chain is likely to fluctuate, as condensation is likely to be avoided.
• Storage of fresh potatoes at 20°C did not adversely affect the appearance of
potatoes for up to 7 days storage, but shelf life and appearance thereafter was significantly reduced.
A literature search indicated red and blue light wavelengths increased the production of chlorophyll synthesis in potato peel (Virgin, 1993; Virgin and Sundqvist, 1992). Research as part of this project focussed on using coloured packaging that would use the above coloured light findings to observe whether coloured packaging could change the artificial white and yellow light used on retail displays to prevent or reduce potato greening. Commercially available packaging was also tested against new packaging.
HAL FINAL REPORT PT02015
3
• Totally opaque bags were found to be the best way to eliminate potato
greening, even though consumers seem to prefer packagings that have some visibility of potatoes through them.
• If light levels through coloured packaging were similarly low (ie: <100 lux),
then green coloured packaging was found to be nearly 3 times more effective at slowing greening then red, blue or yellow coloured packaging.
• Most commercially available pre-packed fresh potato bags are either clear or
pink films, this research showed these commercially available films were not as effective at reducing greening as using a barely transparent green packaging.
• Trialled �anti-greening� packaging was found to be no better at reducing
greening then clear commercial bags. Further research is required to improve the effectiveness of this packaging against potato greening.
The visual appearance of potatoes overtime in storage degrades due to various factors. Potato deterioration includes peel discolouration, sprouting, and the occurrence of rots. Temperature, humidity and packaging types are all factors that may influence potato appearance. In the final study, various types of newly produced and commercially used packaging was tested in relation to different ways of ventilating fresh potatoes in storage.
• Current potato packaging and new ventilation linings produced for potato
packagings had similar effects on potato appearances over time, no statistical differences were found between any of the packagings trialled for the potato storage study.
• Noticeably the frequency of rots on potatoes in bags without or with low
ventilation was visibly higher then on potatoes in well-ventilated packaging even if statistically there was not any significant difference found.
• An observation and recommendation from the trial would be that current
plastic packaging might benefit from the addition of extra ventilation holes on the bottom of current potato pre-packs, to prevent moisture build-up in bags and therefore reduce the incidence of rots.
• Potato weight loss was significantly higher in netting bags then other current
commercial packaging, but no incidences of rots were found on potatoes packed in netting bags unlike in the other packaging types tested.
Follow up assessments into the Australian fresh potato supply and handling chain should occur to observe whether practices improve over the next few years. Education of retailers and consumers is required, to ensure the standards for potato handling are maintained throughout the supply chain especially from store to home. Additional postharvest research should focus on improving plastic packaging using the information from this research to retain potato appearance over time in storage.
HAL FINAL REPORT PT02015
4
INTRODUCTION TO PROJECT The influence of other cuisines on family meals has decreased potato consumption in the Australian diet (Sully, 2001). Potato quality has also been found to influence consumer buying (Henderson, 2001), with inconsistency of fresh potato quality in the market place identified as the main problem leading to consumer rejections. Greening, rots and peel discolouration are major factors in potato rejections. This report will look into the supply and handling procedures that are likely to affect them. The aim of this Supply Chain Handling Systems for Premium Potatoes project was to firstly understand the range of supply and handling channels in Australia. The next objective was to identify possible areas that may be compromising potato quality and then find possible solutions or better handling practices that would improve the overall postharvest handling system. Storage and transport temperatures vary considerably for fresh market potatoes. Temperatures not only vary between supply chain members, but also between supply chain areas such as between packing sheds, freight services and retailers. A thorough understanding into what temperatures are currently used for transporting and storing fresh market potatoes in Australia is required. Temperatures suggested for fresh potatoes vary. Adequate holding temperatures recommended in literature vary between 4°C to ambient (Shetty et al., 1998; Jobling, 2000a; Jobling, 2000b; Guenthner, Unknown). The confusion regarding suitability of various temperatures between members of the fresh potato supply chain is understandable due to the variation in literature stating different ideal storage and handling temperatures. Uncertainty from the abundance of temperature information could be influencing the appearance and the shelf life of fresh potatoes in the marketplace and thereafter. Potatoes subjected to distinctly different temperatures during supply may suffer undue stress causing changes to the �fresh� potato appearance. As well as storage temperatures, potato packaging types will also be examined for their suitability in transporting, storing and displaying fresh, white, washed potatoes. Busy lifestyles have impacted on the way consumers purchase their produce; pre-packs of fresh washed potatoes are now commonplace in produce display areas. However, some consumers believe pre-packed potatoes are of a lesser quality than loose potatoes and so reviewing the various types of potato packaging available in the marketplace and comparing them against each other would be informative to industry members as well as to the public. Potato packaging as well as offering convenience should aim to protect the product (ie: from greening) and not cause any detrimental effects (ie: rots from moisture). This would include looking at finding the �best� packaging to prevent or slow potato greening as well as identifying the �best� packaging for the long-term storage of potatoes. Recent research findings have shown that potato greening is accentuated under various coloured lights (Virgin and Sundqvist, 1992; Virgin, 1993; Pavlista, unknown). Currently retail stores use fluorescent white or incandescent yellow light over their potato displays. The colours of packaging commercially available and used for potatoes have not been influenced by the coloured light findings above. Further

HAL FINAL REPORT PT02015
5
studies into the effect of coloured light on potato greening is required to test whether coloured packaging could effect the colour of light that is emitted to potatoes and therefore slow or speed up potato greening. Packaging must not only protect potato from greening, but also encourage an overall good potato appearance. Potato appearance was measured by observing them after an extended period of time including observing potato rot development, sprouting and peel discolouration. In summary this report provides:
• Temperature data from a complete domestic fresh potato supply chain for both summer and winter seasons.
• Comparisons in potato appearance after storage at 4°C, 10°C and 20°C. • Results of coloured packaging and their effect on potato greening. • Testing of current packaging against new coated plastic packaging to slow and
prevent potato greening. • Findings for different types of ventilated packaging and their effect on potato
appearance after storage. • A checklist of what each member of the potato supply chain should be aware
of when storing and handling fresh potatoes.

HAL FINAL REPORT PT02015
6
TECHNICAL REPORT 1 Packer Survey 1.1 Introduction As part of HAL project PT02041, research into the quality, storage and handling of fresh potatoes in retail stores was established. To follow on from this collection of retail information; this project looked at an investigation into the storage and handling procedures of fresh potatoes in Australian packing sheds. Surveys were distributed to 31 potato packing sheds in Australia and 30 responded to this survey. The objectives of these surveys were to identify postharvest handling procedures in the packing sheds and to determine which supply chain-handling issues were of importance. 1.2 Procedure Each of the Australian packing sheds polled were formally contacted seeking their co-operation with the survey (Table 1.1). The survey consisted of 18 questions (Appendix 1) and was either completed over the phone or returned via post during April and May 2003. Table 1.1: The number of potato packing sheds that responded to the survey from the
various states of Australia. Types of potatoes Number of Packing Sheds (out of 30) South Australia 10 Victoria 3 New South Wales 4 Queensland 6 Western Australia 5 Tasmania 2 1.3 Results The following tables, figures and summaries combine results from the responses received.

HAL FINAL REPORT PT02015
7
Q1. What is the approximate split up of the annual throughput (%) of your packing shed in the following categories? Table 1.2: This breakdown shows the number of packing sheds surveyed that work
with the various types of potato packing lines z. Types of potatoes Number of Packing Sheds Dirty 5 Brushed 21 Washed 27 Semi-Mature (Brushed) 2 Semi-Mature (Washed) 4 z The results are taken from the 30 packing sheds that responded to the survey Table 1.2 suggests most respondents pack both brushed and washed potatoes with only a few packing any of the other 3 potato lines. Figure 1.1 gives an approximate state breakdown in potato lines packed for the fresh potato market out of the 30 packing sheds that replied.
0
10
20
30
40
50
60
70
80
90
100
SA (10) Vic (3) NSW (4) QLD (6) WA (5) TAS (2)
Packing sheds surveyed in each state
Perc
enta
ge (%
) ave
rage
ann
ual p
otat
o th
roug
hput
Dirty
Brushed
Washed
Semi-Matured(Brushed)Semi-Matured(Washed)
(2, 3, 10, 1, 2)
(1, 3, 3, 0, 0)
(0, 4, 3, 0, 0)
(1, 6, 4, 0, 0)
(0, 3, 5, 0, 1)
(1, 2, 2, 1, 1)
Figure 1.1: Breakdown of the approximate annual throughput of packing sheds in
each Australian state surveyed. The numbers in brackets next to the state on the x-axis shows the number of packing sheds surveyed in that state. Numbers in brackets on the graph correlate to the corresponding potato line representing the number of packing sheds that responded that were involved in the potato packing line.
The proportion of packing sheds surveyed working with washed potatoes as opposed to brushed was considerably larger, with 17 packing sheds packing over 60% of their

HAL FINAL REPORT PT02015
8
production line as washed compared to nine sheds packing over 60% of their production line as brushed. Responding potato-packing sheds in South Australian and Western Australian mainly pack washed potatoes, while those that responded from New South Wales and Queensland mainly pack brushed potatoes. Tasmanian and Victorian respondents seemed to pack an even amount of both washed and brushed potatoes, while only five out of the 30 respondents packed dirty potatoes (Figure 1.1).
Q2. What are the most common packaging materials used in these same categories?
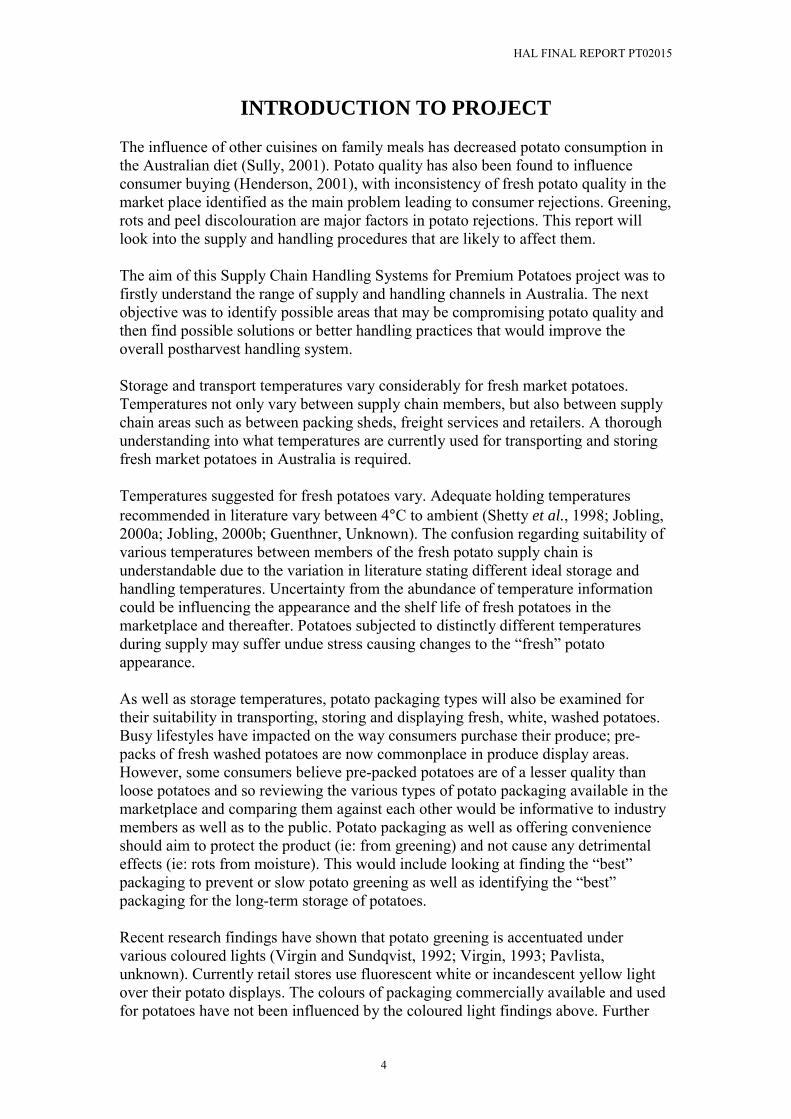
Packing sheds supplying dirty potatoes used either bulk bins or bags, while those that supplied semi-mature brushed potatoes used 10 and 20 kg paper sacks or 15kg cartons. The main packaging for washed potatoes was 1 to 10kg plastic pre-packs with 15kg cartons and 10 and 20kg poly bags also popular (Figure 1.2), while for brushed potatoes 1 to 10kg plastic pre-pack bags, 10 or 20kg poly bags, 10 or 20kg paper sacks and 20kg hessian bags were all types of packaging commonly used (Figure 1.3).
1 to 10kg Plastic Pre-pack35%
10 & 20kg Poly Bags22%
10 & 20kg Paper Sacks10%
20kg Hessian Bags5%
15kg Cartons25%
Net Bags3%
Figure 1.2: Common packaging materials for washed potatoes.
HAL FINAL REPORT PT02015
9
1 to 10kg Plastic Pre-pack
27%
10 & 20kg Poly Bags23%
10 & 20kg Paper Sacks20%
20kg Hessian Bags20%
15kg Cartons10%
Figure 1.3: Common packaging materials for brushed potatoes. Q3. Do you cool the potatoes at any time during the time from receipt at the
packingshed and dispatch to the market? If so, please describe: Out of the thirty respondents to this question, twenty-three of the packing sheds surveyed cooled the potatoes at some stage in the packing shed, however, three of these sheds do so only in certain circumstances like very hot or humid weather (Figure 1.4). Of the seven that do not cool potatoes, three were located in Western Australia, two in Queensland and two in New South Wales. Most cooling is via refrigerated room cooling, but forced air and hydro cooling methods are also used in some operations. Potatoes are generally cooled prior to packing (Figure 1.5), however, cooling temperatures varied between 2°C and 17°C with most operations aiming for ≤10°C. Some of the packing shed operations cooled in more then one area between packing shed arrival and departure.

HAL FINAL REPORT PT02015
10
Do not co o l t he po t at o es at t he
p acking shed2 3 %
Only coo l in cert ain circumst ances
10 %
Co ol t he p ot at o es at t he p acking shed
6 7%
Figure 1.4: Highlights the times potatoes are cooled between packing shed arrival and dispatch.
0
2
4
6
8
10
12
14
16
18
20
Cooled before washing Cooled during washing Cooled after washing Cooled after packing
Times when fresh potatoes are cooled
Num
ber o
f pac
king
she
ds
Figure 1.5: Highlights the number of packing sheds (out of the 20 that said they cooled potatoes) that cool at the different times between potato packing shed arrival and dispatch.

HAL FINAL REPORT PT02015
11
Q4. Do you have a third party audited QA system or accreditation for the packingshed? Almost all packing sheds surveyed have a third party audited quality assurance or accreditation system, only one operation did not have one and another one did not answer the question. HACCP, a comprehensive internationally accepted quality assurance system and SQF2000 a HACCP based quality management programme were the most common systems specified.
Q5. Do you have any routine quality control and evaluation checks that are applied to the potatoes arriving at the packing shed?
Most packing sheds have some form of quality control and evaluation of potatoes on arrival at the packing shed. Visual inspection of the tubers was the most common evaluation and is often combined with other methods, such as sampling, spray diaries, core temperatures and chemical residues. . Q6. What are the main market destinations and the mode of transport used to get the potatoes to that destination? The main market destinations for both washed and brushed potatoes are wholesalers and supermarket distribution centres, while other destinations include retailers, agents and other packers (Figure 1.6).
0
2
4
6
8
10
12
14
16
18
20
22
24
26
28
30
Wholesalers Packers DistributionCentre/Supermarket
Retailer Agent
Fresh Market Potato Destinations
Num
ber o
f sur
veye
d pa
ckin
g sh
eds
Dirty
Brushed
Washed
Figure 1.6: Main market destinations for fresh market potatoes
HAL FINAL REPORT PT02015
12
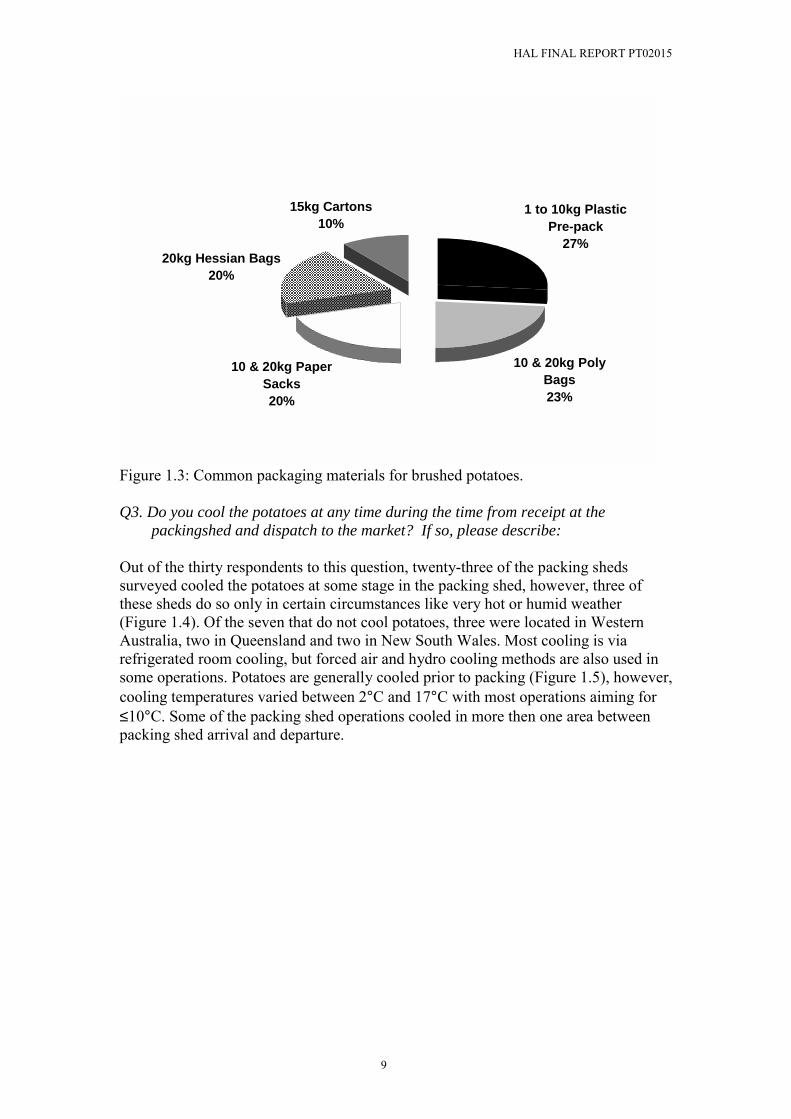
Most brushed potatoes are transported in unrefrigerated trucks, but some are delivered in refrigerated transport with temperatures between 10°C and 18°C. Washed potatoes are more likely to be transported in refrigerated trucks, generally at temperatures of ≤10°C, although some unrefrigerated transport is used (Figure 1.7).
02468
1012141618202224262830
Ambient 4 to 10 deg C >10 to 18 deg C
Transported temperatures
Num
ber o
f sur
veye
d pa
ckin
g sh
eds Dirty
Brushed
Washed
Figure 1.7: Packing shed survey responses to the temperatures that fresh market
potatoes are transported in.
Q7. Are any of the potatoes you pack handled under controlled temperature conditions between dispatch from the packingshed and receipt at the retail outlet? After fresh market potatoes leave the packing shed almost two thirds of packing shed survey respondents believe the potatoes are then handled or stored in temperature controlled conditions. Eight packing shed operations stated that no controlled temperature conditions were used and four were unsure.

HAL FINAL REPORT PT02015
13
Q8. From whom do you get feedback on the quality of your potatoes in the marketplace? Most feedback regarding the quality of fresh market potatoes is received from the packing shed�s immediate customers, like the wholesalers, supermarket distribution centres and other retailers (Figure 1.8).
Wholesalers21%
Distribution Centre/Supermarket
20%
Retailer13%
Buyers12%
Own in-store checks12%
Public/Consumers12%
Agents8%
Prepackers2%
Figure 1.8: Who gives feedback about the quality of fresh market potatoes to packing sheds.
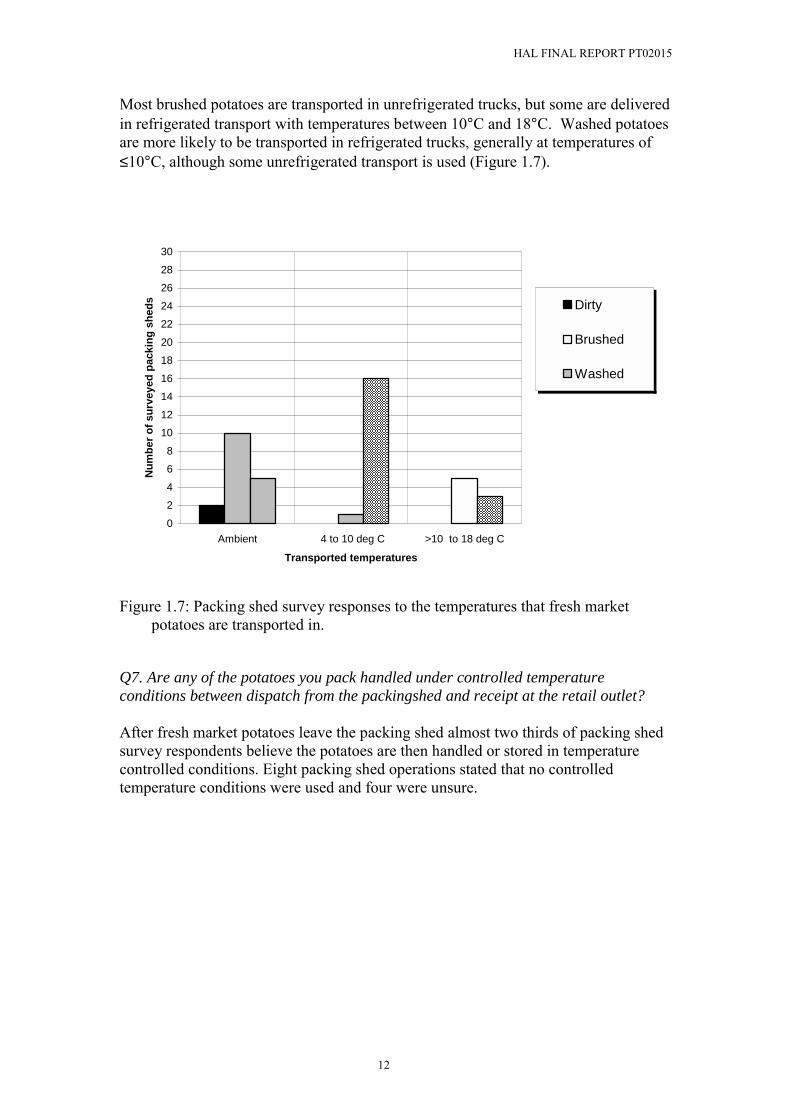
Q9. What are the most regular complaints reported to you by your clients about the quality of fresh market potatoes provided by your company and from other suppliers? Common complaints reported to the responding packing sheds included potato breakdown, incorrect potato sizes and general damage (Figure 1.9).
HAL FINAL REPORT PT02015
14
Breakdown19%
Size19%
Damage12%
Bruising8%
Colour/Bloom Loss8%
Soft Rot6%
Enlarged Lenticels6%
General Poor Quality6%
Staining6%
Condensation6%
Greening/Sprouting or Skinning
4%
Figure 1.9: Common complaints about the quality of fresh market potatoes reported to
packing sheds.
Q10. Have you experienced wastage or rejection problems in the past? If so, what was the problem and how did you resolve it? Approximately half of the packing sheds surveyed responded that they had experienced wastage or rejection problems in the past, with the most common causes being breakdown, damage, rots and not meeting specifications. Problems were resolved by either replacing the order, reducing the price or by cancelling the order and refunding payments.
Q11. From past experience can you link any high incidence of wastage, rejections or quality complaints with any pre or post harvest production or handling factors? Waste and rejection problems were linked to both pre-harvest and postharvest factors. Pre-harvest factors included, poor irrigation, weather, too much moisture, drought, soil quality and nutrition, while the harvest factor cited was damage from the mechanical harvesters. Postharvest factors included rough handling during packing and transport, lack of or breakdown of cold chain, inability to meet market specifications and the use of plastic packaging.
HAL FINAL REPORT PT02015
15
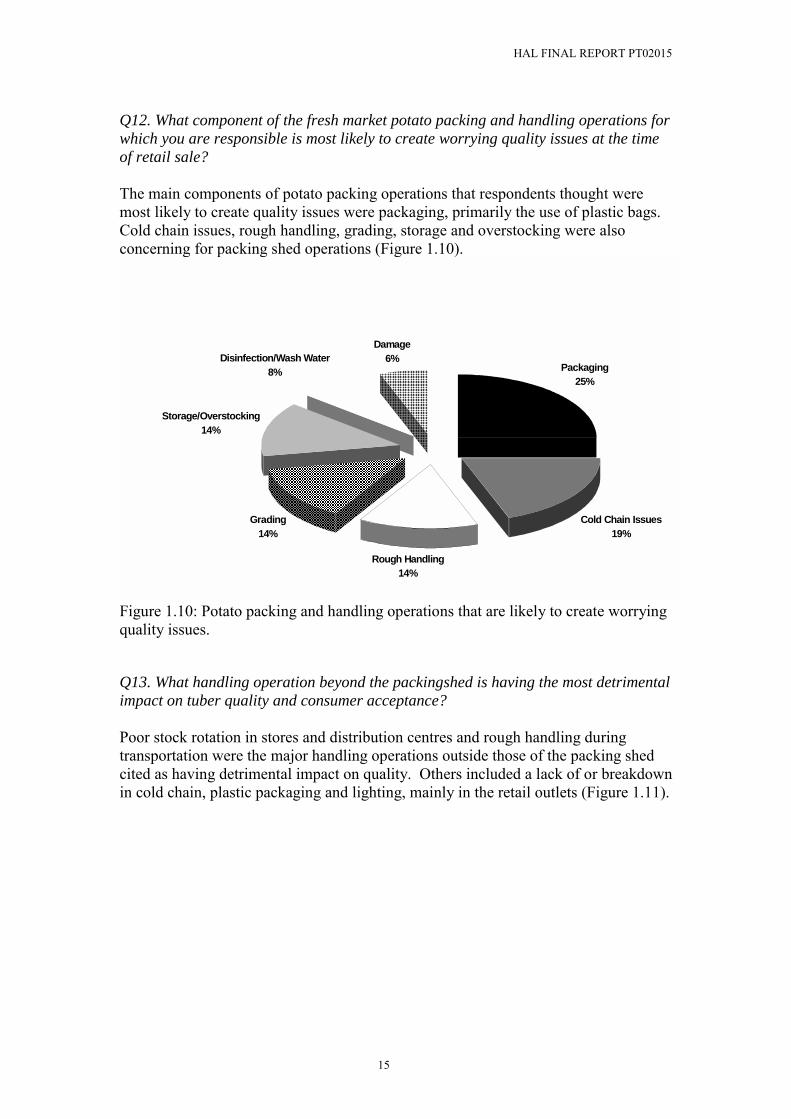
Q12. What component of the fresh market potato packing and handling operations for which you are responsible is most likely to create worrying quality issues at the time of retail sale? The main components of potato packing operations that respondents thought were most likely to create quality issues were packaging, primarily the use of plastic bags. Cold chain issues, rough handling, grading, storage and overstocking were also concerning for packing shed operations (Figure 1.10).
Packaging 25%
Cold Chain Issues19%
Rough Handling14%
Grading14%
Storage/Overstocking14%
Disinfection/Wash Water8%
Damage6%
Figure 1.10: Potato packing and handling operations that are likely to create worrying quality issues.
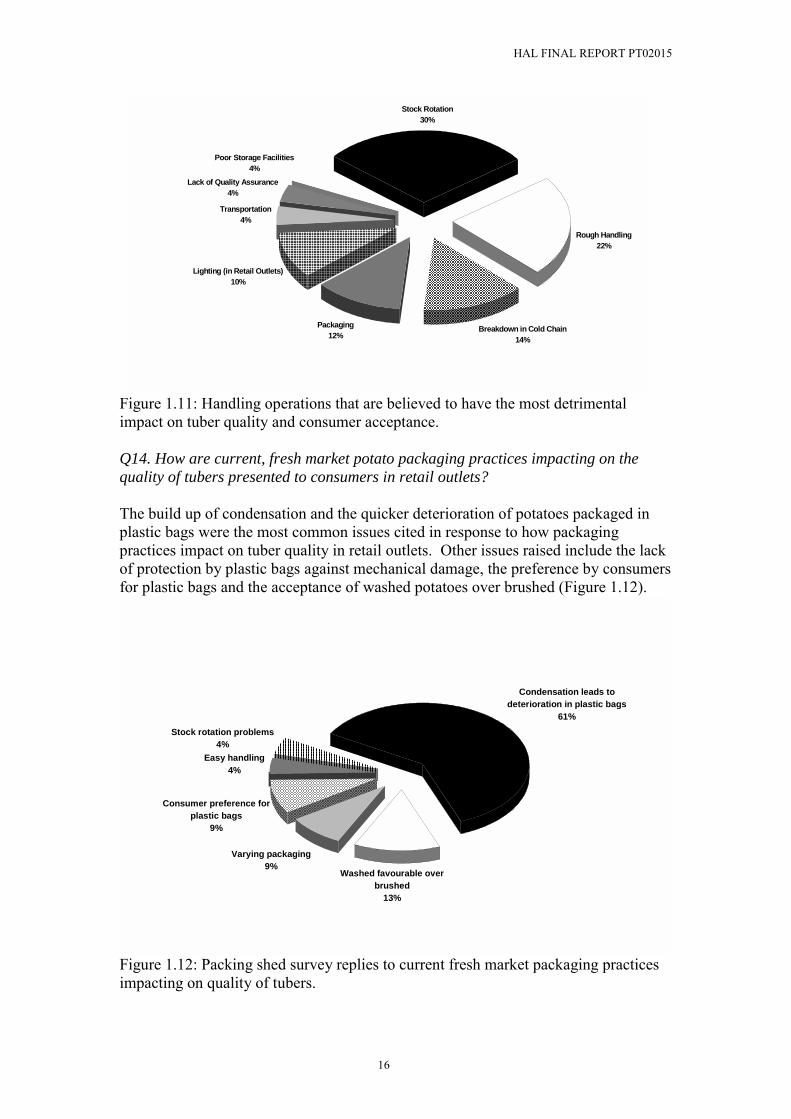
Q13. What handling operation beyond the packingshed is having the most detrimental impact on tuber quality and consumer acceptance? Poor stock rotation in stores and distribution centres and rough handling during transportation were the major handling operations outside those of the packing shed cited as having detrimental impact on quality. Others included a lack of or breakdown in cold chain, plastic packaging and lighting, mainly in the retail outlets (Figure 1.11).
HAL FINAL REPORT PT02015
16
Stock Rotation30%
Rough Handling22%
Breakdown in Cold Chain14%
Packaging12%
Lighting (in Retail Outlets)10%
Transportation4%
Lack of Quality Assurance4%
Poor Storage Facilities4%
Figure 1.11: Handling operations that are believed to have the most detrimental impact on tuber quality and consumer acceptance. Q14. How are current, fresh market potato packaging practices impacting on the quality of tubers presented to consumers in retail outlets? The build up of condensation and the quicker deterioration of potatoes packaged in plastic bags were the most common issues cited in response to how packaging practices impact on tuber quality in retail outlets. Other issues raised include the lack of protection by plastic bags against mechanical damage, the preference by consumers for plastic bags and the acceptance of washed potatoes over brushed (Figure 1.12).
Condensation leads to deterioration in plastic bags
61%
Washed favourable over brushed
13%
Varying packaging9%
Consumer preference for plastic bags
9%
Easy handling4%
Stock rotation problems4%
Figure 1.12: Packing shed survey replies to current fresh market packaging practices impacting on quality of tubers.
HAL FINAL REPORT PT02015
17
Q15. What is the most difficult post harvest (packing shed recieval to market sale) handling issue to cope or deal with? Survey respondents believed the most difficult posthandling issue that packing shed operators had to deal with was meeting market specifications, followed by poor quality potatoes and disease problems. Other issues cited were, difficulties balancing supply and demand, maintaining the cold chain and problems with labour and transport availability.
Q16. What is needed to more consistently deliver better quality fresh market potatoes to consumers? Almost half the packing shed that replied to this question responded that better starting quality was needed to consistently deliver better quality fresh market potatoes to consumers. Consumer education, better handling, cold chain instruction and quality assurance at all levels of the supply chain were also common responses along with better varieties, packaging, stock rotation and grading. Two respondents suggested that potatoes should not be washed.
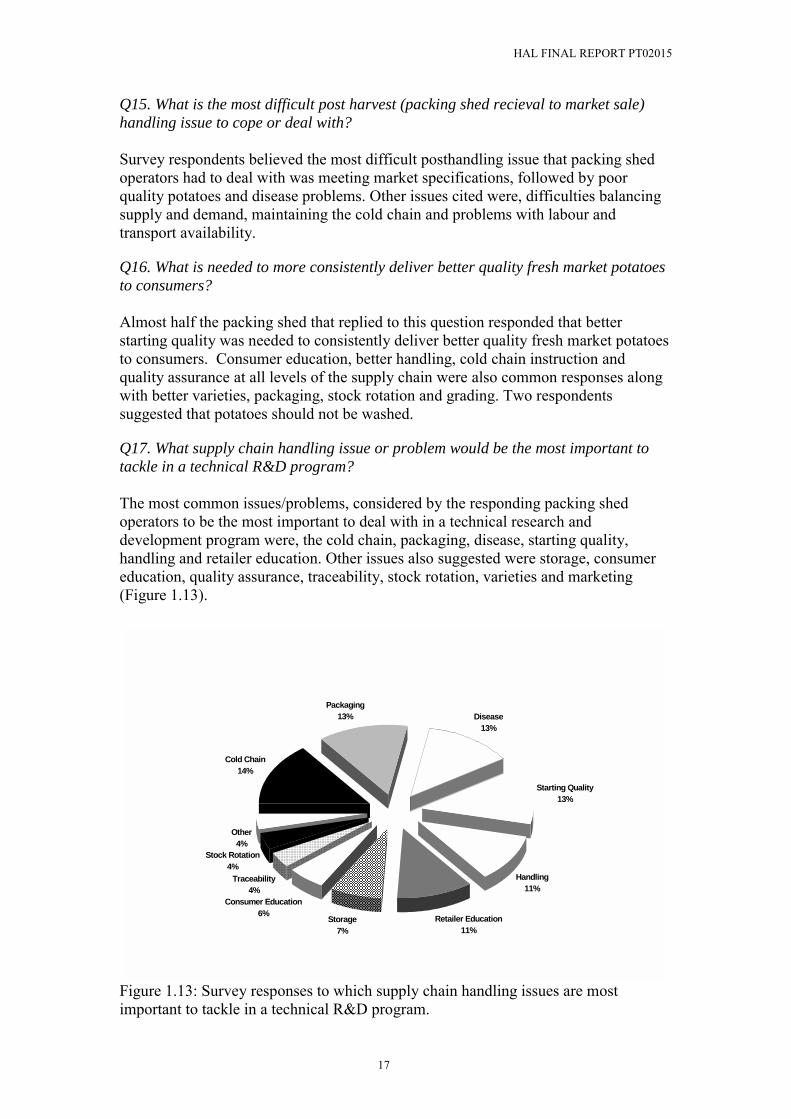
Q17. What supply chain handling issue or problem would be the most important to tackle in a technical R&D program? The most common issues/problems, considered by the responding packing shed operators to be the most important to deal with in a technical research and development program were, the cold chain, packaging, disease, starting quality, handling and retailer education. Other issues also suggested were storage, consumer education, quality assurance, traceability, stock rotation, varieties and marketing (Figure 1.13).
Cold Chain14%
Packaging13% Disease
13%
Starting Quality13%
Handling11%
Retailer Education11%
Storage7%
Consumer Education6%
Traceability4%
Stock Rotation4%
Other4%
Figure 1.13: Survey responses to which supply chain handling issues are most important to tackle in a technical R&D program.
HAL FINAL REPORT PT02015
18
Q18. Horticulture Australia has requested that as part of this survey we assess the economic impacts of poor quality fresh market potatoes on the industry. How much impact do you believe the quality of fresh market potatoes is having on your returns and consequently the industry? Two respondents estimated that the quality of fresh market potatoes was impacting between A$100,000 and A$150,000 on their annual returns and that this could mean an impact of A$2,000,000 or more on the industry. Of the other packing operations that replied, most estimated an impact on their own returns within the range of 10 to 20%. 1.4 Summary Overall, the questionnaire gave a good incite into current potato supply chain procedures and highlighted major and minor problem areas or areas of concern. The survey helped to indicate, which areas within the potato packing shed operations required further evaluations and allowed SARDI to focus in this project on specific postharvest areas like, monitoring of supply chains, potato storage temperatures, and the use of various types of packaging to improve potato appearance by reducing potato greening and discolouration in general.

HAL FINAL REPORT PT02015
19
2 Monitoring the White Washed Premium Potato Supply
Chain 2.1 Introduction Supplying quality fresh white washed potatoes to the consumer is the basis for this study. The supply of fresh market potatoes to retail outlets currently occurs using both refrigerated and unrefrigerated transport. Current refrigeration units on trucks for the chilled transportation of fresh market potatoes are set at 4°C (South Australian Packing Shed Operator, pers. comm., 2005). However, not all suppliers use refrigerated trucks to supply fresh market potatoes. The supply of unrefrigerated washed potatoes to retail outlets is not well documented in Australia. Therefore, to improve the supply of fresh white washed potatoes in Australia, an understanding of the temperatures that fresh market potatoes are subjected to when being transported in unrefrigerated trucks should be known. The objective of this study was to monitor fresh white washed potatoes transported in unrefrigerated trucks from the packing shed to the domestic retail outlet. 2.2 Procedure A well-known South Australian Supermarket chain, and a large South Australian Packing Shed Operation located in the northern Adelaide plains region, was approached to take part in this two part monitoring trial. The aim was to understand the time and temperatures that existed during a �typical� domestic transport trip on pre-packed fresh market washed potatoes from the packing shed through to retail display. Isopar and Tiny-Talk temperature data loggers measuring atmospheric and core potato temperatures, respectively, were placed in premium white washed 2.5kg plastic bags. Two trials were performed, the first in June 2004 (winter), while the second trial occurred in January 2005 (summer). In each trial, temperatures of white washed premium potatoes (2.5kg) road transported in an unrefrigerated truck from the northern Adelaide plains region in South Australia to the Adelaide Pooraka market and then to either one of three metropolitan supermarkets in South Australia were monitored. Each trial was performed over three consecutive days. At least three bags of potatoes were monitored on each of the three consecutive days. Monitored potato bags were always placed on top of the pallet. All temperatures were averaged for the results. Potatoes were picked up the morning of their arrival at the supermarket and transported at air temperature to the SARDI Plant Research Centre. Visual appearances were observed at both the packing shed and upon arrival at the SARDI Plant Research Centre for any distinct changes to potato appearance. 2.3 Results 2.3.1 Temperature Monitored Trial 1: June 2004 (winter) Average daily maximum temperatures for Adelaide in June 2004, according to the Bureau of Meteorology website was approximately 16°C while daily minimum

HAL FINAL REPORT PT02015
20
temperatures were approximately 8°C (online access date 21/3/05 at 14:30: www.bom.gov.au/climate/averages/tables/cw_023090.shtml). These average daily maximum and minimum temperatures aided the supply of potatoes to supermarkets in June with monitored temperatures remaining below 16°C for all monitored June 2004 trial shipments as shown in the following results. Trial 1: Day 1 Core temperatures monitored averaged between 12.8°C and 13.2°C (Figure 2.1). Atmospheric temperatures within the 2.5kg bags were similar to recorded core temperatures with averages of 13°C and 14°C throughout the domestic supply chain.
0
5
10
15
20
25
30
07/0
6/20
04 1
2:00
07/0
6/20
04 1
4:00
07/0
6/20
04 1
6:00
07/0
6/20
04 1
8:00
07/0
6/20
04 2
0:00
07/0
6/20
04 2
2:00
08/0
6/20
04 0
:00
08/0
6/20
04 2
:00
08/0
6/20
04 4
:00
08/0
6/20
04 6
:00
08/0
6/20
04 8
:00
08/0
6/20
04 1
0:00
08/0
6/20
04 1
2:00
08/0
6/20
04 1
4:00
Date and time
Tem
pera
ture
(deg
rees
Cel
sius
)
Log #1
Log #2
Log #3
Figure 2.1: Day 1 core temperatures recorded in 3 separate pre-packed potato bags
Loggers started and placed with potatoes
Loggers removed from potatoes.

HAL FINAL REPORT PT02015
21
Trial 1: Day 2 - The second trial run commenced the following day with core average temperatures in three separate bags of potatoes ranging between 14.7°C and 15°C (Figure 2.2). Atmospheric temperatures within plastic bags were similar to recorded core temperatures averaging 14.5°C, 14.7°C and 14.8°C in the three bags monitored.
0
5
10
15
20
25
30
35
08/0
6/20
04 1
2:00
08/0
6/20
04 1
4:00
08/0
6/20
04 1
6:00
08/0
6/20
04 1
8:00
08/0
6/20
04 2
0:00
08/0
6/20
04 2
2:00
09/0
6/20
04 0
:00
09/0
6/20
04 2
:00
09/0
6/20
04 4
:00
09/0
6/20
04 6
:00
09/0
6/20
04 8
:00
09/0
6/20
04 1
0:00
09/0
6/20
04 1
2:00
09/0
6/20
04 1
4:00
Date and time
Tem
pera
ture
(deg
rees
Cel
sius
)
Log #1
Log #3
Figure 2.2: Day 2 core temperatures recorded in 3 separate pre-packed potato bags.
Loggers started and placed with potatoes
Loggers removed from potatoes.

HAL FINAL REPORT PT02015
22
Trial 1: Day 3 The final monitored domestic shipment for the first trial recorded core temperature averages of between 12.5°C and 13°C (Figure 2.3). Similarly, atmospheric temperatures were also recorded and averaged 12°C, 12.9°C and 13°C. No significant visual differences were found between any of the potatoes supplied from the packing shed to the retail stores in this trial over the three monitored days.
0
5
10
15
20
25
30
09/0
6/20
04 1
2:00
09/0
6/20
04 1
4:00
09/0
6/20
04 1
6:00
09/0
6/20
04 1
8:00
09/0
6/20
04 2
0:00
09/0
6/20
04 2
2:00
10/0
6/20
04 0
:00
10/0
6/20
04 2
:00
10/0
6/20
04 4
:00
10/0
6/20
04 6
:00
10/0
6/20
04 8
:00
10/0
6/20
04 1
0:00
10/0
6/20
04 1
2:00
10/0
6/20
04 1
4:00
Date and time
Tem
pera
ture
(deg
rees
Cel
sius
)
Log#1Log#2Log#3
Figure 2.3: Day 3 core temperatures recorded in 3 separate pre-packed potato bags. 2.3.2 Temperature Monitored Trial 2: January 2005 (summer) Daily maximum and minimum temperatures on monitored days in the January trial were as tabulated in Table 2.1. Table 2.1: Reported daily maximum and minimum temperatures for the January 2005 monitored trial. Day of Trial 2 Date of
departure Overnight Minimum
Temperature (°C)
Date of arrival Maximum Day
Temperature (°C)
Day 1 18th Jan 2005 18 19th Jan. 2005 31 Day 2 19th Jan 2005 16 20th Jan. 2005 33 Day 3 20th Jan 2005 11 21 Jan. 2005 24
Loggers started and placed with potatoes
Loggers removed from potatoes.

HAL FINAL REPORT PT02015
23
Trial 2: Day 1 Recorded core temperatures averaged between 16.6°C and 17.4°C (Figure 2.4). Atmospheric temperatures recorded were similar to core temperatures averaging 16.9°C, 17.3°C and 17.1°C for each data logger placed within potato bags. Figure 2.4 shows a rise in temperature as soon as potatoes are road transported to the Pooraka markets and temperatures continue to increase even after their arrival at the markets.
0
5
10
15
20
25
30
35
18/0
1/20
05 1
2:00
18/0
1/20
05 1
4:00
18/0
1/20
05 1
6:00
18/0
1/20
05 1
8:00
18/0
1/20
05 2
0:00
18/0
1/20
05 2
2:00
19/0
1/20
05 0
:00
19/0
1/20
05 2
:00
19/0
1/20
05 4
:00
19/0
1/20
05 6
:00
19/0
1/20
05 8
:00
19/0
1/20
05 1
0:00
19/0
1/20
05 1
2:00
Date and time
Tem
pera
ture
(deg
rees
Cel
sius
)
Log 1
Log 2
Log 3
Logger placed in potatoes and
started.
Potatoes arrive at Supermarket
Potatoes picked up and loggers removed
Potatoes stored in cold storage until road transported to the Pooraka markets
Road transport to the Pooraka markets
Figure 2.4: Day 1 core temperatures recorded in 3 separate pre-packed potato bags
HAL FINAL REPORT PT02015
24
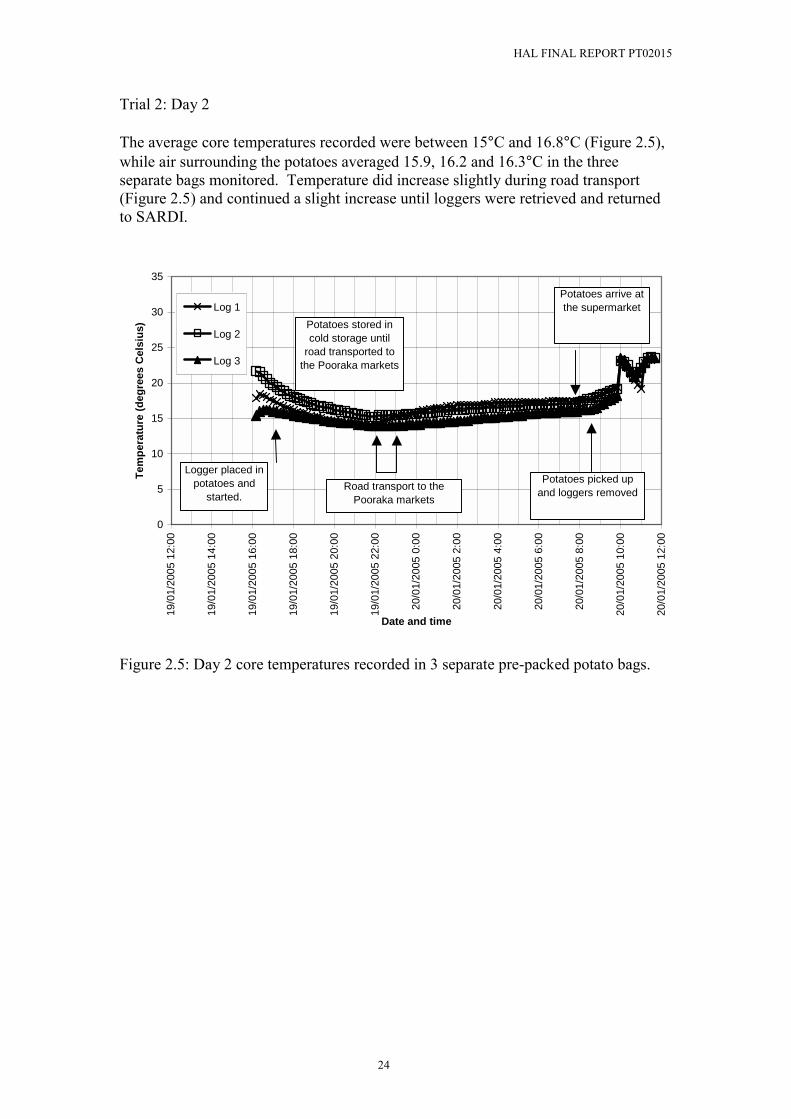
Trial 2: Day 2 The average core temperatures recorded were between 15°C and 16.8°C (Figure 2.5), while air surrounding the potatoes averaged 15.9, 16.2 and 16.3°C in the three separate bags monitored. Temperature did increase slightly during road transport (Figure 2.5) and continued a slight increase until loggers were retrieved and returned to SARDI.
0
5
10
15
20
25
30
35
19/0
1/20
05 1
2:00
19/0
1/20
05 1
4:00
19/0
1/20
05 1
6:00
19/0
1/20
05 1
8:00
19/0
1/20
05 2
0:00
19/0
1/20
05 2
2:00
20/0
1/20
05 0
:00
20/0
1/20
05 2
:00
20/0
1/20
05 4
:00
20/0
1/20
05 6
:00
20/0
1/20
05 8
:00
20/0
1/20
05 1
0:00
20/0
1/20
05 1
2:00
Date and time
Tem
pera
ture
(deg
rees
Cel
sius
)
Log 1
Log 2
Log 3
Logger placed in potatoes and
started.
Potatoes arrive at the supermarket
Potatoes picked up and loggers removed
Potatoes stored in cold storage until
road transported to the Pooraka markets
Road transport to the Pooraka markets
Figure 2.5: Day 2 core temperatures recorded in 3 separate pre-packed potato bags.
HAL FINAL REPORT PT02015
25
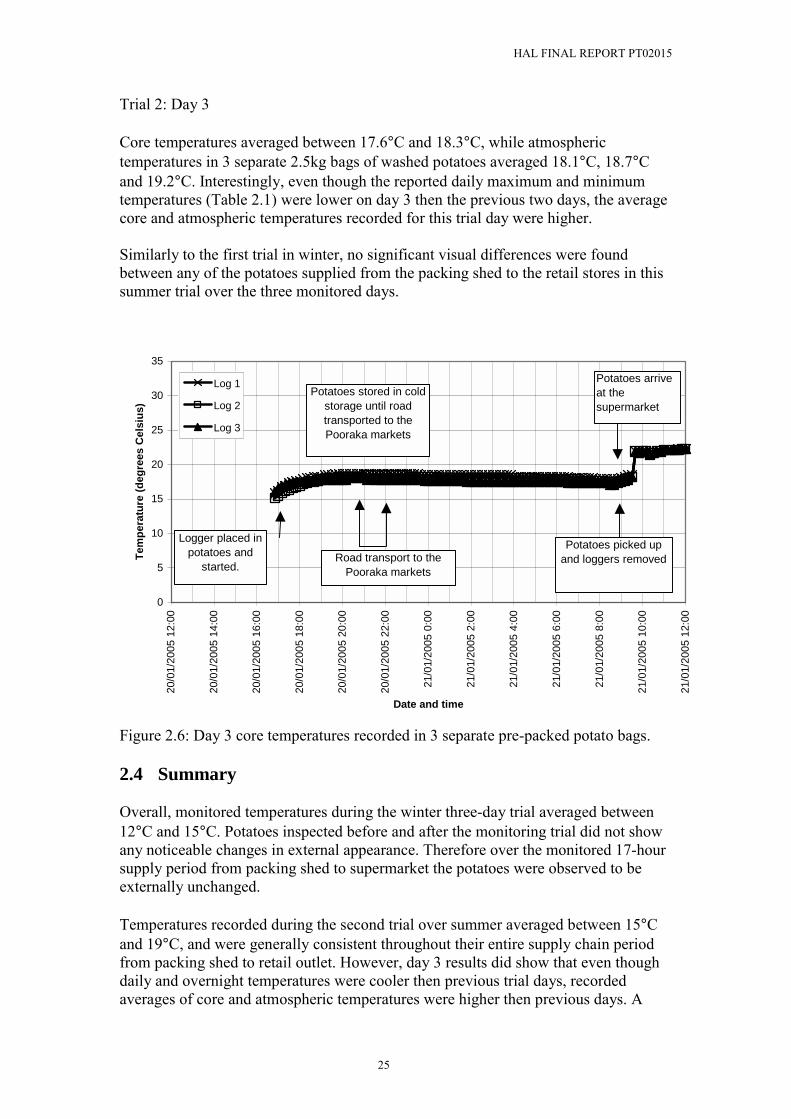
Trial 2: Day 3 Core temperatures averaged between 17.6°C and 18.3°C, while atmospheric temperatures in 3 separate 2.5kg bags of washed potatoes averaged 18.1°C, 18.7°C and 19.2°C. Interestingly, even though the reported daily maximum and minimum temperatures (Table 2.1) were lower on day 3 then the previous two days, the average core and atmospheric temperatures recorded for this trial day were higher. Similarly to the first trial in winter, no significant visual differences were found between any of the potatoes supplied from the packing shed to the retail stores in this summer trial over the three monitored days.
0
5
10
15
20
25
30
35
20/0
1/20
05 1
2:00
20/0
1/20
05 1
4:00
20/0
1/20
05 1
6:00
20/0
1/20
05 1
8:00
20/0
1/20
05 2
0:00
20/0
1/20
05 2
2:00
21/0
1/20
05 0
:00
21/0
1/20
05 2
:00
21/0
1/20
05 4
:00
21/0
1/20
05 6
:00
21/0
1/20
05 8
:00
21/0
1/20
05 1
0:00
21/0
1/20
05 1
2:00
Date and time
Tem
pera
ture
(deg
rees
Cel
sius
)
Log 1
Log 2
Log 3
Logger placed in potatoes and
started.
Potatoes arrive at the supermarket
Potatoes picked up and loggers removed
Potatoes stored in cold storage until road transported to the Pooraka markets
Road transport to the Pooraka markets
Figure 2.6: Day 3 core temperatures recorded in 3 separate pre-packed potato bags. 2.4 Summary Overall, monitored temperatures during the winter three-day trial averaged between 12°C and 15°C. Potatoes inspected before and after the monitoring trial did not show any noticeable changes in external appearance. Therefore over the monitored 17-hour supply period from packing shed to supermarket the potatoes were observed to be externally unchanged. Temperatures recorded during the second trial over summer averaged between 15°C and 19°C, and were generally consistent throughout their entire supply chain period from packing shed to retail outlet. However, day 3 results did show that even though daily and overnight temperatures were cooler then previous trial days, recorded averages of core and atmospheric temperatures were higher then previous days. A
HAL FINAL REPORT PT02015
26
possible reason for this temperature could be the positioning of the product on the truck. For example, product surrounded by other product may help to insulate it from �outside� air temperature (Trial 2: Day 1 and 2), while product at the back of the load is exposed to �outside� air temperatures (Trial 2: Day 3). In both trials potato appearances over the 17 to 24 hour supply chain period were found to be similar. However, the effect of transport temperatures on overall shelf life of the potatoes was not measured and may have in fact affected potato appearances over time if compared to potatoes stored at lower temperatures. This theory is observed in the next research section when fresh, white, washed potatoes are stored over time at different temperatures.
HAL FINAL REPORT PT02015
27
3 Fresh White Washed Premium Potato Storage 3.1 Introduction Storage temperature recommendations vary for fresh white washed potatoes. Recommended storage and handling temperatures vary between 5 to 6°C (Jobling, 2000a), 7 to 18°C (Shetty et al., 1998), 4°C to 7°C (Guenthner, Unknown), to between 4 and 10°C (Henderson, 2001). The confusion between the ideal storage and handling temperatures is evident in Australia with notable temperature differences between packing sheds, transport operators and supermarket retail displays and holding areas. Packing sheds in Australia when surveyed varied in holding temperatures between +2°C to ambient temperatures (refer to section 1.3, Figure 1.7). Members of Australian fresh potato supply chains currently have varied transport and storage temperatures. It would be useful for an assessment of the ideal temperature for fresh potato storage and handling, so that a constant temperature can be maintained in the supply chain. Temperature fluctuations are reported to stress and impair potato physiology (Shetty et al., 1998) and so consistent temperatures throughout the Australian potato industry would aim to give the best potato appearance over extended storage periods . 3.2 Procedure Fresh white washed Coliban potatoes were sourced from a northern Adelaide plains packing shed located in South Australia. The trial was setup in a Randomised Complete Block Design, with three replicates and three storage temperatures including, 4°C, 10°C and 20°C. All potatoes were stored at between 80 and 90% RH in the dark. Two potato pre-packs were used for each treatment assessment, with one bag of potatoes being used for external quality assessments and the other for internal quality assessments. Overall the trial consisted of six potato pre-packs (2.5kg), sourced on three consecutive days. Two bags (one used for external assessments and the other for internal assessments) were randomly assigned to each of the three temperature treatments and then initially assessed. Quality assessment days were chosen to represent certain significant periods in fresh potato storage and handling. Potato assessment days were:
• Initial assessment, Day 0 � Potatoes were assessed on the day they were delivered to the SARDI Plant Research Centre.
• After 2 days storage - Simulating the time period of packaging and transport to local markets
• After 7 days storage � Simulating fresh potatoes stored and transported for interstate markets
• After 14 days storage � Simulating fresh potatoes stored and transported via sea freight to neighbouring overseas markets
• After 21 days storage � Simulating fresh potatoes stored and transported via sea freight to distant overseas markets

HAL FINAL REPORT PT02015
28
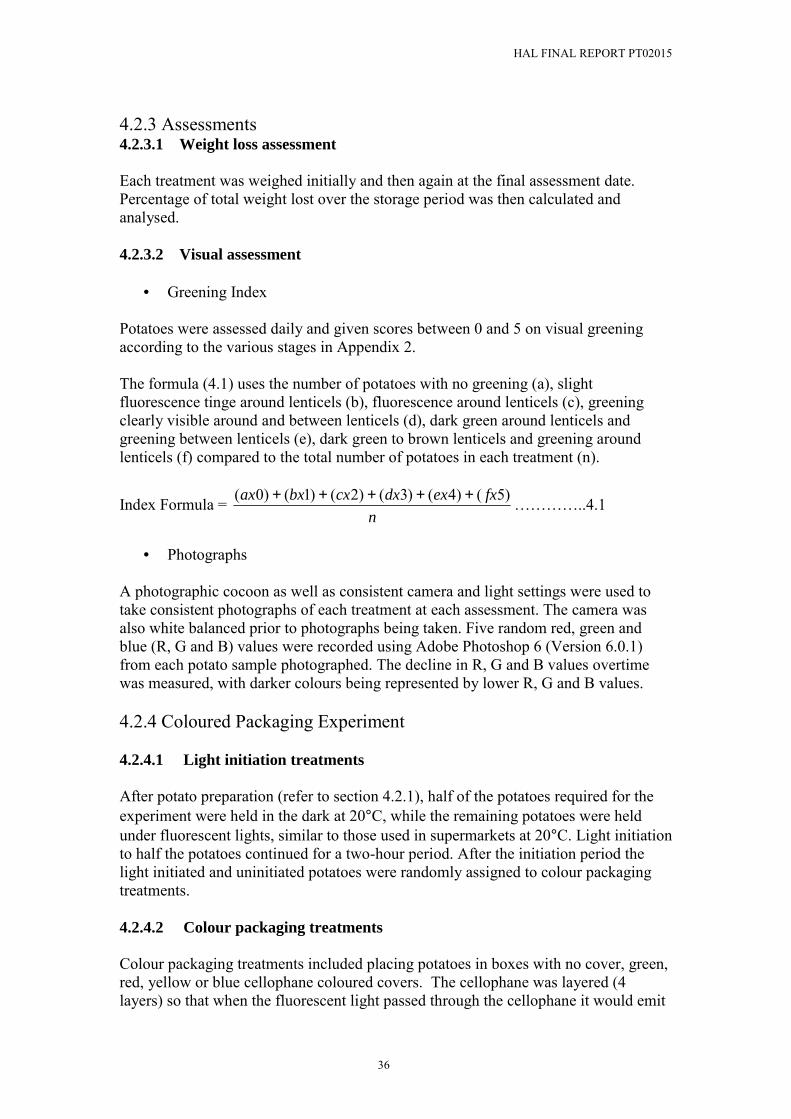
3.2.1 External Quality Assessments Ten potatoes from each of the temperature treated external quality bags were numbered from 1 to 10. The ten potatoes were then weighed, assessed visually, assessed with the Minolta Chroma Meter, and then photographed before returning them to their plastic bags and placed into their allocated temperature treatments of 4°C, 10°C or 20°C. 3.2.1.1 Weight loss assessment Each treatment was weighed initially and then again at the final assessment date. The percentage of total weight lost over the storage period was then calculated and statistically analysed. 3.2.1.2 Visual assessments Potatoes were assessed for greening, peel brightness and lenticel discolouration on the aforementioned days and were allocated scores of between 0 and 5 relating to the stages in Appendix 2, 3 and 4, respectively. The scores were weighted and averaged into a greening index, brightness index and lenticel discolouration index, using the formula (3.1) adjusted from (Schirra et al., 1999), as data for each treatment was normally distributed and fell within a narrow range.
Index Formula = n
fxexdxcxbxax )5()4()3()2()1()0( +++++ ��������.3.1
• Greening Index The formula (3.1) uses the number of potatoes with no greening (a), a slight fluorescence tinge around lenticels (b), fluorescence around lenticels (c), greening clearly visible around and between lenticels (d), dark green around lenticels and greening between lenticels (e), dark green to brown lenticels and greening around lenticels (f) compared to the total number of potatoes in each treatment (n).
• Peel Brightness Index The formula (3.1) uses the number of potatoes with fresh white surface sheen (a), slight surface sheen (b), no surface sheen (c), slightly dull surface (d), dull appearance and darkening of peel (e), strong darkening of peel (f) compared to the total number of potatoes in each treatment (n).
• Lenticel Discolouration Index The formula (3.1) uses the number of potatoes with a white glossy peel appearance (a), yellow tinge around lenticels (b), clear yellow rings around lenticels (c), large yellow rings around lenticels (d), yellowing around and between lenticels (e), dark brown rings and craters around lenticels (f) compared to the total number of potatoes in each treatment (n).
HAL FINAL REPORT PT02015
29
• Photographs A photographic cocoon as well as consistent camera and light settings were used to take photographs of each treatment at each of the assessment dates. The camera was also white balanced prior to photographs being taken. Photographs of treatments were then visually compared to other replicates as well as other treatments to observe differences and similarities. 3.2.1.3 Minolta chroma meter assessments Potato peel colour measured on the ten numbered samples from each temperature treatment was assessed with a Minolta Chroma Meter CR 300 using the L*C*H° method of colour classification. �L*� is the lightness variable, measuring the degree of whiteness (100) to darkness (0). �C*� is the chroma variable that represents the saturation or purity of the colour (intensity), where 100% saturation of colour means the colour is pure. Finally, �H°� is the hue angle variable, where the degree to which a sample resembles red, yellow, green or blue is determined. At the start of each assessment period the Minolta Chroma Meter was calibrated against a white calibration tile. All potatoes were then measured with the Minolta Chroma Meter three times. The L*C*H° colour system was measured where the average L*or lightness, C* chroma, and H° Hue angle measurements were recorded over the assessment period and then statistically analysed for differences between treatments. 3.2.2 Internal Quality Assessments Three potatoes were sampled on each of the assessment days for internal quality measurements. 3.2.2.1 Potato flesh glucose measurement Potatoes were cut in half with a single Diastix strip wiped between the halves and then left to dry for 30 seconds. After the 30-second period the colour strips were checked against the glucose colour chart and the result of the test recorded. 3.2.3 Statistical Analysis A Randomised Complete Block Design (RCBD) was established with three replicated blocks. Each replicate block consisted of three temperature treatments 4°C, 10°C and 20°C and two types of assessments, external and internal quality assessments. Potato pre-packs in daily replicates were randomly allocated to temperature treatments and quality assessment groups. Analysis of all data was performed using the General ANOVA command in Genstat, (Release 7.1, 7th edition, 2003, Lawes Agricultural Trust, Rothamsted Experimental Station). A least significant difference test (LSD) at the 5% level was used to examine all treatment effects.

HAL FINAL REPORT PT02015
3.3 Results
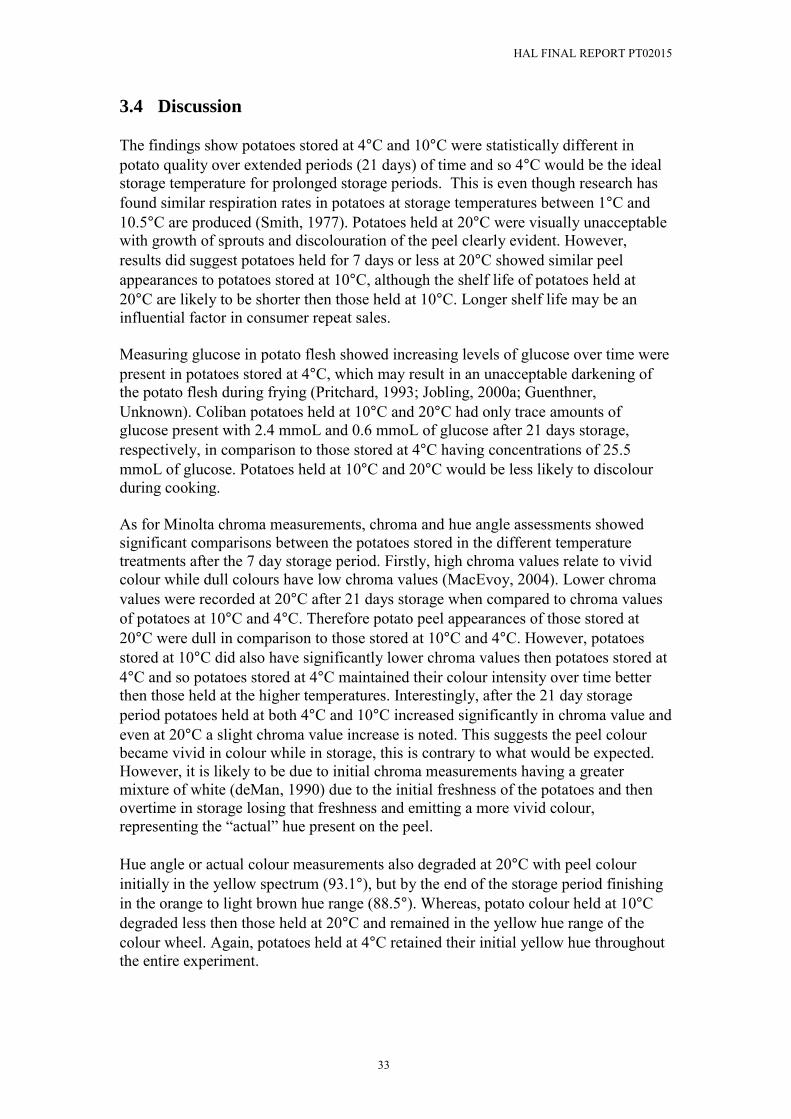
a
b
a
b
a
b
Figure 3.1: (a) Initial potato appearance prior to 4°C storage (b) Potato appearance after storage in 4°C temperatures at Day 14.
Fig
Figure 3.3: (a) Initial potato appearance
c
30
ure 3.2: (a) Initial potato appearance prior
to 10°C storage (b) Potato appearance after storage in 10°C temperatures at Day 14.
prior to 20°C storage (b) Potato appearance after storage in 20°C temperatures at Day 14. (c) Sprouting was also visible on most potatoes after 14 days storage at 20°C.
HAL FINAL REPORT PT02015
31
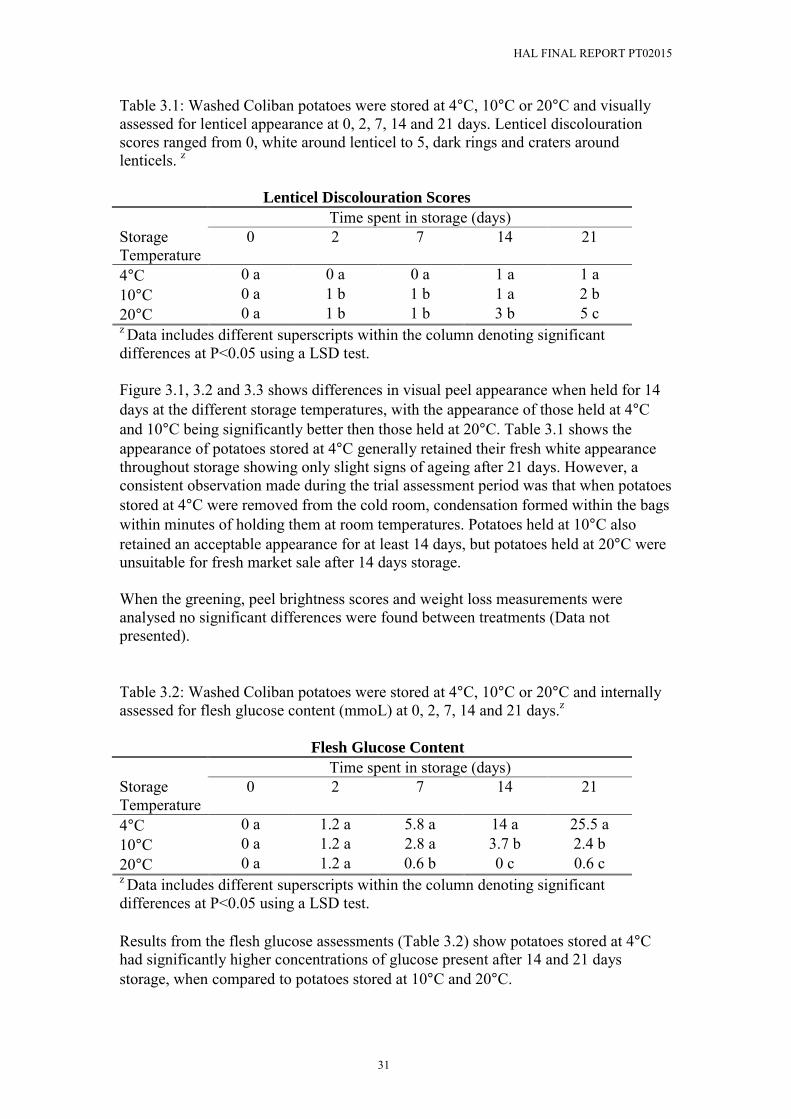
Table 3.1: Washed Coliban potatoes were stored at 4°C, 10°C or 20°C and visually assessed for lenticel appearance at 0, 2, 7, 14 and 21 days. Lenticel discolouration scores ranged from 0, white around lenticel to 5, dark rings and craters around lenticels. z
Lenticel Discolouration Scores Time spent in storage (days) Storage Temperature
0 2 7 14 21
4°C 0 a 0 a 0 a 1 a 1 a 10°C 0 a 1 b 1 b 1 a 2 b 20°C 0 a 1 b 1 b 3 b 5 c z Data includes different superscripts within the column denoting significant differences at P<0.05 using a LSD test. Figure 3.1, 3.2 and 3.3 shows differences in visual peel appearance when held for 14 days at the different storage temperatures, with the appearance of those held at 4°C and 10°C being significantly better then those held at 20°C. Table 3.1 shows the appearance of potatoes stored at 4°C generally retained their fresh white appearance throughout storage showing only slight signs of ageing after 21 days. However, a consistent observation made during the trial assessment period was that when potatoes stored at 4°C were removed from the cold room, condensation formed within the bags within minutes of holding them at room temperatures. Potatoes held at 10°C also retained an acceptable appearance for at least 14 days, but potatoes held at 20°C were unsuitable for fresh market sale after 14 days storage. When the greening, peel brightness scores and weight loss measurements were analysed no significant differences were found between treatments (Data not presented). Table 3.2: Washed Coliban potatoes were stored at 4°C, 10°C or 20°C and internally assessed for flesh glucose content (mmoL) at 0, 2, 7, 14 and 21 days.z
Flesh Glucose Content Time spent in storage (days) Storage Temperature
0 2 7 14 21
4°C 0 a 1.2 a 5.8 a 14 a 25.5 a 10°C 0 a 1.2 a 2.8 a 3.7 b 2.4 b 20°C 0 a 1.2 a 0.6 b 0 c 0.6 c z Data includes different superscripts within the column denoting significant differences at P<0.05 using a LSD test. Results from the flesh glucose assessments (Table 3.2) show potatoes stored at 4°C had significantly higher concentrations of glucose present after 14 and 21 days storage, when compared to potatoes stored at 10°C and 20°C.
HAL FINAL REPORT PT02015
32
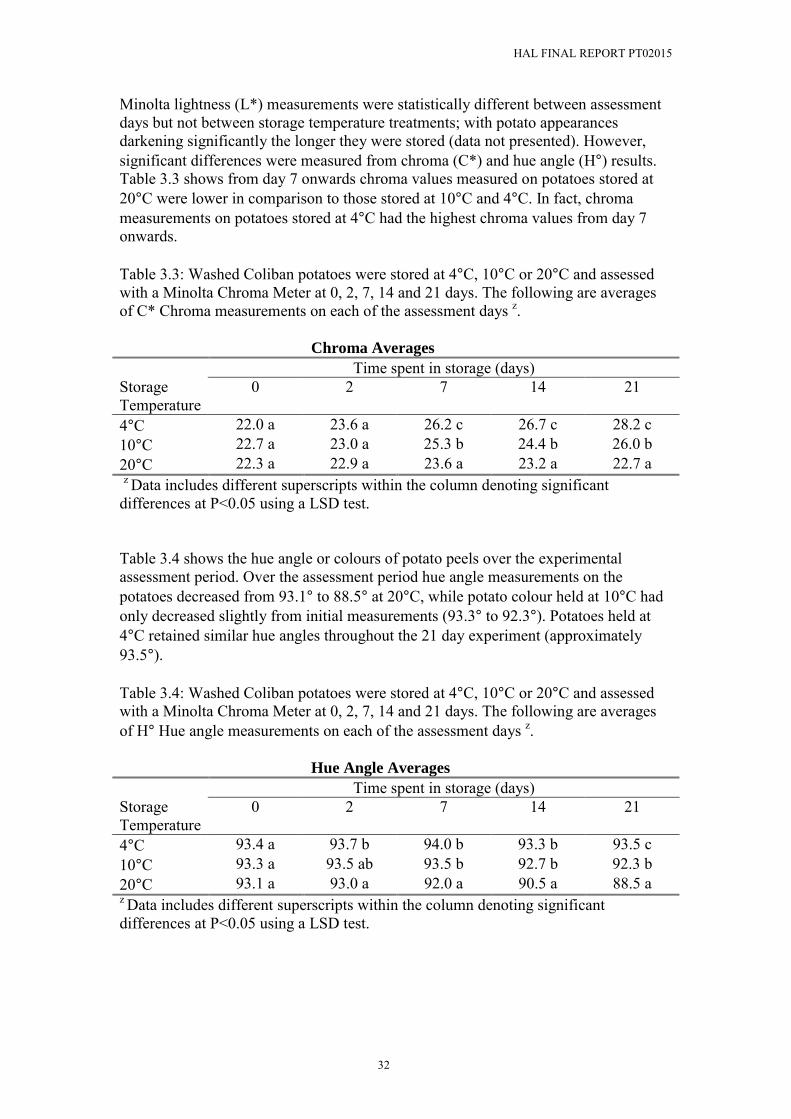
Minolta lightness (L*) measurements were statistically different between assessment days but not between storage temperature treatments; with potato appearances darkening significantly the longer they were stored (data not presented). However, significant differences were measured from chroma (C*) and hue angle (H°) results. Table 3.3 shows from day 7 onwards chroma values measured on potatoes stored at 20°C were lower in comparison to those stored at 10°C and 4°C. In fact, chroma measurements on potatoes stored at 4°C had the highest chroma values from day 7 onwards. Table 3.3: Washed Coliban potatoes were stored at 4°C, 10°C or 20°C and assessed with a Minolta Chroma Meter at 0, 2, 7, 14 and 21 days. The following are averages of C* Chroma measurements on each of the assessment days z. Chroma Averages Time spent in storage (days) Storage Temperature
0 2 7 14 21
4°C 22.0 a 23.6 a 26.2 c 26.7 c 28.2 c 10°C 22.7 a 23.0 a 25.3 b 24.4 b 26.0 b 20°C 22.3 a 22.9 a 23.6 a 23.2 a 22.7 a z Data includes different superscripts within the column denoting significant differences at P<0.05 using a LSD test. Table 3.4 shows the hue angle or colours of potato peels over the experimental assessment period. Over the assessment period hue angle measurements on the potatoes decreased from 93.1° to 88.5° at 20°C, while potato colour held at 10°C had only decreased slightly from initial measurements (93.3° to 92.3°). Potatoes held at 4°C retained similar hue angles throughout the 21 day experiment (approximately 93.5°). Table 3.4: Washed Coliban potatoes were stored at 4°C, 10°C or 20°C and assessed with a Minolta Chroma Meter at 0, 2, 7, 14 and 21 days. The following are averages of H° Hue angle measurements on each of the assessment days z. Hue Angle Averages Time spent in storage (days) Storage Temperature
0 2 7 14 21
4°C 93.4 a 93.7 b 94.0 b 93.3 b 93.5 c 10°C 93.3 a 93.5 ab 93.5 b 92.7 b 92.3 b 20°C 93.1 a 93.0 a 92.0 a 90.5 a 88.5 a z Data includes different superscripts within the column denoting significant differences at P<0.05 using a LSD test.
HAL FINAL REPORT PT02015
33
3.4 Discussion The findings show potatoes stored at 4°C and 10°C were statistically different in potato quality over extended periods (21 days) of time and so 4°C would be the ideal storage temperature for prolonged storage periods. This is even though research has found similar respiration rates in potatoes at storage temperatures between 1°C and 10.5°C are produced (Smith, 1977). Potatoes held at 20°C were visually unacceptable with growth of sprouts and discolouration of the peel clearly evident. However, results did suggest potatoes held for 7 days or less at 20°C showed similar peel appearances to potatoes stored at 10°C, although the shelf life of potatoes held at 20°C are likely to be shorter then those held at 10°C. Longer shelf life may be an influential factor in consumer repeat sales. Measuring glucose in potato flesh showed increasing levels of glucose over time were present in potatoes stored at 4°C, which may result in an unacceptable darkening of the potato flesh during frying (Pritchard, 1993; Jobling, 2000a; Guenthner, Unknown). Coliban potatoes held at 10°C and 20°C had only trace amounts of glucose present with 2.4 mmoL and 0.6 mmoL of glucose after 21 days storage, respectively, in comparison to those stored at 4°C having concentrations of 25.5 mmoL of glucose. Potatoes held at 10°C and 20°C would be less likely to discolour during cooking. As for Minolta chroma measurements, chroma and hue angle assessments showed significant comparisons between the potatoes stored in the different temperature treatments after the 7 day storage period. Firstly, high chroma values relate to vivid colour while dull colours have low chroma values (MacEvoy, 2004). Lower chroma values were recorded at 20°C after 21 days storage when compared to chroma values of potatoes at 10°C and 4°C. Therefore potato peel appearances of those stored at 20°C were dull in comparison to those stored at 10°C and 4°C. However, potatoes stored at 10°C did also have significantly lower chroma values then potatoes stored at 4°C and so potatoes stored at 4°C maintained their colour intensity over time better then those held at the higher temperatures. Interestingly, after the 21 day storage period potatoes held at both 4°C and 10°C increased significantly in chroma value and even at 20°C a slight chroma value increase is noted. This suggests the peel colour became vivid in colour while in storage, this is contrary to what would be expected. However, it is likely to be due to initial chroma measurements having a greater mixture of white (deMan, 1990) due to the initial freshness of the potatoes and then overtime in storage losing that freshness and emitting a more vivid colour, representing the �actual� hue present on the peel. Hue angle or actual colour measurements also degraded at 20°C with peel colour initially in the yellow spectrum (93.1°), but by the end of the storage period finishing in the orange to light brown hue range (88.5°). Whereas, potato colour held at 10°C degraded less then those held at 20°C and remained in the yellow hue range of the colour wheel. Again, potatoes held at 4°C retained their initial yellow hue throughout the entire experiment.
HAL FINAL REPORT PT02015
34
Short periods (7 days or less) of storage at 20°C may not visually decrease the appearance of potatoes, but may affect shelf life. Extended storage periods at 20°C will notably decrease the peel appearance of fresh market potatoes. Maintaining Coliban potato temperatures between 4°C and 10°C would retain the best peel appearance while in short term storage, although extended periods (14 to 21 days) in storage would be best at 4°C as a slightly better peel appearance is present if consistent low temperatures are maintained over time. However, the risk of storing or transporting potatoes at 4°C is that if cold chain breaks occur and potatoes are exposed to ambient temperatures for short periods after storage or transport at 4°C, condensation or moisture within bags is likely to occur which could lead to the development of potato rots; as rots are encouraged by moisture (Stroud et al., 2003). Consequently, if consistent supply chain temperatures are not guaranteed in the potato supply chain then transporting and storing at 10°C is recommended to reduce the incidence of rots due to cold chain breaks.
HAL FINAL REPORT PT02015
35
4 Fresh White Washed Premium Potato Packaging 4.1 Introduction Potato tubers exposed to light form chlorophyll in their outer most layers. This is visible to consumers as greening on the skin. The greening of potatoes is an appearance factor that is detrimental to retail sales, with white peels preferred by consumers. However, the display of potatoes in retail stores under artificial light at high temperatures tends to accelerate the formation of potato greening. This is because supermarkets generally display fresh potatoes at 20°C under fluorescent or incandescent lights and as potato greening is an enzymatic activity increased with increasing temperature (Pavlista, unknown). Supermarket display conditions are ideal for rapid potato greening. Past potato greening research has focused on the effect of different coloured light on chlorophyll synthesis and has found that chlorophyll synthesis takes place in both red and blue light (Virgin, 1993). Blue light was found to be more effective at starting the greening process (Virgin and Sundqvist, 1992), while chlorophyll formation is believed to be more efficient under red to yellow light (Pavlista, unknown). Therefore as chlorophyll absorbs blue and red light and reflects green light, different coloured packaging that emit various colours through to the white potatoes maybe able to slow the greening rate of potatoes under retail display conditions. 4.2 Procedure 4.2.1 Potato Preparation Freshly harvested dirty Coliban potatoes were sourced from a northern Adelaide plains potato packing shed in South Australia for both packaging trials. Harvested potatoes were covered to prevent light penetration and held overnight in the dark at 10°C until the experimental set up began the following day. Potatoes were then washed in darkness. All visibly blemished and misshapen potatoes were removed and sorted under minimal light into single layered towelling lined boxes and allowed to air dry in ambient temperatures. 4.2.2 Experimental Light Set-up The experimental light set-up that was used for the daily light period was between 600 and 800 lux. The above levels were used after measuring lux values from the top of potato pre-packs held in retail displays from a number of large supermarket chains. The type of light found in the stores was also noted, in most stores daylight fluorescent tubes were used over potato display areas. From the light samples recorded lux readings from the major supermarket chains varied between 600 to 800 lux.
HAL FINAL REPORT PT02015
36
4.2.3 Assessments 4.2.3.1 Weight loss assessment Each treatment was weighed initially and then again at the final assessment date. Percentage of total weight lost over the storage period was then calculated and analysed. 4.2.3.2 Visual assessment
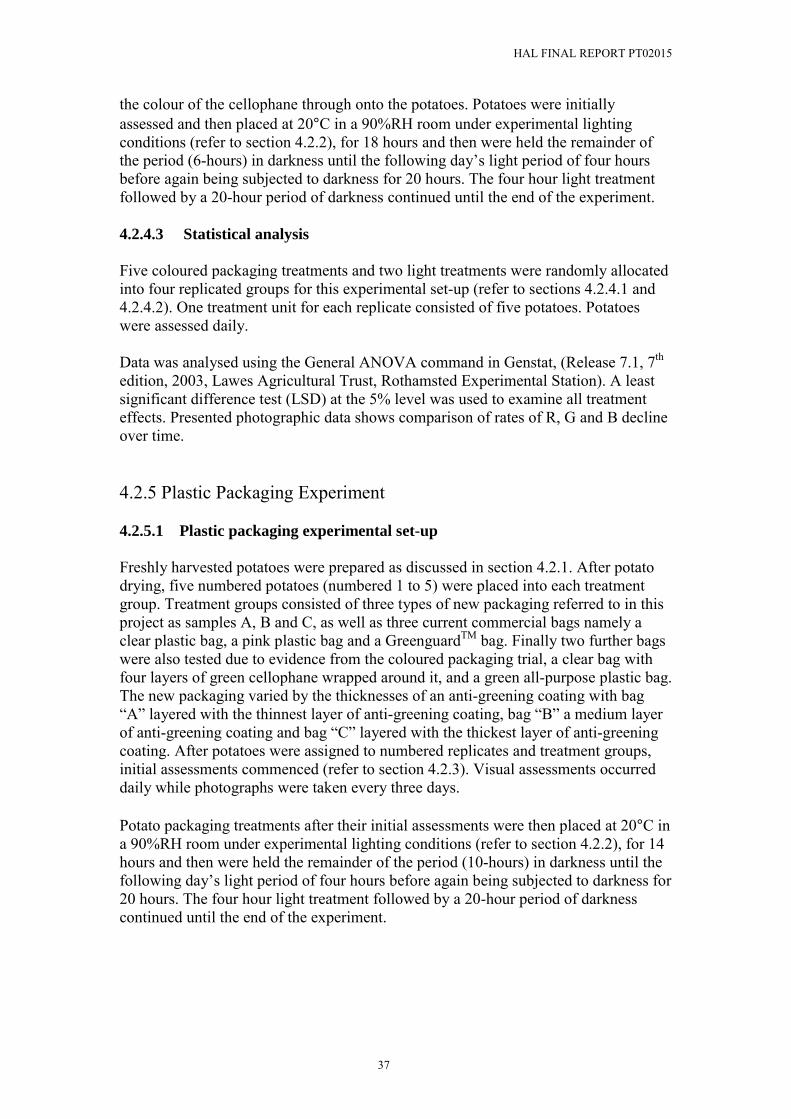
• Greening Index Potatoes were assessed daily and given scores between 0 and 5 on visual greening according to the various stages in Appendix 2. The formula (4.1) uses the number of potatoes with no greening (a), slight fluorescence tinge around lenticels (b), fluorescence around lenticels (c), greening clearly visible around and between lenticels (d), dark green around lenticels and greening between lenticels (e), dark green to brown lenticels and greening around lenticels (f) compared to the total number of potatoes in each treatment (n).
Index Formula = n
fxexdxcxbxax )5()4()3()2()1()0( +++++ ����..4.1
• Photographs
A photographic cocoon as well as consistent camera and light settings were used to take consistent photographs of each treatment at each assessment. The camera was also white balanced prior to photographs being taken. Five random red, green and blue (R, G and B) values were recorded using Adobe Photoshop 6 (Version 6.0.1) from each potato sample photographed. The decline in R, G and B values overtime was measured, with darker colours being represented by lower R, G and B values. 4.2.4 Coloured Packaging Experiment 4.2.4.1 Light initiation treatments After potato preparation (refer to section 4.2.1), half of the potatoes required for the experiment were held in the dark at 20°C, while the remaining potatoes were held under fluorescent lights, similar to those used in supermarkets at 20°C. Light initiation to half the potatoes continued for a two-hour period. After the initiation period the light initiated and uninitiated potatoes were randomly assigned to colour packaging treatments. 4.2.4.2 Colour packaging treatments Colour packaging treatments included placing potatoes in boxes with no cover, green, red, yellow or blue cellophane coloured covers. The cellophane was layered (4 layers) so that when the fluorescent light passed through the cellophane it would emit
HAL FINAL REPORT PT02015
37
the colour of the cellophane through onto the potatoes. Potatoes were initially assessed and then placed at 20°C in a 90%RH room under experimental lighting conditions (refer to section 4.2.2), for 18 hours and then were held the remainder of the period (6-hours) in darkness until the following day�s light period of four hours before again being subjected to darkness for 20 hours. The four hour light treatment followed by a 20-hour period of darkness continued until the end of the experiment. 4.2.4.3 Statistical analysis Five coloured packaging treatments and two light treatments were randomly allocated into four replicated groups for this experimental set-up (refer to sections 4.2.4.1 and 4.2.4.2). One treatment unit for each replicate consisted of five potatoes. Potatoes were assessed daily. Data was analysed using the General ANOVA command in Genstat, (Release 7.1, 7th edition, 2003, Lawes Agricultural Trust, Rothamsted Experimental Station). A least significant difference test (LSD) at the 5% level was used to examine all treatment effects. Presented photographic data shows comparison of rates of R, G and B decline over time. 4.2.5 Plastic Packaging Experiment 4.2.5.1 Plastic packaging experimental set-up Freshly harvested potatoes were prepared as discussed in section 4.2.1. After potato drying, five numbered potatoes (numbered 1 to 5) were placed into each treatment group. Treatment groups consisted of three types of new packaging referred to in this project as samples A, B and C, as well as three current commercial bags namely a clear plastic bag, a pink plastic bag and a GreenguardTM bag. Finally two further bags were also tested due to evidence from the coloured packaging trial, a clear bag with four layers of green cellophane wrapped around it, and a green all-purpose plastic bag. The new packaging varied by the thicknesses of an anti-greening coating with bag �A� layered with the thinnest layer of anti-greening coating, bag �B� a medium layer of anti-greening coating and bag �C� layered with the thickest layer of anti-greening coating. After potatoes were assigned to numbered replicates and treatment groups, initial assessments commenced (refer to section 4.2.3). Visual assessments occurred daily while photographs were taken every three days. Potato packaging treatments after their initial assessments were then placed at 20°C in a 90%RH room under experimental lighting conditions (refer to section 4.2.2), for 14 hours and then were held the remainder of the period (10-hours) in darkness until the following day�s light period of four hours before again being subjected to darkness for 20 hours. The four hour light treatment followed by a 20-hour period of darkness continued until the end of the experiment.
HAL FINAL REPORT PT02015
38
4.2.5.2 Statistical analysis A single treatment unit consisted of five potatoes, which were used to assess visual symptoms of greening, total percentage of weight loss, and R, G and B values via photographic recordings (refer to section 4.2.3). Statistically the experiment was set-up with four replicates and eight plastic packaging treatments (as listed in section 4.2.5.1). Analysis of all data was analysed using the General ANOVA command in Genstat, (Release 7.1, 7th edition, 2003, Lawes Agricultural Trust, Rothamsted Experimental Station). A least significant difference test (LSD) at the 5% level was used to examine all treatment effects. Presented photographic data shows comparison of rates of R, G and B decline over time. 4.3 Results & Discussion 4.3.1 Coloured Packaging Research findings showed covering potatoes with green cellophane slowed greening of potato tubers when compared to potatoes exposed to the fluorescent light or covered with the other coloured cellophane covers (Table 4.1). Light penetration was measured and showed the coloured cellophane significantly reduced lux values when compared to no cover. Light readings under yellow cellophane were almost half that of no cover light levels, while other colours only allowed between 50 and 96 lux. Similarly low lux levels penetrating the green, red and blue coloured cellophane did not result in similar potato greening. Potatoes under the green cellophane covers took over twice as many days to reach an unacceptable green appearance than potatoes under the red, blue or yellow cellophane covers. Table 4.1: Days of Coliban potatoes to reach an unacceptable green appearance after being stored at 20°C under fluorescent lights for an initial period of 14 hours and then with a daily light exposure of 4 hours. Coloured cellophane Days to reach an
unacceptable green appearance y
Lux values penetrating coloured cellophane
packaging z
No cover 5 a 778 a Green 14 c 50 c Red 6 b 51 c Blue 6 b 96 c Yellow 6 b 386 b y Data are means of 4 replicates, where different superscripts within the column denote significant differences at P<0.05 using a LSD test. z Data are means of 3 replicates, where different superscripts within the column denote significant differences at P<0.05 using a LSD test.

HAL FINAL REPORT PT02015
39
When compared to uncovered potatoes under fluorescent light, covering with green cellophane slowed greening of the potatoes by an average of 8 days, while red, blue and yellow cellophane only slowed greening by an average of 1 day. The extent of potato greening after 9 days under the various coloured covers in the light treatment can be observed in Figure 4.2. Analysis of photographs show potatoes under green coloured cellophane had significantly higher R, G and B values at assessment day 6 then other coloured cellophane (Table 4.2). From this data, the green coloured packaging resulted in brighter peel appearances after 6 days as the lower the R, G and B values, the darker the shade of colour. The R-value decline measured on uncovered potatoes was almost triple that of the R-value decline on potatoes under green coloured coverings and approximately double the rate of potatoes under red, blue and yellow packaging. Green coloured packaging resulted in the slowest rate of R, G and B decline over time (Table 4.2), when compared to all other packagings. No significant differences in the total weight loss of potatoes were found between the different coloured packaging treatments (data not presented). No significant differences were found between the two light initiation treatments also tested in this experiment (data not presented). Table 4.2: R,G and B-value averages at day 6 and rate of decline for Coliban potatoes after being stored at 20°C under fluorescent lights for an initial period of 14 hours and then with a daily light exposure of 4 hours over 18 days of storage. R-value G-value B-value Coloured Packaging
Day 6 Averagey
Rate of declinez
Day 6 Averagey
Rate of declinez
Day 6 Averagey
Rate of declinez
No cover 170 a -3.6 158 a -2.9 81 a -3.0 Green 190 d -1.3 173 d -1.2 99 c -2.1 Red 183 bc -1.9 169 bc -1.5 91 b -2.5 Blue 184 c -1.7 171 cd -1.2 91 b -2.3 Yellow 181 b -2.0 168 b -1.3 91 b -2.4
y Data are means of 4 replicates, where different superscripts within the column denote significant differences at P<0.05 using LSD test. z Data are rates in RGB decline per day.
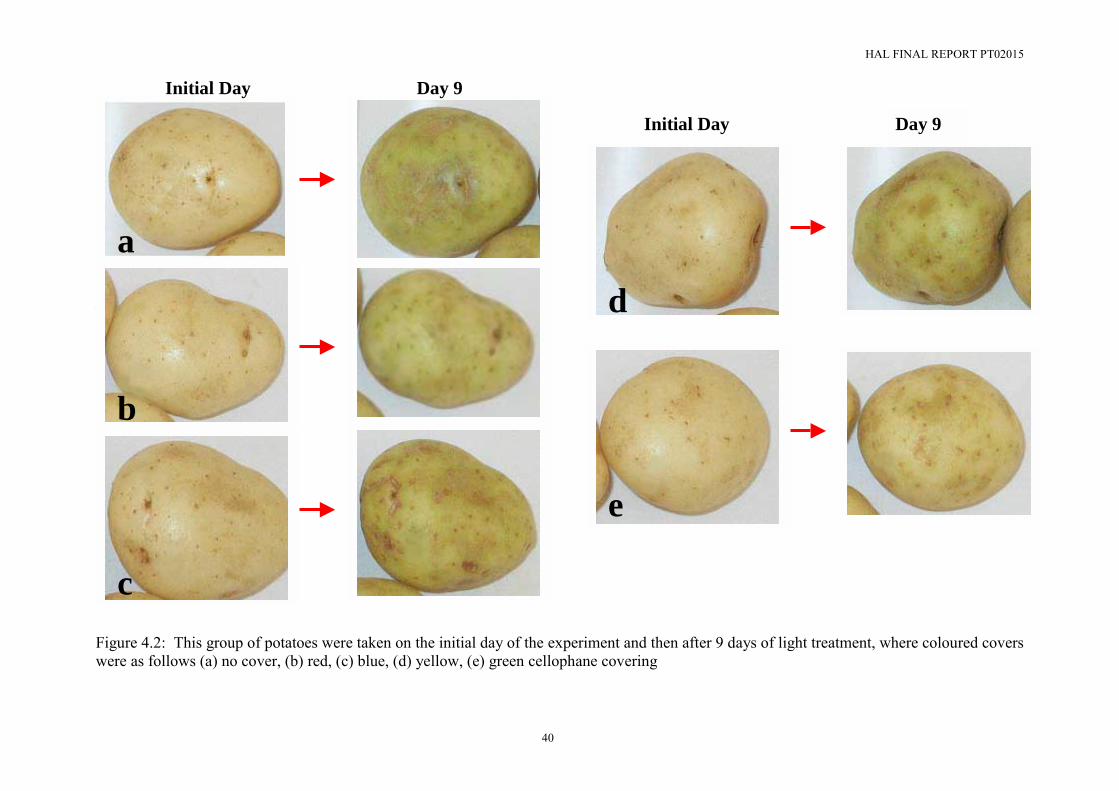
HAL FINAL REPORT PT02015
40
No cover Red Figure 4.2: This group of potatoes were taken on the initial day of the experiment and then after 9 days of light treatment, where coloured covers were as follows (a) no cover, (b) red, (c) blue, (d) yellow, (e) green cellophane covering
Initial Day Day 9
Initial Day Day 9
a
b
c
d
e

HAL FINAL REPORT PT02015
41
The results suggest green coloured packaging that emits green light onto the potatoes is more effective at slowing potato greening then other coloured packagings tested. These findings successfully proved greening in potatoes was influenced by the colour (wavelength) of light absorbed (Virgin and Sundqvist, 1992; Virgin, 1993), and disagreed that there was little to no greening of potatoes under blue light (Pavlista, unknown). As green coloured packaging is not generally used for potatoes commercially, further trials comparing currently used commercial bags and the new findings would be useful. Results from the coloured packaging trial led to the testing of a green all-purpose plastic bag as well as a green cellophane covered plastic bag being used in the plastic packaging trial (refer to 4.2.5.1). 4.3.2 Plastic Packaging Figure 4.3, Table 4.3 and 4.4 show the potato greening findings from the plastic packaging trial. Results showed most bags had unacceptable visible signs of potato greening by day 5 and 6 of the experiment; only potatoes held in the GreenguardTM bags and in the green cellophane wrapped bags were visibly acceptable with respect to the appearance of peel greening after 5 days storage. Table 4.3: Days for Coliban potatoes to reach an unacceptable green appearance when packed in various types of bags and stored at 20°C under fluorescent lights for an initial period of 14 hours and then with a daily light exposure of 4 hours.z Packaging type used Days to reach an
unacceptable green appearance
Light penetrating packaging (Lux)
Clear Bag 6 a 739 ab Ay 5 a 758 a By 5 a 657 bc Cy 5 a 581 c Pink Bag 5 a 198 d Green All-purpose 6 a 253 d GreenguardTM Bag 15 b 3 e Green Cellophane Wrapped Plastic Bag 16 b 27 e
y New packaging with an innovative layer of anti-greening coating A = thin coating, B = medium coating, C = thick coating. z Data are means of 4 replicates, where different superscripts within the column denote significant differences at P<0.05 using a LSD test. TM Trademark Measurements of light penetration through various bags tested (Table 4.3) show bags that allowed significantly higher amounts of light through them resulted in the appearance of greening earlier then those that let under 100 lux through the packaging. GreenguardTM bags were manufactured to prevent light penetration, which is reflected in the confirmed lux values measured. The reduced light penetration through bags resulted in potatoes being acceptable for approximately three times longer then those that allowed significantly higher amounts of light to penetrate through them. Green cellophane wrapped bags, allowed nine times more light through the bag then the GreenguardTM bag, but was as effective at slowing peel greening as
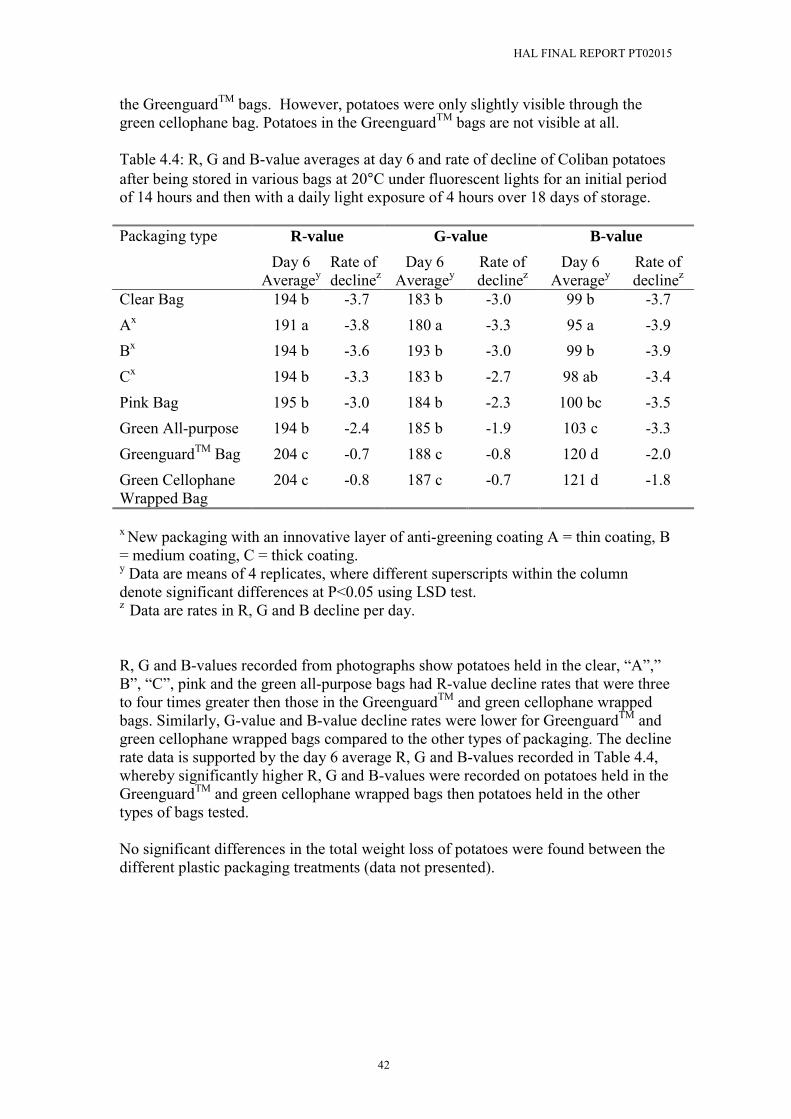
HAL FINAL REPORT PT02015
42
the GreenguardTM bags. However, potatoes were only slightly visible through the green cellophane bag. Potatoes in the GreenguardTM bags are not visible at all. Table 4.4: R, G and B-value averages at day 6 and rate of decline of Coliban potatoes after being stored in various bags at 20°C under fluorescent lights for an initial period of 14 hours and then with a daily light exposure of 4 hours over 18 days of storage. Packaging type R-value G-value B-value
Day 6 Averagey
Rate of declinez
Day 6 Averagey
Rate of declinez
Day 6 Averagey
Rate of declinez
Clear Bag 194 b -3.7 183 b -3.0 99 b -3.7 Ax 191 a -3.8 180 a -3.3 95 a -3.9 Bx 194 b -3.6 193 b -3.0 99 b -3.9 Cx 194 b -3.3 183 b -2.7 98 ab -3.4 Pink Bag 195 b -3.0 184 b -2.3 100 bc -3.5 Green All-purpose 194 b -2.4 185 b -1.9 103 c -3.3 GreenguardTM Bag 204 c -0.7 188 c -0.8 120 d -2.0 Green Cellophane Wrapped Bag
204 c -0.8 187 c -0.7 121 d -1.8
x New packaging with an innovative layer of anti-greening coating A = thin coating, B = medium coating, C = thick coating. y Data are means of 4 replicates, where different superscripts within the column denote significant differences at P<0.05 using LSD test. z Data are rates in R, G and B decline per day. R, G and B-values recorded from photographs show potatoes held in the clear, �A�,� B�, �C�, pink and the green all-purpose bags had R-value decline rates that were three to four times greater then those in the GreenguardTM and green cellophane wrapped bags. Similarly, G-value and B-value decline rates were lower for GreenguardTM and green cellophane wrapped bags compared to the other types of packaging. The decline rate data is supported by the day 6 average R, G and B-values recorded in Table 4.4, whereby significantly higher R, G and B-values were recorded on potatoes held in the GreenguardTM and green cellophane wrapped bags then potatoes held in the other types of bags tested. No significant differences in the total weight loss of potatoes were found between the different plastic packaging treatments (data not presented).

HAL FINAL REPORT PT02015
43
Figure 4.3: The appearance of potatoes packaged in a, (a) clear, (b) �A� thin anti-greening coating, (c) �B� medium coating, (d) �C� thick
coating, (e) pink, (f) green all-purpose, (g) a GreenguardTM, and (h) a clear plastic bag wrapped with 4 layers of green cellophane. Photos were taken after 6 days storage at 20°C with 14 hours of initial fluorescent light and then 4 hours of fluorescent light daily thereafter.
a
b
c
d
e
f
g
h
HAL FINAL REPORT PT02015
44
4.4 Summary Field greening does occur in potatoes, but chlorophyll production in tubers stored and displayed in retail outlets is of more concern (Storey and Davies, 1992). Firstly, results showed short light exposure during harvest and packing prior to lengthy light exposure periods on retail displays did not affect potato greening. Potatoes that were exposed to a small period of light prior to being placed into packaging treatments greened at similar times to potatoes kept initially in darkness and exposed to light only after they were placed into their packaging treatments. Results from the coloured and plastic packaging treatments had promising outcomes with the slowing of chlorophyll production while on display in retail stores possible, if plastic packaging is able to totally prevent light from penetrating through to the potatoes. This was found to be the most effective method of preventing greening. Another interesting finding observed that low levels of light (below 100 lux) emitted through green packaging slowed potato greening more so then light emitted through to potatoes under red or blue packaging. Hence, if total light block-out is not a commercially acceptable or viable option for the potato packaging industry, then green packaging that allows low light penetration (below 100 lux) is a more effective option for slowing potato greening then pink, red, blue or yellow coloured packaging. Furthermore, research has found glycoalkaloid synthesis or the production of bitter tasting toxins that are also formed when potatoes are exposed to light is slowed by green light (Petermann and Morris, 1985) and so green coloured packaging may also reduce glycoalkaloid production. The new anti-greening packagings were equally as effective as currently available clear and pink commercial packaging. These findings suggest that further research is required to improve the �anti-greening � packaging to increase their effectiveness on slowing potato greening under retail conditions.
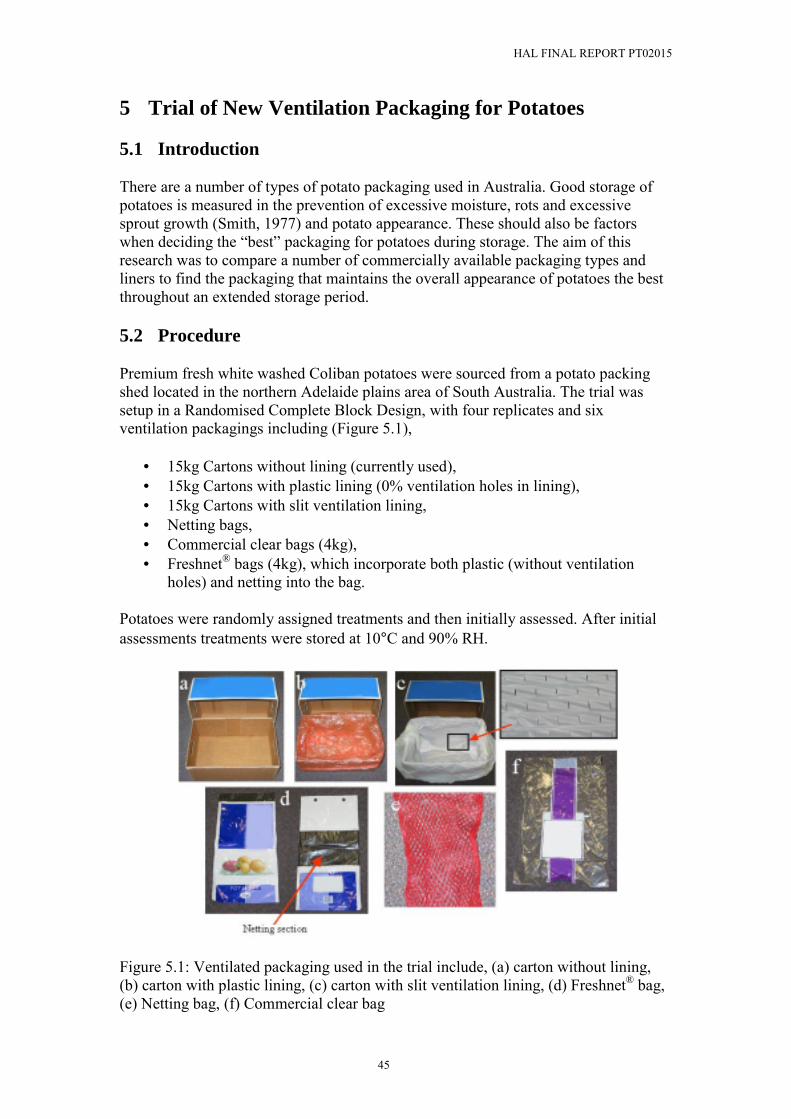
HAL FINAL REPORT PT02015
45
5 Trial of New Ventilation Packaging for Potatoes 5.1 Introduction There are a number of types of potato packaging used in Australia. Good storage of potatoes is measured in the prevention of excessive moisture, rots and excessive sprout growth (Smith, 1977) and potato appearance. These should also be factors when deciding the �best� packaging for potatoes during storage. The aim of this research was to compare a number of commercially available packaging types and liners to find the packaging that maintains the overall appearance of potatoes the best throughout an extended storage period. 5.2 Procedure Premium fresh white washed Coliban potatoes were sourced from a potato packing shed located in the northern Adelaide plains area of South Australia. The trial was setup in a Randomised Complete Block Design, with four replicates and six ventilation packagings including (Figure 5.1),
• 15kg Cartons without lining (currently used), • 15kg Cartons with plastic lining (0% ventilation holes in lining), • 15kg Cartons with slit ventilation lining, • Netting bags, • Commercial clear bags (4kg), • Freshnet® bags (4kg), which incorporate both plastic (without ventilation
holes) and netting into the bag. Potatoes were randomly assigned treatments and then initially assessed. After initial assessments treatments were stored at 10°C and 90% RH.
Figure 5.1: Ventilated packaging used in the trial include, (a) carton without lining, (b) carton with plastic lining, (c) carton with slit ventilation lining, (d) Freshnet® bag, (e) Netting bag, (f) Commercial clear bag
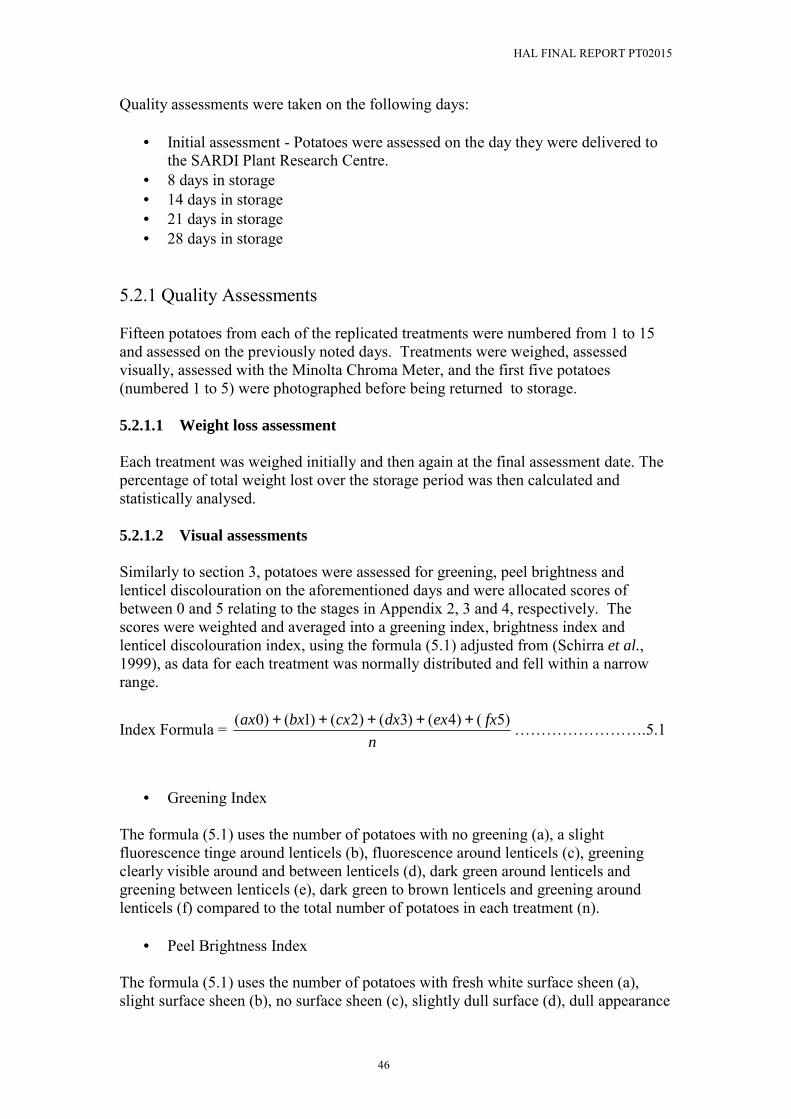
HAL FINAL REPORT PT02015
46
Quality assessments were taken on the following days:
• Initial assessment - Potatoes were assessed on the day they were delivered to the SARDI Plant Research Centre.
• 8 days in storage • 14 days in storage • 21 days in storage • 28 days in storage
5.2.1 Quality Assessments Fifteen potatoes from each of the replicated treatments were numbered from 1 to 15 and assessed on the previously noted days. Treatments were weighed, assessed visually, assessed with the Minolta Chroma Meter, and the first five potatoes (numbered 1 to 5) were photographed before being returned to storage. 5.2.1.1 Weight loss assessment Each treatment was weighed initially and then again at the final assessment date. The percentage of total weight lost over the storage period was then calculated and statistically analysed. 5.2.1.2 Visual assessments Similarly to section 3, potatoes were assessed for greening, peel brightness and lenticel discolouration on the aforementioned days and were allocated scores of between 0 and 5 relating to the stages in Appendix 2, 3 and 4, respectively. The scores were weighted and averaged into a greening index, brightness index and lenticel discolouration index, using the formula (5.1) adjusted from (Schirra et al., 1999), as data for each treatment was normally distributed and fell within a narrow range.
Index Formula = n
fxexdxcxbxax )5()4()3()2()1()0( +++++ ��������.5.1
• Greening Index The formula (5.1) uses the number of potatoes with no greening (a), a slight fluorescence tinge around lenticels (b), fluorescence around lenticels (c), greening clearly visible around and between lenticels (d), dark green around lenticels and greening between lenticels (e), dark green to brown lenticels and greening around lenticels (f) compared to the total number of potatoes in each treatment (n).
• Peel Brightness Index The formula (5.1) uses the number of potatoes with fresh white surface sheen (a), slight surface sheen (b), no surface sheen (c), slightly dull surface (d), dull appearance

HAL FINAL REPORT PT02015
47
and darkening of peel (e), strong darkening of peel (f) compared to the total number of potatoes in each treatment (n).
• Lenticel Discolouration Index The formula (5.1) uses the number of potatoes with a white glossy peel appearance (a), yellow tinge around lenticels (b), clear yellow rings around lenticels (c), large yellow rings around lenticels (d), yellowing around and between lenticels (e), dark brown rings and craters around lenticels (f) compared to the total number of potatoes in each treatment (n).
• Photographs A photographic cocoon as well as consistent camera and light settings were used to take photographs of each treatment at each of the assessment dates. The photographs of treatments were then visually compared to other replicates as well as other treatments to observe differences and similarities. 5.2.1.3 Minolta chroma meter assessments Potato peel colour measured on the numbered samples from each treatment was assessed with a Minolta Chroma Meter CR 300 using the L*C*H° method of colour classification. �L*� is the lightness variable, measuring the degree of whiteness (100) to darkness (0). �C*� is the chroma variable that represents the saturation or purity of the colour (intensity), where 100% saturation of colour means the colour is pure. Finally, �H°� is the hue angle variable, where the degree to which a sample resembles red, yellow, green or blue is determined. At the start of each assessment period the Minolta Chroma Meter was calibrated against a white calibration tile. All potatoes were then measured with the Minolta Chroma Meter three times. The L*C*H° colour system was measured where the average L*or lightness, C* chroma, and H° Hue angle measurements were recorded over the assessment period and then statistically analysed for differences between treatments. 5.2.2 Statistical Analysis A Randomised Complete Block Design (RCBD) was established with four replicated blocks. Each replicate block consisted of six ventilation-packaging treatments. Potatoes were randomly allocated to treatments and the same potatoes were assessed on each of the assessment days for consistency purposes. Analysis of all data was performed using the General ANOVA command in Genstat, (Release 7.1, 7th edition, 2003, Lawes Agricultural Trust, Rothamsted Experimental Station). A least significant difference test (LSD) at the 5% level was used to examine all treatment effects.

HAL FINAL REPORT PT02015
48
5.3 Results & Discussion Visible observations showed the various types of new and old ventilated potato packaging statistically had no significant effect on the appearance of potato greening, peel brightness or lenticel discolouration during storage at 10°C with 90% RH (data not presented). Minolta chroma meter measurements of potatoes from the various ventilated potato packagings also when statistically analysed showed no significant differences for lightness, chroma or hue angle over the storage period (Table 5.1). Table 5.1 presents L*C*H° averages for initial assessments and assessment at 28 days. It shows lightness measurements slightly decreased over storage while chroma measurements increased and hue angle remained the same. The reduced lightness measurement may be explained due to the potatoes loss of freshness during time in storage, this may also explain the chroma increase in storage. Chroma or the vividness of colour was initially low possibly due to the �freshness� or the amount of lightness in the potato, but over time in storage the potato loses it�s fresh appearance or lightness and increases the saturation or strength of the peel colour. Even though the hue angle (or peel colour) does not change over time in storage, the changes in lightness and chroma effectively combine to change the appearance (deMan, 1990) of the potatoes to the naked eye Table 5.1: Initial and final LCH averages for Coliban potatoes packaged in the various packagings when stored at 10°C with 90% RHz. Type of ventilated packaging
Lightness Chroma Hue
Initial Day 28 Initial Day 28 Initial Day 28 Carton (no liner) 73 a 69 a 17 a 23 a 94 a 94 a Carton with liner (no ventilation)
73 a 69 a 17 a 23 a 94 a 94 a
Carton (liner + slits) 73 a 68 a 17 a 23 a 94 a 93 a Netting Bag 73 a 70 a 17 a 24 a 94 a 94 a Freshnet Bag 73 a 69 a 17 a 23 a 94 a 94 a Commercial Bag 72 a 69 a 17 a 23 a 94 a 94 a z Data are means of 4 replicates, where similar superscripts within the columns denote no significant differences at P<0.05 using LSD test.. Total percentage weight loss results (Table 5.2) analysed for each of the ventilated packaging types used show potatoes stored in netting bags lose significantly more weight during storage then potatoes stored in Freshnet bags, cartons without liners, commercial bags or cartons with pink liner. Potatoes stored in cartons with pink liners retained their weight better then any of the other packagings. This was possibly due to the lack of ventilation holes in the packaging and therefore retaining moisture. However, moisture or condensation is reported to encourage pathogen sporulation (Stroud et al., 2003). The retention of moisture within packaging in the trial did not statistically affect the percentage of rots in the various types of packaging (Table 5.2). However, Table 5.2 does show that the well ventilated packaging such as netting and

HAL FINAL REPORT PT02015
49
cartons without lining resulted in 0% and <1% rots on potatoes, respectively, during storage, while other trial packaging types varied between 2% and 5% of potatoes being affected by rots throughout storage. Table 5.2: Percentages of total weight loss and rots present in the various ventilated packagings for Coliban potatoes stored in the various ventilated packagings used when stored at 10°C with 90% RHz. Types of Ventilated Packaging Total percentage (%)
Carton (no
liner)
Carton with liner
no ventilation
Carton (liner +
slits)
Netting Bag
Freshnet Bag
Commercial Bag
Weightlossz 2.19 b 0.37 c 1.79 b 3.36 a 2.18 b 2.32 b Rotsy 0.39 a 4.95 a 2.81 a 0.00 a 2.98 a 3.03 a
z Data are means of 4 replicates, where different superscripts within the row denote significant differences at P<0.05 using a LSD test. y Data are means of 4 replicates, where the same superscript within the row denotes non significant differences at P<0.05 using a LSD test. In summary all potato packagings tested in this research trial did not differ in the resulting potato peel appearance over time in storage. The various types of ventilated packagings including, cartons with or without ventilated lining, netting, plastic bags and a mix of plastic and netting packaging all showed similar appearances after 28 days in storage at 10°C with a 90% RH. The only results that may have some influence on choosing the best packaging for certain needs is probably the total percentage of rots present within the packaging. Even though the results show that there were statistically no significant differences between packaging, the visible incidence of rots in packaging that had no ventilation or only slight ventilation were higher then those potatoes placed in well ventilated packaging like the netting and the cartons without liners. Therefore well-ventilated packaging is recommended. The carton and liner without ventilation retained moisture, which prevented potato weight loss, but resulted in the highest incidence of rots, indicating the available moisture in the packaging did allow for pathogen sporulation. A possible improvement to current plastic packaging (including Freshnet packaging) may be the inclusion of drainage holes on the bottom of current plastic packaging to aid in the prevention of moisture accumulation at the bottom of packaging, which would possibly reduce the incidence of rots.

HAL FINAL REPORT PT02015
50
APPENDIX 1 Fresh Market Potato Packers Survey 1. What is the approximate spilt up of the annual throughput (%) of your packing
shed in the following categories? Mature Skin Semi-mature(White)
Skin Dirty Brushed Washed (Other) ………………………….…
2. What are the most common packaging materials used in these same categories? (ie 20kg hessian, 5kg poly, cartons etc.)
3. Do you cool the potatoes at any time during the time from receipt at the packingshed and dispatch to the market? If so, please describe:
• when is the cooling done,
• which particular lines (if not all) are cooled
• the target temperature for the cooling operation(s)
• how are the potatoes packaged and palletised (including wraps) at the time of cooling
• do you use any rapid cooling techniques ie forced air cooling, hydro-cooling etc.
4. Do you have a third party audited QA system or accreditation for the packingshed?
5. Do you have any routine quality control and evaluation checks that are applied to the potatoes arriving at the packingshed. If so, please explain briefly.
6. Please complete the following table in relation to the main market destinations (ie wholesale market, distribution centre, direct to retail etc) and the mode of transport used to get the potatoes to that destination (ie refrigerated van, open truck etc).
Mature Skin Semi-mature(White) Skin
Dirty Brushed Washed (Other) ………………………….…

HAL FINAL REPORT PT02015
51
7. Are any of the potatoes you pack handled under controlled temperature conditions between dispatch from the packingshed and receipt at the retail outlet?
8. From whom do you get feedback on the quality of your potatoes in the marketplace?
9. What are the most regular complaints reported to you by your clients about the quality fresh market potatoes provided by your company and from other suppliers?
10. Have you experienced wastage or rejection problems in the past? If so, what was the problem and how did you resolve it?
11. From past experience can you link any high incidence of wastage, rejections or quality complaints with any pre or post harvest production or handling factors?
12. What component of the fresh market potato packing and handling operations for which you are responsible is most likely to create worrying quality issues at the time of retail sale?
13. What handling operation beyond the packingshed is having the most detrimental impact on tuber quality and consumer acceptance?
14. How are current, fresh market potato packaging practices impacting on the quality of tubers presented to consumers in retail outlets?
15. What is the most difficult post harvest (packingshed recieval to market sale) handling issue to cope with or deal with?
16. What is needed to more consistently deliver better quality fresh market potatoes to consumers?
17. What supply chain handling issue or problem would be the most important to tackle in a technical R&D program?
18. Horticulture Australia has requested that as part of this survey we assess the economic impacts of poor quality fresh market potatoes on the industry. How much impact do you believe the quality of fresh market potatoes is having on your returns and consequently the industry?
17 August 2005
Main Markets Transport to Market Dirty Brushed Washed (Other) ………………………….…
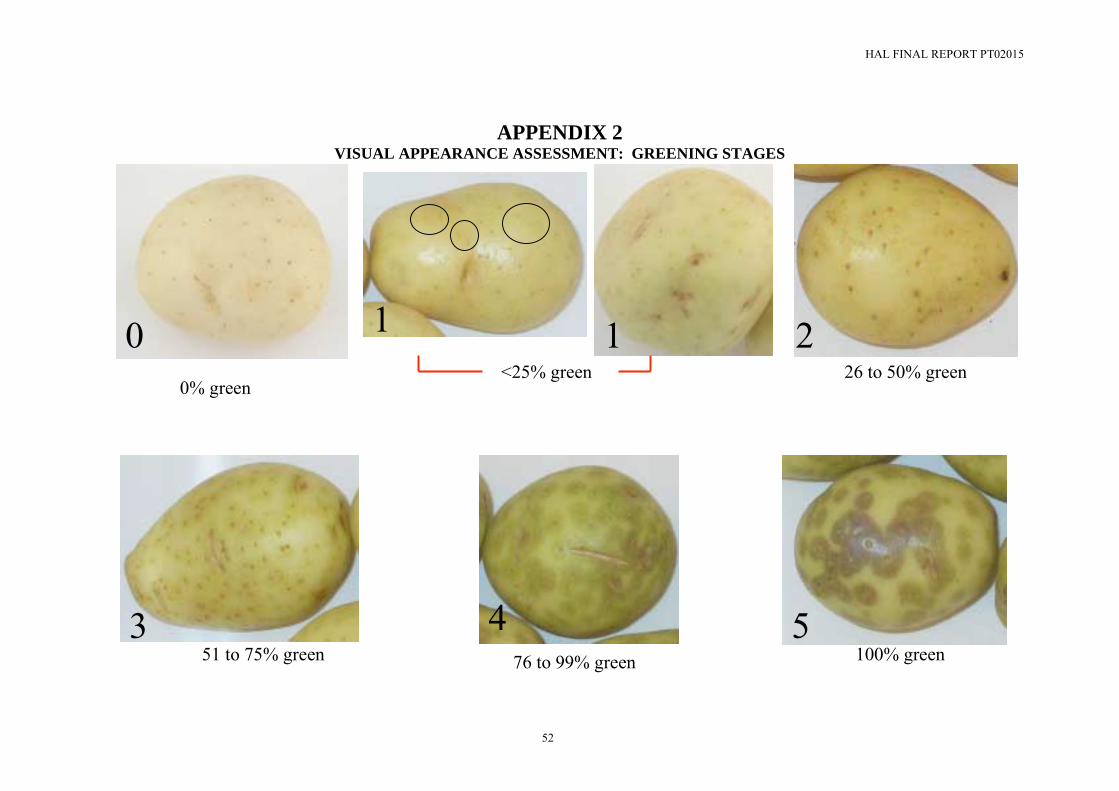
HAL FINAL REPORT PT02015
52
APPENDIX 2 VISUAL APPEARANCE ASSESSMENT: GREENING STAGES
0% green <25% green 26 to 50% green
51 to 75% green 100% green 76 to 99% green
0
543
1 1 2

HAL FINAL REPORT PT02015
53
APPENDIX 3 VISUAL APPEARANCE ASSESSMENT: PEEL BRIGHTNESS STAGES
Fresh white with surface sheen
Fresh white with slight surface sheen
No surface sheen
Slightly dull surface Strong darkening Dull appearance + browning
0 2 1
5 4 3

HAL FINAL REPORT PT02015
54
APPENDIX 4 VISUAL APPEARANCE ASSESSMENT: LENTICEL DISCOLOURATION STAGES
Yellow large rings around lenticels
White, glossy peel appearance Yellow tinge around lenticels Yellow clear rings around lenticels
Yellowing around and between lenticels
Dark rings and craters around lenticels
0
543
21

HAL FINAL REPORT PT02015
55
RECOMMENDATIONS Survey findings and temperature monitored trials recommend the following supply chain handling procedures for domestic fresh, white, washed potato supply to retail outlets: Supply Chain Handling Checklist Grower /Harvester
• Harvest at the coolest time of the day, i.e. early morning or late afternoon (sunset).
• Optimum Harvest Soil Temperature: Between +12°C and +18°C (Check the Fresh Potato and Postharvest Temperature Guide, p.16).
• Place harvested bins in a cool area preferably undercover until they can be moved to cold storage.
• Remove field heat as quickly as possible by placing bins into cold storage set between 7ºC to 10ºC, lower temperatures may increase shatter bruising during packaging and handling.
• Note: Hydro-cooling potatoes is a rapid method of removing field heat. • Record harvest date, time, product and set temperature.
Packing Shed
• All refrigeration equipment and packing equipment should be technically sound and cleaned regularly.
• Check seals around cold room doors, refrigeration units and drains. • The packing and loading area should be temperature controlled. • Try to reduce mechanical damage by minimising the height of potato drops
and smoothing any sharp edges on conveyors that may damage potato integrity.
• Ensure wash water is not reused or is appropriately sanitised to minimise pathogen infection.
• Dry all potatoes thoroughly before packaging to prevent rots. • Handle washed potatoes carefully as they are highly susceptible to disease
infection, skin changes, bruising and textural degradation if mishandled, stored in light areas or in high temperatures.
• Record packing date, time, product and set temperatures. • Store potatoes in cold store at either 5ºC to 6ºC (fresh market potatoes) or 7ºC
to 10ºC (processed markets). • Make sure to notify the transport operator of exact product load, its location
and also specify instructions such as required transit temperatures and preferred delivery times.
• Notify wholesaler/supermarket distribution centre or retailer/processor of approximate delivery time.
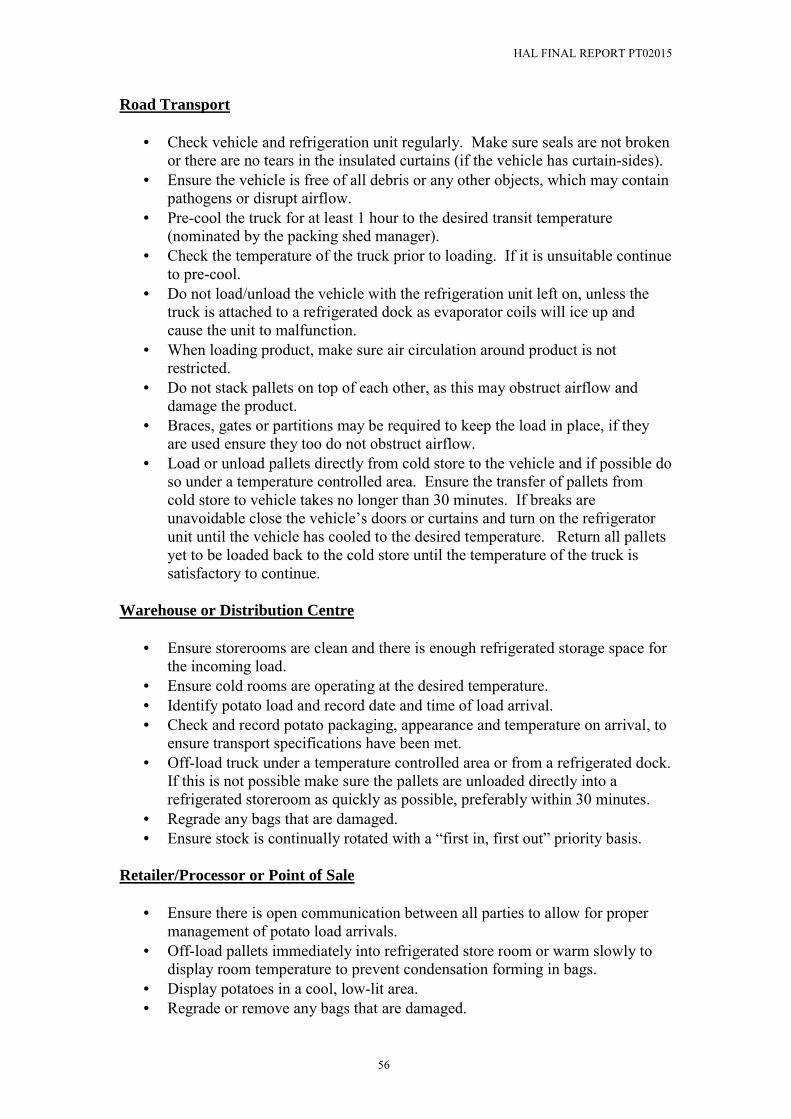
HAL FINAL REPORT PT02015
56
Road Transport
• Check vehicle and refrigeration unit regularly. Make sure seals are not broken or there are no tears in the insulated curtains (if the vehicle has curtain-sides).
• Ensure the vehicle is free of all debris or any other objects, which may contain pathogens or disrupt airflow.
• Pre-cool the truck for at least 1 hour to the desired transit temperature (nominated by the packing shed manager).
• Check the temperature of the truck prior to loading. If it is unsuitable continue to pre-cool.
• Do not load/unload the vehicle with the refrigeration unit left on, unless the truck is attached to a refrigerated dock as evaporator coils will ice up and cause the unit to malfunction.
• When loading product, make sure air circulation around product is not restricted.
• Do not stack pallets on top of each other, as this may obstruct airflow and damage the product.
• Braces, gates or partitions may be required to keep the load in place, if they are used ensure they too do not obstruct airflow.
• Load or unload pallets directly from cold store to the vehicle and if possible do so under a temperature controlled area. Ensure the transfer of pallets from cold store to vehicle takes no longer than 30 minutes. If breaks are unavoidable close the vehicle�s doors or curtains and turn on the refrigerator unit until the vehicle has cooled to the desired temperature. Return all pallets yet to be loaded back to the cold store until the temperature of the truck is satisfactory to continue.
Warehouse or Distribution Centre
• Ensure storerooms are clean and there is enough refrigerated storage space for the incoming load.
• Ensure cold rooms are operating at the desired temperature. • Identify potato load and record date and time of load arrival. • Check and record potato packaging, appearance and temperature on arrival, to
ensure transport specifications have been met. • Off-load truck under a temperature controlled area or from a refrigerated dock.
If this is not possible make sure the pallets are unloaded directly into a refrigerated storeroom as quickly as possible, preferably within 30 minutes.
• Regrade any bags that are damaged. • Ensure stock is continually rotated with a �first in, first out� priority basis.
Retailer/Processor or Point of Sale
• Ensure there is open communication between all parties to allow for proper management of potato load arrivals.
• Off-load pallets immediately into refrigerated store room or warm slowly to display room temperature to prevent condensation forming in bags.
• Display potatoes in a cool, low-lit area. • Regrade or remove any bags that are damaged.
HAL FINAL REPORT PT02015
57
• For loose potato displays: Display area should encourage rotation of stock. Check potatoes regularly to ensure the display is topped up and remove any bruised, rotten, discoloured, cut or misshapen tubers.
• For Pre-packed displays: Rotate stock regularly and make sure labels are facing upwards to minimise potato surfaces from light.
• Cover potatoes in display areas overnight and ensure they remain in a cool environment.
Note: Even though potatoes are hardier then some other vegetables they will still bruise and mark easily if improper handling occurs. The visible signs of mishandling may not be immediate, but will appear later on in the supply chain which is likely to have an effect on repeat buying. It is important to remember the supply and handling chain does not end at the supermarket, but ends when the potato is consumed. This is why consumers need to be educated about handling and storage of potatoes at home. The education should start at the retailer and filter through to consumers; promoting consistent storage temperatures of 4°C or 10°C depending on the consistency of the supply chain and the supply of product with minimal light exposure to reduce greening. Further recommendations for fresh, white, washed potatoes from this research include: Storage Temperatures
• Long-term storage of fresh potatoes should be held at 4°C. • If the storage temperature is likely to fluctuate during the supply chain fresh
potatoes should be held at 10°C, to reduce the incidence of moisture formation in packaging and therefore minimise rot development.
• Storage at 20°C was adequate for ≤ 7 days, but shelf life and appearance thereafter is unacceptable and should be avoided to ensure consumer satisfaction.
Packaging
• Opaque bags will eliminate greening of potatoes on display in retail stores. • Slightly transparent (<100 lux) green bags significantly reduced greening
compared to red, blue, yellow and pink coloured packaging. • Research on glycoalkaloid production in potatoes stored in green packaging
should occur to establish whether toxin production is reduced. • Additional ventilation in current potato packaging is recommended to reduce
moisture build-up and therefore minimise the incidence of rot formation on potatoes.
HAL FINAL REPORT PT02015
58
TECHNOLOGY TRANSFER Potato Australia Articles Leo, N. (2005). Storing and Packaging Premium Fresh White Washed Potatoes. Potato Australia. Australian Potato Industry Council, Victoria. 16: (in press). Leo, N. (2004). Supply Handling Systems for Premium Potatoes. Potato Australia. Australian Potato Industry Council, Victoria. 15:44. Porter, K. (2003). Supply Chain Handling Systems for Premium Potatoes. Potato Australia. Australian Potato Industry Council, Victoria. 14:51. Australian Potato Industry Reports/Updates Dahlenburg, A., Rettke, M. and Leo, N. (2005). Supply Handling of Premium Fresh White Washed Potatoes. Report prepared for the Australian Potato Industry by the South Australian Research and Development Institute, Adelaide. SARDI Postharvest Horticulture report No. R/1/2005 (pp.16). Leo, N., Rettke, M and Dahlenburg, A. (2005). Supply and Storage Temperature of Premium Fresh White Washed Potatoes in Australia. Flyer distributed to the Australian Potato Industry by the South Australian Research and Development Institute, Adelaide. SARDI Postharvest Horticulture report No. R/2/2005 Porter, K. (2003). Summary of responses to Fresh Market Potato Packers Survey. Report distributed to Australian Packing Sheds involved in the �Fresh Market Potato Packers Survey� by the South Australian Research and Development Institute, Adelaide, Adelaide. SARDI Postharvest Horticulture report No. R/1/2003 (pp.6).

HAL FINAL REPORT PT02015
59
ACKNOWLEDGEMENTS We wish to thank the Australian packing sheds involved in this project especially those in South Australia that provided potatoes and allowed access to their packaging and handling areas when required. In particular, SARDI would like to acknowledge the constant support of Comit Farm Produce, Gawler River Produce and Zerella Holdings. The participating Australian packaging companies including Pope Packaging, Poly Products and AEP Industries Pty Ltd, who kindly supplied the potato packaging trialled throughout the project also aided this project. A special thank you is expressed to Dr Barbara Morgan and the SARDI Horticulture Postharvest and Pathology Departments for their help throughout the project. Thanks also to Drake Foodmarkets and Woolworths for assisting SARDI with essential retail information. Finally, this project would not have been possible without the funding and support from Horticulture Australia and AusVeg (Australian Vegetable & Potato Growers Federation formerly the Australian Potato Industry Council).

HAL FINAL REPORT PT02015
60
REFERENCES deMan, J. M. (1990). Color. Principles of Food Chemistry. New York, Van Nostrand Reinhold Second Edition: 203-241. Guenthner, J. (Unknown). Fresh potato handling and storage guidelines. University of Idaho, online access 29th October 2003 at www.uspotatoes.com/downloads/PDF/Handling.pdf Henderson, A. (2001). Retail handling of fresh potatoes. Department of Primary Industries. Knoxfield, Victoria, online access 14/6/05 2005 at www.dpi.vic.gov.au/dpi/nreninf.nsf/ Jobling, J. (2000a). Potatoes: Handle with care. Good Fruit and Vegetables. 11: 34-35. Jobling, J. (2000b). Temperature management is essential for maintaining produce quality. Good Fruit and Vegetables. 10: 30-31. MacEvoy, B. (2004). Colormaking attributes. online access 29th April 2005 at http://www.handprint.com/HP/WCL/color2.html Pavlista, A. D. (unknown). Greening - Green Potatoes: The Problem. University of Nebraska, online access 9th May 2001 at http://www.panhandle.unl.edu/potato/Physiological_Disorders/.../greening_problems.html Petermann, J. B. and Morris, S. C. (1985). The spectral responses of chlorophyll and glycoalkaloid synthesis in potato tubers (Solanum tuberosum). Plant Science. 39: 105-110. Pritchard, M. K. (1993). Relationships of sugars to colour of processed potatoes. Manitoba Agriculture, University of Manitoba, online access 6th January 2005 at www.umanitoba.ca/faculties/afs/plant_science/extension/potatoessugars.pdf Schirra, M., D'hallewin, G., Inglese, P. and La Mantia, T. (1999). Epitcuticular changes and storage potential of cactus pear [Opuntia ficus-indica Miller (L)] fruit following gibberellic acid preharvest sprays and postharvest heat treatment. Postharvest Biology and Technology. 17: 79-88.
HAL FINAL REPORT PT02015
61
Shetty, K., Casada, M., Zhu, H., Thornton, M. and Nolte, P. (1998). Fresh-pack potatoes: handling, Packaging, and transportation in refrigerated Railcars. Idaho Agricultural Experiment Station, online access 25th August 2003 at info.ag.uidaho.edu/Resources/PDFs/BUL0804.pdf Smith, O. (1977). Potatoes: Production, Storing, Processing. Westport, The AVI Publishing Company, Inc. Storey, R. M. J. and Davies, H. V. (1992). Tuber Quality. The Potato Crop. P. M. Harris. London, Chapman & Hall Second: 507-569. Stroud, G., Peters, J. and Cunnington, A. (2003). Effects of condensation on development of storage diseases. British Potato Council, online access 23rd March 2005 at www.potato.org.uk Sully, R. (2001). Market driven research and development for the new millenium. online access 14/6/2005 2005 at www.sardi.sa.gov.au/pages/horticulture/pathology/hort_pn_market.htm Virgin, H. I. (1993). Effectiveness of light of different wavelengths to induce chlorophyll biosynthesis in rapidly and slowly greening tissues. Physiologia Plantarum. 89: 761-766. Virgin, H. I. and Sundqvist, C. (1992). Pigment formation in potato tubers (Solanum tuberosum) exposed to light followed by darkness. Physiologia Plantarum. 86: 587-592.