supply chain management of groundnut production …
TRANSCRIPT

SUPPLY CHAIN MANAGEMENT OF GROUNDNUT
PRODUCTION IN MAGWAY TOWNSHIP
HTET HTET HTUN
OCTOBER 2013
SUPPLY CHAIN MANAGEMENT OF GROUNDNUT
PRODUCTION IN MAGWAY TOWNSHIP
HTET HTET HTUN
A Thesis Submitted to the Post-Graduate Committee of the
Yezin Agricultural University in Partial Fulfillment of the
Requirements for the Degree of Master of Agricultural Science
(Agricultural Economics)
Department of Agricultural Economics
Yezin Agricultural University
OCTOBER 2013

ii
The thesis attached here to, entitled “Supply Chain Management of Groundnut
Production in Magway Township” was prepared and submitted by Htet Htet Htun
under the direction of the chairperson of the candidate supervisory committee and has
been approved by all members of that committee and the board of examiners as a partial
fulfillment of the requirements for the degree of Master of Agricultural Science
(Agricultural Economics).
----------------------------------
Dr. Hnin Yu Lwin
Chairperson
Supervisory Committee
Assistant Lecturer
Department of Agricultural
Economics
Yezin Agricultural University
Yezin, Nay Pyi Taw
------------------------------
Dr. Khin Oo
External Examiner
Supervisory Committee
Professor & Principal (Retd.)
Rice Crop Specialization
Agricultural University (Hmawbe)
------------------------------
Daw Thida Than
Member
Supervisory Committee
Assistant Lecturer
Department of Agricultural
Economics
Yezin Agricultural University
Yezin, Nay Pyi Taw
------------------------------
Dr. Nyein Nyein Htwe
Member
Supervisory Committee
Lecturer
Department of Agronomy
Yezin Agricultural University
Yezin, Nay Pyi Taw
------------------------------
Dr. Cho Cho San
Professor and Head
Department of Agricultural Economics
Yezin Agricultural University
Yezin, Nay Pyi Taw
iii
This thesis was submitted to the Rector of Yezin Agricultural University and was
accepted as a partial fulfillment of the requirements for the degree of Master of
Agricultural Science (Agricultural Economics).
Date -------------------- ------------------------------
Dr. Tin Htut
Rector
Yezin Agricultural University
Nay Pyi Taw

iv
DECLARATION OF ORIGINALITY
This thesis represents the original work of the author, except where otherwise
stated. It has not been submitted previously for a degree at any other University.
Date --------------- ------------------------------
Htet Htet Htun

v
DEDICATED TO MY BELOVED PARENTS,
U KHIN MG LAY AND DAW KHIN HLA MYINT

vi
ACKNOWLEDGEMENT
I would like to express my deep and sincere gratitude to Dr. Tin Htut (Rector), Dr.
Myo Kywe, (Pro-Rector, Academic) and Dr. Maung Maung Myint, (Pro-Rector,
Administration), Yezin Agricultural University, for their kind permission, administrative
support to do my research work, and valuable suggestions to improve this dissertation.
I wish to express my serious gratitude to Dr. Cho Cho San (Professor and Head),
and Dr. Theingi Myint, Associate Professor, Department of Agricultural Economics,
Yezin Agricultural University for their invaluable advice and kind help to be able to
complete my research work.
My sincere thanks also extend to Dr. Khin Oo, Professor & Principal (Retd.) for
her kind help, cooperation and valuable suggestions for this manuscript.
I would like to express my deepest appreciation and gratitude to my supervisor Dr.
Hnin Yu Lwin, Assistant Lecturer, Department of Agricultural Economics, Yezin
Agricultural University, for her keen interest, guidance, invaluable advices, generous
helps, motherly concern, encouragements, moral support, valuable supervisions and
understanding to me throughout my study.
Sincere appreciation and gratitude go to supervisory committee members, Dr.
Nyein Nyein Htwe, Lecturer, Department of Agronomy and Daw Thida Than, Assistant
Lecturer, Department of Agricultural Economics for their guidance to my difficulty,
encouragement, and kindness during the study, and their critical and patient reading, and
comments on this manuscript.
I would like to express my graduate to all teaching staff from the Department of
Agricultural Economics for their advice needed to apply in statistical analysis,
suggestions and generous help throughout my study period.
My special thanks to Daw Win Win Thein, Lecturer, Department of English,
University of Forestry, for her valuable correction in English writing for the whole thesis.
My special thanks also go to sample farmers and intermediaries at Magway
Township for patiently answering my survey questionnaires. I am grateful to all of the
staff from Department of Agriculture, Magway Township for their help in obtaining the
necessary primary and secondary data for this thesis. My special thanks are also extended
to Daw Kyi Pyar Zin and Daw Nwe Nwe Htun, Department of Agriculture, Township
Office, Magway Township. I am really appreciated to Township manager and village
leaders for their kind help in data collection during the field survey.

vii
I would like to describe my gratitude to all senior and junior master students from
the Department of Agricultural Economics for their help in seminar and whatever I need.
I would like to extend my heartfelt thanks to my beloved brothers and my lovely
sister, Mg Zar Ni Htet, Mg Aung Kyaw Htet and Ma Khin Thandar Myint for their never
ending love and encouragement.
Last but not least, my deepest and greatest dedication is to my beloved parents, U
Khin Mg Lay and Daw Khin Hla Myint for their never ending love, deep encouragement,
kind understanding, invaluable moral and financial support throughout my education life
time and whole of my life.
viii
SUPPLY CHAIN MANAGEMENT OF GROUNDNUT PRODUCTION IN
MAGWAY TOWNSHIP
ABSTRACT
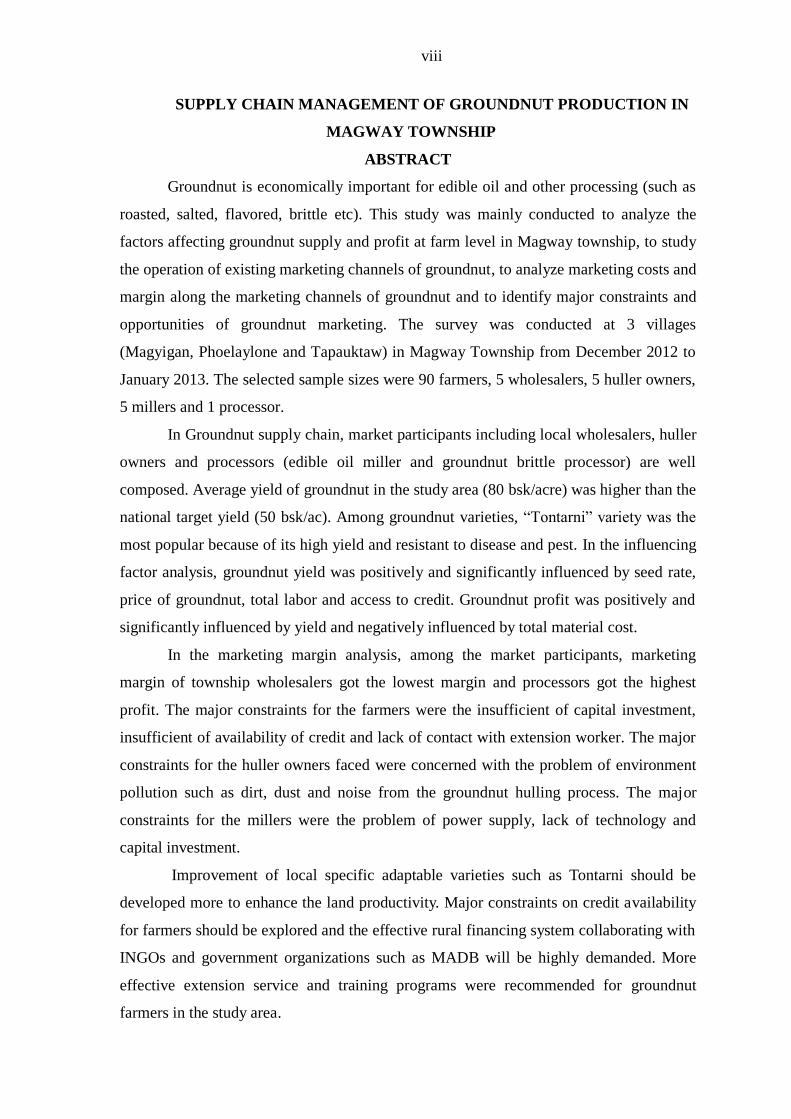
Groundnut is economically important for edible oil and other processing (such as
roasted, salted, flavored, brittle etc). This study was mainly conducted to analyze the
factors affecting groundnut supply and profit at farm level in Magway township, to study
the operation of existing marketing channels of groundnut, to analyze marketing costs and
margin along the marketing channels of groundnut and to identify major constraints and
opportunities of groundnut marketing. The survey was conducted at 3 villages
(Magyigan, Phoelaylone and Tapauktaw) in Magway Township from December 2012 to
January 2013. The selected sample sizes were 90 farmers, 5 wholesalers, 5 huller owners,
5 millers and 1 processor.
In Groundnut supply chain, market participants including local wholesalers, huller
owners and processors (edible oil miller and groundnut brittle processor) are well
composed. Average yield of groundnut in the study area (80 bsk/acre) was higher than the
national target yield (50 bsk/ac). Among groundnut varieties, “Tontarni” variety was the
most popular because of its high yield and resistant to disease and pest. In the influencing
factor analysis, groundnut yield was positively and significantly influenced by seed rate,
price of groundnut, total labor and access to credit. Groundnut profit was positively and
significantly influenced by yield and negatively influenced by total material cost.
In the marketing margin analysis, among the market participants, marketing
margin of township wholesalers got the lowest margin and processors got the highest
profit. The major constraints for the farmers were the insufficient of capital investment,
insufficient of availability of credit and lack of contact with extension worker. The major
constraints for the huller owners faced were concerned with the problem of environment
pollution such as dirt, dust and noise from the groundnut hulling process. The major
constraints for the millers were the problem of power supply, lack of technology and
capital investment.
Improvement of local specific adaptable varieties such as Tontarni should be
developed more to enhance the land productivity. Major constraints on credit availability
for farmers should be explored and the effective rural financing system collaborating with
INGOs and government organizations such as MADB will be highly demanded. More
effective extension service and training programs were recommended for groundnut
farmers in the study area.
ix
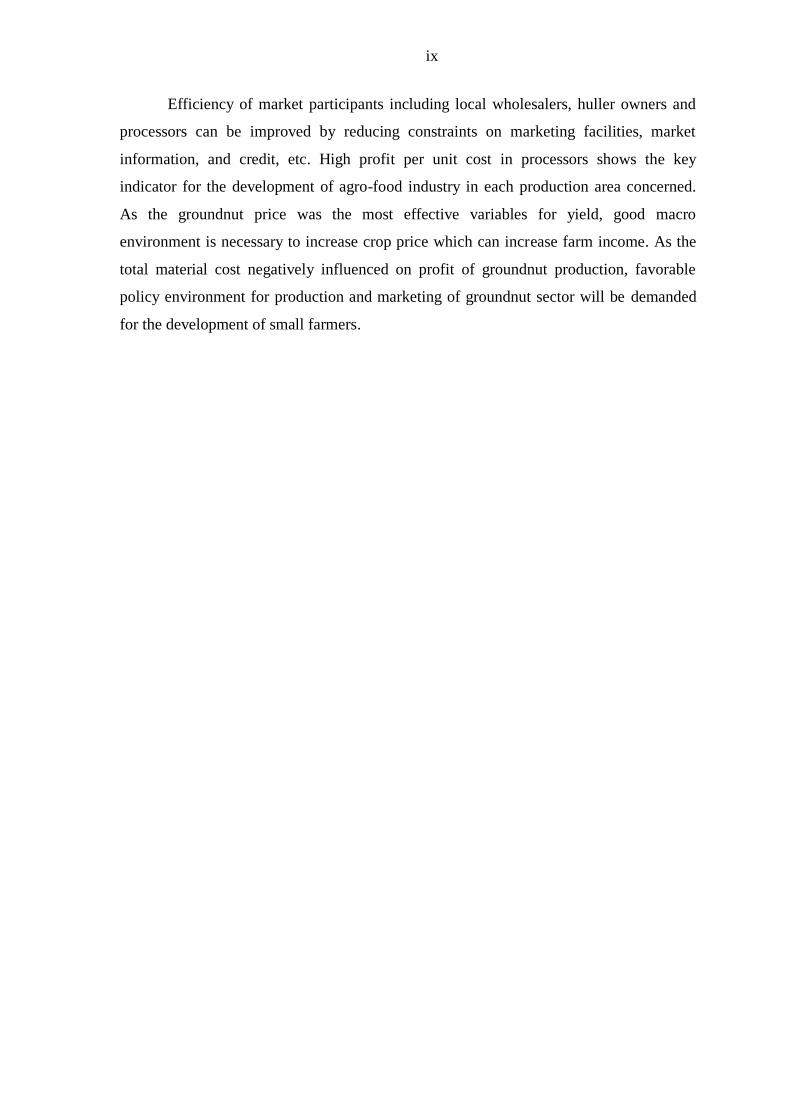
Efficiency of market participants including local wholesalers, huller owners and
processors can be improved by reducing constraints on marketing facilities, market
information, and credit, etc. High profit per unit cost in processors shows the key
indicator for the development of agro-food industry in each production area concerned. As the groundnut price was the most effective variables for yield, good macro
environment is necessary to increase crop price which can increase farm income. As the
total material cost negatively influenced on profit of groundnut production, favorable
policy environment for production and marketing of groundnut sector will be demanded
for the development of small farmers.

x
TABLE OF CONTENTS
PAGE
ACKNOWLEDGEMENT………………………………………………………... vi
ABSTRACT……………………………………………………………………… viii
TABLE OF CONTENTS………………………………………………………… x
LIST OF TABLES………………………………………………………………... xiii
LIST OF FIGURES………………………………………………………………. xv
LIST OF APPENDICES…………………………………………………………. xvi
LIST OF ABBREVIATIONS……………………………………………………. xvii
LIST OF CONVERSION FACTORS……………………………………………. xvii
CHAPTER I………………………………………………………………………. 1
INTRODUCTION………………………………………………………………... 1
1.1 Background…………………………………………………………………… 1
1.2 The Role of Oilseed Crop in Myanmar………………………………………. 2
1.3 The Role of Groundnut in Myanmar…………………………………………. 3
1.4 Production Trend of Groundnut in Myanmar……………………………….... 3
1.5 Processing of Groundnut……………………………………………………... 4
1.6 Rationale of the Study………………………………………………………... 5
1.7 Objectives…………………………………………………………………...... 7
1.8 Hypotheses…………………………………………………………………… 7
CHAPTER II……………………………………………………………………... 8
LITERATURE REVIEW………………………………………………………… 8
2.1 The Concept of Supply Chain and Marketing………………………………... 8
2.1.1 The concept of supply chain…………………………………………... 8
2.2 The Definition of Marketing………………………………………………….. 9
2.2.1 Approaches to the study of marketing………………………………… 10
2.3 Factors that Affect Productivity………………………………………………. 11
2.4 Factors that Affect Profitability………………………………………………. 13
2.5 The Marketing Channel/Chain and Marketing Margin………………………. 14
2.6 Review of the Studies on Marketing Channel and Marketing Cost………….. 15
2.7 Major Constraints and Opportunities for Marketing…………………………. 18
2.8 Oilseed Crops Marketing Channel in Myanmar……………………………… 20
CHAPTER III…………………………………………………………………….. 22
RESEARCH METHODOLOGY………………………………………………… 22
3.1 Study Area……………………………………………………………………. 22
3.1.1 Description of the study area………………………………………….. 22
3.1.2 Climate………………………………………………………………… 22
3.1.3 Sown area and crops production in the study area…………………….. 24
3.1.4 General information of surveyed villages……………………………... 27
3.2 Data Collection and Sampling Method……………………………………… 27
3.2.1 Primary data collection………………………………………………... 27
3.2.2 Secondary data collection……………………………………………... 28
Data Analysis Methods…………………………………………………………… 28
3.3.1 Cost and return analysis…………………………………………………….. 31
3.3.2 Method of marketing cost and marketing margin analysis…………………. 33
3.3.2.1 Marketing channel…………………………………………………… 33
3.3.2.2 Marketing margin…………………………………………………… 33
3.4 The Determinants Factors on Groundnut Yield of the Selected Farm
Households……………………………………………………………………
35
xi
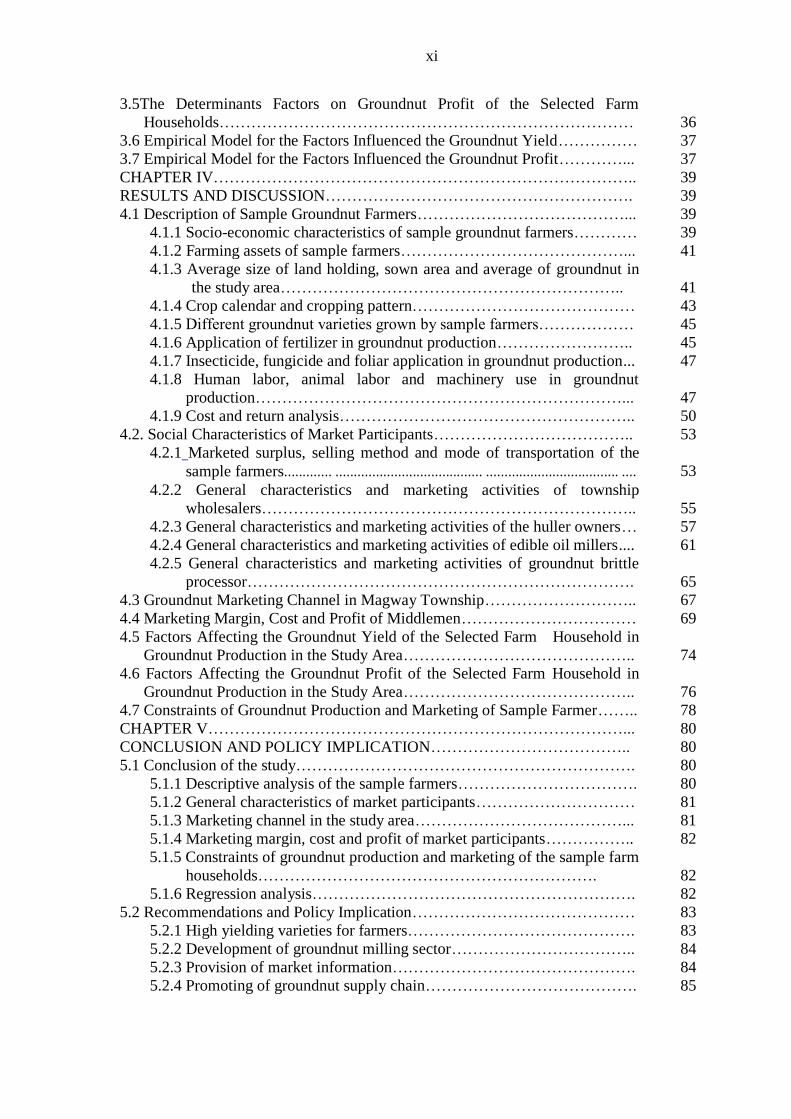
3.5The Determinants Factors on Groundnut Profit of the Selected Farm
Households……………………………………………………………………
36
3.6 Empirical Model for the Factors Influenced the Groundnut Yield…………… 37
3.7 Empirical Model for the Factors Influenced the Groundnut Profit…………... 37
CHAPTER IV…………………………………………………………………….. 39
RESULTS AND DISCUSSION…………………………………………………. 39
4.1 Description of Sample Groundnut Farmers…………………………………... 39
4.1.1 Socio-economic characteristics of sample groundnut farmers………… 39
4.1.2 Farming assets of sample farmers……………………………………... 41
4.1.3 Average size of land holding, sown area and average of groundnut in
the study area………………………………………………………..
41
4.1.4 Crop calendar and cropping pattern…………………………………… 43
4.1.5 Different groundnut varieties grown by sample farmers……………… 45
4.1.6 Application of fertilizer in groundnut production…………………….. 45
4.1.7 Insecticide, fungicide and foliar application in groundnut production... 47
4.1.8 Human labor, animal labor and machinery use in groundnut
production……………………………………………………………...
47
4.1.9 Cost and return analysis……………………………………………….. 50
4.2. Social Characteristics of Market Participants……………………………….. 53
4.2.1 Marketed surplus, selling method and mode of transportation of the
sample farmers............. ........................................ .................................... ....
53
4.2.2 General characteristics and marketing activities of township
wholesalers……………………………………………………………..
55
4.2.3 General characteristics and marketing activities of the huller owners… 57
4.2.4 General characteristics and marketing activities of edible oil millers.... 61
4.2.5 General characteristics and marketing activities of groundnut brittle
processor……………………………………………………………….
65
4.3 Groundnut Marketing Channel in Magway Township……………………….. 67
4.4 Marketing Margin, Cost and Profit of Middlemen…………………………… 69
4.5 Factors Affecting the Groundnut Yield of the Selected Farm Household in
Groundnut Production in the Study Area……………………………………..
74
4.6 Factors Affecting the Groundnut Profit of the Selected Farm Household in
Groundnut Production in the Study Area……………………………………..
76
4.7 Constraints of Groundnut Production and Marketing of Sample Farmer…….. 78
CHAPTER V……………………………………………………………………... 80
CONCLUSION AND POLICY IMPLICATION……………………………….. 80
5.1 Conclusion of the study………………………………………………………. 80
5.1.1 Descriptive analysis of the sample farmers……………………………. 80
5.1.2 General characteristics of market participants………………………… 81
5.1.3 Marketing channel in the study area…………………………………... 81
5.1.4 Marketing margin, cost and profit of market participants…………….. 82
5.1.5 Constraints of groundnut production and marketing of the sample farm
households……………………………………………………….
82
5.1.6 Regression analysis……………………………………………………. 82
5.2 Recommendations and Policy Implication…………………………………… 83
5.2.1 High yielding varieties for farmers……………………………………. 83
5.2.2 Development of groundnut milling sector…………………………….. 84
5.2.3 Provision of market information………………………………………. 84
5.2.4 Promoting of groundnut supply chain…………………………………. 85

xii
REFERENCES 86
APPENDICES 91

xiii
LIST OF TABLES PAGE
Table 3.1 Land utilization in Magway Township (2011-2012)…………………... 25
Table 3.2 Rain-fed groundnut sown area, harvested area, yield and production in
Magway Township from 2008-2009 to 2012-2013……………………
26
Table 3.3 Winter groundnut sown area, harvested area, yield and production in
Magway Township from 2008-2009 to 2012- 2013…………………...
26
Table 3.4 General information of surveyed villages in Magway Township……... 29
Table 3.5 Number of respondents in the study area……………………………… 30
Table 3.6 Estimating return to factors of production …………………………… 32
Table 3.7 Expected sign of the independent variables in groundnut yield………. 38
Table 3.8 Expected sign of the independent variables in groundnut profit……… 38
Table 4.1 Socio-economic characteristics of groundnut sample farmers in study
area……………………………………………………………………..
40
Table 4.2 Farm assets of the sample farmers in the study area…………………... 42
Table 4.3 Average size of land holding, sown area and average yield of
groundnut in study area………………………………………………..
42
Table 4.4 Crop calendar grown different crops in the study area………………… 44
Table 4.5 Percent of sample farmers for each cropping pattern in the study area... 44
Table 4.6 Different groundnut varieties grown by the sample farmers…………... 46
Table 4.7 Use of fertilizer in groundnut production 46
Table 4.8 Use of Insecticide, fungicide and foliar application in groundnut
production…………………………………………………………
49
Table 4.9 Enterprise budget for groundnut production…………………………. 51
Table 4.10 Groundnut production, consumption and marketed surplus per
sample household……………………………………………………
54
Table 4.11 Selling method and mode of transportation of sample farmers……… 54
Table 4.12 Age, experience and education level of wholesalers…………………. 56
Table 4.13 Selling market of wholesalers in Magway (%)………………………. 56
Table 4.14 Marketing activities of wholesalers…………………………………... 56
Table 4.15 Age, market experience and education level of huller……………….. 59
Table 4.16 Selling markets of Lone San in Magway (%)………………………… 59
Table 4.17 Milling capacity of sample groundnut – hulls………………………... 59
Table 4.18 Marketing Activities of hullers……………………………………….. 60
Table 4.19 Age, experience and education levels of millers……………………... 63
Table 4.20 Selling markets of millers in Magway (%)…………………………… 63
Table 4.21 Milling capacity of sample groundnut – mills……………………….. 63
Table 4.22 Marketing activities of millers………………………………………... 64
Table 4.23 Age, experience and education level of manager…………………….. 66
Table 4.24 Selling markets of processor in Magway Township…………………. 66
Table 4.25 Processing capacity and marketing activities of groundnut processor.. 66
Table 4.26 Cost and profit of groundnut farmers………………………………… 71
Table 4.27 Marketing margin, cost and profit of groundnut wholesalers………... 71
Table 4.28 Marketing margin, cost and profit of huller owners…………………. 72
Table 4.29 Marketing margin, cost and profit of groundnut millers…………….. 72
Table 4.30 Marketing margin, cost and profit of groundnut brittle processor…… 73

xiv
Table 4.31 Mean values of dependent and independent variables of groundnut
yield function…………………………………………………………..
75
Table 4.32 Determinants of groundnut yield of the sample farm households…….. 75
Table 4.33 Mean values of dependent and independent variables of groundnut
profit function………………………………………………………….
7
77
Table 4.34 Determinants of groundnut profit of the sample farm household……... 77
Table 4.35 Constraints of groundnut production and marketing in the study area... 79

xv
List of Figures Pages
Figure 2.1 General pattern of marketing oilseed crops…………………………… 21
Figure 3.1 Precipitations (mm) of Magway Township in 2012…………………... 23
Figure 3.2 Temperature (˚C) in Magway Township in 2012……………………... 23
Figure 3.3 Diagram of study areas and sampled farmers…………………………. 30
Figure 4.1 Education levels of sample farmers in the study area…………………. 40
Figure 4.2 Groundnut marketing channel in Magway Township………………… 68

xvi
List of Appendices Pages
Appendix 1 Map of Magway Township…………………………………………... 91
Appendix 2 Gross domestic product compositions by sector, 2009-2010………… 92
Appendix 3 Areas sown and cropping intensity of Myanmar…………………….. 92
Appendix 4 Percentage share of the total sown area for the major crops in
Myanmar…………………………………………………………….
93
Appendix 5 Percentage share of the oil seed crop area cultivated in 2011-2012…. 93
Appendix 6 Oilseed crop cultivation in Myanmar………………………………… 94
Appendix 7 Groundnut production in Myanmar and neighboring countries (2009) 95
Appendix 8 Sown area and production of groundnut…………………………….. 96
Appendix 9 Percentage share of sown area for groundnut (rain) by state and
region in 2010-11…………………………………………………...
96
Appendix 10 Percentage share of sown area for groundnut (winter) by state and
region in 2010-11…………………………………………………..
97
Appendix 11 Comparison of rainy groundnut sown area and winter groundnut
sown area of Magway Township in 2008-2012……………………
97
xvii
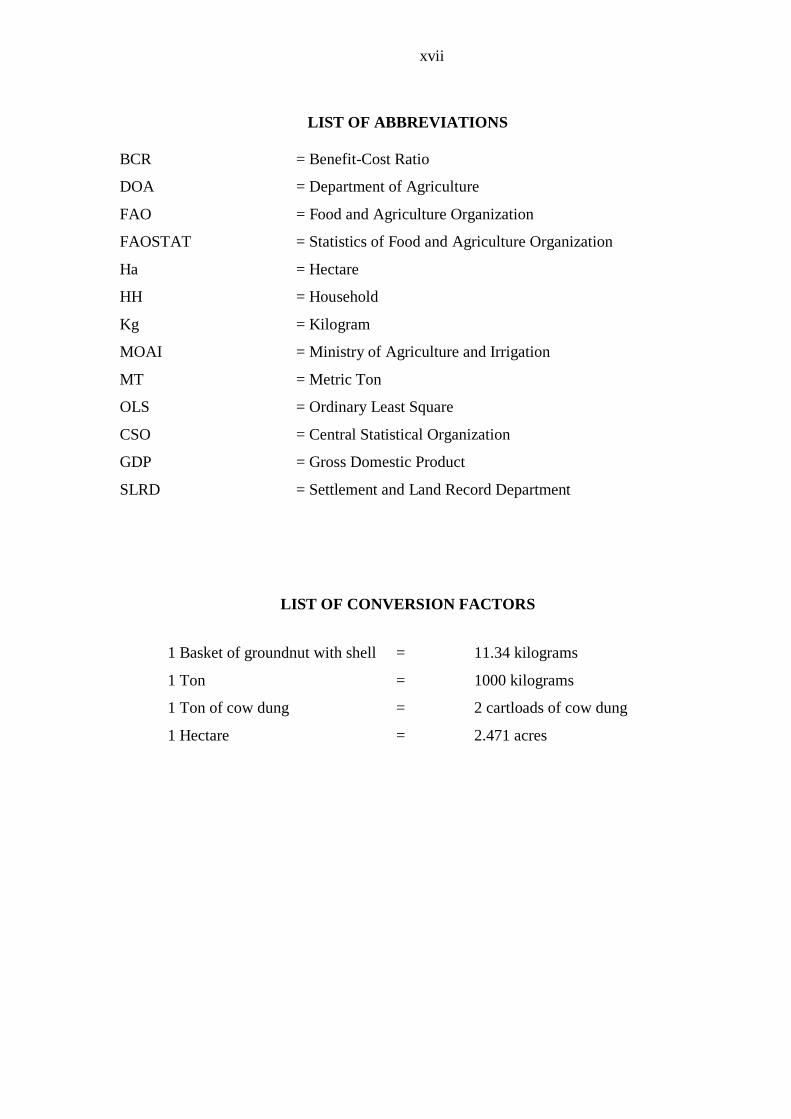
LIST OF ABBREVIATIONS
BCR = Benefit-Cost Ratio
DOA = Department of Agriculture
FAO = Food and Agriculture Organization
FAOSTAT = Statistics of Food and Agriculture Organization
Ha = Hectare
HH = Household
Kg = Kilogram
MOAI = Ministry of Agriculture and Irrigation
MT = Metric Ton
OLS = Ordinary Least Square
CSO = Central Statistical Organization
GDP = Gross Domestic Product
SLRD = Settlement and Land Record Department
LIST OF CONVERSION FACTORS
1 Basket of groundnut with shell = 11.34 kilograms
1 Ton = 1000 kilograms
1 Ton of cow dung = 2 cartloads of cow dung
1 Hectare = 2.471 acres
CHAPTER I
INTRODUCTION
1.1 Background
Myanmar is an agricultural country, and agriculture sector is the back bone of its
economy. For food production with the growing population, agriculture sector will
continue to be essential for the country as well as to occupy a large share of the export
earnings. Therefore, the agriculture sector needs to expand the production of food.
Agriculture sector contributed 27.5% of GDP (Appendix 2), 17.5% of total export
earnings, and employs 61.2% of the labor force (MOAI 2012). About 70% of the
population works in agriculture and forestry, and rice accounts for about half of the
agricultural output. In Myanmar, more than 60 different crops are grown based on the
prevalence of different agro-ecological zones. The crops are generally classified into
eight groups: cereals, pulses, oilseeds, industrial crops, fruits, vegetables, culinary crops
and other crops. Other important crops are pulses, sesame, groundnuts and sugarcane.
The country‟s cropping intensity had increased from 119.6% in 1988-1989 to 171.4% in
2010-2011 but in 2011-2012, the cropping intensity was decreased 165.6% (SLRD 2012)
(Appendix 3).
Growth in the agricultural sector is necessary to increase food availability and
sustain the economic development process continuously. The main objective of the
Ministry of Agriculture and Irrigation (MOAI) with a view to improve the agriculture
sector is to increase the incomes of the farmers through the increase of crop production.
Sufficiency of edible oil is one of the important goals of the country. To be fulfilling this
goal, it is necessary to increase the production of oilseed crops. The three major edible
oilseeds produced in Myanmar are groundnut, sesame and sunflower.
Until the early 1990, the production of crops was heavily influenced by state
control and regulations. These control dictated which crops could be grown and in many
cases, included compulsory procurement of output for sale at price below market levels.
This system started to change in the 1990s. However, not all market policies have been
liberalized. Although no compulsory purchasing exists for oilseed crops, the oilseed
crops and edible oil sub-sectors are among those for which state controls are still in place.

2
These include outright bans or controls of export and import of oilseed crops, oil meals
and edible oils.
There are essentially two major government policy objectives for the oilseed
crops subsector:
1. Achieve self-sufficiency in edible oil
2. Maintain edible oil price control to avoid fluctuation
These two policies are self-defeating. Through the implementation of these
policies, Myanmar has adopted restrictive measure on import and export of oilseeds and
oilseed products.
1.2 The Role of Oilseed Crop in Myanmar
The percentage shares of the total sown area for the major crops in 2011- 2012 are
shown in Appendix 4. In Myanmar‟s agriculture, cereal crops remain the important crop
group with its area constituted around 39% of the total crop sown area. It is followed by
pulses which is the second most important crop next to cereal. The 15% of the total crop
sown area is covered with oilseeds in Myanmar. Oilseed crops are the third important
crop because of essential food grains with respect to area. Culinary, industrial and other
crops covered 1%, 5% and 20% of the total crop sown area.
In many parts of central Myanmar, oilseeds, particularly sesame and groundnut,
along with pulse crops, play an important part in ensuring food security and providing
cash income for education, health and other social necessities. Oilseed crops also play a
vital role accordingly to Myanmar high consumption of cooking oil compared to other
neighboring countries. Major oilseed crops include groundnut, sesame, sunflower,
mustard and niger. Oilseed crops cultivation is shown in Appendix 6. The percentage
share of oilseed crops area cultivated in 2011-2012 is shown in Appendix 5. Sesame was
the largest sown area nearly about 46% of the total oilseed crops sown area. In addition,
26% of the total oilseed crops sown area was covered with groundnut when sunflower
was 16% and mustard and niger occupied 13%.
Among them, groundnut cultivation increased from 479,000 hectares in 1996-
1997 to 877,000 hectares in 2010-2011.
3
1.3 The Role of Groundnut in Myanmar
In growing oilseed crops, groundnut production has reached its productivity
potential defined by the country itself. In the world, India occupied the highest harvested
area which was 22.84% of the world groundnut harvested area and China occupied
18.36%. Myanmar occupied the third largest groundnut harvested area which accounted
for 3.66%. World‟s groundnut production was 36,457 thousand MT and Asia‟s groundnut
production was 23,351 thousand MT which was 64.05% in world total groundnut
production and yield was 1,966 kilogram per hectare (kg/ha) in 2009. In 2010-2011,
Myanmar occupied the third highest groundnut production (1,392 thousand MT) of Asia
and groundnut yield was 1,587 kilogram per hectare. In terms of groundnut production,
Myanmar occupied 3.81% in the world and 5.96% in Asia. Groundnut production in
Myanmar and neighboring countries is shown in Appendix 7 (MOAI 2012).
Major oilseed exporting countries are Argentina, Australia, Brazil, Canada,
Paraguay, Ukraine and USA. Most of the exporters are western developed countries.
Major oilseed importing countries are China, Egypt, Indonesia, South Korea, Taiwan,
Thailand, EU-27 and Mexico. Much of the imports are made by developing and middle
income countries (Kyaw and Raphy 2009).
1.4 Production Trend of Groundnut in Myanmar
The oilseed crop production increased from 1.6 million MT in 2000 to 8.33
million MT in 2008 mainly through area expansion, but the domestic demand for edible
oil was noted to grow at a faster rate. Among the oilseed crops, the sown area and
production of groundnut from 1995-1996 to 2010-2011 is shown in Appendix 8. The
production of groundnut increased significantly from 1995 to 2011. And, the sown area
of groundnut slightly increased from 1995 to 2011. In 2011-2012, the total sown area of
groundnut is 877,000 hectares and the production of groundnut is 1,392,000 MT.
The oilseed crop production is concentrated in the central dry zone area, which
encompasses the regions of Magway, Mandalay, Sagaing and parts of Bago. The 75% of
the groundnut production comes from Central Myanmar, mainly Sagaing, Mandalay and
Magway in both rainy and winter seasons. Sesame and groundnut are traditional crops

4
within the region and remain dominant, although sunflower and cotton are recently
introduced as a main crop.
Percentage share of sown area for rain-fed groundnut and winter groundnut are
shown in Appendix 9 and 10. In Magway Township, groundnut was grown in the rainy
season and winter. In the sown area for rain-fed groundnut, Magway region was the main
growing area and it occupied 27% of sown area. In the sown area for winter groundnut,
Magway region follows the third in growing winter groundnut areas and it occupied 11%
of the sown area. Sagaing region is the main growing area for winter groundnut and it
achieved 35% of the sown area. In rainy season, the sown area of groundnut increased
from 17.95 thousand hectares in 2008-2009 to 21.18 thousand hectares in 2012-2013. In
winter season, the sown area of groundnut increased from 0.61 thousand hectares in
2008-2009 to 0.85 thousand hectares in 2012-2013. But in 2011-12, the sown area of
winter groundnut decreased 0.81 thousand hectares. In the comparison of rain-fed
groundnut sown area and winter groundnut sown area, the farmer was significantly
higher than the latter. The comparison of rain-fed groundnut sown area and winter
groundnut sown area of Magway Township are shown in Appendix 11 (DOA Magway).
1.5 Processing of Groundnut
The groundnut is used not only as a source of oil but also for direct consumption
which forms an important part of the diet. Groundnut is marketed for two different
purposes: (1) to be consumed as groundnut oil and, (2) to be used as traditional snack.
Groundnuts are mainly sold as edible groundnuts, crushed groundnuts, seeds and for the
animal feed industry. Raw groundnuts are basically used as seed, transformed into
„prepared‟ groundnuts (roasted, salted, flavored, etc.) used in food industries to produce
peanut butter/paste and groundnut intensive goods such as snacks and sweets, or crushed
for oil and groundnut meal. Groundnut butter is one such product consumed in large
quantities especially in western countries since many years.
Food processing constitutes a major economic sector in developing countries,
especially in urban areas where low-income families are not equipped to carry out the
basic processing of agricultural and animal products. Food processing also allows the
consumption of seasonal agricultural products over the whole year. In Myanmar,
5
groundnuts are sold mainly as a groundnut brittle. Brittle is a type of confection
consisting of flat broken pieces of hard sugar embedded with groundnut seed (lone san).
It has many variations around the world. Groundnut brittle widely produced in Magway
Township by the name of Kaung – Mon on the domestic market.
Edible oil processing has an important role in transforming oilseed crops into
edible oil products for consumers. In Myanmar, the private sector plays a major position
in the milling of oilseed crops such as sesame, groundnut and sunflower. Edible oil
processing is a peak activity after harvesting the oilseed crop. The millers collect the
crops and distribute the processed edible oil by using their own investment or sometimes
the loan from private banks. Normally groundnut oil is the most expensive edible oil
while palm oil is the cheapest on the market. However, prices of edible oils in general
fluctuate widely. This is closely related to domestic production level of oilseed crops and
import volume of palm oil (Kyaw and Raphy 2009).
Myanmar is currently a deficit producer of edible oil and oilcake, and significant
quantities of palm oil are imported to partially meet domestic demand. Outright bans on
imports or exports cannot be fully enforced. Informal imports allow the country to meet
domestic demand of oil and oilcake, while informal exports of groundnuts for the snacks
market allowed groundnut prices to be sustained on the domestic market.
1.6 Rationale of the Study
Oilseed crops stand third position in term of sown area in Myanmar. The major
oilseed crops are groundnut, sesame and sunflower. Oilseeds and oilseed products are
economically crucial for livelihood of Myanmar farmers, processors and consumers. The
contribution of those products plays a vital role in Myanmar agricultural sector and
agricultural product markets as well as on international markets. In Myanmar, increase in
oilseed crop production depends totally on area expansion. Self-sufficiency in edible oil
is the second of the three objectives which was laid down by the Ministry of Agriculture
and Irrigation. Policy reforms in the oilseed crops sub-sector should aim at „increasing
national welfare‟ by increasing the profitability of private sector operations along the
chain as opposed to „self sufficiency‟ and „price control‟ policies.

6
Among the oilseed crops, groundnut is the focus of this study. In groundnut
production, most of the farmers are insufficient of capital investment for purchasing
inputs and storage facilities. And they also have credit problem. In growing groundnut,
labor sources and land resources are the strength to increase the productivity.
Improvement of land productivity can enhance the yield and profit. And, Tschering
(2002) observed that influencing factors that were found to be influenced profitability
were the farmer‟s characteristics, input use, labor use, costs, whether the farmers
produced for sale or for home consumption as well as the methods of production.
Therefore, the information concerning about the groundnut supply and pofit are important
consideration for farmers in growing groundnut. Therefore, this study will point out the
factors affecting the groundnut supply and profit at farm level in Magway Township. The
groundnut production might be constraints by many factors such as insufficient extension
service, high inputs cost, high transportation cost and access to credit etc. Therefore, it
will be needed to find out the constraints in groundnut production.
In the groundnut marketing channel, the wholesalers handle the commodity as
crops, the processor handle the commodity as groundnut brittle and the millers handle the
commodity as edible oil. And the hullers handle the commodity as the groundnut seed.
Therefore, the commodity types handled by the middlemen are different. So this study
will be needed to understand how the commodities move through the various channels
and to identify the marketing agents involved. For raising the efficiency of marketing
system, the behavior of market participants, costs and margins of marketing channels are
essential tools. Magway is a leading township with respect to groundnut growing and
processing. Therefore, the descriptive analysis of this study can help to explore the
current situation of groundnut marketing system of the study area.
Finally, this study has to identify market efficiency and marketing channel of
groundnut. The volume of marketing margins generally reflects the marketing efficiency.
More specifically, this study will focus on the factor affecting groundnut supply and
profit at the farm level, different market levels, roles of marketing actors in the marketing
channel and major constraints of groundnut production.

7
1.7 Objectives of the Study
The overall objective of the study is to understand the market performance in
terms of marketing margin and cost of various stakeholders (farmers, millers,
wholesalers, hullers and processor) to investigate the groundnut distribution system in
Magway Township, Magway Region.
1. To analyze the factors affecting groundnut supply and profit at the farm level
2. To study the operation of existing marketing channels of groundnut
3. To analyze marketing costs and margin along the marketing channels of groundnut
4. To identify major constraints of groundnut production and marketing in Magway
Township
1.8 Hypotheses
Based on the objectives, the hypotheses for this study were formulated.
(1) Farmers are profitable from rain-fed groundnut production in the study area.
(2) Efficient oilseed crop and edible oil marketing system together with well-organized
marketing channels can give required quality and enough quantity at reasonable price
to consumers, maximize returns to producers and provide both producers and
consumers satisfaction.
(3) The marketing margin should equal or be very close to the level of marketing cost.
The oilseed crop farmers should gain the largest share of price in current market
situation in Myanmar.
8
CHAPTER II
LITERATURE REVIEW
2.1 The Concept of Supply Chain and Marketing
2.1.1The concept of supply chain
The supply chain refers to all those activities associated with the transformation
and flow of goods and services, including their attendant information flows, from the
sources of raw materials to end users. Management refers to the integration of all these
activities, both internal and external to the firm (Ronald et al 2000).
Agri-food supply chain is divided into two types: a fresh-food product supply
chain, such as those for fresh vegetables and fruits; and a processed-food product supply
chain such as those for canned products. The members of a food supply chain are
farmers, processors, distributors and retailer, while NGOs, governments and shareholders
are stakeholders in the chain (Aramyan 2006).
Chopra, Sunil and Peter (2004) defined a supply chain consists of all parties
involved, directly or indirectly, in fulfilling a customer request. The supply chain not only
includes the manufacturer and suppliers, but also transporters, warehouses, retailers, and
customers themselves. Within each organization, such as manufacturer, the supply chain
includes all functions involved in receiving and filling a customer request. These
functions include, but are not limited to, new product development, marketing,
operations, distribution, finance, and customer serve.
A typical supply chain may involve a variety of stages. These supply chain stages
include:
• Customers
• Retailers
• Wholesalers/Distributors
• Manufacturers
• Component/Raw material suppliers.
Fearne and Hughes (1999) mentioned on success factors in the fresh produce
supply chain: insights from the UK, found that power of retailer increases along with
their interest on own label products. So they became increasingly dependent on fewer

9
larger suppliers who can deliver safe products on a large scale at a competitive price. He
suggested that farmers and growers should directly link with other sectors of the
marketing chain in order to supply the right and consistent quantity and quality of
different products. The producer of raw material needs to accept the fact that the financial
benefit, which comes from partnership will invariably distributed in relation to value
added.
Ricks et al. (1999) revealed that the appropriate combination of vertical
coordination arrangements like contracts, informal agreement and joint venture improved
supply chain performance by providing adequate supplies to the shippers from packers
and growers, aiding standardization and packaging of fruit products and risk sharing
between the shippers, packers and growers.
Julie et al. (1998) mentioned a case study from the U.S. milling wheat industry, it
focused on supply chain management in the grain industry by investigating the effects of
wheat quality on marketing arrangements between producers, grain handling companies
and processors, wheat quality is defined by many different characteristics, broadly
categorized into physical and intrinsic quality attributes.
2.2 The Definition of Marketing
Market as an “an arena for organizing and facilitating business activities and for
answering the basic economic questions: what to produce, how much to produce, how to
produce, and how to distribute production” (Kohls and Uhl 1985). Market can be defined
as an area in which one or more sellers of given products/services and their close
substitutes exchange with and compete for the patronage of a group of buyers. Originally,
the term market stood for the place where buyers and sellers are gathered to exchange
their goods, such as village square. A market is a point, or a place or sphere within which
price making force operates and in which exchanges of title tend to be accompanied by
the actual movement of the goods affected (Backman and Davidson 1962).
Marketing is a „„system‟‟, which comprises several and usually stable and
interrelated structures that along with production, distribution and consumption,
strengthen the economic process (Mendoza 1995).

10
Marketing as a societal process by which individuals and groups obtain what they
need and want through creating, offering, and freely exchanging products and services of
value with others. He also defined marketing as a managerial definition; marketing has
often been described as the art of selling products (Kotler 2003).
Marketing is widely known as "the 21 century definition of marketing” which
runs as follows a social and managerial process by which individuals and groups obtain
what they need and want through creating and exchanging products and values with
others (Kotler 2003).
Food marketing can be defined as the performance of all business activities
involved in the flow of goods and services from the point of initial agricultural
production until they are in the hands of the consumers. This definition of marketing also
suggests a mutual interdependence between farmers and food marketing middlemen
(Kohls and Uhl 2002).
Varnet and Vincent (1967) explained, a good marketing system is not limited to
stimulation of consumption, but also generates increased production by seeking out extra
supplies. If the production system works efficiently, it produces suitable incentives to
meet consumer‟s needs more accurately in terms of type, quality and quantity of supply.
Production is thus adopted to the need of consumers in response to price signals
transmitted by the marketing system.
2.2.1 Approaches to the study of marketing
Economists take three major approaches to analyzing the marketing sector of the
national economy. These include; the functional approach, the system or institutional
approach and the individual or commodity approaches (Mendoza 1995).
(a) Functional approach
Functional approach involves classifying and studying specialized activities
performed as marketing works. A marketing function is a fundamental or basic physical
process or service required to give a product the form, time, place, and possession utility
consumers‟ desire. In this approach, the performed activities in marketing agricultural
production are taken and analyzed. The chief marketing activities are selling, buying,
11
transporting, ware housing, financing, risk-taking and carrying out market-intelligence
(Branson and Norvell 1983).
(b) Institutional approach
It is concerned with the number and kind of business firms that perform the
marketing task .That means, it covers all market participants (producer, assembler,
transporter, wholesaler, retailer and consumer). This approach includes market
stabilization agencies boards of foreign trade, supermarket chains, wholesaler or retailer
networks, a town‟s central market, or agreements between producers and millers. The
effectiveness of marketing institutions depends on the involvement of the relevant people
(Branson and Norvell 1983).
(c) Commodity approach
This approach involves studying problems encountered while marketing particular
products. These products could be consumers, industrial or agricultural product. This
approach is used to deal with list of products and this detail analysis includes the
classification of products, characteristics of products, source of supply, persons engaged
in the exchange process, transportation of the product, its financing, storage, and
advertisement. Institutional analysis in this approach involves identifying major
marketing channels, analysis of marketing costs and margins (Branson and Norvell
1983).
2.3 Factors that Affect the Productivity
Monsiapile et al. (2010) studied the sunflower production situation in the central
corridor of Tazinia. In the sunflower production, improved varieties, number of crops in
farm, distance from homestead to the largest plot, and the age of household head were
found to have most significant contribution to productivity of sunflower farmers.
Decrease of age of head of household was associated with increase of sunflower yield by
0.33, with concentration of many crops in the farm it was likely to decrease sunflower
yield by 0.047. Household with farms that were long distance from their house were
2.0% less likely to have higher sunflower yield. The use of local seed varieties was also
likely to decrease sunflower yield by 26%.

12
Govereh and Jayne (2002) studied the determinants of cotton production in
Gokwe North district and found out that cotton production was positively associated with
farm size, education of the household head, the value of farm capital, the number of
cotton sprayers and a relatively early clearing of tests from the village in question. This
study brought about the importance of education as one of the factors affecting cotton
production, but there was also need to look at other factors which affect cotton
production from a historical perspective for policy evaluation purposes.
Thirtle (1990) showed that in general agricultural production in Zimbabwe was
affected by the adoption of new technology, generated by R&D expenditures, or imported
from abroad, and spread to the farmers by the extension service. They concluded that the
determining variables that shift the production function were assumed to be R&D and
extension expenditures, and the weather. In their study they did not disaggregate to
individual crops. The problems which may arise from conclusions based on such research
was that, different crops respond differently to various factors in the production process,
so they was need to specifically study how individual crops respond to different factors.
Abdelaziz (2010) revealed that the significant factors affecting groundnuts
production were the total cultivated area of groundnuts, crop rotation and period of
cropping. In order to improve the agricultural production in the study area, the study
recommended that the supply of the farmers with agricultural inputs especially seeds
through repayment in kind after harvesting and support agricultural extension to be more
efficient and effective in transferring the recommended improved technologies.
Resolution of Darfur security problems in addition to solution of other problems facing
agricultural production such as pests, marketing, desertification, drinking water, grazing
etc were also essential.
Oury (1965) focused primarily on yield effects of precipitation, temperature and
technological progress with findings suggesting a positive relationship between crop
yields and precipitation and a negative relationship between yields and temperature.

13
2.4 Factors that Affect Profitability
Bagamba (1998) studied that the profitability of bananas found that the total farm
size, total farm income, off-farm income, age of the farmer, weevil damage, interaction
with government extension agents, gender of the farmer, distance from the farm to the
tarmac, years spent in school and number of cattle owned had a significant effect on the
profitability of banana production.
Increasing the area planted was expected to increase yield which should lead to
increased gross margin. However this negative relationship between area and gross
margin may be attributed to the fact that the area was not used efficiently thus increasing
area of cowpeas planted would not actually lead to increased production. Quantity
harvested also has a positive influence on gross margin at 95% confidence. An increase
in yield had a positive relationship to gross margin because increasing the quantity
harvested increases the number of kg‟s that can be valued (Warr 1999).
Erbaugh (2008) stated that the profitability of sorghum in Tanzania found that the
farm size, production costs, farm location, interaction between production costs and farm
gate price as well as the interaction between the varieties used and fertilizer applied were
significant. Surprisingly, farm size was negatively influencing the gross margin contrary
to the literature. However, the interaction between Production cost and farm gate price
was positive and significant while farm gate price alone was not significant. In addition,
the variety used, 7 application of fertilizer and tillage method were not significant but the
interaction between variety used and fertilizer application was positive and significant.
Rearden (1997) revealed that several factors have been identified to influence
agricultural profitability at farm level. These include; the farm gate price, government
price policies, farm location, production costs, variety of seed used, yield, farm size,
tillage practices, land tenure which also influences yield, experience in production of crop
which impacts on yield, education level of the household head, age of household head,
gender of household head, household size, off-farm income received, extension services,
and distance to market.

14
2.5 The Marketing Channel/Chain and Marketing Margin
Kotler and Armstrong (2003) revealed that a marketing channel is a business
structure of interdependent organizations that reach from the point of product or origin to
the consumer with the purpose of moving products to their final consumption or
destination. This channel may be short or long depending on kind and quality of the
product marketed, available marketing services, and prevailing social and physical
environment (Islam et al. 2001).
Mendoza (1995) defined that marketing channel as the path the goods follow from
their sources of original production to their ultimate destination for final use. Hence, the
analysis of marketing channels is intended to provide a systematic knowledge of the flow
of goods and services from their origin (producer) to their final destination (consumer).
Olukosi and Isitor (1990) stated that marketing margin is studied to measure
efficiency of markets. It is an attempt to evaluate economic or price efficiency. Generally,
it refers to the difference between the retail price and the producer price. The marketing
margin showed the fraction of the consumer expenditure on a commodity that is received
by the producer and each of the marketing agents.
Tomek and Robison (1990) stated that there are two basic ways in which to view
marketing margin. The first way is that marketing margin is simply the difference in price
paid by consumers and the price received by producers. In the second way marketing
margin can be explained as the price of a collection of services that are performed in
getting the product from the producer to the consumer. The marketing margin is the cost
of collection of services to move and transform the farm product into a product for the
final consumer.
Guvheya (1998) defined that marketing margin is examined for a common means
of measuring market efficiency. The overall marketing margin is simply the difference
between the farm-gate price and the price received on retail sale. That difference can then
be considered to be the cost of marketing and all that is entailed in getting the product
from the producer to the consumer in the desired form. Therefore, marketing margins are
differences between different levels of marketing channels. They capture the proportion
of final selling price that marketing agent provides services for getting the added value in

15
various levels. Response of marketing margins to price changes at any level is also
indicative of the efficiency of the channel or supply chain.
2.6 Review of the Studies on Marketing Channel and Marketing Cost
Achrol and Louis (1988) revealed that success or failure was determined by how
effectively and efficiently their products were sold through their marketing channel
members (e.g., agents, wholesalers, distributors, and retailers). Given this situation,
considerable marketing channel research focused on organizational responsibility for
managing channel how interrelationships among a firm and its channel members can be
managed better.
Sidhu and Kahalon (1967) identified three marketing channels for apple in Kullu
valley, namely, (a) contract system (b) sales in market through agents (c) directly to
consumers and their shares in the market were 62.2% contract basis. 34.14% to
commission agents in the market and only 3.65% through direct sold to consumers.
Satihal (1993) reported that a single marketing channel was observed in Bijapur
district for bean crop. The per-quintal marketing cost of producer was the highest in
Bangalore market (Rs. 119.73) followed by Hubli market (Rs. 114.35) and Bijapur
market (99.88). The net returns realized per quintal was the highest in Hubli market Rs.
(379.25) followed by Bijapur market (Rs. 356.61) and Bangalore market (Rs. 247)
because of the price received by producer in Bangalore market was high as compared to
other markets.
Singh and Kahalon (1968) observed that commission agents and retailers were
important channels for selling grapes. About 41% and 40% of produce was marketed
through commission agents and retailers respectively. Further analysis showed that
grading and packing formed 72.6% of total marketing costs. In the primary markets
transportation cost accounted for 10.96% and 34% in these markets respectively.
Lutz and Herman (1994) stated that the governance structure within a marketing
channel depended largely on three variables: the frequency of interaction among channel
members, the degree of uncertainty facing both actors (i.e. the sellers and the buyers), and
the extent to which channel members had incurred transaction (specific expenses to do
business with one another).The performance of marketing channel was related to its

16
structure and strategies (conduct) of the actors operating in these channels. A major
distinction with respect to its structure concerned whether the organization functions in
conventional or vertical marketing channels.
Patil (1989) identified four channels on marketing of Alphanso mangoes in
Maharashtra viz. producer- consumer (direct sale) producer - cooperative - consumer
(cooperative sale), producer - commission agents - wholesalers - retailers -consumer
(middle men sales) and producer - pre-harvest contractor - commission agents
wholesalers - retailers -consumer (pre-harvest contract sale). The study revealed that
when the contract was made at the time of flowering stage, the price received by the
growers was the lowest (Rs. 28.50/crate) though the crate size was big. The average price
of Alphanso mangoes received by the growers was only Rs. 29.40 per crate. Finally, he
concluded that the direct sale to consumer was the most profitable and sale through pre
harvest contractor was the least profitable.
Cramers and Jensen (1982) defined that a marketing margin was the percentage of
the final weighted average selling price taken by each stage of the marketing chain. The
total marketing margin was the difference between what the consumer pays and what the
producer/farmer receives for his product. In other words, it was the difference between
retail price and farm price.
Olukosi and Isitor (1990) observed that marketing margin was studied to measure
efficiency of markets. It was an attempt to evaluate economic or price efficiency.
Generally, it referred to the difference between the retail price and the producer price.
The marketing margin showed the fraction of the consumer expenditure on a commodity
that was received by the producer and each of the marketing agents.
Dhar (1976) stated that the marketing costs when sold through commission agent
at the markets of Jammu, Amritsar and Delhi came to Rs. 11.88, Rs. 14.58 and Rs. 17.37
respectively. The major items of marketing costs were packing, transportation and
commission charges. Further analysis showed that commission agents accounted for
more than 41 per cent of total marketing margins followed by transportation and handling
charges.
Vedini (1997) conducted the study on cost and margins in Jasmine flower
marketing. The study was conducted in Mysore city. It was interesting to note that all the
17
sample farmers sold their produce at their nearest markets in Mysore district. It was
significant to note that the trader‟s commission agents were playing a very crucial role in
Jasmine flower marketing than the direct sale to consumer. The study results explicitly
indicated that Jasmine flower trade was a profitable venture with a price spread of nearly
49% among all the intermediaries the net return per kg of flower trade was the highest in
case of retailers due to creation of form utility. The constraints called for orderly
marketing by establishing co-operative for flower marketing.
Biradar (1996) studied the marketing costs, margins and price spread of selected
agricultural commodities in Kolhapur district of Maharashtra during 1990-92. The study
revealed that marketing margins, cost and price spread of different commodities in the
two common channels under study was followed, it was found that the maximum average
share of the farmer in the consumer‟s rupee is found in two commodities i.e., jaggery and
groundnut, being 80% and 72% respectively, as compared to the food grain commodities,
i.e., paddy and wheat, being about 68% and 56% respectively. The average cost of
marketing and margin were to be the lowest in jaggery as compared to other commodities
under study by and large, the cost of marketing was found uniform in all the selected
commodities, whereas the market margin was varying from commodity to commodity
and from market to market. The highest margin was claimed by the traders in wheat and
paddy that was 32% and 21% respectively while in groundnut and jaggery their margin
being 17% and 10.12% respectively.
Mohammed and Namasivayam (2005) conducted marketing cost of banana in
Theni district of Tamilnadu. For the study banana growers of Theni district was selected
and also the different functionaries which the farmers followed. The study concluded that
cutting, loading and unloading commission, transportation and the like were the
marketing costs of the banana growers, which amounted to Rs 805, Rs 760 and Rs 734 in
the case of small, medium and large growers, respectively. The pre-harvest contractors
incurred a marketing cost of Rs 775 per ton. Transport cost dominated other costs. The
marketing cost, excluding interest on working capital was less to pre-harvest contractors
than to the growers. Commission agents had to pay Rs 116.67 per ton towards the
marketing cost. The wholesalers incurred a marketing cost of Rs 417.09 per acre. More
18
than 60% of the marketing cost of the retailers was due to wastage. The total marketing
cost of retailers was worked out to be Rs 336.67 per ton.
Kasana (2003) carried out study on distributive marketing margins of three most
commonly grown vegetables, i.e. potato, peas and marrow and the shares of different
marketing functionaries involved in the marketing margins. He observed that total
marketing margins for potato was 38.86%, for peas 54.89% and for marrow 62.89%. The
net margins for potato, peas and marrow were 19.04%, 27.25% and 30.50% respectively.
The producer received 61.14%, 45.11% and 37.11% of the price paid by the consumer for
potato, peas, and marrow respectively. The difference in marketing margins for various
vegetables is due to high marketing and picking costs. It was observed that 30 % of the
potato fields were sold to pre harvest contractors. The highest marketing margins were
observed for marrow followed by peas and potato respectively. The highest net margins
for producers were observed for potato followed by peas and marrow. The highest net
margin for wholesales was found in marrow followed by peas and potato. The retailer‟s
highest net margins were observed for marrow followed by peas and potato.
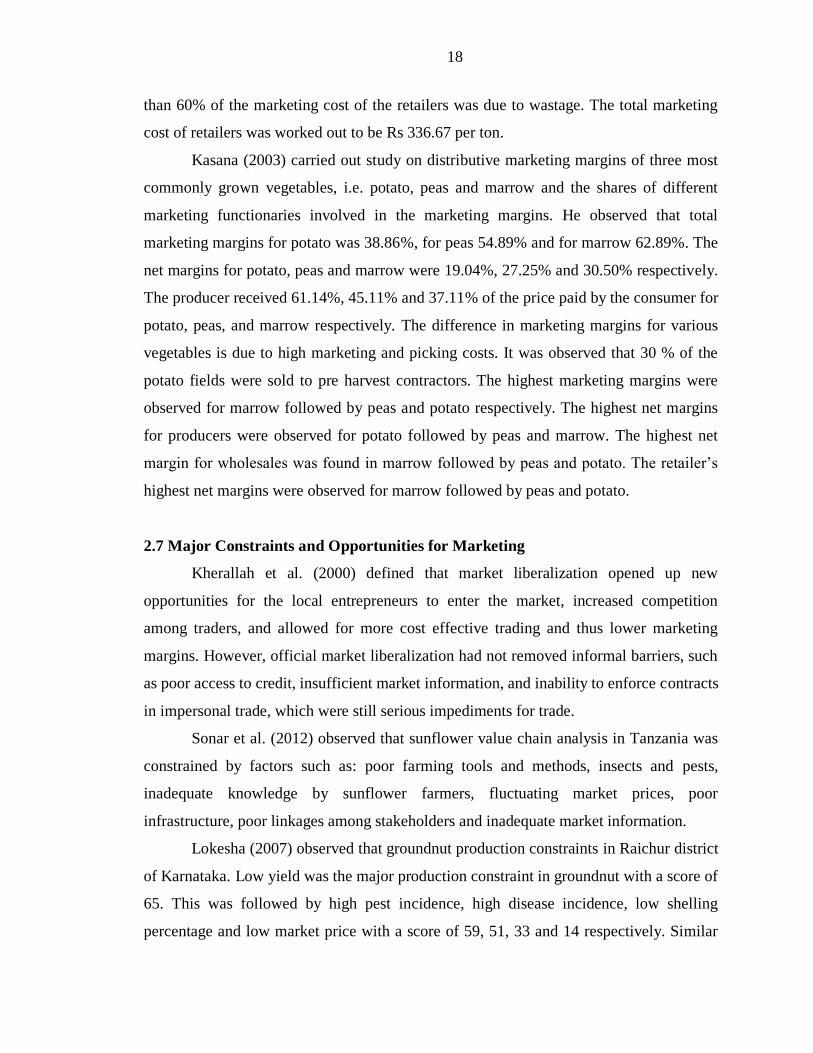
2.7 Major Constraints and Opportunities for Marketing
Kherallah et al. (2000) defined that market liberalization opened up new
opportunities for the local entrepreneurs to enter the market, increased competition
among traders, and allowed for more cost effective trading and thus lower marketing
margins. However, official market liberalization had not removed informal barriers, such
as poor access to credit, insufficient market information, and inability to enforce contracts
in impersonal trade, which were still serious impediments for trade.
Sonar et al. (2012) observed that sunflower value chain analysis in Tanzania was
constrained by factors such as: poor farming tools and methods, insects and pests,
inadequate knowledge by sunflower farmers, fluctuating market prices, poor
infrastructure, poor linkages among stakeholders and inadequate market information.
Lokesha (2007) observed that groundnut production constraints in Raichur district
of Karnataka. Low yield was the major production constraint in groundnut with a score of
65. This was followed by high pest incidence, high disease incidence, low shelling
percentage and low market price with a score of 59, 51, 33 and 14 respectively. Similar

19
results were also observed in control villages. Low yield was the major production
constraint in groundnut with a score of 67. This was followed by high pest incidence,
high disease incidence, low shelling percentage and low market price with a score of 56,
53, 35 and 16 respectively.
Shanthasheela (2007) indicated that inadequate knowledge, practice of
recommended agronomic practices and access to credit were the constraints found in
sesame production. Specific constraints identified were availability of quality seed
materials for sowing low yield, pest and diseases, labour availability, lack of awareness
of suitable management practices to ensure good yield, high yield variation within the
field, vagaries of nature, and lack of good returns from sale.
Tegegene (2008) identified cotton marketing constraints in the chain were not
identified in detail through formal survey. Therefore, detailed formal survey analysis of
marketing constraints in the chain was essential to know currently prevailing problems in
the cotton marketing chain and their extent of prevalence.
Wolday (1994) observed that the performance of agricultural marketing system in
Ethiopia was constrained by many factors such as: poor quality of agricultural produce,
lack of market facilitates, weak extension services which ignored marketing
development, poor linkage of research and extension, absence of market information and
intelligent services, excessive price and supply fluctuations, limited access to credit,
inefficient handling including, storage, packaging and transportation problems.
Hiremath (1993) expressed that the absence of processing facility, absence of cold
storage facility, fluctuations in prices were the major problems expressed by farmer‟s,
and other problems were absence of cooperative marketing of lime, non-availability of
packing material at reasonable price and difficulty in transportation.
Gummagolmath (1994) identified the problems through the opinion survey
revealed that the problem of orchardists expressed in all categories of farmers. Problem
of non-availability of labour was expressed by most of the medium orchardists 66.67%
followed by small orchardists 40% and large orchardists 33.37%. Among the marketing
problems, the problem of price fluctuation was expressed by 44.44 % of small, 36.80% of
medium and 50% of large orchardists and other problems were high commission and
existence of mutual understanding between wholesaler and commission agents.
20
Senthilnathan and Srinivasan (1994) studied the problems in poovan banana
cultivation in Trichy, Lalgudi and Kulithali taluks of Rrichirapalli district of Tamil Nadu.
They reported that, in Trichy taluk 20 farmers expressed high initial investment, 16 wind
damages, 12 price fluctuations and 10 disease problems. In Lalgudi taluk, 17 farmers
expressed high initial investment, 11 price fluctuations, 13 diseases incidence and nine
wind damage. In Kulithali, disease incidence expressed by 2, wind damage by 20, initial
investment by 18 and price factor by 14 farmers.
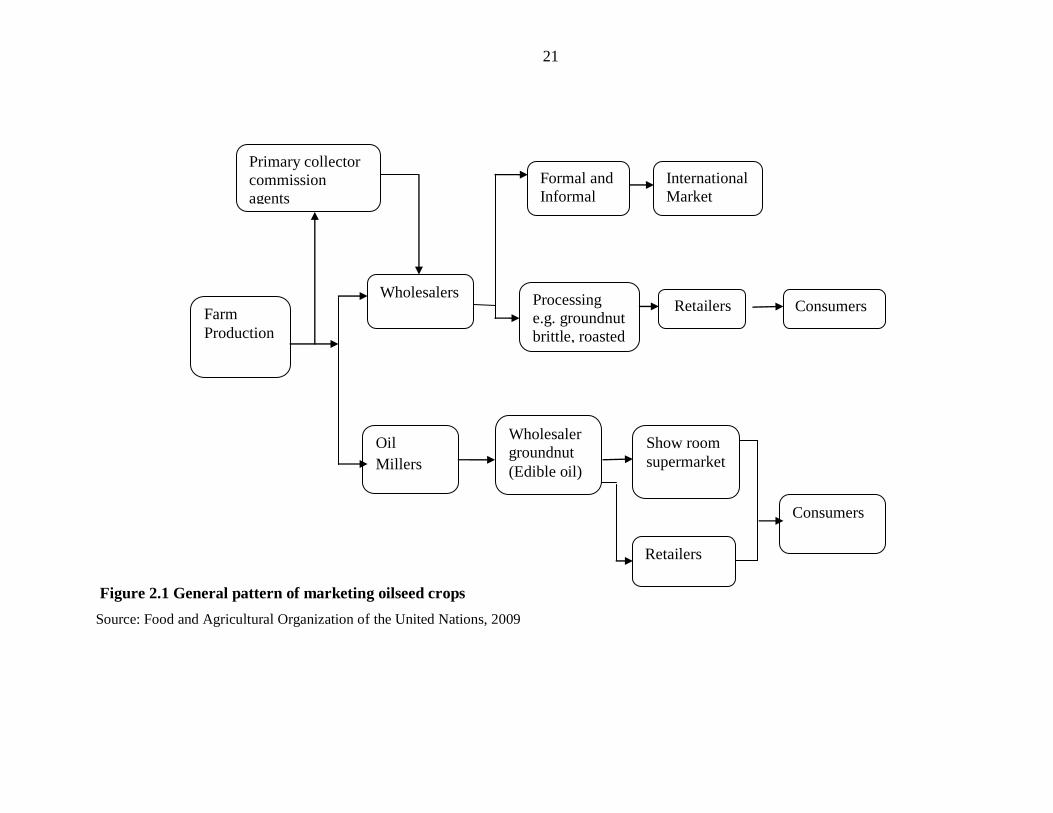
2.8 Oilseed Crops Marketing Channel in Myanmar
Kyaw and Raphy (2009) revealed that the marketing channel of oil crops in
Myanmar differ from place to place. For transferring agricultural produce from farmers to
consumers, various intermediaries played important role in domestic marketing system.
The private marketing system had the main role of transferring groundnut from producers
to consumers through transport, storage, and processing activities.
Win (2009) stated that the marketing of oilseed crop was a business activity
interaction between the farmers and marketing intermediaries throughout the whole
process. The oilseed crop flow started from the farmers and finally to the consumers
through the oil millers.
21
Figure 2.1 General pattern of marketing oilseed crops
Source: Food and Agricultural Organization of the United Nations, 2009
Primary collector
commission
agents
Wholesalers
Wholesalers
Retailers
Consumers
Farm
Production
Oil
Millers
Retailers Consumers
Wholesaler
groundnut
(Edible oil)
Processing
e.g. groundnut
brittle, roasted
Show room
supermarket
International
Market
Formal and
Informal
trade

CHAPTER III
METHODOLOGY
3.1 Study Area
3.1.1 Description of the study area
Magway Region is located in central part of Myanmar. Its major parts fall in the
dry zone. Magway Region is situated between North Latitude from 18• 50′ and 22
• 47′
and East Longitude between 93• 47′ and 95
• 55′, and has an area of 44,820 square
kilometer (km2). Magway Region covers 25 townships. Ya land occupies 0.65 million
hectares of total arable land (1.01 million hectares) in the region and the rest lands are
paddy land, silt land (Kaing-kyun myay), hill-side cultivated land (Taungya-myay) and
vegetable land. Multiple cropping is practiced in the paddy land and farm land. Magway
Township is situated on the east bank of the Ayeyarwaddy River. It is bordered by
Natmouk Township on the east, Minbu, Sagu and Min Hla Townships on the west,
Taungdwingyi and Sinpaungwe Townships on the South, and Yenanchaung Township on
the north. Magway Township possesses tropical climatic condition and produces a large
quantity of groundnut and sesame for edible oil, it is also known as an oil pot of
Myanmar.
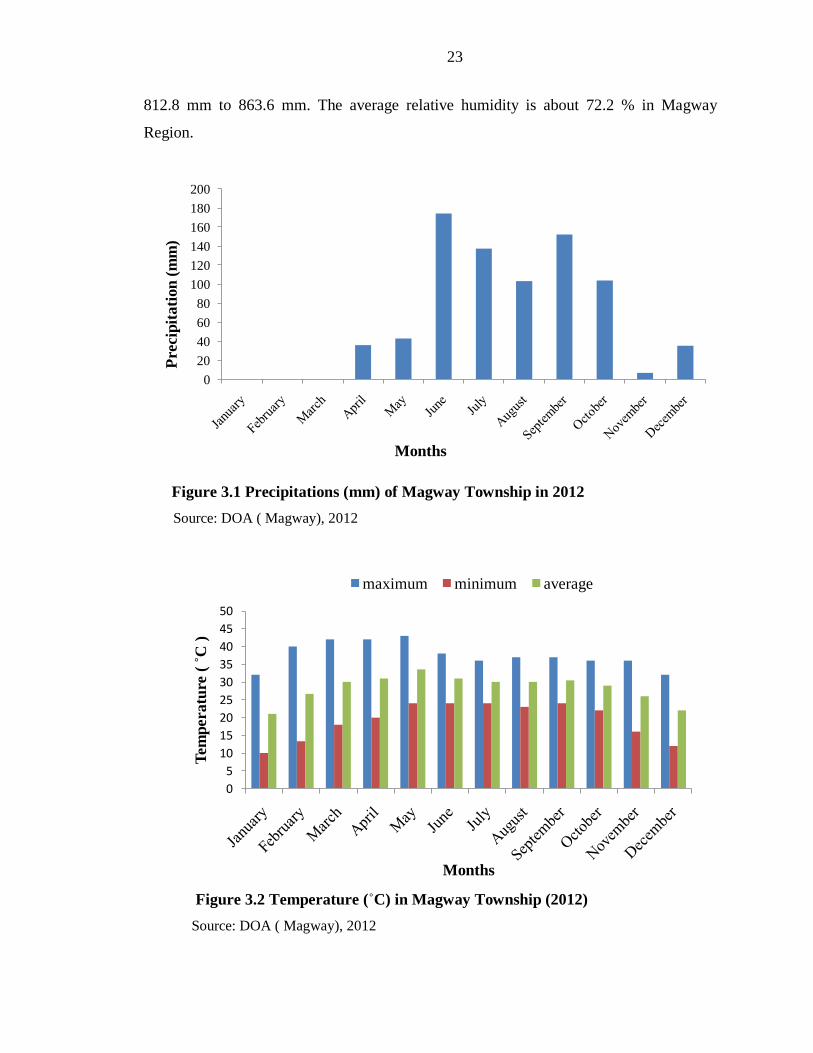
3.1.2 Climate
There are three seasons in Myanmar; namely the hot season, rainy season and
cool season. Average temperatures of the central region are between 37•C and 40
• C in
summer, especially April which is the hottest month. In cool season, the average
temperature is 21•C and the lowest temperature is 18
•C. Magway Township is situated
56.66 meter above sea level (maximum sea level is 250 meter and minimum sea level is
50 meter). The average monthly temperature ranges from a minimum of 10•C (in
January) to a maximum of 43•C (in May). A maximum precipitation of 174.24 mm was
found in June and minimum precipitation of 0 mm was found in January, February and
March. Precipitation (mm) and temperature (•C) of Magway township are shown in
Figure 3.1 and Figure 3.2. The range of the total rainfall of the central region is from
23
812.8 mm to 863.6 mm. The average relative humidity is about 72.2 % in Magway
Region.
Figure 3.1 Precipitations (mm) of Magway Township in 2012
Source: DOA ( Magway), 2012
Figure 3.2 Temperature (˚C) in Magway Township (2012)
Source: DOA ( Magway), 2012
0
20
40
60
80
100
120
140
160
180
200
Pre
cip
itati
on
(m
m)
Months
0
5
10
15
20
25
30
35
40
45
50
Tem
peratu
re (
˚C
)
Months
maximum minimum average

24
3.1.3 Sown area and crop production in the study area
Magway Township occupied a land area of about 176 thousand hectares in which
the cultivable area covered 81.41 thousand hectares (46.08%), wild land covered 0.87
thousand hectares (0.49%), reserved and other forests covered 2.27 thousand hectares
(1.28%) and others occupied 92.15 thousand hectares (52.15%). Total cultivable areas
was divided into 1.71 thousand hectares of lowland (2.11% in total net sown area), 77.61
thousand hectares of upland (95.33%), 2.09 thousand hectares of alluvial soil (2.57%),
0.002 thousand hectares of orchard (0.003%) (Table 3.1).
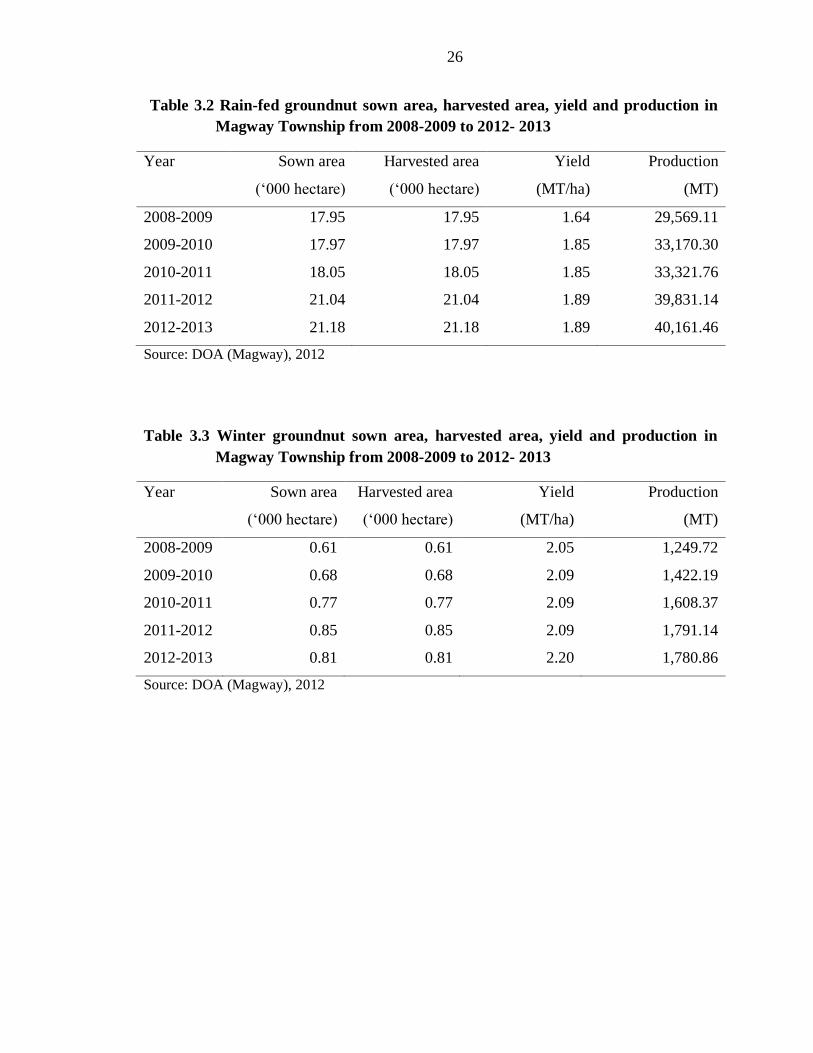
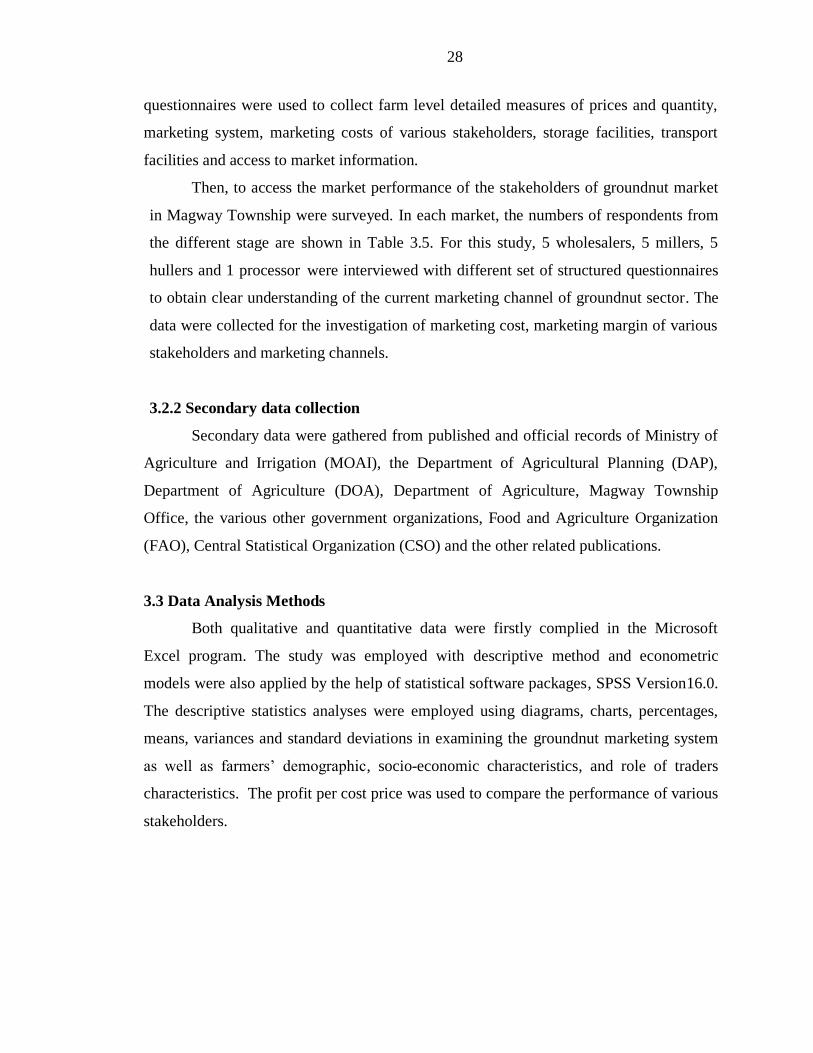
The sown area, harvested area, yield and production of rain-fed groundnut and
winter groundnut in Magway township from 2008-2009 to 2012-2013 are shown in Table
3.2 and Table 3.3. The sown area of rain-fed groundnut significantly increased from
17.95 thousand hectares in 2008-2009 to 21.18 thousand hectares in 2012-2013.
Production of rain-fed groundnut also increased from 29,569.11 MT in 2008-2009 to 40,
161.46 MT in 2012-13. The sown area of winter groundnut recorded an increase from
0.61 thousand hectares in 2008-2009 to 0.81 thousand hectares in 2012-2013. Production
of winter groundnut slightly increased from 1,249.72 MT in 2008-2009 to 1,780.86 MT
in 2012-2013.The sown area, harvested area and production of rain-fed groundnut
significantly increased than the winter groundnut.

25
Table 3.1 Land utilization in Magway Township (2011-2012)
S.N Type of Land Area
(„000 hectare)
Percent in
total sown area
(1) Net sown 81.41 46.08
(a) Lowland 1.71 (2.11)
(b) Upland 77.61 (95.33)
(c) Alluvial soil 2.09 (2.57)
(d) Orchard 0.002 (0.003)
(2) Wild land 0.87 0.49
(3) Reserved and other forest 2.27 1.28
(4) Others 92.15 52.15
Total 176.70 100
Source: DOA (Magway), 2012
Note: Figures in the parenthesis are percentage in total net sown area
26
Table 3.2 Rain-fed groundnut sown area, harvested area, yield and production in
Magway Township from 2008-2009 to 2012- 2013
Year Sown area
(„000 hectare)
Harvested area
(„000 hectare)
Yield
(MT/ha)
Production
(MT)
2008-2009 17.95 17.95 1.64 29,569.11
2009-2010 17.97 17.97 1.85 33,170.30
2010-2011 18.05 18.05 1.85 33,321.76
2011-2012 21.04 21.04 1.89 39,831.14
2012-2013 21.18 21.18 1.89 40,161.46
Source: DOA (Magway), 2012
Table 3.3 Winter groundnut sown area, harvested area, yield and production in
Magway Township from 2008-2009 to 2012- 2013
Year Sown area
(„000 hectare)
Harvested area
(„000 hectare)
Yield
(MT/ha)
Production
(MT)
2008-2009 0.61 0.61 2.05 1,249.72
2009-2010 0.68 0.68 2.09 1,422.19
2010-2011 0.77 0.77 2.09 1,608.37
2011-2012 0.85 0.85 2.09 1,791.14
2012-2013 0.81 0.81 2.20 1,780.86
Source: DOA (Magway), 2012

27
3.1.4 General information of surveyed villages
Magway Township is made up of 15 quarters, 61 village tracts and 216 villages.
To represent the groundnut growers, Tapauktaw, Phoelaylone and Magyigan villages
were selected in this study. Tapauktaw, Phoelaylone and Magyigan are situated 4, 10 and
5 miles away from Magway Township.
In Tapauktaw village, there was 110.52 hectares of groundnut sown area.
Harvested area was 110.52 hectares and produced 244.61 metric ton of rain-fed
groundnut in 2012-2013. In Phoelaylone village, farmers grew 111.34 hectares of
groundnut, the harvested area was 111.34 hectares and produced 277.2 metric ton of
rainy-fed groundnut in 2012-2013. In Magyigan village, farmers grew 70.85 hectares of
groundnut, the harvested area was 70.85 hectares and produced 166.66 metric ton per
rain-fed groundnut in 2012-2013. The general information of those villages were shown
in Table 3.4.
3.2 Data Collection and Sampling Method
Both primary and secondary data were collected during the crop season of 2012-
2013.
3.2.1 Primary data collection
The primary information was collected by personal interview with structured
questionnaire. Field survey for primary data collection was done from December 2012 to
January 2013. The household level survey in Magway Township was carried out in 3
villages (Tapauktaw, Phoelaylone and Magyigan). A total of 90 sample farmers
composed of 30 sample farmers each from the selected three village tracts were
interviewed by using a structured questionnaire. The diagram of study area is shown in
Figure 3.3.
The questionnaire was structured in details on rain-fed groundnut production at
the farm level. Socio-economic characteristics of groundnut farmers such as age,
education, family size, farm ownership, farm size, groundnut sown area, harvested area,
yield, crop production, output prices, labor costs, transportation costs, marketing costs,
extension service, credit taken, loan from agricultural development bank, amount of
marketed surplus, production cost of groundnut and constraints etc. The market related
28
questionnaires were used to collect farm level detailed measures of prices and quantity,
marketing system, marketing costs of various stakeholders, storage facilities, transport
facilities and access to market information.
Then, to access the market performance of the stakeholders of groundnut market
in Magway Township were surveyed. In each market, the numbers of respondents from
the different stage are shown in Table 3.5. For this study, 5 wholesalers, 5 millers, 5
hullers and 1 processor were interviewed with different set of structured questionnaires
to obtain clear understanding of the current marketing channel of groundnut sector. The
data were collected for the investigation of marketing cost, marketing margin of various
stakeholders and marketing channels.
3.2.2 Secondary data collection
Secondary data were gathered from published and official records of Ministry of
Agriculture and Irrigation (MOAI), the Department of Agricultural Planning (DAP),
Department of Agriculture (DOA), Department of Agriculture, Magway Township
Office, the various other government organizations, Food and Agriculture Organization
(FAO), Central Statistical Organization (CSO) and the other related publications.
3.3 Data Analysis Methods
Both qualitative and quantitative data were firstly complied in the Microsoft
Excel program. The study was employed with descriptive method and econometric
models were also applied by the help of statistical software packages, SPSS Version16.0.
The descriptive statistics analyses were employed using diagrams, charts, percentages,
means, variances and standard deviations in examining the groundnut marketing system
as well as farmers‟ demographic, socio-economic characteristics, and role of traders
characteristics. The profit per cost price was used to compare the performance of various
stakeholders.
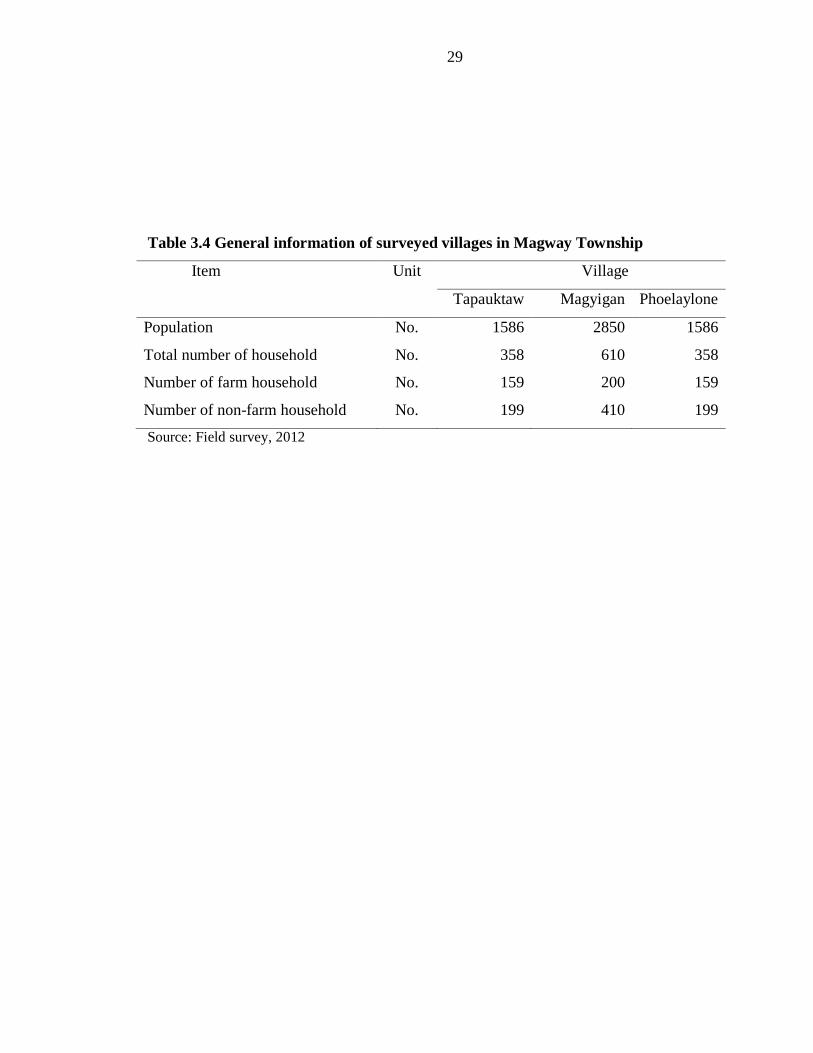
29
Table 3.4 General information of surveyed villages in Magway Township
Item
Unit Village
Tapauktaw Magyigan Phoelaylone
Population No. 1586 2850 1586
Total number of household No. 358 610 358
Number of farm household No. 159 200 159
Number of non-farm household No. 199 410 199
Source: Field survey, 2012
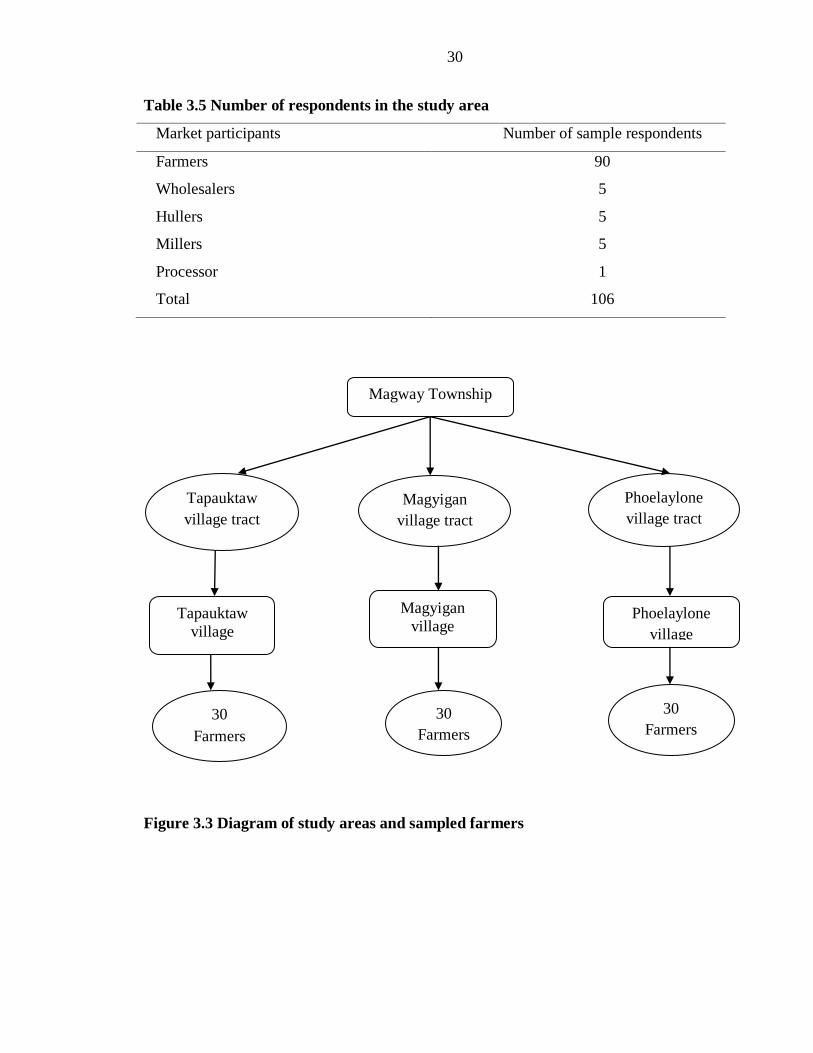
30
Table 3.5 Number of respondents in the study area
Market participants Number of sample respondents
Farmers 90
Wholesalers 5
Hullers 5
Millers 5
Processor 1
Total 106
Figure 3.3 Diagram of study areas and sampled farmers
Magway Township
Tapauktaw
village
Magyigan
village
Phoelaylone
village
Tapauktaw
village tract
Magyigan
village tract
Phoelaylone
village tract
30
Farmers
30
Farmers
30
Farmers

31
3.3.1 Cost and return analysis
Enterprise budgeting (Olson 2009) was used in the economic analysis. The
evaluation and focus on the economic and technical performance of an individual farm
enterprise is called an enterprise budget which is used to examine the profitability of
specific farm enterprise and to compare the profitability of existing and proposed
enterprises. The cost and return analysis was used to determine the profitability of the crop
in the study area. Both cash and non-cash items were included in the estimation of
material cost and labor cost. Non-cash items for material cost were seeds, working
animals, FYM etc kept by farmers at farm. Cash payment for labor included hired labor
and payment for land preparation. The first measurement was the difference between total
gross benefits or total returns and total variable cash costs, excluding opportunity costs.
This value was referred to as “return above variable cash cost”. The second measurement
was the deduction of the opportunity cost and total variable cash costs from gross benefit.
This return was referred to as “return above variable costs” or “gross margin”. The return
per unit of capital invested could be calculated by gross benefits per total variable costs.
The return per unit of cash cost could be calculated by gross benefits per total cash costs.
Expressions for estimating returns to various factors were described in Table 3.6.

32
Table 3.6 Estimating return to factors of production
Factor Unit How to calculate
Return above variable cost Price/ha RAVC=TR-TVC
Return above variable cash cost Price/ha RAVCC=TR-TVCC
Return per unit of cash cost Price TR/TVCC
Return per unit of capital Price TR/TVC
Break –even yield MT/ha TVC/Average price per MT
Break- even price Price/MT TVC/Average yield per hectare
Gross Margin Price/ha GM=GB-TC
Benefit Cost Ratio BCR= GB/TC
Source: Olson. K, 2009
Where,
GB = Gross Benefit NB = Net Benefit
TR = Total Revenue TVC = Total Variable Cost
TLC = Total Labor Cost TVCC = Total Variable Cash Cost
Y = Output RAVC = Return Above Variable Cost
BCR = Benefit Cost Ratio RAVCC = Return Above Variable Cash
Cost
GM = Gross Margin TC = Total Cost
33
3.3.2 Method of marketing cost and marketing margin analysis
3.3.2.1 Marketing channel
Marketing channels can be defined as the set of external organizations that a firm
uses to achieve its distribution objectives. Essentially, a channel is the route, path, or
conduit through which products or things of value flow, as they move from the
manufacturer to the ultimate user of the product. Marketing channel showed the flow of
oilseed crops from the production site (producers) to intermediaries and on to the
exporters. To understand how the commodities move through the various channels, it was
necessary to identify the role of various market places and marketing agents involved
(Mendoza 1995).
For most manufacturers, success or failure was determined by how effectively and
efficiently their products sold through their marketing channel members (e.g., agents,
wholesalers, distributors, and retailers). Given this situation, considerable marketing
channel research focused on organizational responsibility for managing channel how
interrelationships among a firm and its channel members can be managed better (Achrol
and Louis 1988).
3.3.2.2 Marketing margin
Agriculture researchers and economists use the term “marketing margin” to
summarize the aggregated costs of moving agricultural goods forward along the
successive levels of the farm to retail marketing margin chain. The marketing margin or
the farm to retail price spread is the difference between farm value and retail price. It
represents payment for all assembling, processing, transporting and retailing charges
added to farm product (Elitzak 1996).
Cramers and Jensen (1982) defined that a marketing margin is the percentage of
the final weighted average selling price taken by each of the marketing chain. The total
marketing margin is the difference between what the consumer pays and what the
producer/farmer receives for his product. In other words, it is the difference between
retail price and farm price.
The total marketing margin may be subdivided into different components; all the
cost of marketing service and profit margin or net return. The marketing margin in an

34
imperfect market is likely to be higher than that in a competitive market because of the
expected abnormal profit. But marketing margin can also be high, even in competitive
market due to high real market cost (Worlday 1994).
Marketing margin is examined for a common means of measuring market
efficiency. This is an attempt to evaluate economic or price efficiency. Marketing
margins are differences between different levels of marketing channels. They capture the
proportion of final selling price that marketing agents provides services for getting the
added value in the various levels. Response of marketing margins to price changes at any
levels is also indicative of the efficiency of the channel (Guvheya 1998).
An empirical analysis of marketing margin should be first and foremost an
economic analysis of determinant of farm and retail price for a given commodity. The
volume of marketing reflects the efficiency of marketing system. The higher marketing
margin reflects fewer share of producer and more benefits to marketing middlemen and
vice-versa. The number of middlemen involved in various channel of the marketing has a
strong effect on the marketing margin.
The marketing margin of groundnut was examined in the analysis. In marketing
channel, farmers produced groundnut with shell. And the township wholesalers handled
the groundnut with shell, huller owners handled the groundnut seeds such as Si San (low
quality seed, used to make oil) and Lone San (good quality seed, used to make groundnut
brittle). The millers handled the commodity as edible oil. And the processor handled the
commodity as a groundnut brittle. In marketing channel the commodity types handled by
the middlemen are different. Therefore, the percentage of profit per cost price was used in
this study to compare the performance of intermediaries.
The following indicators are used in the analysis.
(a) Marketing Margin = Selling Price –Buying Price
(b) Profit = Marketing Margin – Total Marketing Cost
(c) Cost Price = Buying Price + Total Marketing Cost
(d) Profit per Cost Price = Profit / Cost price

35
3.4 The Determinants Factors on Groundnut Yield of the Selected Farm Households
The following model was used to examine the determinants factors of groundnut
yields of the selected farm households in Magway Township. To determine the factor
affecting groundnut supply at farm level in the study areas, linear regression function was
used. The dependent variable was yield of groundnut by sampled farmers and
independent variables were sown area, schooling year, seed rate, output price received by
farmers, total material costs, total labor and access to credit. The regression function was
as follow;
Yi = β0+ β1 LnX1i + β2LnX2i+ β3LnX3i+ β4LnX4i+ ------- + β6 LnX6i+ β7 LnX7i+ ui
Where;
Yi = Ln of groundnut with shell yield (kg/ha)
X1 = Ln of scholling year (yr)
X2 = Ln of sown area (ha)
X3 = Ln of seed rate (kg/ha)
X4 = Ln of total labor on the farm (no.)
X5 = Ln of total material cost on the farm (kyats/ha)
X6 = Ln of price of groundnut with shell (kyats/kg)
X7 = Access to credit (dummy variables, yes=1, no=0)
ui = Disturbance term
β = Unknown parameter to be estimated
i = 1….n

36
3.5 The Determinants Factors on Groundnut Profit of the Selected Farm
Households
The following model was used to examine the determinant factors of groundnut
profit of the selected farm household in Magway Township. To determine the factors
affecting groundnut profit at farm level in the study area, linear regression function was
used. The dependent variable was profit of groundnut by sampled farmers and
independent variables were farm experience, sown area, yield, price of groundnut, total
material cost, total labor cost and access to credit. The regression function was as follow;
Yi= β0+ β1 LnX1i + β2LnX2i+ β3LnX3i+ β4LnX4i+ ------- + β6 LnX6i+ β7 LnX7i+ ui
Where;
Yi = Ln of groundnut profit (kyat/ha)
X1 = Ln of farm experience (yr)
X2 = Ln of sown area (ha)
X3 = Ln of yield (kg/ha)
X4 = Ln of total material cost on the farm (kyat/ha)
X5 = Ln of total labor cost on the farm (kyat/ha)
X6 = Ln of price of groundnut with shell (kyat/kg)
X7 = Access to credit (dummy variables, yes=1, no=0)
β = Unknown parameter to be estimated
ui = Disturbance term
i = 1….n

37
3.6 Empirical Model for the Factors Influenced the Groundnut Yield
The study expected from the independent variables which affected the factors
influencing for groundnut yield in the study area. In this study, the selected variables
included are sown area, schooling year of household head, seed rate, output price
received by farmers, number of total labor, total material cost and access to credit. A
complete decision of the variables specified and types of measures that have been
employed is shown in Table 3.7.
3.7 Empirical Model for the Factors Influenced the Groundnut Profit
The study expected from the independent variables which affected the factors
influencing for groundnut profit in the study area. In this study, the selected variables
included are farm experience of household head, sown area, yield, output price received
by farmers, total material cost on the farm, total labor cost on the farm and access to
credit. A complete decision of the variables specified and types of measures that have
been employed is shown in Table 3.8.

38
Table 3.7 Expected sign of the independent variables in groundnut yield
Independent Variables Unit Expected Sign
Sown area Hectare (+,-)
Schooling year Year (+,-)
Seed rate Kg/ha (+)
Price of groundnut Ks/kg (+)
Total labor Number (+)
Total material cost Ks/ha (+)
Table 3.8 Expected sign of the independent variables in groundnut profit
Independent Variables Unit Expected Sign
Farm experience Year (+,-)
Sown area Hectare (+,-)
Yield Kg/ha (+)
Total material cost Ks/ha (-)
Total labor cost Ks/ha (-)
Price of groundnut Ks/kg (+)

39
CHAPTER IV
RESULTS AND DISCUSSION
4.1 Description of Sample Groundnut Farmers
4.1.1 Socio-economic characteristics of sample groundnut farmers
Socio-economic characteristics of sample farmers collected in the study area
using structured questionnaire were showed in Table 4.1. In the study area, the average
age of the sample farmer was 52.21 years and the average experience in farming was
28.96 years. The percentage of male and female in the farm household were 60.23% and
39.77% respectively.
Education may have productive value; first, because it enables the manager of a
firm to produce larger output quantities from the same measure quantities of inputs and,
second, because it helps the manager to allocate the firm‟s resources in a cost-efficient
manner, choosing which outputs to produce, how much of each output to produce, and in
what proportions to use inputs in the production of any output. In the study area,
education level of the sample farmers was categorized into five groups. "Monastery
education" referred to the informal schooling although they could read and write.
"Primary level" referred formal schooling up to 5 years; "Secondary level" intended
formal schooling up to 9 years and "High school level" referred to the formal schooling
up to 11 years. The last "Graduate level" referred to those who had an education of
degree from college or university. The education level of farmers was assumed to make a
decision in making their farming system.
From the results of the survey, 30% of the sample farmers was in the monastery
education and 17.8% of them was in primary, the secondary education level was 33.3%
which was the highest percentage among the education level of sampled farmers. High
school education level was 15.6% and graduated level was 3.3%. Graduated level was the
lowest percentage among the education levels. The education level of sample farmer is
shown in Figure 4.1.
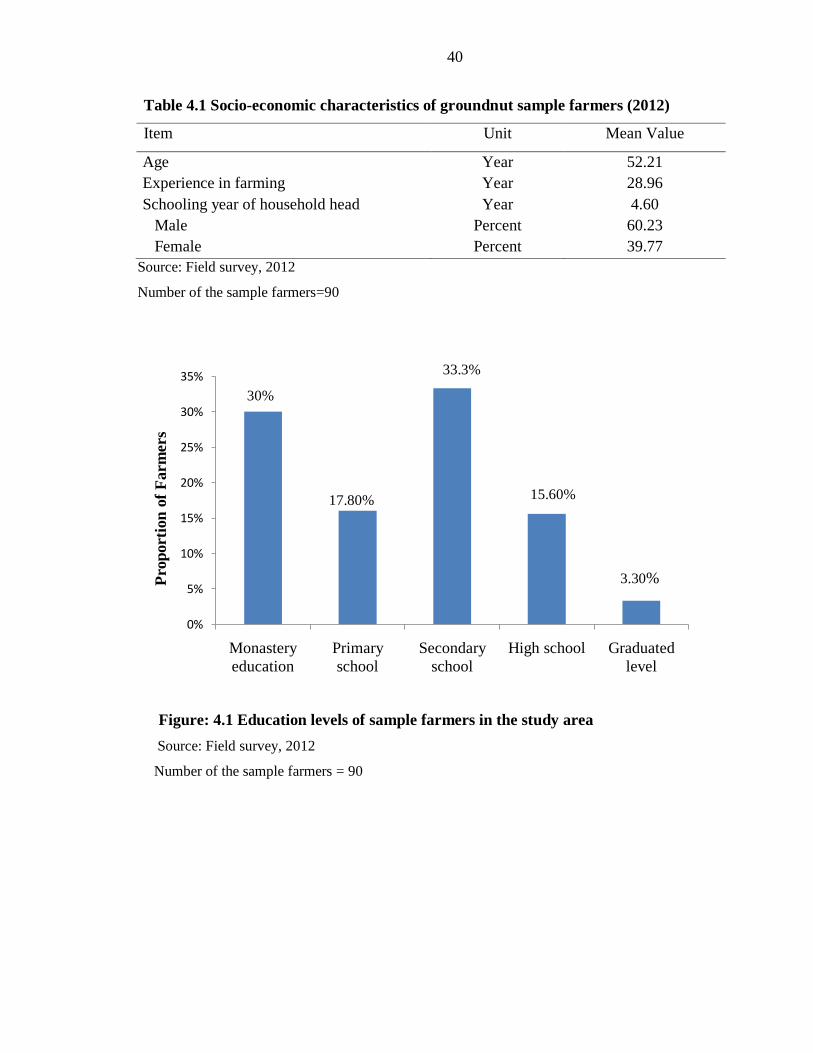
40
Table 4.1 Socio-economic characteristics of groundnut sample farmers (2012)
Item Unit Mean Value
Age Year 52.21
Experience in farming Year 28.96
Schooling year of household head Year 4.60
Male Percent 60.23
Female Percent 39.77
Source: Field survey, 2012
Number of the sample farmers=90
Figure: 4.1 Education levels of sample farmers in the study area
Source: Field survey, 2012
Number of the sample farmers = 90
0%
5%
10%
15%
20%
25%
30%
35%
Monastery
education
Primary
school
Secondary
school
High school Graduated
level
Pro
porti
on
of
Farm
ers
30%
17.80% 15.60%
3.30%
33.3%
41
4.1.2 Farming assets of the sample farmers
The farming assets of the sample farm household are shown in Table 4.2. The
sample farm household maximum possessed plough and harrow. The percentage of
plough and harrow owned by the sample farm household were 92.22% and 94.21% for
land preparation. And, the percentage of cattle and bullock cart were 88.89% and 85.56%
for transportation of crops from groundnut field to drying field and for travelling from
village to village. Then, the sample farm household owned tractor for land preparation in
crop production. The percentage of the tractor was 12.22%. The percentage of sprayer
and motorcycle owned by the sample farm household were 71.11% and 72.22%.
Moreover, the sample farm household minimum possessed seeder, pump, car, pig and
chicken. The percentage of seeder, pump, car, pig and chicken were 1.11%, 5.56%,
2.22%, 3.3%, and 23.33%.
4.1.3 Average size of land holding, sown area and average yield of groundnut in the
study area
The production of groundnut depends on the land holding size. The farmer who
possesses the larger sown area can produce more groundnuts. In the survey area, the
larger land holding capacity can be found in groundnut farmers with the average size of
5.68 hectares, ranging from 0.61 to 18.22 hectares. The average groundnut sown area of
sample farmers was 2.06 hectares ranging from 0.40 hectare to 10.12 hectares. The
average yield of groundnut basket per acre was about 80 baskets of groundnut with shell
ranging from 55 baskets to 110 baskets and the average yield of groundnut kilogram per
hectare was about 2,256 kilograms ranging from 1,541 kilograms to 3,082 kilograms.

42
Table 4.2 Farm assets of groundnut sample farmers in study area (2012)
Item Number Percent
Maximum Mean Value
Plough 8.00 2.41 92.22
Harrow 8.00 3.46 94.21
Cattle 7.00 3.18 88.89
Bullock cart 3.00 1.39 85.56
Tractor 1.00 0.12 12.22
Sprayer 5.00 1.12 71.11
Motorcycle 3.00 1.00 72.22
Pump 1.00 0.06 5.56
Car 1.00 0.02 2.22
Seeder 1.00 0.01 1.11
Pig 2 0.04 3.33
Chicken 20 2.40 23.33
Source: Field survey, 2012
N =90
Table 4.3 Average size of land holding, average sown area and average yield of
groundnut in study area
Item Unit Minimum Maximum Mean Value
Land holding hectare 0.61 18.22 5.68
Average sown area of groundnut hectare 0.40 10.12 2.06
Average yield of groundnut bsk/ac 55 110 80.54
kg/ha 1,541 3,082 2,256
Note: 1basket (bsk) of groundnut with shell = 25lb = 11.34 kg
Source: Field survey, 2012
N =90

43
4.1.4 Crop calendar and cropping pattern
In Magway Township, groundnut and sesame are grown as the main crops in
monsoon season. Farmers prepared their land and grew groundnut or sesame at the end of
April and harvested at the end of August for sesame and at the end of September for
groundnut as shown in Table 4.4. After harvesting groundnut or sesame, some of the
farmers grew winter groundnut and most of them grew pulses including green gram,
pigeon pea, cow pea and mung-bean and sorghum. Winter crops were harvested at the
end of December.
Cropping patterns mostly grown in Magway Township are shown in Table 4.5.
Among the cropping patterns, only one out of 90 sample farmers grew only rain-fed
groundnut. 11.11% of sample farmers grew rain-fed groundnut followed by sorghum and
31.11% followed by pulses. Rain-fed groundnut followed by winter groundnut was
mainly grown by 44.44% of sampled farmers. Rain-fed sesame followed by pulses was
grown by 27.78% of sample farmer. Twenty percent of sample farmers grew rain-fed
sesame followed by sorghum. Rain-fed sesame followed by winter groundnut was grown
by 35.56% of sample farmers. This was being the second most cropping pattern. 4.44%
of farmers grew rain-fed groundnut intercropped with pigeon pea followed by winter
groundnut and 5.56% of farmers grew rain-fed groundnut intercropped with pigeon pea
followed by pulses.

44
Table 4.4 Crop calendar grown different crops in the study area
Crops Jan Feb Mar April May June July Aug Sep Oct Nov Dec
Rainy
Groundnut
Sesame
Winter
Groundnut
Pulses
Sorghum
Pigeon pea
Source: DOA ( Magway), 2012
Table 4.5 Percent of sample farmers for each cropping pattern in the study area
Rainy Season Winter Season Frequency Percent
RGN - 1 1.11
RGN SG 10 11.11
RGN PS 28 31.11
RGN WGN 40 44.44
RFS PS 25 27.78
RFS SG 20 22.22
RFS WGN 32 35.56
RGN +PP WGN 4 4.44
RGN +PP PS 5 5.56
Total 165 183.33
Source: Field survey, 2012
N = 90
RGN= rain-fed groundnut, RFS = rain-fed sesame, PS = pulses, SG = sorghum, WGN = winter
groundnut, PP = pigeon pea

45
4.1.5 Different groundnut varieties grown by sample farmers
Myanmar has many varieties of groundnut; the nomenclature varies from region
to region. In the study area, the average groundnut sown area of farmers was 2.06
hectares ranging from 0.40 hectare to 10.12 hectares. Most of the farmers used 56.04
kilograms of seed per hectare. A few farmers used 42.03 kilogram of seed per hectares.
The average seed price was 3,531 kyat per kilogram and average seed cost was 195,154
kyats per hectare in Magway Township.
In Magway Township, there are many varieties of groundnut such as Magway
(11), Magway (12), Magway (15), Tontarni, Kyaung Kone Pin Pyant, Sinpadaythar (8),
Sinpadaythar (7). Among these varieties, most farmers grew Tontarni and Magway (12).
In the study area, Tontarni are mostly grown because this variety is favorable for this
region and resistance to disease and pest. Moreover Tontarni gets the higher yield than
other varieties in this region. The most important point is that there was little effect on
climate change. The number and percentage of farm households who grew the different
varieties are presented in Table 4.6. Among 90 sampled farmers, 85.56% of farmers grew
Tontarni and there was 8.89% of farmers who grew Magway (12). Sinpadaythar (8) was
grown by 5.56% of farmers.
4.1.6 Application of fertilizer in groundnut production
It was found that most farmers applied organic or chemical fertilizer in their
groundnut production (Table 4.7). They usually put manure in their land during land
preparation period and chemical fertilizer in three weeks after planting. Farm yard
manure (FYM), especially cow dung was used as the organic fertilizer and compound
fertilizer was mainly used as the inorganic fertilizer. All sampled farmers in Magway
used FYM as basal application at the time of land preparation. The average rate of FYM
application in sample household was 5.05 metric ton per hectare (MT/ha). The maximum
rate of FYM was 8.65 metric ton per hectare (MT/ha) and the minimum rate was 2.47
metric ton per hectare (MT/ha). The average cost of FYM was 25,429 kyats per hectare
(Ks/ha). The average rate of compound fertilizer in sample household was 74.13
kilogram per hectare (Kg/ha). The maximum rate and minimum rate of compound
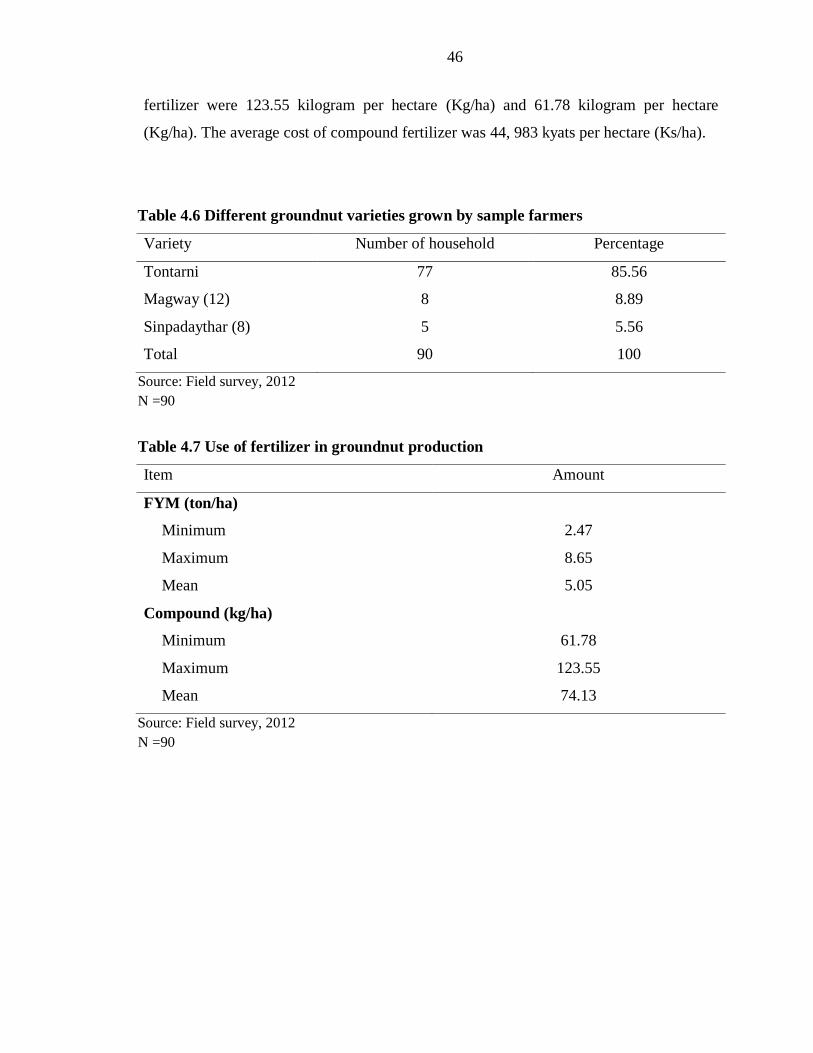
46
fertilizer were 123.55 kilogram per hectare (Kg/ha) and 61.78 kilogram per hectare
(Kg/ha). The average cost of compound fertilizer was 44, 983 kyats per hectare (Ks/ha).
Table 4.6 Different groundnut varieties grown by sample farmers
Variety Number of household Percentage
Tontarni 77 85.56
Magway (12) 8 8.89
Sinpadaythar (8) 5 5.56
Total 90 100
Source: Field survey, 2012
N =90
Table 4.7 Use of fertilizer in groundnut production
Item Amount
FYM (ton/ha)
Minimum 2.47
Maximum 8.65
Mean 5.05
Compound (kg/ha)
Minimum 61.78
Maximum 123.55
Mean 74.13
Source: Field survey, 2012
N =90
47
4.1.7 Insecticide, fungicide and foliar application in groundnut production
For crop protection, farmers applied insecticide, fungicide and foliar in crop
season by using sprayer for groundnut production in the study area. The maximum and
average rates of insecticide were 4.94 liter per hectare (Liter/ha) and 0.94 liter per hectare
(Liter/ha). Most of the farmers sprayed foliar fertilizers such as Moralmone, Shwe Tonic,
Armo, Comet and W.Tonic. A few farmers used fungicide. The maximum rate of
fungicide was 1.24 liter per hectare (Liter/ha). The maximum rates of foliar fertilizer was
2.47 liter per hectare (Liter/ha) (Table 4.8).
4.1.8 Human labor, animal labor and machinery use in groundnut production
There are two types of labor - animal labor and human labor. For groundnut
production, there are two sources of labor such as family labor and hired labor. There are
a few sample farmers using machine for ploughing.
In the study area, land preparation generally starts at the end of April or early May
for the rainy season. Most of the farmers prepare and plough their lands with animal labor
before cultivating under rain–fed condition. And then, FYM was applied and spread by
harrowing their plots five to six times with a four or five - tooth harrow pulled by a pair
of cattle. Land preparation is needed till the soil becomes a smooth and fine structure.
The average man days of land preparation to their plots by family and hired labor
were 3.41 man days per hectare and 0.94 man days per hectare. Average number of
family labor and hired labor used by groundnut farmers were 1.01 man days per hectare
and 3.01 man days per hectare in sowing. Before sowing, farmers did making sowing
line. The average man days of making sowing line to their plots by family labor and hired
labor were 2.08 man days per hectare and 0.4 man days per hectare respectively. After
raking, leveling was done. The average man days of leveling by family labor and hired
labor were 1.7 man days per hectare and 0.64 man days per hectare. Average man days of
fertilizer application by family labor and hired labor were 3.14 man days per hectare and
3.81man days per hectare. The average man days of intercultivation were 5.19 man days
per hectare and 1.48 man days per hectare to their field by using family labor and hired
labor. To earth up, the average man days by using family labor and hired labor were 2
man days per hectare and 0.42 man days per hectare respectively. Weeding was started at
48
one month after sowing in groundnut production. Farmers in the study area cleaned
weeds at least two times in groundnut production. In the study area, average man day of
weeding were 0.74 man days per hectare and 21.42 man days per hectare in family and
hired respectively in first weeding. And in second weeding, 0.64 man days per hectare
and 13.52 man days per hectare were done by family and hired labor. Harvesting was
differentiated in two parts such as harvest at no mature condition and harvest at over
mature condition. In harvest at no mature condition, the average amount of family and
hired labor were 9.34 man days per hectare and 49.22man days per hectare respectively.
In harvest at over mature condition, 12.7 man days per hectare and 127.75 man days per
hectare family and hired labor were used.

49
Table 4.8 Use of Insecticide, fungicide and foliar application in groundnut
production
Item Amount
Insecticide (liter/ha)
Minimum 0.00
Maximum 4.94
Mean 0.94
Fungicide (liter/ha)
Minimum 0.00
Maximum 1.24
Mean 0.15
Foliar (liter/ha)
Minimum 0.00
Maximum 2.47
Mean 1.06
Source: Field survey, 2012
N =90

50
4.1.9 Cost and return analysis
In this study, enterprise budget was used to analyze cost and return of groundnut
production in Magway Township. Variable cost of production included material input
costs, hired labor costs, family labor opportunities costs and interest on cash cost. Return
of groundnut production included the yield per acre, return from sale with average current
price of groundnut during that period. The data of the enterprise budget for groundnut
production in Magway Township was presented in Table 4.9. It was found that total
family labor cost was 88,109 kyats per hectare (Ks/ha). It cost 181,316 kyats per hectare
(Ks/ha) in farm households for hired labor. The total interest cost on cash cost was 1.5. It
was found that average gross revenue was about 1808,764 kyats per hectare (Ks/ha). The
total variable cash cost and total variable cost were about 1174,121 kyats per hectare
(Ks/ha) and 1262,231 kyats per hectare (Ks/ha). Return above variable cash cost was
634,642 kyats per hectare (Ks/ha). Return above variable cost was 546,533 kyats per
hectare (Ks/ha). Return above cash cost, return above variable cost, return per unit of
cash cost and return per unit of capital invested were used as the measurement of cost and
return analysis. The results showed that the return per unit of cash cost was 1.54 and
return per unit of capital invested was 1.4. It can be concluded that if one kyat invests on
variable cash cost, net return was about 1.54 kyats per hectare and net return for capital
invest was 1.4 kyats per hectare.
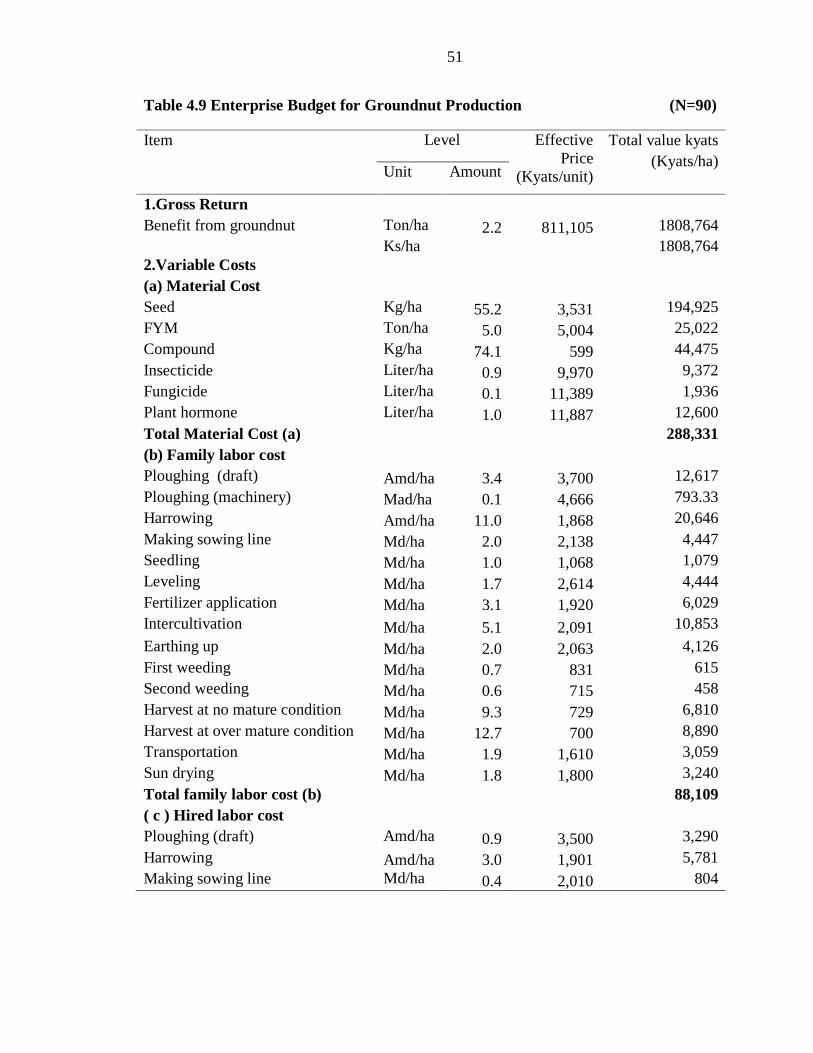
51
Table 4.9 Enterprise Budget for Groundnut Production (N=90)
Item Level Effective
Price
(Kyats/unit)
Total value kyats
(Kyats/ha)
Unit Amount
1.Gross Return
Benefit from groundnut Ton/ha 2.2 811,105 1808,764
Ks/ha 1808,764
2.Variable Costs
(a) Material Cost
Seed Kg/ha 55.2 3,531 194,925
FYM Ton/ha 5.0 5,004 25,022
Compound Kg/ha 74.1 599 44,475
Insecticide Liter/ha 0.9 9,970 9,372
Fungicide Liter/ha 0.1 11,389 1,936
Plant hormone Liter/ha 1.0 11,887 12,600
Total Material Cost (a) 288,331
(b) Family labor cost
Ploughing (draft) Amd/ha 3.4 3,700 12,617
Ploughing (machinery) Mad/ha 0.1 4,666 793.33
Harrowing Amd/ha 11.0 1,868 20,646
Making sowing line Md/ha 2.0 2,138 4,447
Seedling Md/ha 1.0 1,068 1,079
Leveling Md/ha 1.7 2,614 4,444
Fertilizer application Md/ha 3.1 1,920 6,029
Intercultivation Md/ha 5.1 2,091 10,853
Earthing up Md/ha 2.0 2,063 4,126
First weeding Md/ha 0.7 831 615
Second weeding Md/ha 0.6 715 458
Harvest at no mature condition Md/ha 9.3 729 6,810
Harvest at over mature condition Md/ha 12.7 700 8,890
Transportation Md/ha 1.9 1,610 3,059
Sun drying Md/ha 1.8 1,800 3,240
Total family labor cost (b) 88,109
( c ) Hired labor cost
Ploughing (draft) Amd/ha 0.9 3,500 3,290
Harrowing Amd/ha 3.0 1,901 5,781
Making sowing line Md/ha 0.4 2,010 804
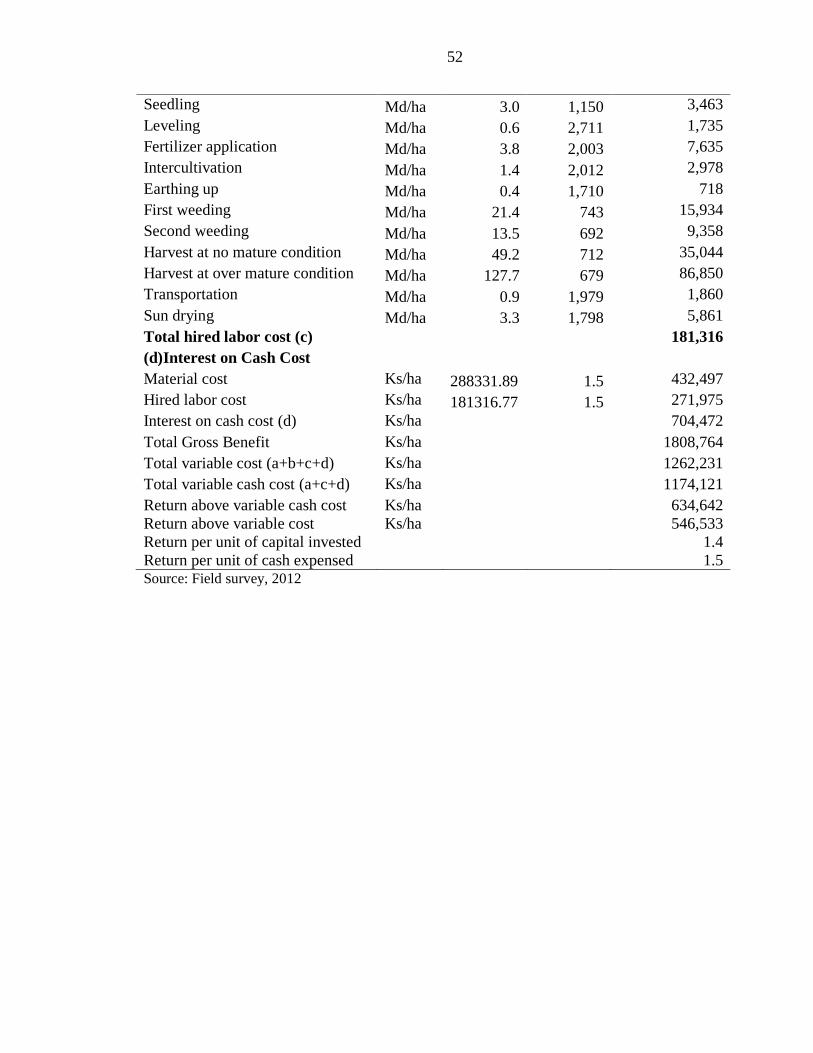
52
Source: Field survey, 2012
Seedling Md/ha 3.0 1,150 3,463
Leveling Md/ha 0.6 2,711 1,735
Fertilizer application Md/ha 3.8 2,003 7,635
Intercultivation Md/ha 1.4 2,012 2,978
Earthing up Md/ha 0.4 1,710 718
First weeding Md/ha 21.4 743 15,934
Second weeding Md/ha 13.5 692 9,358
Harvest at no mature condition Md/ha 49.2 712 35,044
Harvest at over mature condition Md/ha 127.7 679 86,850
Transportation Md/ha 0.9 1,979 1,860
Sun drying Md/ha 3.3 1,798 5,861
Total hired labor cost (c) 181,316
(d)Interest on Cash Cost
Material cost Ks/ha 288331.89 1.5 432,497
Hired labor cost Ks/ha 181316.77 1.5 271,975
Interest on cash cost (d) Ks/ha 704,472
Total Gross Benefit Ks/ha 1808,764
Total variable cost (a+b+c+d) Ks/ha 1262,231
Total variable cash cost (a+c+d) Ks/ha 1174,121
Return above variable cash cost Ks/ha 634,642
Return above variable cost Ks/ha 546,533
Return per unit of capital invested 1.4
Return per unit of cash expensed 1.5
53
4.2 Characteristics of Market Participants
The term “middle-men” was applied for the one who handles a commodity
between the time it leaves the farm gate and the time it reaches the consumer. In this
study, middlemen or market intermediaries include village collectors, township
wholesalers, hullers, millers, and processor.
4.2.1 Marketed surplus, selling method and mode of transportation of the sample
farmers
Marketed surplus is defined as the groundnut sales by farmers as a proportion of
production. The marketed surplus is calculated by deducting the household consumption
and reserved seed from the total production of the sample farmers. The marketed surplus
of groundnut is shown in Table 4.10. The average production of groundnut per household
in rainy season was 4.85 metric ton and the average marketed surplus per household was
4.40 metric ton. The range of marketed surplus in rainy season per household was from
0.34 metric ton to 24.95 metric ton. The average home consumption per household was
0.01 metric ton ranging from 0.00 metric ton to 0.23 metric ton. They stored 0.51 metric
ton for reserved seed, ranging from 0.00 to 3.40 metric ton.
In ways of selling method by farmers, 100 percent of groundnut producer directly
flowed to wholesalers. In the study area, all sampled farmers directly sold groundnut with
shell to wholesalers because of very cheap transportation cost and convenient road
infrastructure.
The modes of transport used by the sample farmers were shown as percentage in
Table 4.11. The most convenient system for transportation was by truck. About 83.3% of
sampled farmers transported their groundnut by truck. But, 16.6% of farmers used
bullock cart in transportation because it was the cheapest system. Almost all the sample
farmers owned bullock cart and used in farming practices.

54
Table 4.10 Groundnut production, consumption and marketed surplus per sample
household
Per household
MT
Minimum Maximum Mean Standard
deviation
Total production 0.62 28 4.85 5.22
Household consumption 0.00 0.23 0.01 0.03
Marketed surplus 0.34 24.95 4.40 4.73
Reserved seed 0.00 3.40 0.51 0.72
Source: Field survey, 2012
N = 90
Table 4.11 Selling method and mode of transportation of sample farmers
Selling method and mode of transportation Percent
Main buyers of groundnut
Township wholesalers 100%
Mode of transport
By Truck 75 (83.3%)
By Bullock cart 15 (16.6%)
Source: Field survey, 2012
Nu = 90

55
4.2.2 General characteristics and marketing activities of township wholesalers
Along the oilseed crop marketing channel, the wholesaler played as key roles in
the distribution of crops from producers to hullers. The township wholesalers are the
main intermediaries from whom the farmers can get the price information. Township
wholesalers also have the connection with the other township wholesalers and owners of
Magway hullers and inform about the buying and selling prices. An average age of
wholesaler was 46.4 years, ranging from 39 years to 55 years when they had business
experience of 15-30 years. The business was led by the household head. The education
levels of wholesalers were high as most of them were high school levels (60%) and some
were graduate levels (40%). Age, experience and education levels of wholesalers were
shown in Table 4.12.
The township wholesaler in Magway has integrated their business with owners of
groundnut hullers. The township wholesalers in Magway sold 27.38% of the groundnut
with shell to Mandalay market, 71.43% to Magway and 1.19% to Pakokku (Table 4.13).
Most of the township wholesalers mainly sold in Magway Township because owners of
groundnut huller conducted with the township wholesalers to buy groundnut with shell.
The township wholesalers usually get the price information from the central wholesalers
in Yangon.
Type of transaction in purchasing groundnut with shell used by the wholesalers
was different as shown in Table 4.14. About 60% of the wholesalers applied cash down
payment in buying groundnut with shell and 40% used cash down payment system with
commission fees. Most of the wholesalers used cash down payment system in purchasing
of groundnut. In selling groundnut with shell, 60% of wholesalers used cash down
payment system and credit payment system. Only 40% of the wholesalers sold their
groundnut with credit payment system. Most of the wholesalers used cash down payment
system in the study area. With regard to transportation, all sample wholesalers used the
truck.

56
Table 4.12 Age, experience and education level of wholesalers
Characters Unit
Age (year)
Mean 46.4
Standard deviation 6.23
Range 39-55
Experience (year)
Mean 22.40
Standard deviation 5.73
Range 15-30
Education Level (%)
High school level 60%
Graduate level 40%
Source: Own survey, 2012
Table 4.13 Selling markets of wholesalers in Magway (%)
Market Percent
Mandalay 27.38
Magway 71.43
Pakokku 1.19
Source: Own survey, 2012
Table 4.14 Marketing activities of wholesalers
Activities Wholesalers
Type of transaction in purchasing
Use cash down payment system 3 (60%)
Use cash down payment system with commission
fees
2 (40%)
Type of transaction in selling
Only cash down payment system 3(60%)
Received half of the cash down and credit 2(40%)
Mode of transport
By truck 5 (100%)
Source: Own survey, 2012

57
4.2.3 General characteristics and marketing activities of the huller owners
Most of the owners of the groundnut hullers connected with the township
wholesalers to buy groundnut with shell. After buying, groundnut with shell was hulled
to differentiate groundnut seeds. In the hulling of groundnut, two types of groundnut
were categorized such as „Si San and Lone San‟. Si San recognized as low quality seed
mainly used for edible oil. And Lone San recognized as good quality seed. Lone San used
to produce groundnut brittle. Most of the groundnut millers bought „Si San‟ and
processors bought „Lone San‟. Price of Si San was always lower than that of Lone San
because it was low quality seed. If there was higher market price difference between
Lone San and Si San, huller owners produced more Lone San than Si San. If there was
lower market price difference between Lone San and Si San, huller owners produced
more Si San than Lone San because the cost of grading of Lone San was high. Table 4.16
showed the characteristics of huller owners.
Average age of huller owners was 31 years, ranging from 26-40 years. The
average year of market experience was 10 years, ranged from 5-15 years. Forty percent of
huller owners attained high school level and 60% was at graduate level. In the study area,
most huller owners were educated persons. Owners of the groundnut hullers in Magway
were selling two types of groundnuts such as Si San (38.10%) and Lone San (61.90%).
Si San was sold 100% to Magway millers. Lone San was sold to Mandalay (15.38%),
Monywa (23.08%), Magway (23.01%) and Muse (38.46%).
Owners of the groundnut hullers were divided into two groups accordingly to
their hulling capacity as shown in Table 4.18. The capacity of large huller could hull
from 1.68 to 3.36 metric ton of groundnut with shell per day. Therefore, 80.23% of the
sample hullers were large hullers. The capacity of small huller could hull less than 1.68
metric ton per day. Only 19.75% of the sample huller was small huller. The working
period per year of the large huller ran more than small huller. Large hullers ran for 6
months and small hullers ran for 4 months. The average hulling cost (electricity cost per
year) of the large huller was more than that of the small huller. The maintenance cost and
diesel cost of the large huller were higher than the small huller depending on hulling
period. Huller owners did not employ permanent labor. Large hullers employed daily
labor more than small hullers. The tax of the larger huller was more than the small huller.
58
Most of the huller owners faced with the problem of environment pollution such as dirt,
dust and noise coming from the groundnut hulling process. They need attention the
adverse effect on the life of many residents and may pose a future threat.
Marketing activities of the huller owners were different (4.19). Forty percent of
the huller owners bought with credit payment system. In purchasing type of transaction
by owners of groundnut huller, most of the owners employed cash down payment system
in Magway Township.
Only 20% of owners of huller sold with credit payment system in selling
groundnut seed. In the study area, most of the owners employed cash down payment
system. Modes of transportation used by owners of huller were 40% by truck. Most of the
owners used mini – truck in buying because the distance between buying place and
selling place were not far.

59
Table 4.15 Age, market experience and education level of huller
Characters Unit
Age (year)
Mean 31.8
Standard Deviation 5.67
Range 26-40
Experience (year)
Mean 10.4
Standard Deviation 3.65
Range 5-15
Education Level (%)
High School level 40%
Graduate level 60%
Source: Own survey, 2012
Table 4.16 Selling markets of Lone San in Magway
Markets Percent
Mandalay 15.38
Moneywa 23.08
Magway 23.01
Muse 38.46
Total 100
Source: Own survey, 2012
Table 4.17 Milling capacity of sample groundnut - hullers
Type and capacity Percent
Large huller
Capacity ( 1.68 – 3.36 metric ton/day) 3(80.23%)
Small huller
Capacity (< 1.68 metric ton/day) 2(19.75%)
Source: Own survey, 2012
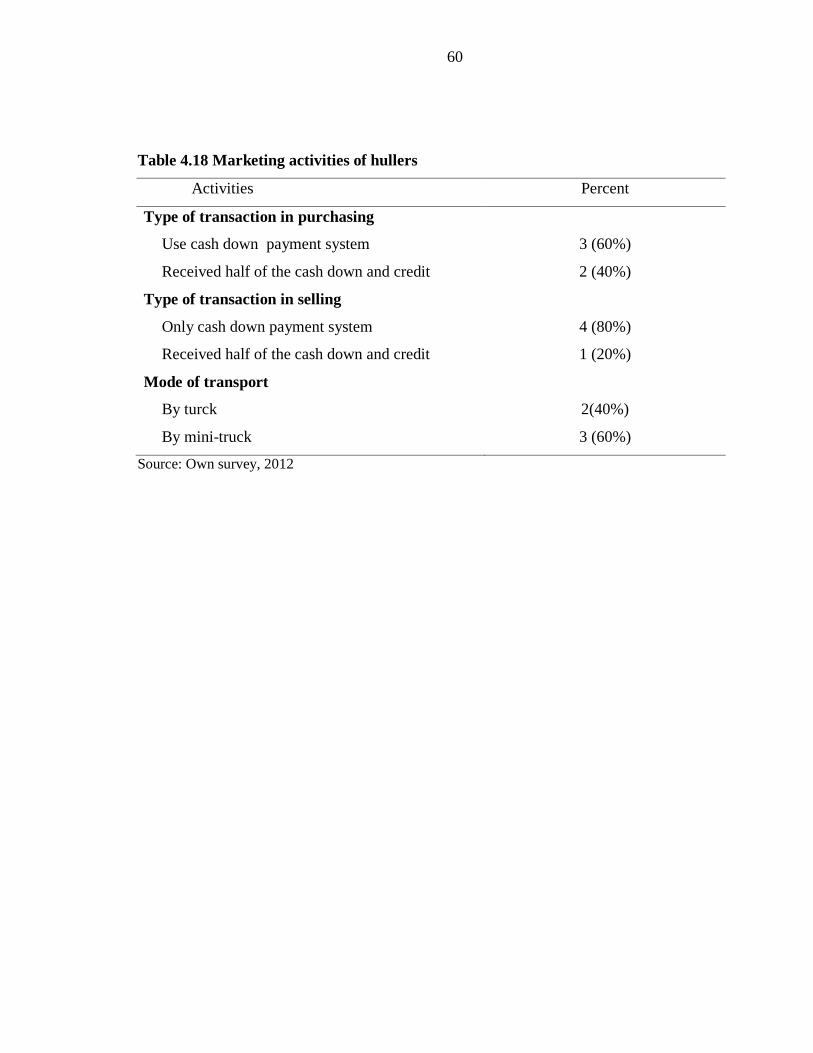
60
Table 4.18 Marketing activities of hullers
Activities Percent
Type of transaction in purchasing
Use cash down payment system 3 (60%)
Received half of the cash down and credit 2 (40%)
Type of transaction in selling
Only cash down payment system 4 (80%)
Received half of the cash down and credit 1 (20%)
Mode of transport
By turck 2(40%)
By mini-truck 3 (60%)
Source: Own survey, 2012

61
4.2.4 General characteristics and marketing activities of edible oil millers
Edible oil is the second most important daily diet of Myanmar people. The millers
play an important role in the oilseed crop marketing chain by transforming the raw
oilseed crop to edible oil. Table 4.19 showed the characteristics of the sample millers.
The average age of the miller was 46 years old and the average experience was 6.8 years,
ranging from 4-10 years of experience. In the sample millers, 60% of the millers were the
high school level and 40% at the graduate level in the study area. Therefore, millers were
educated person. The majority of oil millers were household heads. All the oil mills in the
study area were family owned and operated. Groundnut millers were connected with
groundnut huller owners in Magway Township. Groundnut millers in Magway sold
1.90% of their oil to Magway, 25.94% to Mandalay market, 52.16% to Yangon and
8.80% to Taunggyi and 11.20% to Nay Pyi Taw (Table 4.20).
Groundnut mills were categorized into two groups according to their milling
capacity (Table 4.21). The capacity of large mill could mill from 3.73 to 7.46 metric ton
of groundnut seed per day. Therefore, 80.23% of the sample mills were large mills. The
capacity of small mill could mill less than 3.73 metric ton of groundnut seed per day.
Only 28.24% of sample mills were small mills. The working hour of the small mill
depended on the availability of electricity and ranged from 10 hours to 15 hours per day.
Large millers ran their mills for 24 hour basic and they have their own generator to get
the necessary power. Large millers ran their mill for the whole year and small millers ran
their mill for 6 months to 8 months per year. Some millers integrated the business like
edible oil wholesalers in the other townships. The large and small millers got the price
information from the Yangon wholesalers. Generally they sold their products to Yangon
wholesale market. The maintenance cost of large mill was higher than that of small mill.
Large millers employed more labors than small miller. The average milling cost
(electricity per year) of the large mill was more than that of the small mill because it ran
the whole day. The tax of the large miller was comparatively larger than the small miller.
Most of the millers faced with the problems of power supply, technology and capital
investment.
Marketing activities of millers were different as shown in Table 4.22.Types of
transaction in purchasing used by millers were 80% cash down payment system and 20%

62
credit payment system with huller owners. Most of the millers bought cash down
payment system. In selling of products, millers used cash down payment system and
credit payment system and most of the millers used credit payment system. Only 40% of
the millers sold their groundnut oil with only cash down payment system. All sample
millers used the truck in transportation because of the far distance between purchasing
and selling places.

63
Table 4.19 Age, experience and education levels of millers
Characters Unit
Age (year)
Mean 46.2
Standard deviation 6.76
Range 39-55
Experience (year)
Mean 6.8
Standard deviation 2.39
Range 4-10
Education Level (%)
High school level (3) 60%
Graduate level (2) 40%
Source: Own survey, 2012
Table 4.20 Selling markets of millers in Magway
Market Percent
Magway 1.90
Mandalay 25.94
Yangon 52.16
Taungyi 8.80
Nay Pyi Taw 11.20
Total 100
Source: Own survey, 2012
Table 4.21 Milling capacity of sample groundnut - mills
Type and capacity Percent
Large mill
Capacity ( 3.73- 7.46 groundnut seed metric ton /day) 3(84.87%)
Small mill
Capacity (< 3.73 groundnut seed metric ton/day) 2(28.24%)
Source: Own survey, 2012
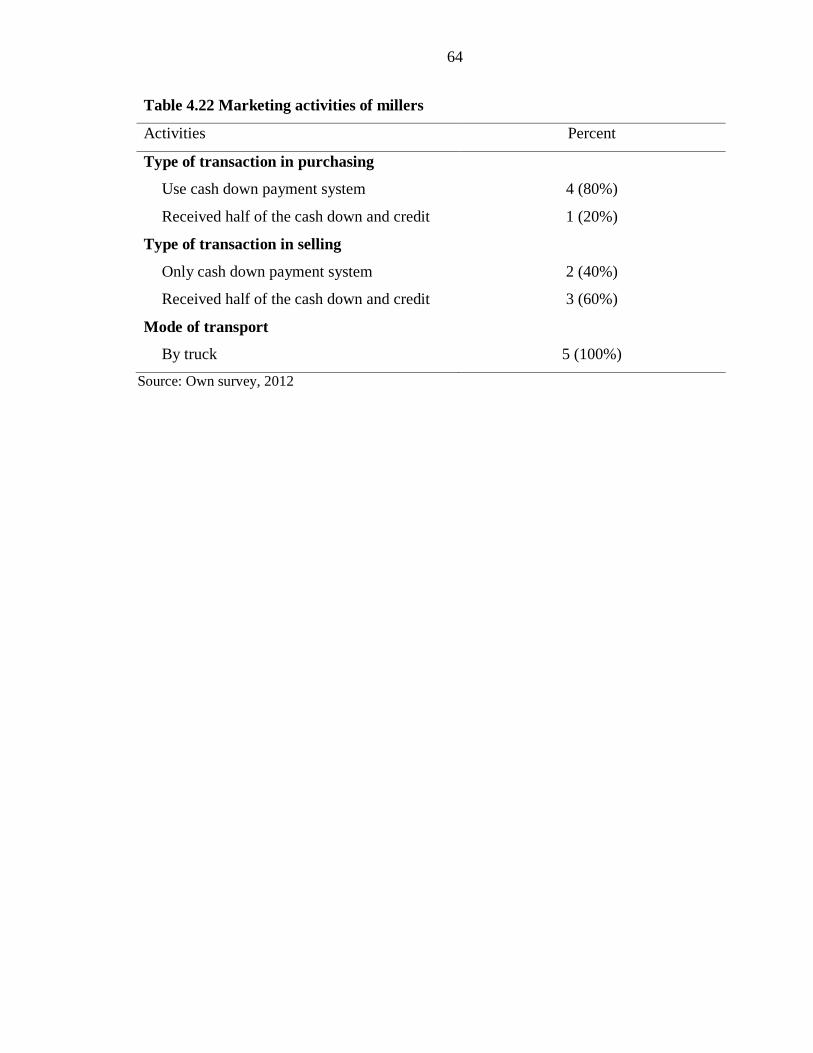
64
Table 4.22 Marketing activities of millers
Activities Percent
Type of transaction in purchasing
Use cash down payment system 4 (80%)
Received half of the cash down and credit 1 (20%)
Type of transaction in selling
Only cash down payment system 2 (40%)
Received half of the cash down and credit 3 (60%)
Mode of transport
By truck 5 (100%)
Source: Own survey, 2012

65
4.2.5 General characteristics and marketing activities of the groundnut brittle
processor
The general characteristic of manager was shown in Table 4.23. The age of the
manager was 43 years. And the market experience was nearly 10 years and the manager
was educated. And processing factory was established since last 15 years. Processor sold
50% of total produced groundnut brittle package in Magway, 20% to Mandalay market
and 30% to Yangon. Half of the product was sold in Magway Township. Marketing
activities of the processor were shown in Table 4.24.
Processing capacity and marketing activities of the groundnut processor was
shown in Table 4.25. Groundnut processing factory could produce 4,000 groundnut
brittle packages per day. The processing factory ran for the whole year and the working
hour was 15 hours per day. In processing factory, there were 5 permanent labors and 40
daily labors. The tax of the processor was comparatively larger than wholesalers, owners
of hullers and millers. The groundnut processor employed only cash down payment
system in purchasing groundnut seed (Lone San, good quality seed). In selling groundnut
brittle, both types of selling (cash down payment system and credit payment system)
were used. With regard to transportation, trucks were used because of the far distance
between buying and selling places.
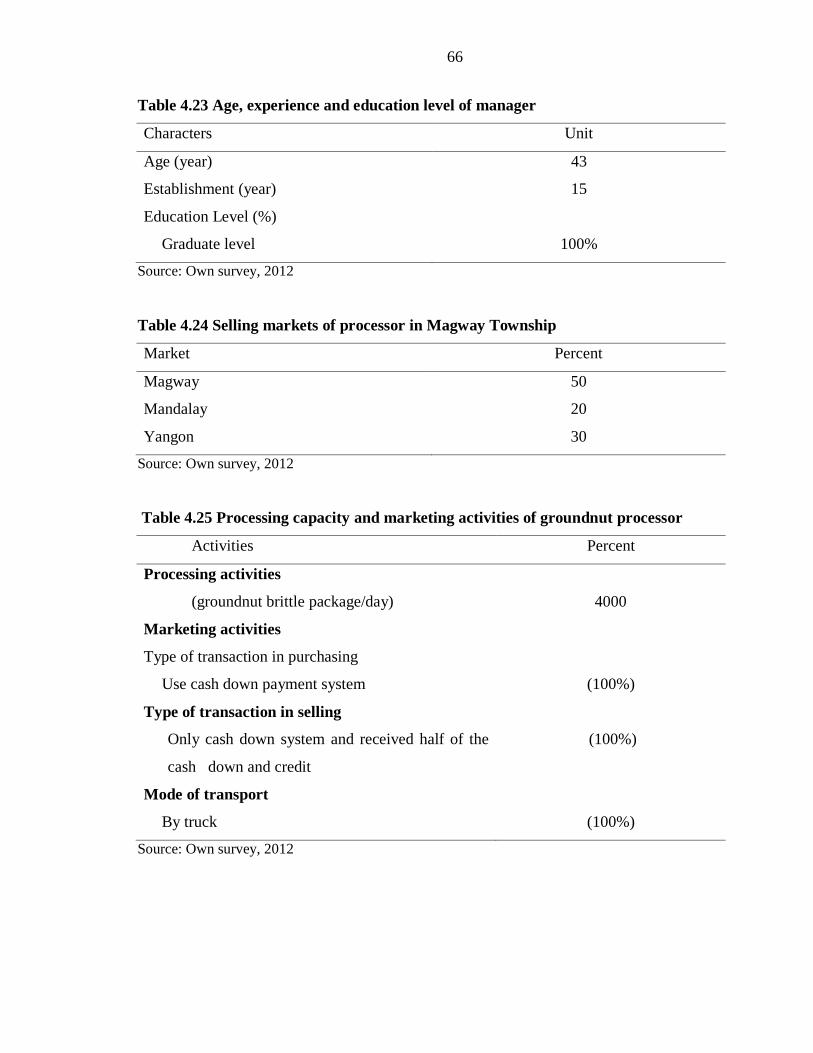
66
Table 4.23 Age, experience and education level of manager
Characters Unit
Age (year) 43
Establishment (year) 15
Education Level (%)
Graduate level 100%
Source: Own survey, 2012
Table 4.24 Selling markets of processor in Magway Township
Market Percent
Magway 50
Mandalay 20
Yangon 30
Source: Own survey, 2012
Table 4.25 Processing capacity and marketing activities of groundnut processor
Activities Percent
Processing activities
(groundnut brittle package/day) 4000
Marketing activities
Type of transaction in purchasing
Use cash down payment system (100%)
Type of transaction in selling
Only cash down system and received half of the
cash down and credit
(100%)
Mode of transport
By truck (100%)
Source: Own survey, 2012

67
4.3 Groundnut Marketing Channel in Magway Township
The analysis of groundnut marketing channel was intended to demonstrate the
groundnut flow from farmers to ultimate consumers in the study area. Groundnut
marketing channel in Magway Township was shown in Figure 4.2. In Magway
Township, most of the farmers sold their product (groundnut with shell) to the township
wholesalers. The average marketed surplus of sample farm households was 89.41% of
their production. Therefore, 10.47% of their production was used for household
consumption and seed purpose. According to the farmer survey, township wholesalers
had the highest potential for getting groundnut with shell directly from farmers in the
study area. Township wholesalers bought groundnut with shell from the villages around
Magway Township. The sample farmers sold 100% of their marketed surplus to township
wholesalers. Wholesalers traded 27.38% of their groundnut to Mandalay, 71.43% to
Magway and 1.19% to Pakokku. Most of the township wholesaler mainly sold groundnut
with shell to huller owners in Magway. Huller owners hulled groundnut with shell and
sold two types of groundnut seeds such as Si San (38.10%) and Lone San (61.90%). Si
san sold 100% to Magway millers to produce groundnut oil. Lone San was traded to
Mandalay (15.38%), Monywa (23.08%), Magway (23.01%) and Muse (38.46%). Among
them, buyers from Muse were the main. Lone San was used to make processing. Edible
oil millers in Magway traded 1.90% of their oil to Magway, 25.94% to Mandalay market,
52.16% to Yangon and 8.80% to Taunggyi and 11.20% to Nay Pyi Taw. Main buyers of
edible oil from Yangon market. On the other hand, groundnut brittle processor traded
50% of their groundnut brittle packages in Magway market, 20% to Mandalay market
and 30% to Yangon. So, groundnut brittle was mainly sold in Magway Township.

68
Groundnut with shell
Groundnut seed
Groundnut oil
Groundnut brittle
Consumption and
seed (10.47%)
Marketed surplus of
farmer (89.41%)
Township wholesaler
Mandalay market
(27.38%)
Owners of huller in Magway
(71.43%)
Pakokku market
(1.19%)
Si san (low quality seed) (38.10%)
Miller in Magway
Magway
(1.90%)
Mandalay
(25.94%)
Yangon
(52.16%
)
Taunggyi
(8.80%)
Lone san (good quality seed) (61.90%)
Mandalay
(15.38%)
Monywa
(23.08%)
Magway Processor
(23.01%)
Muse
(38.46%)
Nay Pyi Taw
(11.2%)
Magway
(50%)
Mandalay
(20%)
Yangon
(30%)
100%
100%
%
Figure 4.2 Groundnut marketing channel in Magway Township
Groundnut oil
Groundnut brittle
Groundnut with shell
Groundnut seed

69
4.4 Marketing Margin, Cost and Profit of Middlemen
The services of various agencies constituting in a marketing channel are
remunerated out of the marketing “margin”. This term is used to denote the difference
between the price paid to the first seller and that paid by the final buyer (Kohls, 2002).
Trends in commodity prices and domestic marketing margins are important
indicators of market performances. In this section the marketing margins of groundnut is
examined. The marketing costs and margins are calculated for main agents in marketing
channels such as town wholesalers, hullers, millers and processors in the groundnut crop,
groundnut seed such as Si San and Lone San, edible oil and groundnut brittle marketing
chain.
At this stage of marketing functions, the wholesale‟s margin was the difference
between the price paid by the wholesale trader and selling price to hullers or whoever of
market participants. The huller owners margin was the difference between the huller
owners paid price and selling price to market participant. The edible oil miller‟s margin
was the deduction of the groundnut seed (Si San) price paid by the miller from obtained
value of groundnut oil. The processor‟s margin was the difference between the prices
paid by the processor from obtained value of groundnut brittle.
In the marketing channel, the commodity types handled by the middlemen are
different. For example, the wholesalers handle the commodity as crops, the processor
handle the commodity as groundnut brittle and the millers handle the commodity as
edible oil. And the hullers handle the commodity as the groundnut seed. Groundnut seed
are differentiated into two types such as Lone San and Si San. Therefore, the percentage
of profit per cost price was used in this study to compare the performance of
intermediaries which also means return on investments (Table 4.26 - 4.30). By using
percentage of profit per cost price, the one can get the highest profit. The millers do the
business of processing and selling the edible oil. The processor does the business of
processing and selling the groundnut brittle. When the profit per cost price among the
middlemen were calculated and compared, the processor got the percent of profit per cost
price about 71.13%. It was the highest achievement in the marketing channel. On the
other hand, even the processor got the highest profit in their business; they had to invest
70
the highest marketing cost in payment for storing, processing and other service costs and
taxes.
The groundnut farmers got the percent of profit per cost price about 6.9%. The
groundnut wholesalers got the percent of profit per cost price about 7.9%. The groundnut
hullers got the profit per cost price about 38.3%. And the groundnut millers got the
second largest profit per cost price about 59.8%.

71
Table 4.26 Cost and profit of groundnut farmers
Farmer Kyat/kg
(1) Selling price of groundnut 811.09
(2) Unit cost of groundnut 758.49
(3) Average profit of the farmers (1-2) 52.6
(4) Profit per cost price (3/2) 6.9%
Source: Field survey, 2012
Table 4.27 Marketing margin, cost and profit of groundnut wholesalers
Wholesaler Kyat/kg
(1) Buying price of groundnut 846.56
(2) Selling price of groundnut 925.19
(3) Marketing Margin (2-1) 78.63
(4) Total Marketing Cost 10.51
Cost of transportation 2.29
Cost of Labor 7.22
Tax 1.00
(5) Cost price (1+4) 857.07
(6) Profit per unit of crops (3-4) 68.12
(7) Profit per cost price (6/5) 7.94%
Source: Own survey, 2012
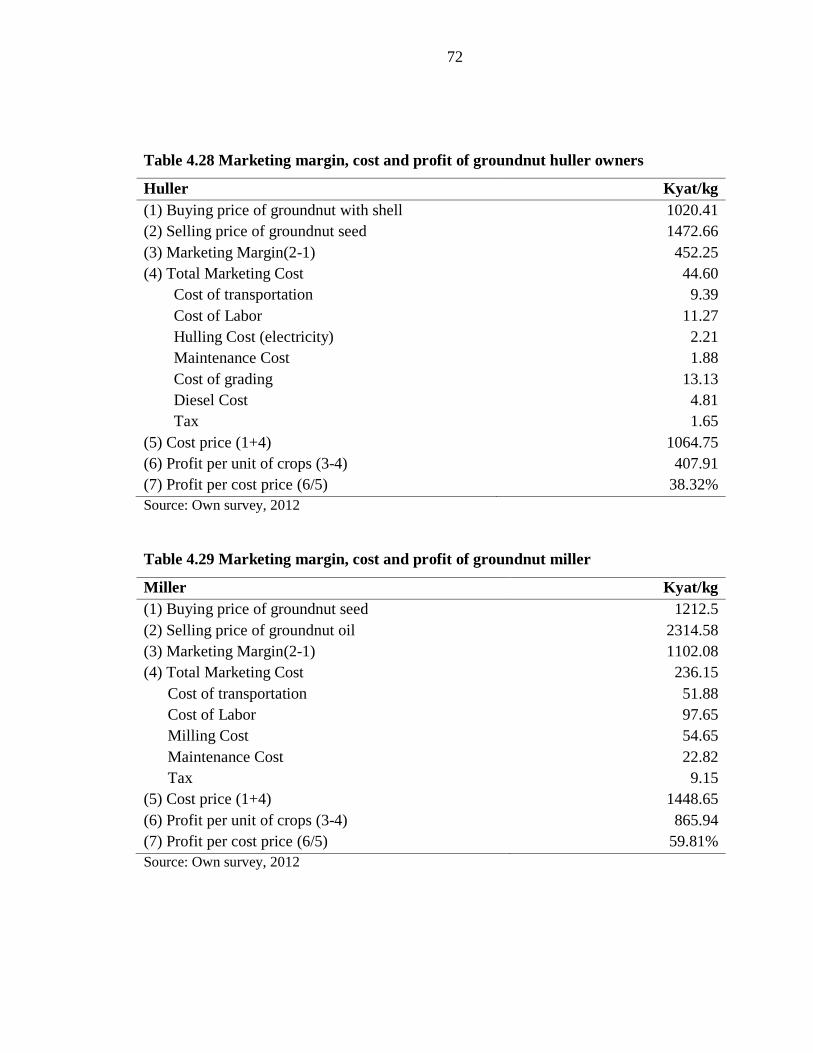
72
Table 4.28 Marketing margin, cost and profit of groundnut huller owners
Huller Kyat/kg
(1) Buying price of groundnut with shell 1020.41
(2) Selling price of groundnut seed 1472.66
(3) Marketing Margin(2-1) 452.25
(4) Total Marketing Cost 44.60
Cost of transportation 9.39
Cost of Labor 11.27
Hulling Cost (electricity) 2.21
Maintenance Cost 1.88
Cost of grading 13.13
Diesel Cost 4.81
Tax 1.65
(5) Cost price (1+4) 1064.75
(6) Profit per unit of crops (3-4) 407.91
(7) Profit per cost price (6/5) 38.32%
Source: Own survey, 2012
Table 4.29 Marketing margin, cost and profit of groundnut miller
Miller Kyat/kg
(1) Buying price of groundnut seed 1212.5
(2) Selling price of groundnut oil 2314.58
(3) Marketing Margin(2-1) 1102.08
(4) Total Marketing Cost 236.15
Cost of transportation 51.88
Cost of Labor 97.65
Milling Cost 54.65
Maintenance Cost 22.82
Tax 9.15
(5) Cost price (1+4) 1448.65
(6) Profit per unit of crops (3-4) 865.94
(7) Profit per cost price (6/5) 59.81%
Source: Own survey, 2012

73
Table 4.30 Marketing margin, cost and profit of groundnut brittle processor
Processor Kyat/kg
(1) Buying price of groundnut seed 1562.5
(2) Selling price of groundnut brittle 4416.67
(3) Marketing Margin(2-1) 2854.17
(4) Total Marketing Cost 1018.00
Cost of transportation 116.67
Cost of Labor 550.00
Storage Cost 25.00
Processing Cost 300.00
Maintenance Cost 10.00
Tax 16.67
(5) Cost price (1+4) 2580.00
(6) Profit per unit of crops (3-4) 1835.00
(7) Profit per cost price (6/5) 71.13%
Source: Own survey, 2012

74
4.5 Factors Affecting Groundnut Yield of the Selected Farm Household in
Groundnut Production in the Study Area
This section indicated the estimate results of factors affecting the groundnut yield
of the selected farm household of groundnut production in the study area. To determine
the factors affecting the groundnut yield, log linear regression function was employed.
The specific yield functions of groundnut farmers were estimated by using 7 independent
variables; sown area, schooling year, seed rate, total labor on the farm, total material cost
on the farm, price of groundnut and access to credit.
Table 4.31 showed the mean value of dependent and independent variables of
groundnut yield function. According to the descriptive statistics, average yield 2256
kilogram per hectare, mean of the schooling year about 4.64 years, average sown area
2.06 hectares, average seed rate 55.26 kilogram per hectare, average total labor on farm
64 persons and average total material cost 287,885 kyats per hectare and average price of
groundnut 3,531 kyats per kilogram were resulted.
According to the groundnut yield regression estimates, the significant influencing
factors of groundnut yield were seed rate, total labor quantity, price of groundnut and
access to credit. Groundnut yield was positively correlated with seed rate, price of
groundnut, total labor quantity and access to credit at 10%, 5% and 1% level. It means
that if seed rate one percent increase, groundnut yield will be increased 0.38%. If
groundnut price one percent increased, groundnut yield of sample farmers would be
increased 1.19%. The result showed that if farmers received higher price, they would pay
more attention in groundnut production to get high yield so price indirectly effects on
yield. If total labor on farm one percent increased in groundnut production in the study
area, groundnut yield would be increased 0.96%. If the credit received by farmers in
groundnut production one percent increased, yield of groundnut would be increased
0.19%. The result pointed out that the government should provide credit program to the
farmers in groundnut production.
The adjusted R squared points out that the model is significant and it can explain
on the variation in groundnut yield by 57 percent (Table 4.32).
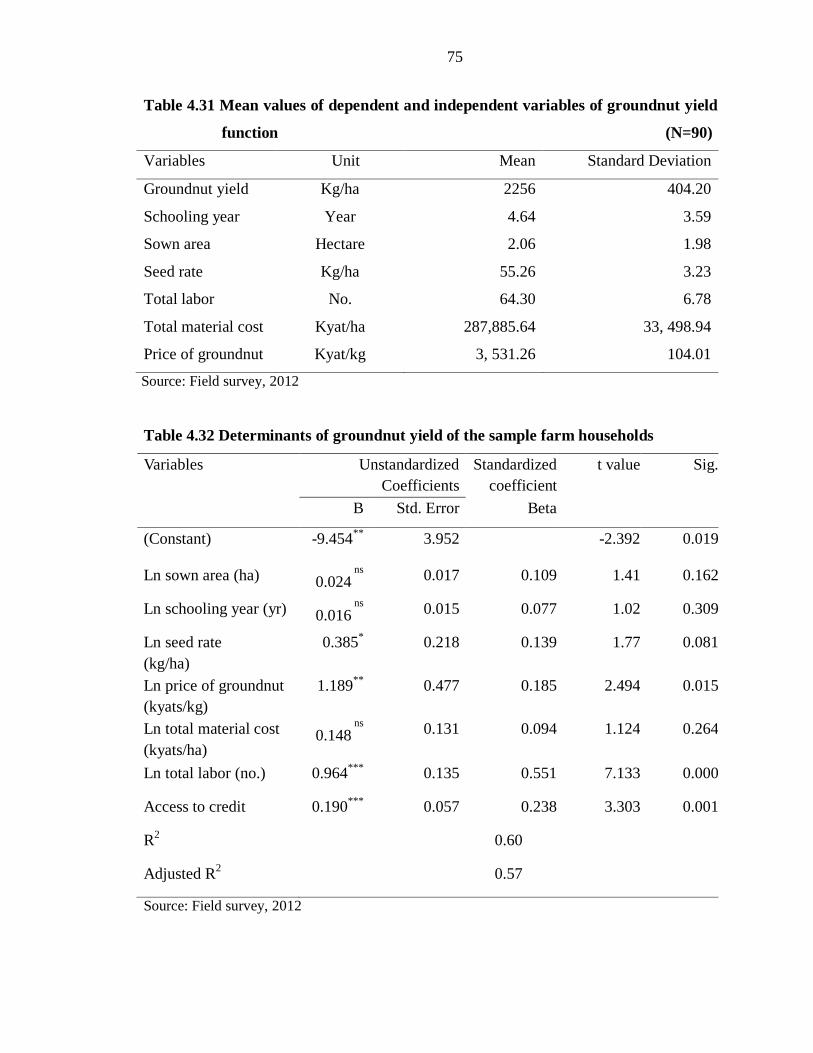
75
Table 4.31 Mean values of dependent and independent variables of groundnut yield
function (N=90)
Variables Unit Mean Standard Deviation
Groundnut yield Kg/ha 2256 404.20
Schooling year Year 4.64 3.59
Sown area Hectare 2.06 1.98
Seed rate Kg/ha 55.26 3.23
Total labor No. 64.30 6.78
Total material cost Kyat/ha 287,885.64 33, 498.94
Price of groundnut Kyat/kg 3, 531.26 104.01
Source: Field survey, 2012
Table 4.32 Determinants of groundnut yield of the sample farm households
Variables Unstandardized
Coefficients
Standardized
coefficient
t value Sig.
B Std. Error Beta
(Constant) -9.454**
3.952 -2.392 0.019
Ln sown area (ha) 0.024 ns
0.017 0.109 1.41 0.162
Ln schooling year (yr) 0.016 ns
0.015 0.077 1.02 0.309
Ln seed rate
(kg/ha)
0.385*
0.218 0.139 1.77 0.081
Ln price of groundnut
(kyats/kg)
1.189**
0.477 0.185 2.494 0.015
Ln total material cost
(kyats/ha) 0.148
ns 0.131 0.094 1.124 0.264
Ln total labor (no.) 0.964***
0.135 0.551 7.133 0.000
Access to credit 0.190***
0.057 0.238 3.303 0.001
R2
0.60
Adjusted R2
0.57
Source: Field survey, 2012

76
4.6 Factors Affecting Groundnut Profit of the Selected Farm Household in
Groundnut Production in the Study Area
This section indicated the estimate results of factors affecting on the groundnut
profit of the selected farm household of groundnut production in the study area. To
determine the factors affecting the groundnut profit, log linear regression function was
employed. The specific profit functions of groundnut farmers were estimated by using 7
independent variables; farm experience, sown area, yield, total labor cost on the farm,
total material cost on the farm, price of groundnut and access to credit.
The mean value of dependent and independent variables of groundnut profit
function were shown in Table 4.33. According to the descriptive statistics, average profit
of the sample farm household 574,720 kyats per hectare, average of the farm experience
about 28.96 years, average sown area 2.06 hectare, average yield 2,256 kilogram per
hectare, average total labor cost on farm 269,123.19 kyats per hectare and average total
material cost 287,885.64 kyats per hectare and average price of groundnut 3,531.25 kyats
per kilogram were observed.
According to the groundnut profit regression estimates, groundnut profit of the
sample farm households was positively and significantly influenced by yield at 1 percent
level. According to the regression estimates, if one percent increased in yield, the
groundnut profit will be increased 3.76%. The result showed that the farmers who had got
the highest yield can receive more profit because yield greatly affected on profit. The
total material cost of the sample farm household negatively and significantly influenced
on profit at 5 percent level. It means that if one percent increased in total material cost on
the farm in the study area, the groundnut profit will be decreased 2.09%. The result
showed that the farmers who had suffered high cost of material inputs in groundnut
production can receive low profit.
The adjusted R squared points out that the model is significant and it can explain
on the variation in groundnut profit by 45 percent (Table 4.34).
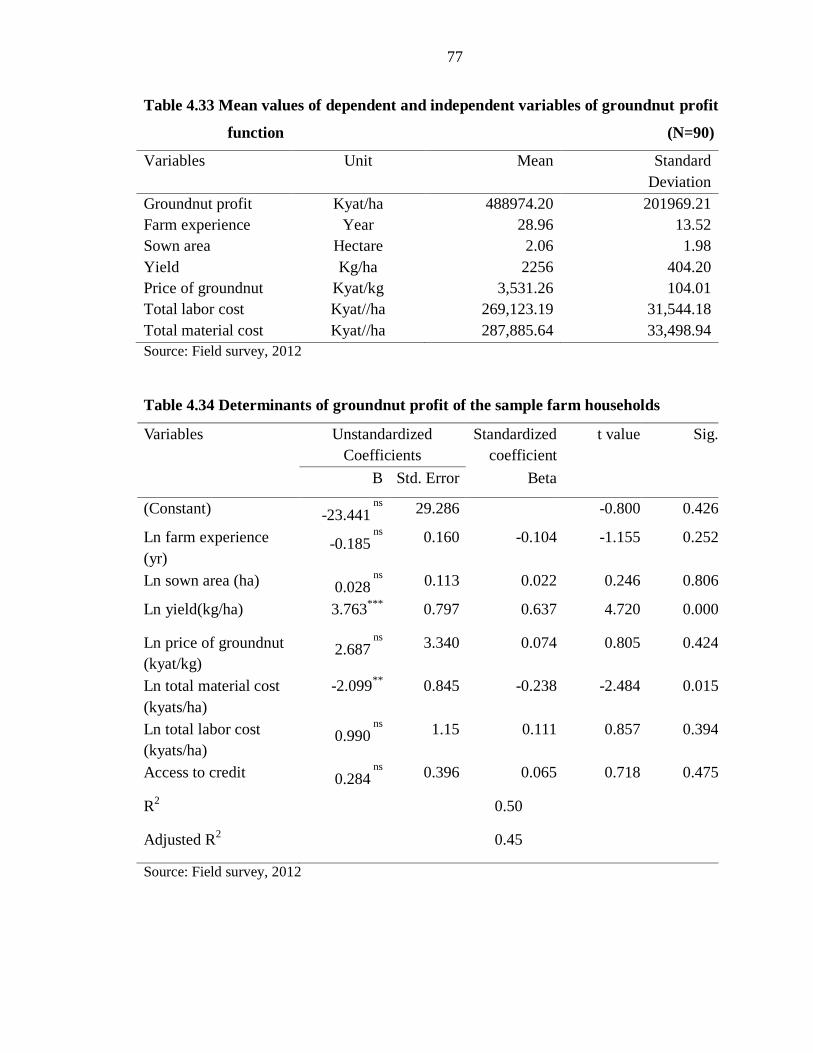
77
Table 4.33 Mean values of dependent and independent variables of groundnut profit
function (N=90)
Variables Unit Mean Standard
Deviation
Groundnut profit Kyat/ha 488974.20 201969.21
Farm experience Year 28.96 13.52
Sown area Hectare 2.06 1.98
Yield Kg/ha 2256 404.20
Price of groundnut Kyat/kg 3,531.26 104.01
Total labor cost Kyat//ha 269,123.19 31,544.18
Total material cost Kyat//ha 287,885.64 33,498.94
Source: Field survey, 2012
Table 4.34 Determinants of groundnut profit of the sample farm households
Variables Unstandardized
Coefficients
Standardized
coefficient
t value Sig.
B Std. Error Beta
(Constant) -23.441 ns
29.286 -0.800 0.426
Ln farm experience
(yr) -0.185
ns
0.160 -0.104 -1.155 0.252
Ln sown area (ha) 0.028 ns
0.113 0.022 0.246 0.806
Ln yield(kg/ha) 3.763***
0.797 0.637 4.720 0.000
Ln price of groundnut
(kyat/kg) 2.687
ns
3.340 0.074 0.805 0.424
Ln total material cost
(kyats/ha)
-2.099**
0.845 -0.238 -2.484 0.015
Ln total labor cost
(kyats/ha) 0.990
ns
1.15 0.111 0.857 0.394
Access to credit 0.284 ns
0.396 0.065 0.718 0.475
R2
0.50
Adjusted R2
0.45
Source: Field survey, 2012

78
4.7 Constraints of Groundnut Production and Marketing of Sample Farmers
When the farmers were asked about the constraints and problems of groundnut
production, they responded to the problems as indicated in Table 4.35. There were seven
questions as the constraints concerning with insufficient of availability of credit,
insufficient of capital investment, lack of contact with extension worker, serious pest
infection, high transportation cost, high input cost and lack of market information.
Among seven problems, 83.33% of the total farmers answered that they did not receive
adequate credit for growing groundnut crop. About 77.78% of the total farmers expressed
that they required capital investment. About 55.56% of the total farmers expressed that
they did not receive extension contact for growing groundnut crop. The problems of
serious pest infection, high input cost, high transportation cost and lack of market
information were faced by 11.11%, 23.31% and 24.42%, 3.33% of the total farmers
respectively.

79
Table 4.35 Constraints of groundnut production and marketing in the study area
No Description No of household Percentage
1 Insufficient of availability of credit 75 83.33
2 Insufficient of capital investment 70 77.78
3 Lack of contact with extension worker 50 55.56
4 High transportation cost 22 24.42
5 High input cost 21 23.31
6 Serious pest infection 10 11.11
7 Lack of market information 3 3.33
Source: Field survey, 2012
N = 90

80
CHAPTER V
CONCLUSION AND POLICY IMPLICATION
5.1 Conclusion of the Study
5.1.1 Descriptive analysis of the sample farmers
In the study area, most of the farmers had extensive farming experience. Among
the education level, the secondary education level was the highest percentage and
graduate level was the lowest percentage. Most sampled farm household maximum
possessed plough and harrow. Few sampled farm household possessed seeder, pump car,
pigs and chicken. In the survey area, the larger land holding capacity was found in
groundnut farmers with the average size of 5.68 hectares. The average groundnut sown
area of sample farmers was 2.06 hectares. The average yield of groundnut per acre was
about 80 baskets. Average yield of groundnut in the study area (80bsk/acre) was higher
than the national target yield. Among the cropping patterns, Forty four percent of farmers
mostly grew rain-fed groundnut followed by winter groundnut. Rain-fed sesame followed
by winter groundnut was grown by 35.56% of sample farmer. This was being the second
most cropping pattern. About 77% farmers grew Tontarni because this variety was
favorable for this region and resistance to disease and pest. Moreover Tontarni got the
highest yield than other varieties in this region.
The use of average rate compound fertilizer was 74.13 kilogram per hectare. And,
all of the sampled farmers used pesticide, fungicide and foliar. Enterprise budget was
used to compare the cost and return of groundnut growing farmers. Accordingly to the
result of cost and return analysis, groundnut farmers received the return per unit of capital
invested was 1.4.

81
5.1.2 General characteristics of market participants
Among the market participants, the mean age of wholesalers, millers and
processing manager were above 40 years old. However, the mean age of the huller
owners was above 30 years old. Wholesalers had relatively more working experience
than huller owners, millers and processors. Mostly, millers and processors had 10 years
of experience in groundnut marketing. Most of the market participants obtained high
school level education and some of the owners of huller and processors were graduates.
Huller owners and millers used different types of purchasing such as cash down payment
system and received half of the cash down and credit. In purchasing, processor used only
cash down payment system. In selling, wholesalers, hullers, millers and processors used
different types of selling such as only cash down payment system and received half of the
cash down and credit. Most of the market participants used truck for transportation.
Moreover owners of the huller also used mini- truck.
5.1.3 Marketing channel in the study area
There are five types of marketing channel in the study area; (1) farmer, (2)
township wholesalers, (3) huller owners, (4) miller and (5) processor. In the supply
chain analysis, most of the sampled farmers in the study area sold groundnut with shell
directly to township wholesaler. Therefore, groundnut with shell marketing was mainly
occurred in the local market. Township wholesalers traded their groundnut with shell to
Mandalay, Magway and Pakokku. Most of the township wholesalers mainly traded in
Magway market to sell for huller owners. Huller owners made hulling groundnut with
shell and sold two types of groundnut seeds such as Lone San (good quality seed) used
to make groundnut processing and Si San (low quality seed) used to make groundnut oil.
Si San was sold 100% to Magway miller. Lone san was sold in Mandalay, Monywa,
Magway and Muse. When Lone San was traded, buyers from Muse was the main
clients. Miller traded their groundnut oil to Magway, Mandalay, Yangon, Taunggyi and
Nay Pyi Taw. There was no local consumption for groundnut oil. Most of the millers
mainly sold groundnut oil to Yangon market. Processor traded their groundnut brittle
package to Magway, Mandalay market and Yangon. Among these markets, processors
mainly distributed their groundnut brittle package to Magway Township.

82
5.1.4 Marketing margin, cost and profit of market participants
Among the market participants, the wholesalers handled the commodity as crops,
the owner of hullers handled the groundnut seeds (Si San and Lone San), the millers
handled the commodity as edible oil and the processor handled the commodity as
groundnut brittle. Among the market participants, marketing margin of township
wholesaler got the lowest margin. When the profit per cost price among the market
participants was calculated and compared, the processor got the highest achievement in
the marketing channel. On the other hand, even the processors got the highest profit in
their business; they had to invest the highest marketing cost in payment for storing,
processing and other service costs and taxes. And the groundnut millers got the second
largest profit per cost price.
5.1.5 Constraints of groundnut production of the sampled farm households
There were seven major constraints of groundnut production and marketing of the
sampled farm households. The most serious constraints of sampled farm households were
insufficient of availability of credit, insufficient of capital investment and lack of contact
with extension workers in groundnut production. The major constraints for the huller
owners faced with environment pollution such as dirt, dust and noise coming from the
groundnut hulling process. The major constraints of millers faced with the problem of
power supply, technology and capital investment.
5.1.6 Regression analysis
Accordingly to the groundnut yield regression estimates, the significant
influencing factors of groundnut yield were seed rate, total labor quantity, price of
groundnut and access to credit. Groundnut yield was positive relationship with seed rate,
price of groundnut, total labor quantity and access to credit. Other things being equal, if
one percent increased in seed rate, total labor quantity, price of groundnut and access to
credit, groundnut yield was increased by 0.38%, 0.96%, 1.19% and 0.19% respectively.
The adjusted R squared points out that the model is significant and it can explain on the
variation in groundnut yield by 57 percent.

83
Accordingly to the groundnut profit regression estimates, yield was positively and
significantly related to the groundnut profit of the sample farm households at 1 percent
level. If one percent increases in yield, the groundnut profit will increased 3.76%. The
total material cost of the sample farm household negatively and significantly influenced
on profit at 5 percent level. If one percent increases in total material cost on the farm in
the study area, the groundnut profit will decrease 2.09%. The adjusted R squared points
out that the model is significant and it can explain on the variation in groundnut profit by
45 percent.
5.2 Recommendations and Policy Implications
5.2.1 High yielding varieties for farmers
Most of the farmers in the study area recognized the Tontarni as a high yielding
variety. Improvement of local specific adaptable varieties such as Tontarni should be
more developed which can enhance the land productivity. Hence, improved varieties of
good and high yielding seeds are in demand for groundnut growers. Under this condition,
it is urgently needed to develop seed industry through public - private partnership to meet
the growing demand for quality seed.
The constraint analysis pointed out that effective extension services were needed
in production of groundnut. The Government should strengthen its extension service both
qualitatively and quantitatively. Adequate funds should be provided for enabling the
extension workers. In the short run, programs should be designed to educate rural
households through introducing farmers‟ training and giving proper extension services. It
could assist farmers to be better decision makers of their farms. Therefore, more effective
extension services and training programs were recommended for groundnut farmers in
the study area.
The constraint analysis pointed out that the credit for farmers received from
Myanmar agricultural development bank (MADB) are very low. This is necessary to
improve access to credit in the study area. Major constraints on credit availability for
farmers should be explored and the effective rural financing system collaborating with
INGOs and government organizations such as MADB will be highly demanded.

84
The result of regression model pointed out that groundnut price was the most
effective variables for yield. As the groundnut price was the most effective variables for
yield, good macro environment is necessary to increase crop price which can increase
farm income. As the total material cost negatively influenced on profit of groundnut
production, favorable policy environment for production and marketing of groundnut
sector will be appreciated for the development of small farmers.
5.2.2 Development of groundnut milling sector
Improvement of groundnut milling is essential for milling industry development.
The development of groundnut milling is very important to get the good quality of edible
groundnut oil. It needs to establish modern groundnut mills to produce good quality of
edible groundnut oil. According to the survey results, the major constraints for the millers
were insufficient of power supply and technology, capital investment and low quality of
milled oil due to lack of modernized machinery. Millers should modernize their milling
machines to get the good quality of edible groundnut oil. If the government and
international organizations support loan for up scaling the groundnut mills, quality of
edible groundnut oil will be improved in the study area.
5.2.3 Provision of market information
Provision of market information is very important for groundnut market
development. In the study area, price information was transmitted from township
wholesalers to the farmers. Therefore, government should provide market information in
local not only for producers but also for all other market participants in the groundnut
marketing channels. Media such as radio and mobile communication should be used for
transmission of price information. This could possibly help the farmers to sell their
products at reasonable higher prices.

85
5.2.4 Promoting of groundnut supply chain
In groundnut supply chain, efficiency of market participants including local
wholesalers, huller owners and processors (edible oil miller and groundnut brittle
processor) can be improved by reducing constraints on marketing facilities, market
information, and credit, etc. Both private and public institutions need to provide credit to
marketing agents (such as wholesalers, huller owners and processors) in order to facilitate
procurement operations, storage activities and investment in processing and
transportation. High profit per unit cost in processors should be the key indicator for the
development of agro-food industry in each production area concerned. Even the
processor got the highest profit in their business; they had to invest the highest marketing
cost in payment for storing, processing and other service costs and taxes. So, there is a
need to reduce the taxes and fees for the traders, processor and their business activities,
which may lead to improve the groundnut supply chain in the study area.
.
86
REFERENCES
Abdelaziz. K. 2010. Economic Analysis of Factors Affecting Crop Production in North
Darfur State, Umkdada District. Master Thesis. University of Khartoum, Sudan.
Achrol R. S., and W. S. Louis. 1988. Environmental Determinants of Decision-Making.
Journal of Marketing Research, 25: 36-50.
Aramyan L. H. 2006. Performance Indicators in Agri-Food Production Chain‟s. A case
Study Food Production Project in Alfashir.
Backman T. N., and W. R. Davidson. 1962. Marketing Principle. The Ronal Presses
Co., New York.
Bagamba J. S. 1998. Performance and Profitability of the Banana Sub-sector in Uganda
Farming System.
Biradar R. D. 1996. Margins and Price Spread of Selected Agricultural Commodities in
Kolhapur District, Maharastra.
Branson R. E., and D. G. Norvell. 1983. Introduction to Agricultural Marketing.
McGraw- Hill, New York.
Central Statistical Organization. 2011. Statistical Year Book 2011. Ministry of
National Planning and Economic Development, Yangon, Myanmar.
Chopra, Sunil and Peter M. 2004. Supply Chain Management. 2nd
Edition. Upper
Saddle River: Pearson Prentice Hall.
CIAT (Centro International, Agricultural Tropical). 2004. Increasing the
Competitiveness of Market Chains for Smallholder Producers. Manual 3:
Territorial Approach to Rural Agro- Enterprise Development Project.
Cramer G. L., and W. Jensen. 1982. Agricultural Economics and Agribusiness, 2nd
Edition. McGraw Hill Book Company, USA.
Dhar K. 1976. Margin and Price Spread of Agricultural Commodities in Tanzania.
Elitzak H. 1996. "Food Cost Review", Agricultural Economic Report (US Department of
agriculture, Washiton, D.C.)
Erbaugh J. M. 2008. Profitability Analysis of Sorghum Framing and its Influence on
SorghumValue Chain in Tanzania: A Case Study of Singida and Simanjaro.
Tanzania.

87
Fearne A., and D. Hughes. 1999. “Success Factors in the Fresh Produce Supply Chain:
Insights from the UK”. Int. J. Supply Chain Management, 4 (3): 120-129.
Govereh J., and T. Jayne. 2002. Cash Cropping and Food Crop Productivity: Synergies
or Trade Offs, Agricultural Economics. Department of Agribusiness and Natural
Resources, Faculty of Agricultural Sciences.
Gummagolmath K (1994). Marketing System of Orchardists in Bangladish. Bangladish
J. of Agricultural Economics 14(3): 100-120.
Guvheya G. 1998. Horticultural Marketing in Zimbabwe: Margins, Price Transmission
and Spatial Market Integration.
Hiremath et al. 1993. Determinants of Productivity Change Using a Profit Function:
Smallholder Agriculture in Zimbabwe.
Julie K., F. Murray, B. Harvey, Brookes and P. Molder. 1998. Supply Chain
Management in Cereal Grains: A Case Study from the US Milling Wheat
Industry. Can.J. Agric. Econ., 46: 549-558.
Kasana M. J. 2003. Distributive Marketing Margins of Selected Vegetables in Tangi
Tehsil of Charsadda District. Master thesis, Deptt. of Agric. Econ., Faculty of
Rural Social Sci., NWFP Agric. Univ. Peshawar.
Kherallah, M. Delgado, E. Gabre-Madhin, E. Minot, N. Johnson. 2000. Agricultural
Market Reforms in Sub-Saharan Africa: A Synthesis of Research Findings,
Revised Draft, International Food Policy Research Institute, Washington D.C.
Kohls R. L., and J. N. Uhl. 1985. Marketing of Agricultural Products. 6th
Edition.
Macmillan Publishing Company, USA.
Kohls R. L., and J. N. Uhl. 2002. Marketing of Agricultural Products. 9th
edition. Upper
Saddle River, N.J: Prentice Hall.
Kotler P. 2003. Marketing Management, 11th
edition. Upper Saddle River, NJ: Prentice
Hall International.
Kotler P., and G. Armstrong. 2003. Principle of Marketing, 10th
Edition. Hall of India
Pvt. Ltd., New Delhi.
Kyaw M., and F. Raphy. 2009. An Analysis of the Myanmar Edible Oil Crops Sub-
Sector. Rural Infrastructure and Agro-Industries Division (Ags) Food and
Agriculture Organization of the United Nations.

88
Lokesha 2007. Value Chains of AgriculturalCommodities and their Role in Food
Security and Poverty Alleviation. Agricultural Economics Research Review Vol.
24.
Lutz M., and C. Herman. 1994. The Functioning of the Maize Market in Benin. Spatial
and Temporal Arbitrage on the Market of Staple Food Crops, University of
Amsterdam, Netherlands.
McNair M. P., and L. H. Harry. 1956. Readings in Marketing, 2nd
Edition. McGraw-
Hill Company, Inc. New York.
Mendoza G. 1995. A Primer on Marketing Channels and Margins, In: Scott Gregory. J
(eds.). Price Products and People. International Potato Center. Lima, Peru, 254-
275.
Ministry of Agriculture and Irrigation (MOAI). 2012. Myanmar Agriculture in Brief,
Department of Agricultural Planning.
Ministry of Agriculture and Irrigation (MOAI). 2012. Several Reports from
Settlement and Land Used Department (SLRD), Myanmar.
Mohammed J., and N. Namasivayam. 2005. “Marketing Cost of Banana in Theni
District, Tamil Nadu”. Ind. J. Agric. Mktg. 41 (2): 32-34.
Monsiapile K, K. Annastazia and M. Sebastaina (2010). Edible oil seeds value chain
development programme, Tazinia.
Olson K. 2009. Farm Management Principles and Strategies. The textbook of Farm
Management: Principles and Strategies.
Olukosi J. O., and S. U. Isitor. 1990. Introduction to Agricultural Marketing and Prices:
Principles and Applications. GU Publications, Living Books Series, Abuja.
Oury B. 1965. “Allowing for Weather in Crop Production Model Building.” Journal of
Farm Economics 47 (2): 270-283.
Patil H. N. 1989. Marketing of Alphonso Mangoes in Maharashtra. Journal of
Maharashtra Agricultural University, 14: 244-245.
Rearden et al. 1997. Determinants of Farm Productivity in Africa: A Synthesis of Four
Case Studies. Department of Agricultural Economics, Michigan State University.
Ricks D., W. Timothy, and S. James. 1999. “Supply Chain Management Improving
Vertical Coordination in Fruit Industries”. J. Food Distribution Res, 30 (3): 44-53.
89
Ronald H. B. et. al. 2000. New Marginal Challenges from Supply Chain Opportunities,
Industrial Marketing Management. Case Study Research: Design and Methods.
Thousand Oaks, California: Sage Publications, Inc.
Satihal D. G. 1993. Economics of Production and Marketing of Bean in Bijapur district.
Karnataka. Master Thesis, University of Agricultural Sciences, Dharwad.
Senthilnathan M and K. Srinivasan (1994). Analysis of Banana Marketing
Chain.Agri.Mktg.50 (3): 47-48.
Shanthasheela, M.N., (2007). Sesame Village. M.S. Swaminathan Research Foundation,
Chennai, India.
Sidhu H. S., and A. S. Kahalon. 1967. Marketing of Apples in Kullu Valley.
Agricultural Marketing, 10 (1): 5-7.
Singh K., and A. S. Kahalon. 1968. Marketing Margins in Grape Sin Punjab.
Agricultural Marketing, 11 (4): 1-4.
Sonar K.T., R.B., Changule, B. B. Mane, and G. P. Gaikwad (2012). Marketed
Surplus and Price Spread in Different Channels of Sunflower Marketing. Internat.
J. Com. & Bus. Manage, 5(2): 186-189.
Tegegene B. 2008. Analysis of Cotton Marketing Chains: The Case of Metema Woreda,
North Gondar Zone, Amhara National Regional State, Haramaya University.
Thirtle et. al. 1990. Agricultural Productivity in Zimbabwe, The Economic Journal,
Vol.103, No.417.
Tomek G. W., and K. L. Robison. 1990. Agricultural Product Prices, Cornell University
Press, U.S.A.
Tschering C. 2002. Profitability Analysis of Bean Production in Honduras. Department
of Agricultural Economics, Michigan State University, MSU.
Varnet and Vincent. 1967. The Dynamics of Economic Development: Long Cycles and
Industrial Growth. University of North Texas.
Vedini K. H. 1997. “Cost and Margins in Jasmine Flowers Marketing”. Agric. Mktg. 40
(3): 44- 46.
Warr G. 1999. Analysis of Soybean Marketing Chain. Elm Farm Research Centre,
Bulletin.

90
Win Pa Pa. Soe. 2009. A Study of Oilseed Crops and Edible Oil Marketing in Myanmar.
Master Thesis. Kyushu University, Fukuoka, Japan.
Wolday A. 1994. Food Grain Marketing Development in Ethiopia after the Reform of
1990: A Case Study of Alaba Siro district, Ethiopia.

91
APPENDICES
Appendix 1 Map of Magway Township
Source: Department of Agriculture, Township Office, Magway Township, 2012
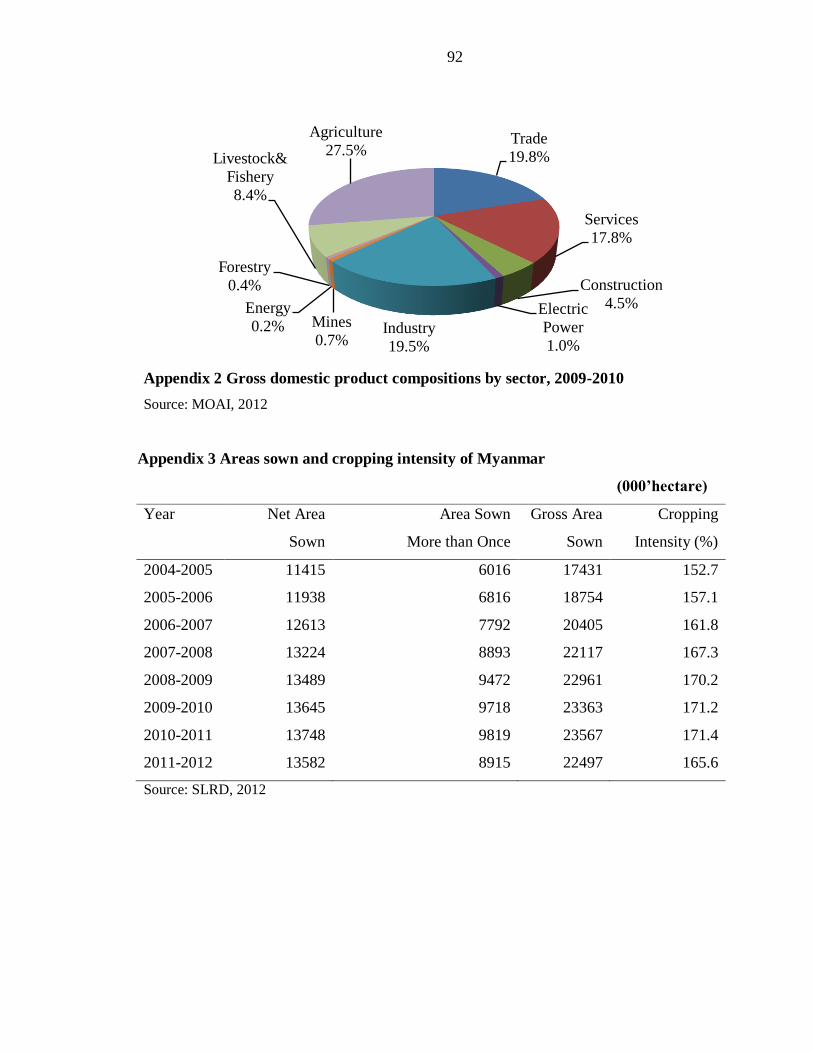
92
Appendix 2 Gross domestic product compositions by sector, 2009-2010
Source: MOAI, 2012
Appendix 3 Areas sown and cropping intensity of Myanmar
(000’hectare)
Year Net Area
Sown
Area Sown
More than Once
Gross Area
Sown
Cropping
Intensity (%)
2004-2005 11415 6016 17431 152.7
2005-2006 11938 6816 18754 157.1
2006-2007 12613 7792 20405 161.8
2007-2008 13224 8893 22117 167.3
2008-2009 13489 9472 22961 170.2
2009-2010 13645 9718 23363 171.2
2010-2011 13748 9819 23567 171.4
2011-2012 13582 8915 22497 165.6
Source: SLRD, 2012
Trade
19.8%
Services
17.8%
Construction
4.5%Electric
Power
1.0%Industry
19.5%
Mines
0.7%
Energy
0.2%
Forestry
0.4%
Livestock&
Fishery
8.4%
Agriculture
27.5%

93
Appendix 4 Percentage share of the total sown area for the major crops in
Myanmar (2011- 2012)
Source: MOAI, 2012
Appendix 5 Percentage share of the oilseed crop area cultivated in 2011-2012
Source: MOAI, 2012
Cereal
39%
Pulses
20%
Other
20%
Industrial
5%
Culinary
1%
Oilseed
15%
Groundnut
26%
Sesame
46%
Mustard and Niger
13%
sunflower
16%

94
Appendix 6 Oilseed crops cultivation in Myanmar
Year
Oilseed crops (Sown area) (000' hectare)
Groundnut Sesame Sunflower Mustard Niger
1996-1997 479 1,145 125 18 47
1998-1999 503 1,199 343 30 57
2001-2002 569 1,382 498 55 91
2002-2003 581 1,417 460 69 93
2003-2004 654 1,465 511 64 104
2004-2005 684 1,496 516 67 112
2005-2006 730 1,388 690 71 129
2006-2007 756 1,443 614 75 121
2007-2008 815 1,507 835 92 147
2008-2009 844 1,570 884 98 152
2009-2010 866 1,634 883 100 156
2010-2011 877 1585 859 101 158
Source: MOAI, 2012

95
Appendix 7 Groundnut production in Myanmar and neighboring countries
Country Harvested Area
(„000 ha)
Yield
(kg/ha)
Production
(000‟MT)
World 23951 1522 36457
Asia 11879 1966 23351
Myanmar (2010-2011) 877 1587 1392
Thailand 64 2063 132
Vietnam 249 2108 525
Indonesia 623 1249 778
Malaysia 0.2 3500 1
Philippines 28 1107 31
Lao PDR 18 1611 29
Cambodia 22 1364 30
China 4398 3357 14765
Bangladesh 33 1424 47
India 5470 1007 5510
Source: MOAI, 2012

96
Appendix 8 Sown area and production of groundnut
Source: MOAI, 2012
Appendix 9 Percentage share of sown area for groundnut (rain) by state and division in
2010-11
Source: CSO, 2011
0
200
400
600
800
1000
1200
1400
1600
1995/96 2000/01 2005/06 2007/08 2008/09 2009/10 2010/11 2011/12
Sown (000'ha) Production (000'MT)
Sown Area and Production of Groundnut
Magway
27%
Mandalay
23%Sagaing
27%
Shan
12%
Others
11%
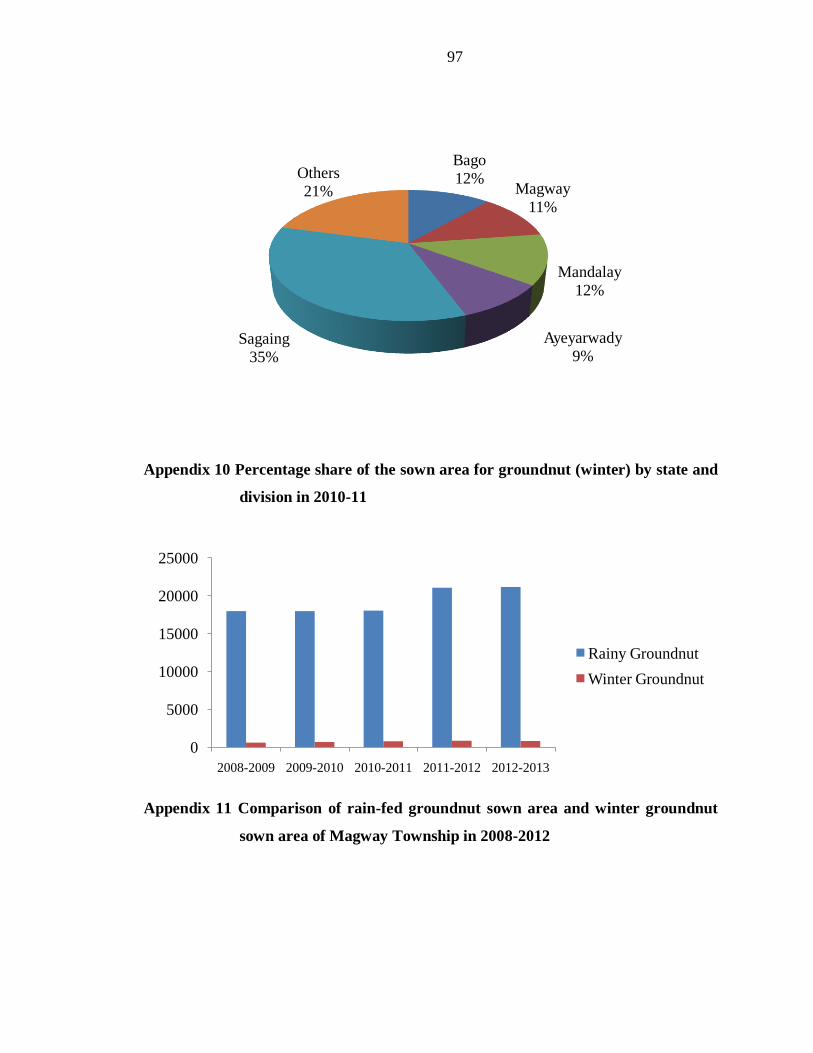
97
Appendix 10 Percentage share of the sown area for groundnut (winter) by state and
division in 2010-11
Appendix 11 Comparison of rain-fed groundnut sown area and winter groundnut
sown area of Magway Township in 2008-2012
Bago
12%Magway
11%
Mandalay
12%
Ayeyarwady
9%Sagaing
35%
Others
21%
0
5000
10000
15000
20000
25000
2008-2009 2009-2010 2010-2011 2011-2012 2012-2013
Rainy Groundnut
Winter Groundnut