supply chain metrics that matter: a focus on chemical ... · pdf filesupply chain metrics that...
TRANSCRIPT
Supply Chain Metrics That Matter: A Focus on Chemical Companies Progress on Supply Chain Excellence 05/21/2015
By Lora Cecere
Founder and CEO Supply Chain Insights LLC
By Regina Denman
Client Services Director Supply Chain Insights LLC
Page 2
Contents
Research Disclosure
Research Methodology Improving Performance
Driving Profitability Improving Cycles
Managing Complexity Defining Improvement
Balance Strength
Resiliency The Definition of the Index: Putting It All Together
Current State of the Chemical Industry Understanding Supply Chain Performance in the Chemical Industry
Driving Supply Chain Improvement Profitability
Cash-To-Cash Recommendations
Conclusion Appendix
Definitions Companies Studied
Prior Reports in This Series About Supply Chain Insights, LLC
About Lora Cecere
3 3 3 6 7 7 7 8
11 13 14 16 16 18 19 21 22 27 27 28 28 28 29 31 31
Page 3
Research The Supply Chain Metrics That Matter report series is an analysis of supply chain excellence for a
specific industry. In this report we take a closer look at the chemical industry. The goal is to help
supply chain leaders understand what is possible in driving supply chain excellence programs.
These reports are based on data collected from financial balance sheets and income statements over
the period of 2000-2014. Our source of data is YCharts. In these Supply Chain Metrics That Matter
reports, we analyze how companies made trade-offs over the course of the last decade in balancing
growth, profitability, cycles and complexity.
Within the world of Supply Chain Management (SCM), each industry is unique. We believe that it is
dangerous to list all industries in a spreadsheet and declare a supply chain leader. Instead, it is our
preference to evaluate change over time with a focus on overall performance and improvement within
an industry peer group. In this series of reports--Supply Chain Metrics That Matter--we analyze the
potential of each supply chain peer group while sharing insights from industry leaders and
recommendations based on general market trends. In the appendix, we share information and links
for other reports in this series.
Disclosure Your trust is important to us. As such, we are open and transparent about our financial relationships
and our research process. This independent research is 100% funded by Supply Chain Insights.
These reports are intended for you to read, share and use. Please share this data freely within your
company and across your industry. All we ask for in return is attribution when you use the materials
in this report in public forums. We publish under the Creative Commons License Attribution-
Noncommercial-Share Alike 3.0 United States and our citation policy is outlined on the Supply Chain
Insights Website.
Research Methodology The basis of this report is publicly available information from corporate annual reports from the period
of 2006-2014 for publicly-owned companies in the chemical industry. The methodology to understand
supply chain performance and improvement is based on three years of data mining of supply chain
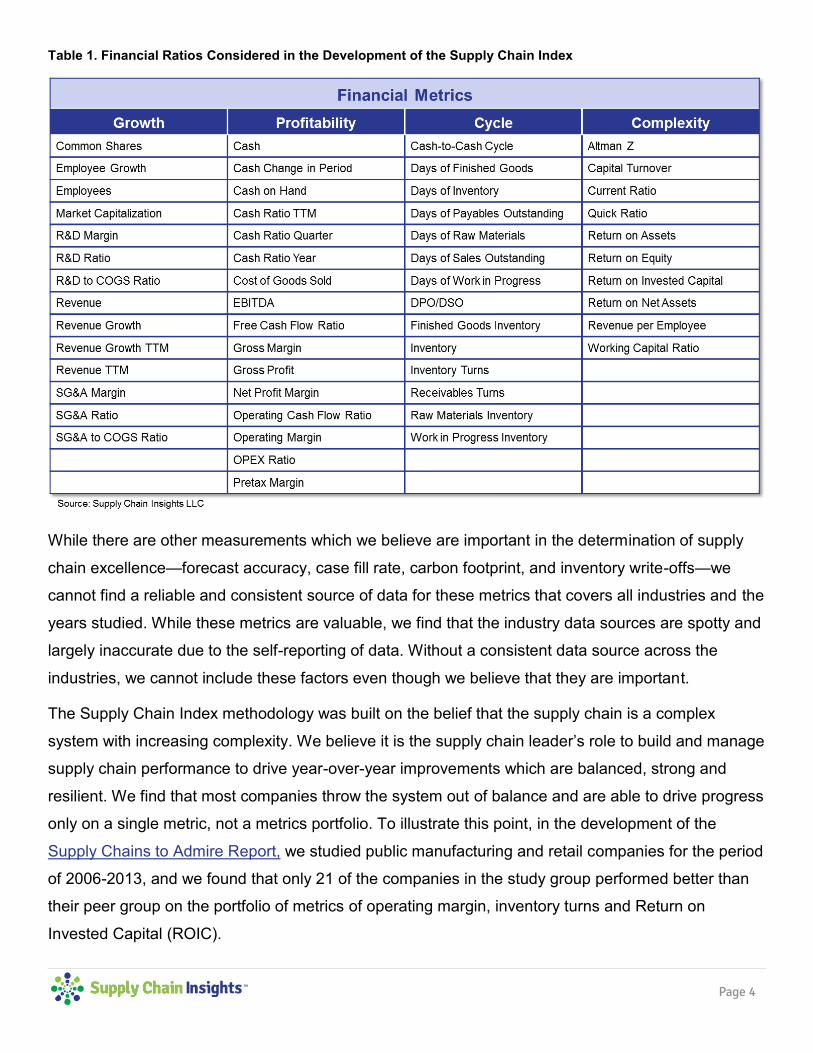
financial ratios. In Table 1, we share the supply chain ratios we analyzed to understand the trends in
the Supply Chain Metrics That Matter report series
Page 4
Table 1. Financial Ratios Considered in the Development of the Supply Chain Index
While there are other measurements which we believe are important in the determination of supply
chain excellence—forecast accuracy, case fill rate, carbon footprint, and inventory write-offs—we
cannot find a reliable and consistent source of data for these metrics that covers all industries and the
years studied. While these metrics are valuable, we find that the industry data sources are spotty and
largely inaccurate due to the self-reporting of data. Without a consistent data source across the
industries, we cannot include these factors even though we believe that they are important.
The Supply Chain Index methodology was built on the belief that the supply chain is a complex
system with increasing complexity. We believe it is the supply chain leader’s role to build and manage
supply chain performance to drive year-over-year improvements which are balanced, strong and
resilient. We find that most companies throw the system out of balance and are able to drive progress
only on a single metric, not a metrics portfolio. To illustrate this point, in the development of the
Supply Chains to Admire Report, we studied public manufacturing and retail companies for the period
of 2006-2013, and we found that only 21 of the companies in the study group performed better than
their peer group on the portfolio of metrics of operating margin, inventory turns and Return on
Invested Capital (ROIC).
Page 5
In our review of the data in this report with supply chain leaders, we found that most companies are
not aware of how they rate relative to their peer group, and many have driven a singular metric as
opposed to a balanced portfolio.
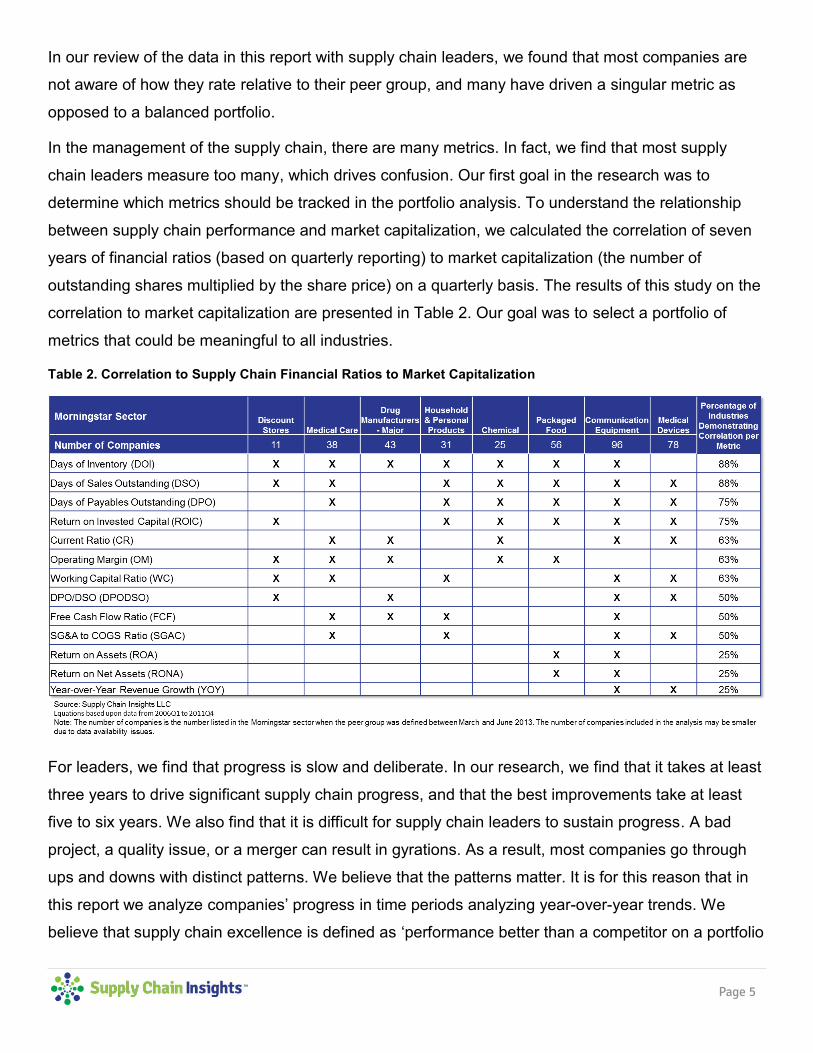
In the management of the supply chain, there are many metrics. In fact, we find that most supply
chain leaders measure too many, which drives confusion. Our first goal in the research was to
determine which metrics should be tracked in the portfolio analysis. To understand the relationship
between supply chain performance and market capitalization, we calculated the correlation of seven
years of financial ratios (based on quarterly reporting) to market capitalization (the number of
outstanding shares multiplied by the share price) on a quarterly basis. The results of this study on the
correlation to market capitalization are presented in Table 2. Our goal was to select a portfolio of
metrics that could be meaningful to all industries.
Table 2. Correlation to Supply Chain Financial Ratios to Market Capitalization
For leaders, we find that progress is slow and deliberate. In our research, we find that it takes at least
three years to drive significant supply chain progress, and that the best improvements take at least
five to six years. We also find that it is difficult for supply chain leaders to sustain progress. A bad
project, a quality issue, or a merger can result in gyrations. As a result, most companies go through
ups and downs with distinct patterns. We believe that the patterns matter. It is for this reason that in
this report we analyze companies’ progress in time periods analyzing year-over-year trends. We
believe that supply chain excellence is defined as ‘performance better than a competitor on a portfolio
Page 6
of metrics’, and ‘improvement better than the peer group average’. While this sounds easy, what will
be seen by the reader of this report is that this is a tough standard.
Improving Performance To evaluate performance, we analyzed a portfolio of metrics against industry averages for three
periods of time: 2006-2014, 2009-2014, and 2011-2014.
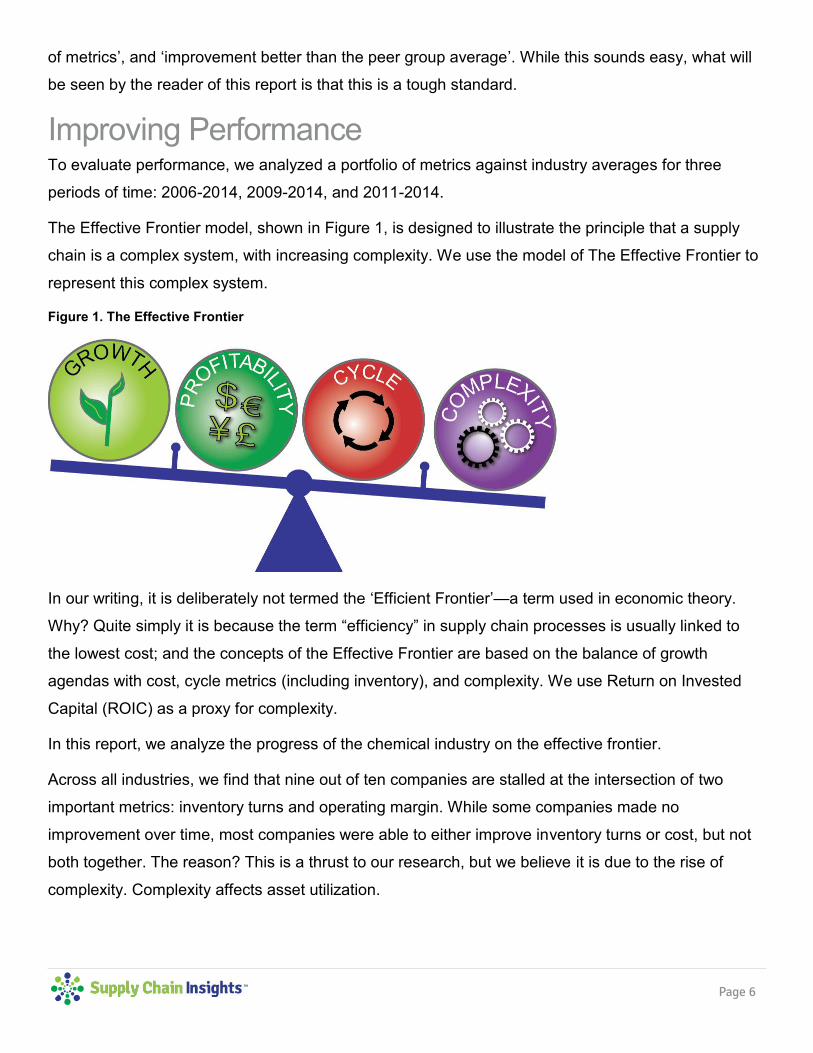
The Effective Frontier model, shown in Figure 1, is designed to illustrate the principle that a supply
chain is a complex system, with increasing complexity. We use the model of The Effective Frontier to
represent this complex system.
Figure 1. The Effective Frontier
In our writing, it is deliberately not termed the ‘Efficient Frontier’—a term used in economic theory.
Why? Quite simply it is because the term “efficiency” in supply chain processes is usually linked to
the lowest cost; and the concepts of the Effective Frontier are based on the balance of growth
agendas with cost, cycle metrics (including inventory), and complexity. We use Return on Invested
Capital (ROIC) as a proxy for complexity.
In this report, we analyze the progress of the chemical industry on the effective frontier.
Across all industries, we find that nine out of ten companies are stalled at the intersection of two
important metrics: inventory turns and operating margin. While some companies made no
improvement over time, most companies were able to either improve inventory turns or cost, but not
both together. The reason? This is a thrust to our research, but we believe it is due to the rise of
complexity. Complexity affects asset utilization.
Page 7
Driving Profitability There is often an inverse relationship between margin and supply chain excellence. The lower the
margin, the more serious companies need to be about supply chain excellence. With the historically
low margins in the chemical industry, supply chain has been an important industry imperative.
Progress was faster in the last decade than today. In our analysis, we use operating margin as the
measure of profitability.
Improving Cycles When it comes to managing cash-to-cash cycles, a small number is better. The question in the
boardroom is “How small can supply chain cycles be managed to pump cash into the organization?”
There is seldom a question of “How low can we go before we put the supply chain at risk?” To
understand the management of cycles in the chemical industry we evaluated the cycles in three time
periods: 2006-2014, 2009-2014, and 2011-2014. We wanted to understand how the components of
cash-to-cash cycles had changed across competitors over time.
Cash-to-cash is a composite metric of receivables, inventory, and payables. As can be seen through
the charts, the greatest improvement in supply chains in the last decade has been made in
payables—lengthening payment terms to suppliers—while inventory levels and receivables have
been more constant. In our analysis, we use inventory turns as our measure of supply chain cycles.
Managing Complexity By definition, the chemical industry is an asset-intensive industry. The factory smokestacks and
distillation columns are iconic representations of manufacturing excellence. Within the chemical
supply chain, there are many forms of complexity—increase in items, formulas, customer policies,
geographic reach, and markets. Over the last decade complexity has increased. A focus on cost-to-
serve, supply chain segmentation, and supply chain planning improves the potential of the supply
chain to balance complexity and manage asset utilization.
Return on Invested Capital is a less well-known metric compared to Return on Assets (ROA). Return
on Assets has a narrower focus. Our research indicates that ROIC has a better correlation with stock
market capitalization, and provides a broad perspective on cash flow generation and profitability
based on shareholder equity. The formula used for ROIC is:
Page 8
ROIC is a measurement of the company’s use of capital. The goal is to drive higher returns than the
market rate of the cost of capital. As will be seen in this report, for many companies this is a struggle.
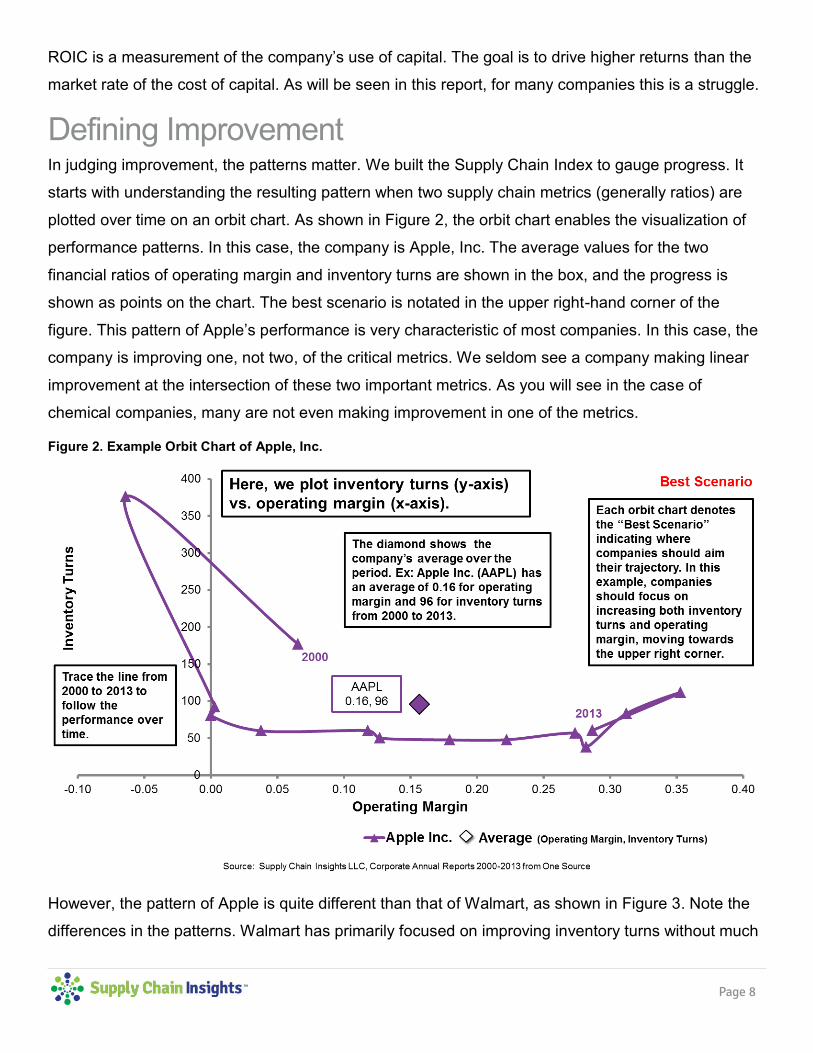
Defining Improvement In judging improvement, the patterns matter. We built the Supply Chain Index to gauge progress. It
starts with understanding the resulting pattern when two supply chain metrics (generally ratios) are
plotted over time on an orbit chart. As shown in Figure 2, the orbit chart enables the visualization of
performance patterns. In this case, the company is Apple, Inc. The average values for the two
financial ratios of operating margin and inventory turns are shown in the box, and the progress is
shown as points on the chart. The best scenario is notated in the upper right-hand corner of the
figure. This pattern of Apple’s performance is very characteristic of most companies. In this case, the
company is improving one, not two, of the critical metrics. We seldom see a company making linear
improvement at the intersection of these two important metrics. As you will see in the case of
chemical companies, many are not even making improvement in one of the metrics.
Figure 2. Example Orbit Chart of Apple, Inc.
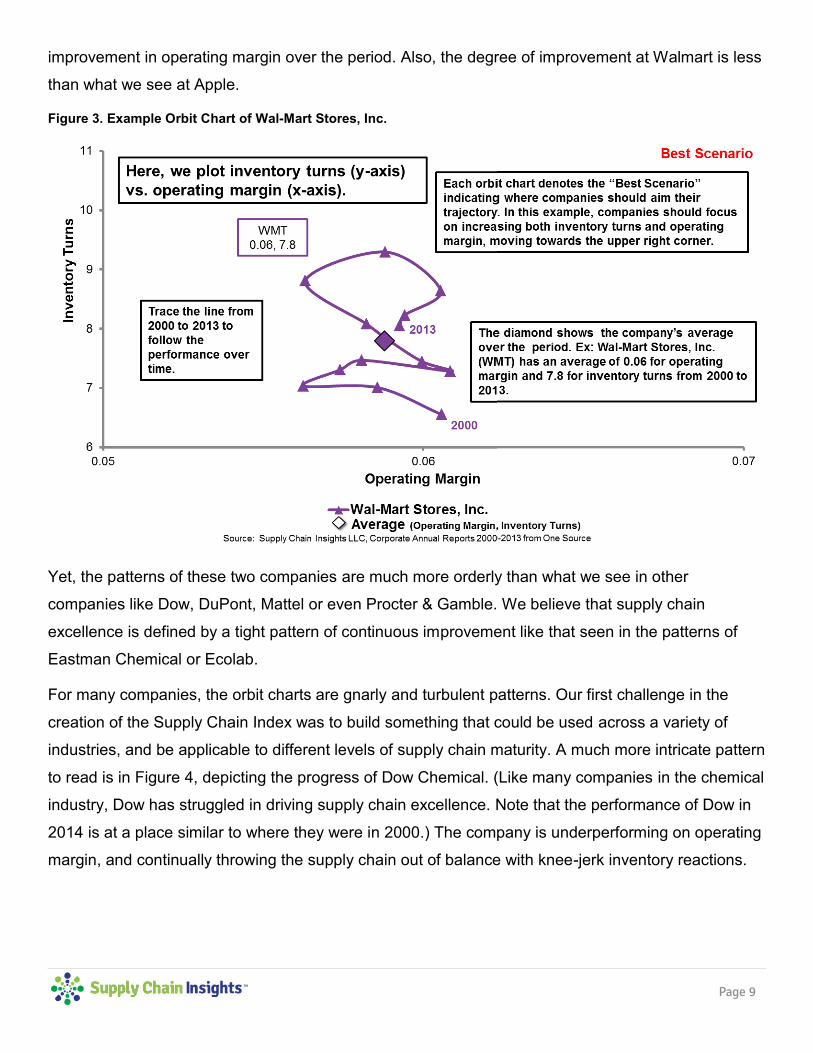
However, the pattern of Apple is quite different than that of Walmart, as shown in Figure 3. Note the
differences in the patterns. Walmart has primarily focused on improving inventory turns without much
Page 9
improvement in operating margin over the period. Also, the degree of improvement at Walmart is less
than what we see at Apple.
Figure 3. Example Orbit Chart of Wal-Mart Stores, Inc.
Yet, the patterns of these two companies are much more orderly than what we see in other
companies like Dow, DuPont, Mattel or even Procter & Gamble. We believe that supply chain
excellence is defined by a tight pattern of continuous improvement like that seen in the patterns of
Eastman Chemical or Ecolab.
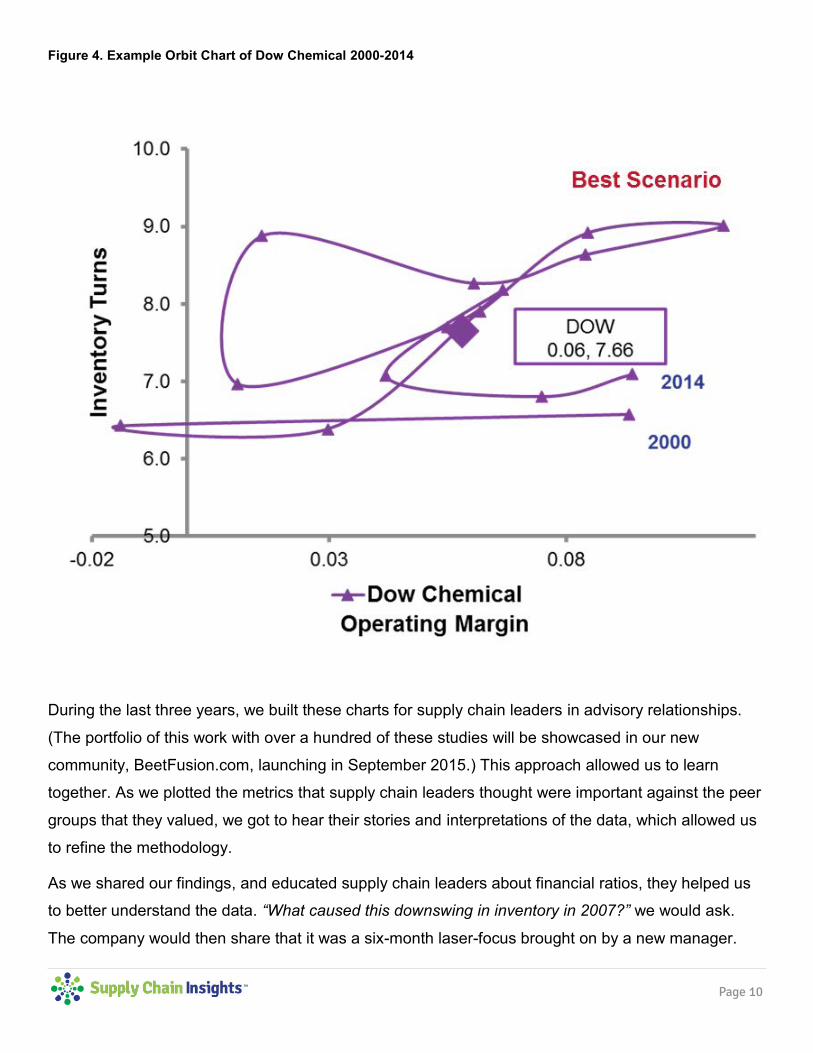
For many companies, the orbit charts are gnarly and turbulent patterns. Our first challenge in the
creation of the Supply Chain Index was to build something that could be used across a variety of
industries, and be applicable to different levels of supply chain maturity. A much more intricate pattern
to read is in Figure 4, depicting the progress of Dow Chemical. (Like many companies in the chemical
industry, Dow has struggled in driving supply chain excellence. Note that the performance of Dow in
2014 is at a place similar to where they were in 2000.) The company is underperforming on operating
margin, and continually throwing the supply chain out of balance with knee-jerk inventory reactions.
Page 10
Figure 4. Example Orbit Chart of Dow Chemical 2000-2014
During the last three years, we built these charts for supply chain leaders in advisory relationships.
(The portfolio of this work with over a hundred of these studies will be showcased in our new
community, BeetFusion.com, launching in September 2015.) This approach allowed us to learn
together. As we plotted the metrics that supply chain leaders thought were important against the peer
groups that they valued, we got to hear their stories and interpretations of the data, which allowed us
to refine the methodology.
As we shared our findings, and educated supply chain leaders about financial ratios, they helped us
to better understand the data. “What caused this downswing in inventory in 2007?” we would ask.
The company would then share that it was a six-month laser-focus brought on by a new manager.
Page 11
When we asked, “What caused these cash-to-cash cycle gyrations in the period of 2002-2004?” they
told us the story of a difficult merger. We found that this was a new way of looking at data; and while it
took adjustment and training, it provided a new and fresh perspective at most organizations. Our
insight? Supply chain progress happens over time; not in months or quarters, but in years. The
interrelationships between the metrics are real. The supply chain is a complex system with nonlinear
relationships between the metrics of growth, cost, inventory turns, and ROIC. As a result, the data
cannot properly be assessed in a spreadsheet. Our approach was to plot the shifts over time using
orbit charts. In this report, we share the orbit charts of chemical leaders.
This is based on three years of work. In 2013, we partnered with Arizona State University’s School of
Computing, Informatics and Decision Systems Engineering. After two years of work, we believe that
we now have a methodology which enables the comparison of supply chain progress in the delivery
of the Supply Chain Index. We then defined the Index as a whole and applied the methodology to
chemical, consumer packaged goods, and pharmaceutical companies. To help the reader understand
the Supply Chain Index, we first define the separate pieces; i.e., balance, strength, and resiliency.
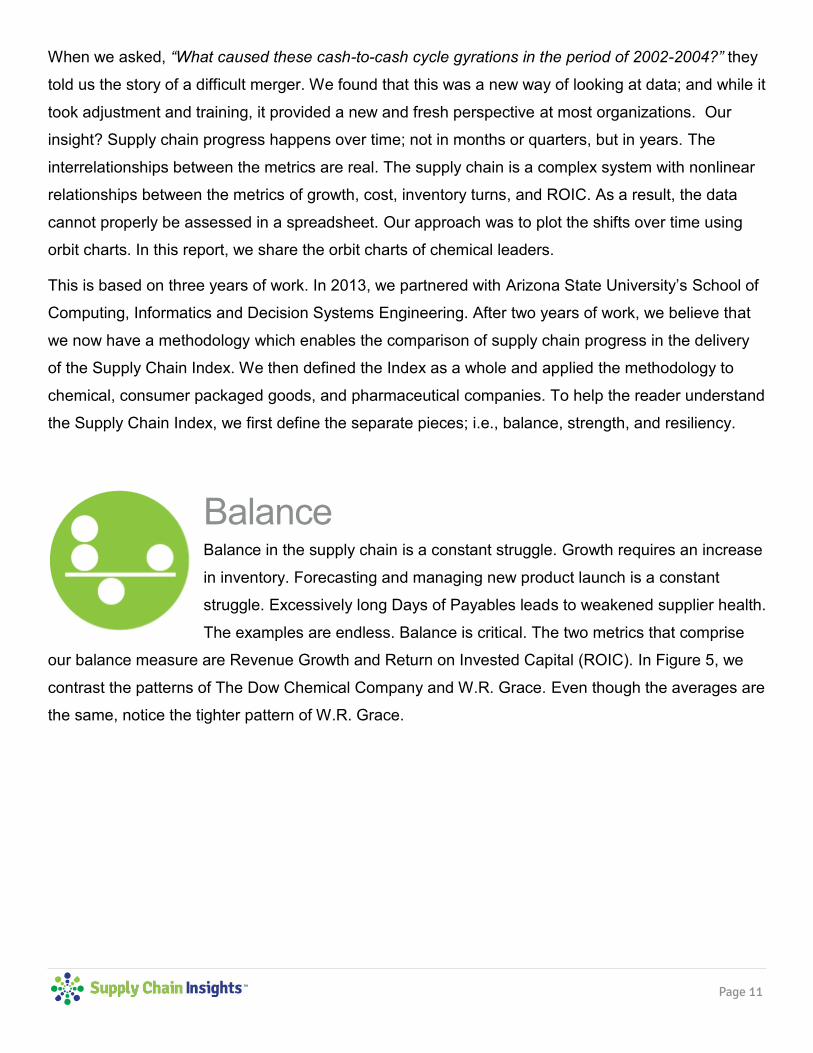
Balance Balance in the supply chain is a constant struggle. Growth requires an increase
in inventory. Forecasting and managing new product launch is a constant
struggle. Excessively long Days of Payables leads to weakened supplier health.
The examples are endless. Balance is critical. The two metrics that comprise
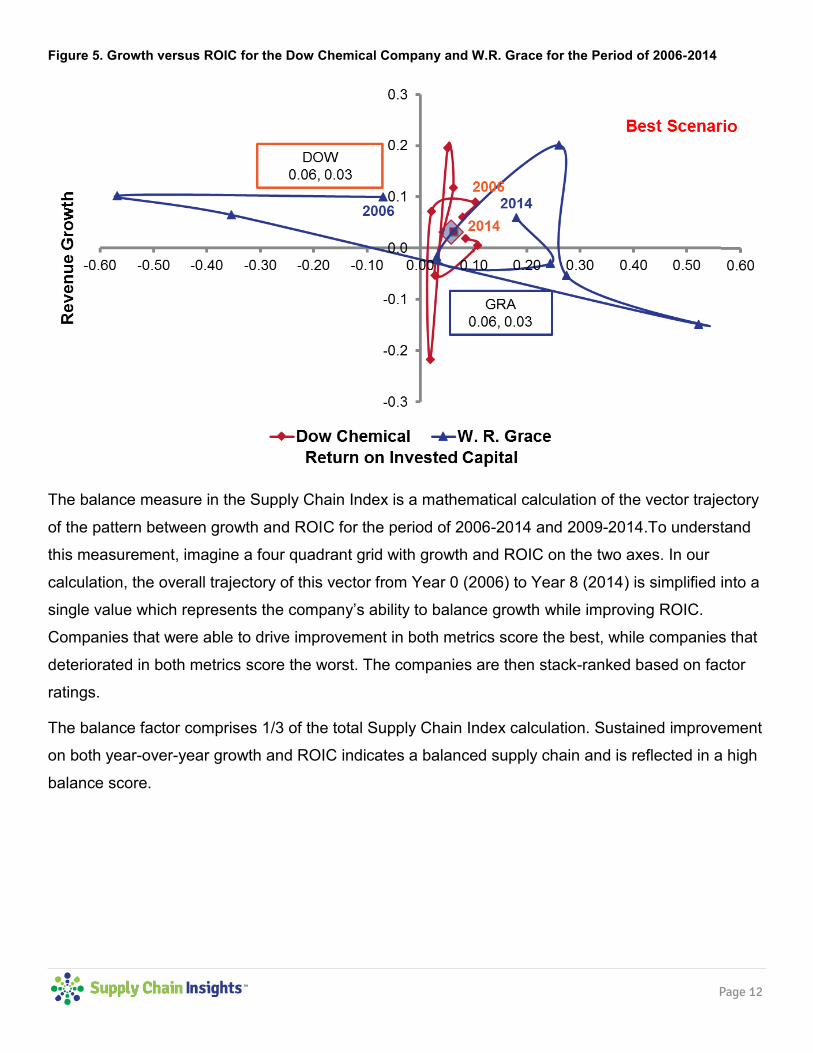
our balance measure are Revenue Growth and Return on Invested Capital (ROIC). In Figure 5, we
contrast the patterns of The Dow Chemical Company and W.R. Grace. Even though the averages are
the same, notice the tighter pattern of W.R. Grace.
Page 12
Figure 5. Growth versus ROIC for the Dow Chemical Company and W.R. Grace for the Period of 2006-2014
The balance measure in the Supply Chain Index is a mathematical calculation of the vector trajectory
of the pattern between growth and ROIC for the period of 2006-2014 and 2009-2014.To understand
this measurement, imagine a four quadrant grid with growth and ROIC on the two axes. In our
calculation, the overall trajectory of this vector from Year 0 (2006) to Year 8 (2014) is simplified into a
single value which represents the company’s ability to balance growth while improving ROIC.
Companies that were able to drive improvement in both metrics score the best, while companies that
deteriorated in both metrics score the worst. The companies are then stack-ranked based on factor
ratings.
The balance factor comprises 1/3 of the total Supply Chain Index calculation. Sustained improvement
on both year-over-year growth and ROIC indicates a balanced supply chain and is reflected in a high
balance score.
Page 13
Strength A successful supply chain is a strong supply chain. Supply chain leaders strive
to deliver year-over-year improvements in both cost and inventory
management. Our research over the past two years has uncovered a rich
relationship between operating margin and inventory turns. For most supply
chain leaders, these are some of the most important measures of their performance. Not only are
they important, they are more directly influenced by day-to-day supply chain decisions than other, and
more broadly used, corporate metrics. It is for this reason they are the two components of our
strength factor in the Supply Chain Index.
The strength measure in the Supply Chain Index is a mathematical calculation of the vector trajectory
of the pattern between inventory turns and operating margin for the periods of 2006-2014 and 2009-
2014. Like the balance factor calculation, the work starts with understanding the orbit chart pattern.
To understand the calculation, imagine a plot—an orbit chart—of inventory turns and operating
margin. In this report, performance is graphed on an annual basis from a point originating at the origin
representing performance on the two metrics at Year 0 (2006). The overall trajectory of this vector
from Year 0 (2006) to Year 8 (2014) is simplified into a single value which represents strength.
Improvement on both metrics simultaneously is graphically shown as movement to the upper-right
quadrant with increasing values for both inventory turns and operating margin over the period. The
companies are then stacked-ranked based on performance and assigned a strength factor.
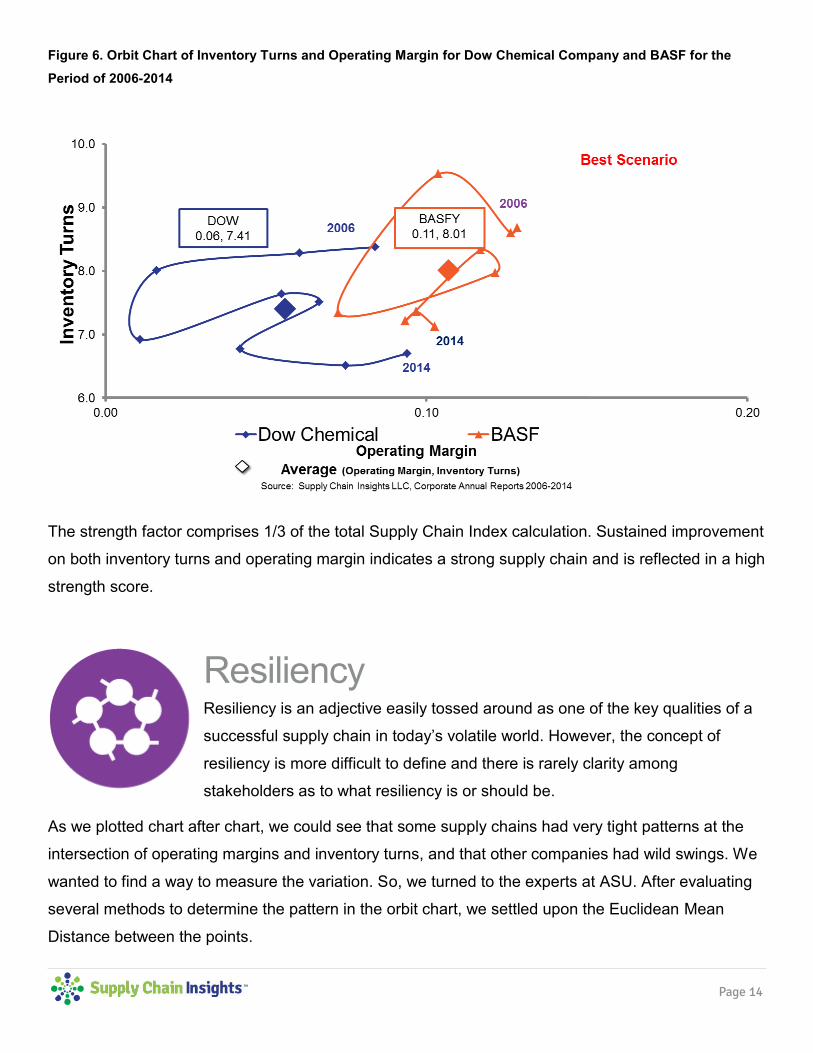
In Figure 6, we show the patterns of BASF and The Dow Chemical Company.
Page 14
Figure 6. Orbit Chart of Inventory Turns and Operating Margin for Dow Chemical Company and BASF for the
Period of 2006-2014
The strength factor comprises 1/3 of the total Supply Chain Index calculation. Sustained improvement
on both inventory turns and operating margin indicates a strong supply chain and is reflected in a high
strength score.
Resiliency Resiliency is an adjective easily tossed around as one of the key qualities of a
successful supply chain in today’s volatile world. However, the concept of
resiliency is more difficult to define and there is rarely clarity among
stakeholders as to what resiliency is or should be.
As we plotted chart after chart, we could see that some supply chains had very tight patterns at the
intersection of operating margins and inventory turns, and that other companies had wild swings. We
wanted to find a way to measure the variation. So, we turned to the experts at ASU. After evaluating
several methods to determine the pattern in the orbit chart, we settled upon the Euclidean Mean
Distance between the points.
Page 15
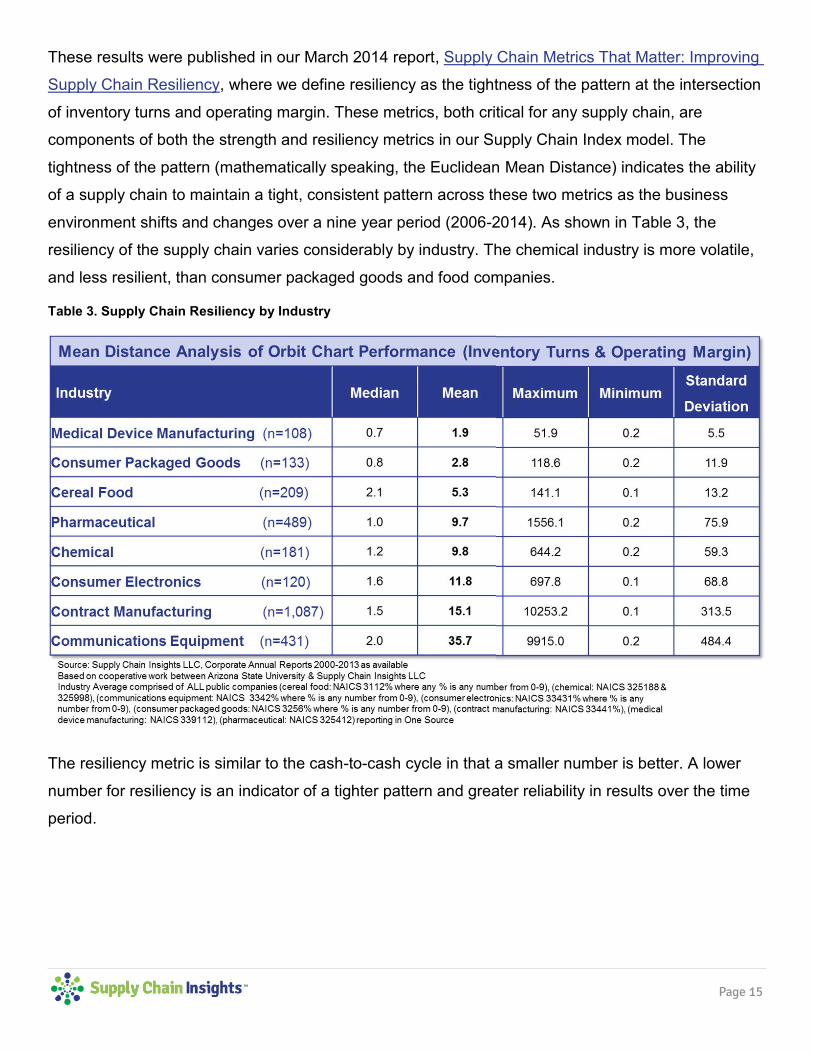
These results were published in our March 2014 report, Supply Chain Metrics That Matter: Improving
Supply Chain Resiliency, where we define resiliency as the tightness of the pattern at the intersection
of inventory turns and operating margin. These metrics, both critical for any supply chain, are
components of both the strength and resiliency metrics in our Supply Chain Index model. The
tightness of the pattern (mathematically speaking, the Euclidean Mean Distance) indicates the ability
of a supply chain to maintain a tight, consistent pattern across these two metrics as the business
environment shifts and changes over a nine year period (2006-2014). As shown in Table 3, the
resiliency of the supply chain varies considerably by industry. The chemical industry is more volatile,
and less resilient, than consumer packaged goods and food companies.
Table 3. Supply Chain Resiliency by Industry
The resiliency metric is similar to the cash-to-cash cycle in that a smaller number is better. A lower
number for resiliency is an indicator of a tighter pattern and greater reliability in results over the time
period.
Page 16
Defining the Index: Putting It All Together In the analysis, each company is judged by their own potential to make progress. While the average
values of a company’s performance may be higher, in the
Supply Chain Index we are evaluating companies on their
ability to drive year-over-year improvement and reliable
progress on the metrics that we believe matter.
The Supply Chain Index is a measurement of supply chain improvement. Each of the factors—
balance, strength and resiliency—as defined above, comprises 1/3 of the total score.
Companies that are underperforming can drive supply chain improvement faster than higher
performing companies. It is for this reason that improvement and performance needs to be looked at
together.
Current State of the Chemical Industry Sitting four to five layers back in the supply chain, the chemical industry struggled to maintain
momentum through the last economic downturn. By definition, a chemical industry is dependent on
assets, and the use of assets. This is a conundrum as costs and supply chain waste were pushed
backwards in the value chain by downstream customers.
When we compiled the Supply Chain to Admire Report in August 2014, two chemical companies—
BASF and Eastman Chemical—made the list. To make the list, a company had to deliver
performance (above average results for the period of 2009-2013 compared to their peer group on a
portfolio of metrics including operating margin, inventory turns and Return on Invested Capital) and
drive supply chain improvement (based on the Supply Chain Index) faster than their peer group. We
believe both performance and improvement matter in the definition of Supply Chain Excellence.
Over the last year, BASF performance has declined, and the best results are from PPG and Eastman.
In this report, we share both performance and improvement ratings.
Performance was stronger in the chemical industry during the pre-recessionary periods. With price
pressures from customers and cash-to-cash programs internally, the average chemical company has
struggled to drive supply chain improvement.
Page 17
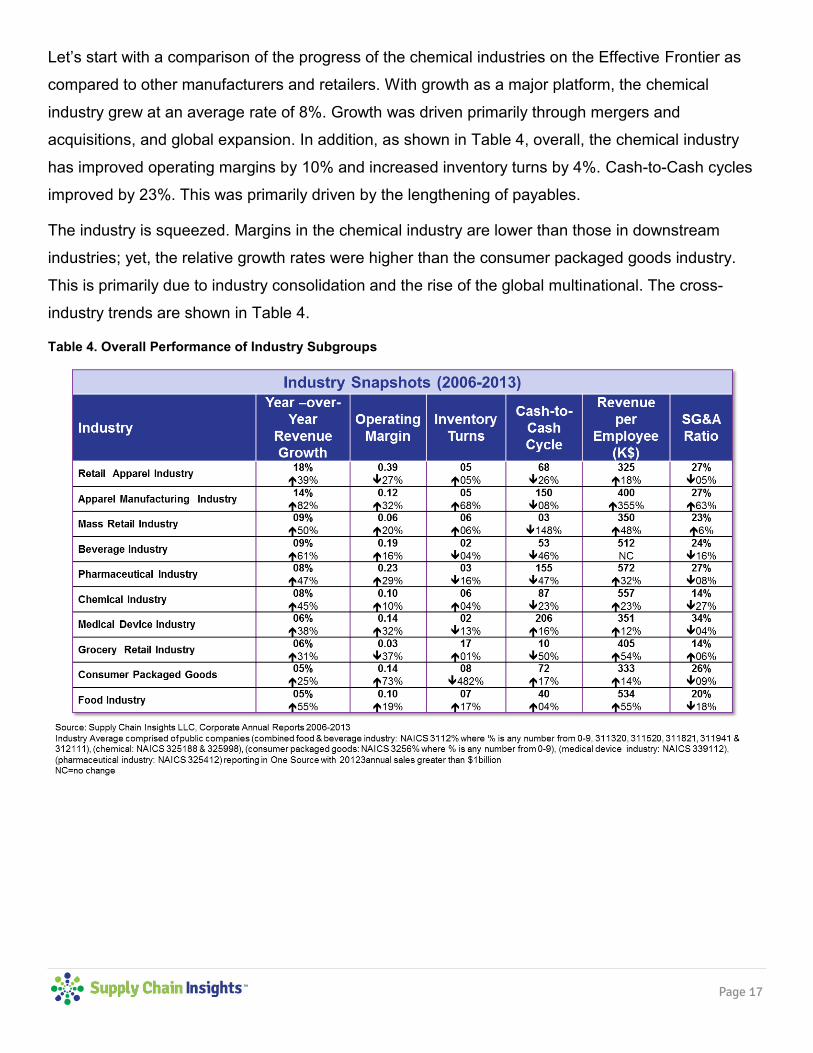
Let’s start with a comparison of the progress of the chemical industries on the Effective Frontier as
compared to other manufacturers and retailers. With growth as a major platform, the chemical
industry grew at an average rate of 8%. Growth was driven primarily through mergers and
acquisitions, and global expansion. In addition, as shown in Table 4, overall, the chemical industry
has improved operating margins by 10% and increased inventory turns by 4%. Cash-to-Cash cycles
improved by 23%. This was primarily driven by the lengthening of payables.
The industry is squeezed. Margins in the chemical industry are lower than those in downstream
industries; yet, the relative growth rates were higher than the consumer packaged goods industry.
This is primarily due to industry consolidation and the rise of the global multinational. The cross-
industry trends are shown in Table 4.
Table 4. Overall Performance of Industry Subgroups
Page 18
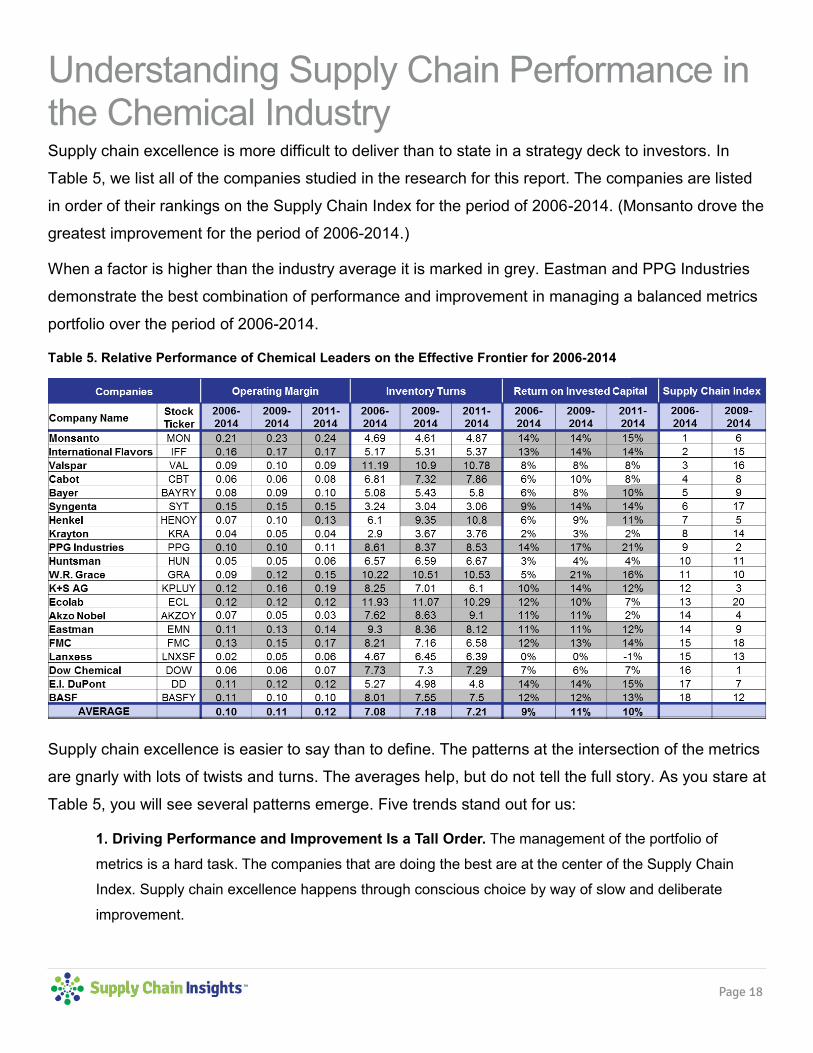
Understanding Supply Chain Performance in the Chemical Industry Supply chain excellence is more difficult to deliver than to state in a strategy deck to investors. In
Table 5, we list all of the companies studied in the research for this report. The companies are listed
in order of their rankings on the Supply Chain Index for the period of 2006-2014. (Monsanto drove the
greatest improvement for the period of 2006-2014.)
When a factor is higher than the industry average it is marked in grey. Eastman and PPG Industries
demonstrate the best combination of performance and improvement in managing a balanced metrics
portfolio over the period of 2006-2014.
Table 5. Relative Performance of Chemical Leaders on the Effective Frontier for 2006-2014
Supply chain excellence is easier to say than to define. The patterns at the intersection of the metrics
are gnarly with lots of twists and turns. The averages help, but do not tell the full story. As you stare at
Table 5, you will see several patterns emerge. Five trends stand out for us:
1. Driving Performance and Improvement Is a Tall Order. The management of the portfolio of
metrics is a hard task. The companies that are doing the best are at the center of the Supply Chain
Index. Supply chain excellence happens through conscious choice by way of slow and deliberate
improvement.
Page 19
2. Lack of Balance in Metrics Performance. Most companies have selected to focus on singular
metrics. The historic focus is reactive. The supply chain is a complex system requiring a proactive
approach tying supply chain strategy to business strategy through intentional design and business
policy. The management of a balanced portfolio is easier said than delivered.
3. Higher Performance of Smaller Companies. The large, historic chemical conglomerates of Bayer,
Dow, and DuPont are worse performers than smaller and more targeted companies.
4. Best Performance at the Center of the Index. The best performers are at the center of the Index: it
is easier to make improvement if you have low performance, and it is harder to drive improvement if the
company is a high performer.
5. Bottom of the List. Through this analysis, it is easy to see the bottom performers. Our list includes
Cabot, Huntsman, and Laxness. These companies have made less progress on supply chain
improvement.
Driving Supply Chain Improvement While recognized industry leaders like DuPont and Dow Chemical are at the same point today that
they were at the beginning of the decade, Eastman Chemical is beating the pack and posting higher
performance. The leaders at Eastman are operating with a focus on a balanced portfolio with a more
conscious and consistent focus.
In 2007, the Eastman team went against the industry’s commonly-held norm and turned off SAP APO
for planning, and implemented a deeper and more flexible technology for planning from OM Partners.
In parallel, DuPont has many SAP APO deployments with most planners running the supply chain
based on Excel spreadsheets. Getting good at supply chain planning is only one of the five
characteristics we see that drives improvement at this important intersection of operating margin and
inventory turns, but it is an important element.
In recent interviews with planners from the two companies, we found that there is a higher level of
user satisfaction with the Eastman Chemical deployment of planning than with the DuPont
implementations of planning.
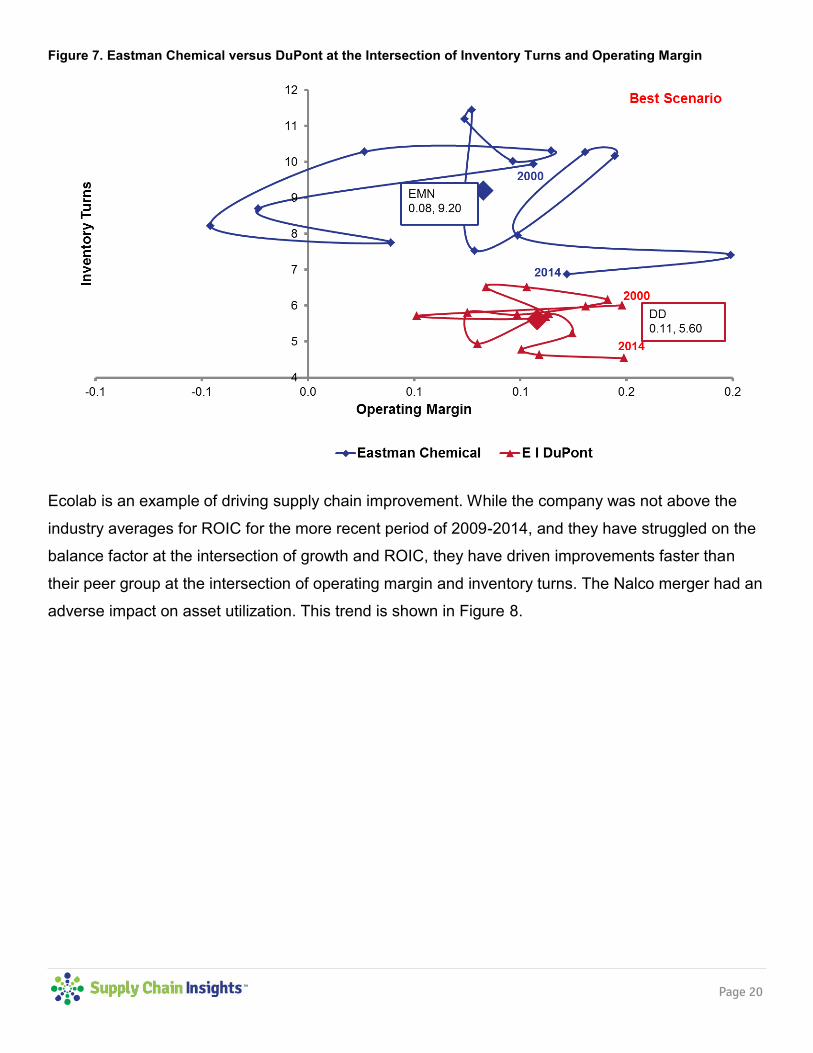
The difference between Eastman Chemical and DuPont at the intersection of inventory turns and
operating margin for the period of 2000-2014 is shown in Figure 7.
Page 20
Figure 7. Eastman Chemical versus DuPont at the Intersection of Inventory Turns and Operating Margin
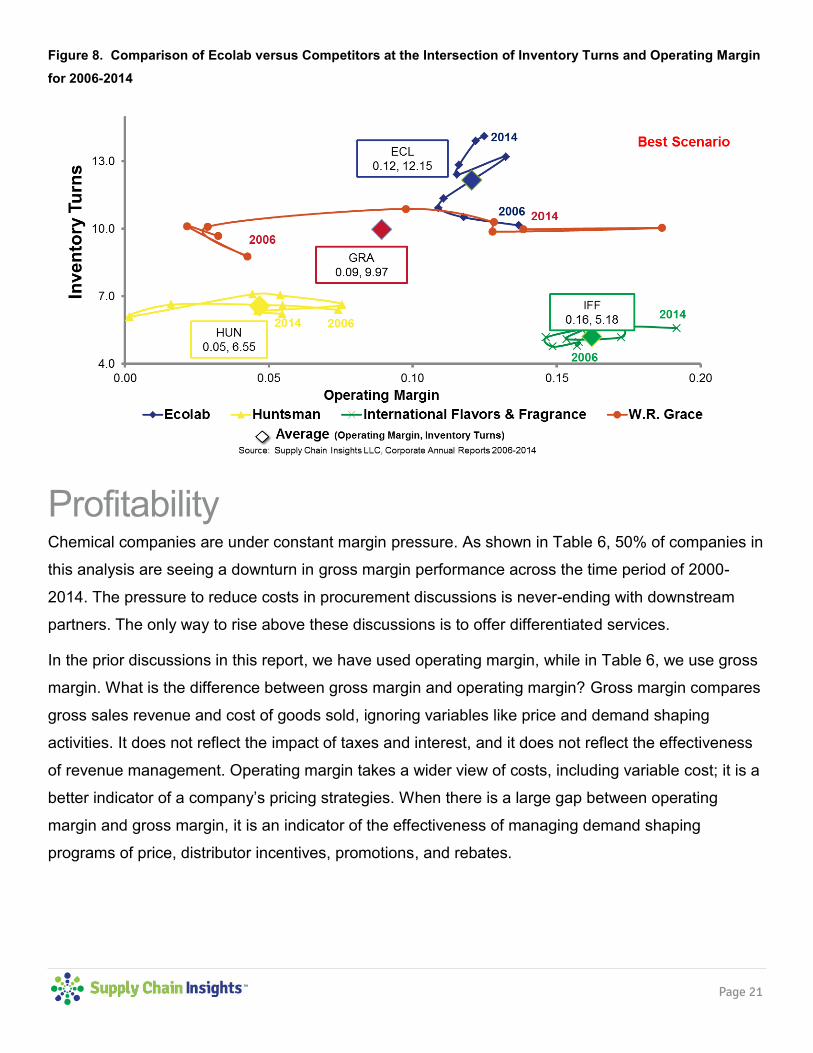
Ecolab is an example of driving supply chain improvement. While the company was not above the
industry averages for ROIC for the more recent period of 2009-2014, and they have struggled on the
balance factor at the intersection of growth and ROIC, they have driven improvements faster than
their peer group at the intersection of operating margin and inventory turns. The Nalco merger had an
adverse impact on asset utilization. This trend is shown in Figure 8.
Page 21
Figure 8. Comparison of Ecolab versus Competitors at the Intersection of Inventory Turns and Operating Margin
for 2006-2014
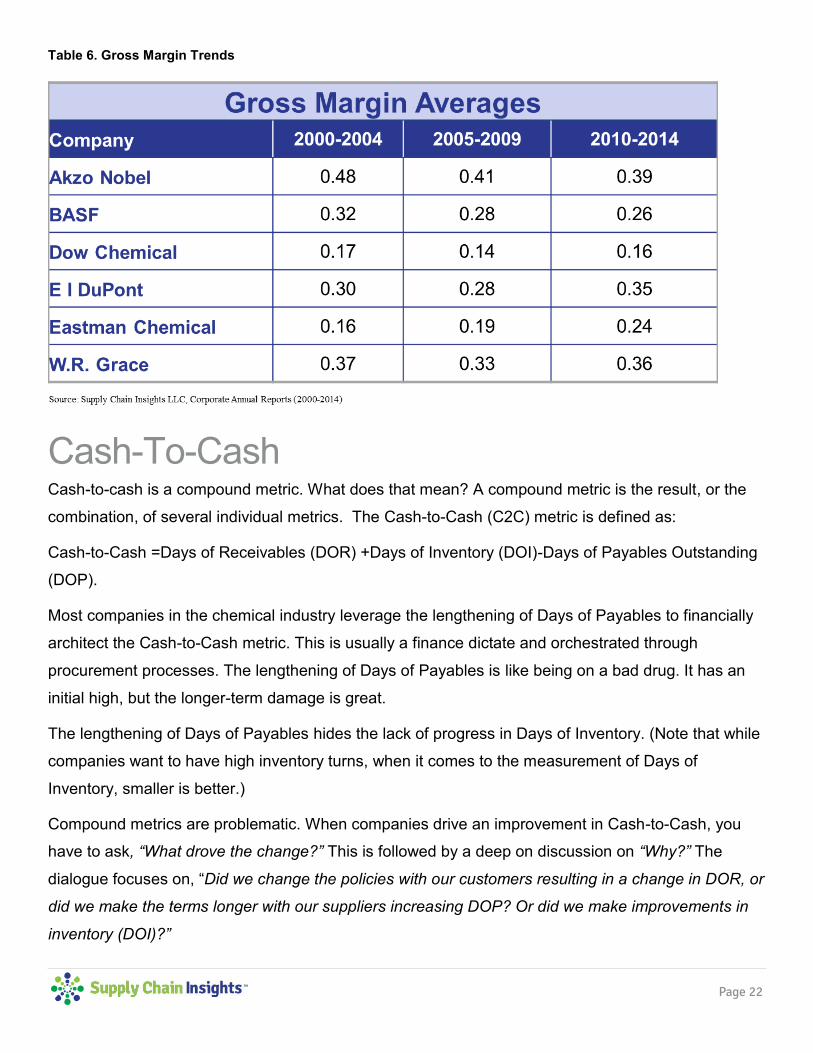
Profitability Chemical companies are under constant margin pressure. As shown in Table 6, 50% of companies in
this analysis are seeing a downturn in gross margin performance across the time period of 2000-
2014. The pressure to reduce costs in procurement discussions is never-ending with downstream
partners. The only way to rise above these discussions is to offer differentiated services.
In the prior discussions in this report, we have used operating margin, while in Table 6, we use gross
margin. What is the difference between gross margin and operating margin? Gross margin compares
gross sales revenue and cost of goods sold, ignoring variables like price and demand shaping
activities. It does not reflect the impact of taxes and interest, and it does not reflect the effectiveness
of revenue management. Operating margin takes a wider view of costs, including variable cost; it is a
better indicator of a company’s pricing strategies. When there is a large gap between operating
margin and gross margin, it is an indicator of the effectiveness of managing demand shaping
programs of price, distributor incentives, promotions, and rebates.
Page 22
Table 6. Gross Margin Trends
Cash-To-Cash Cash-to-cash is a compound metric. What does that mean? A compound metric is the result, or the
combination, of several individual metrics. The Cash-to-Cash (C2C) metric is defined as:
Cash-to-Cash =Days of Receivables (DOR) +Days of Inventory (DOI)-Days of Payables Outstanding
(DOP).
Most companies in the chemical industry leverage the lengthening of Days of Payables to financially
architect the Cash-to-Cash metric. This is usually a finance dictate and orchestrated through
procurement processes. The lengthening of Days of Payables is like being on a bad drug. It has an
initial high, but the longer-term damage is great.
The lengthening of Days of Payables hides the lack of progress in Days of Inventory. (Note that while
companies want to have high inventory turns, when it comes to the measurement of Days of
Inventory, smaller is better.)
Compound metrics are problematic. When companies drive an improvement in Cash-to-Cash, you
have to ask, “What drove the change?” This is followed by a deep on discussion on “Why?” The
dialogue focuses on, “Did we change the policies with our customers resulting in a change in DOR, or
did we make the terms longer with our suppliers increasing DOP? Or did we make improvements in
inventory (DOI)?”
Page 23
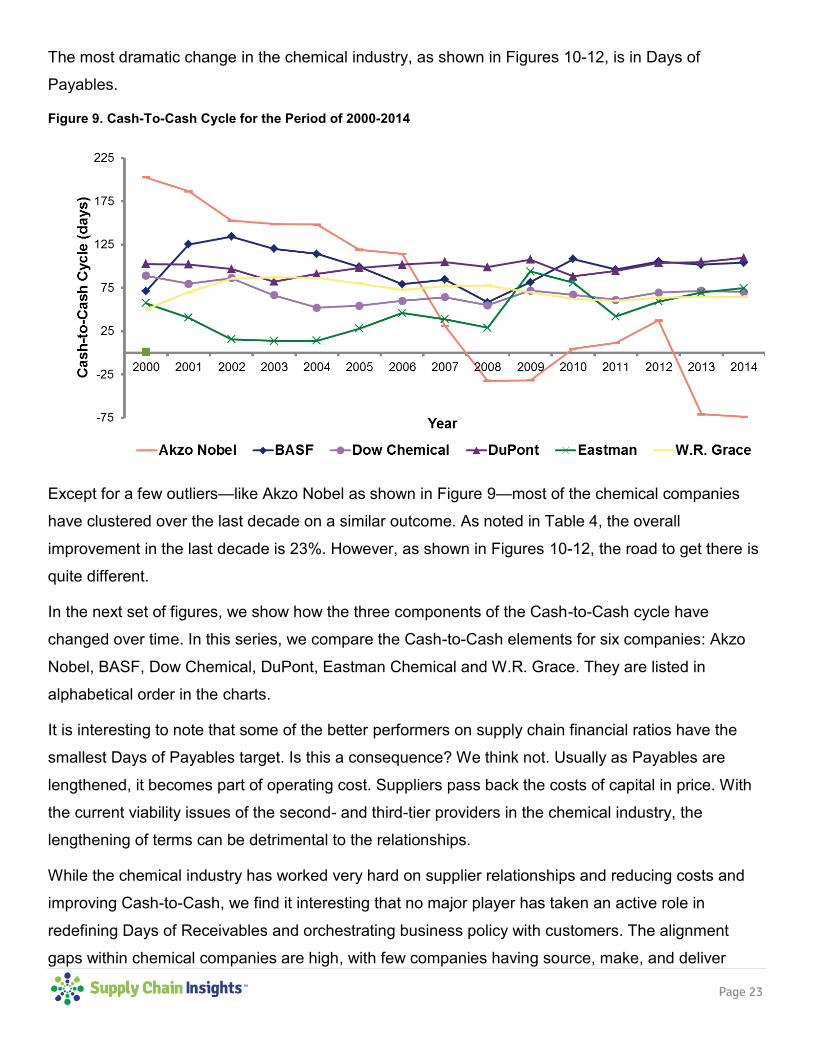
The most dramatic change in the chemical industry, as shown in Figures 10-12, is in Days of
Payables.
Figure 9. Cash-To-Cash Cycle for the Period of 2000-2014
Except for a few outliers—like Akzo Nobel as shown in Figure 9—most of the chemical companies
have clustered over the last decade on a similar outcome. As noted in Table 4, the overall
improvement in the last decade is 23%. However, as shown in Figures 10-12, the road to get there is
quite different.
In the next set of figures, we show how the three components of the Cash-to-Cash cycle have
changed over time. In this series, we compare the Cash-to-Cash elements for six companies: Akzo
Nobel, BASF, Dow Chemical, DuPont, Eastman Chemical and W.R. Grace. They are listed in
alphabetical order in the charts.
It is interesting to note that some of the better performers on supply chain financial ratios have the
smallest Days of Payables target. Is this a consequence? We think not. Usually as Payables are
lengthened, it becomes part of operating cost. Suppliers pass back the costs of capital in price. With
the current viability issues of the second- and third-tier providers in the chemical industry, the
lengthening of terms can be detrimental to the relationships.
While the chemical industry has worked very hard on supplier relationships and reducing costs and
improving Cash-to-Cash, we find it interesting that no major player has taken an active role in
redefining Days of Receivables and orchestrating business policy with customers. The alignment
gaps within chemical companies are high, with few companies having source, make, and deliver
Page 24
functions reporting to a central leader. With a long legacy in manufacturing, the chemical industry
tends to be very functional, leading to gaps in alignment.
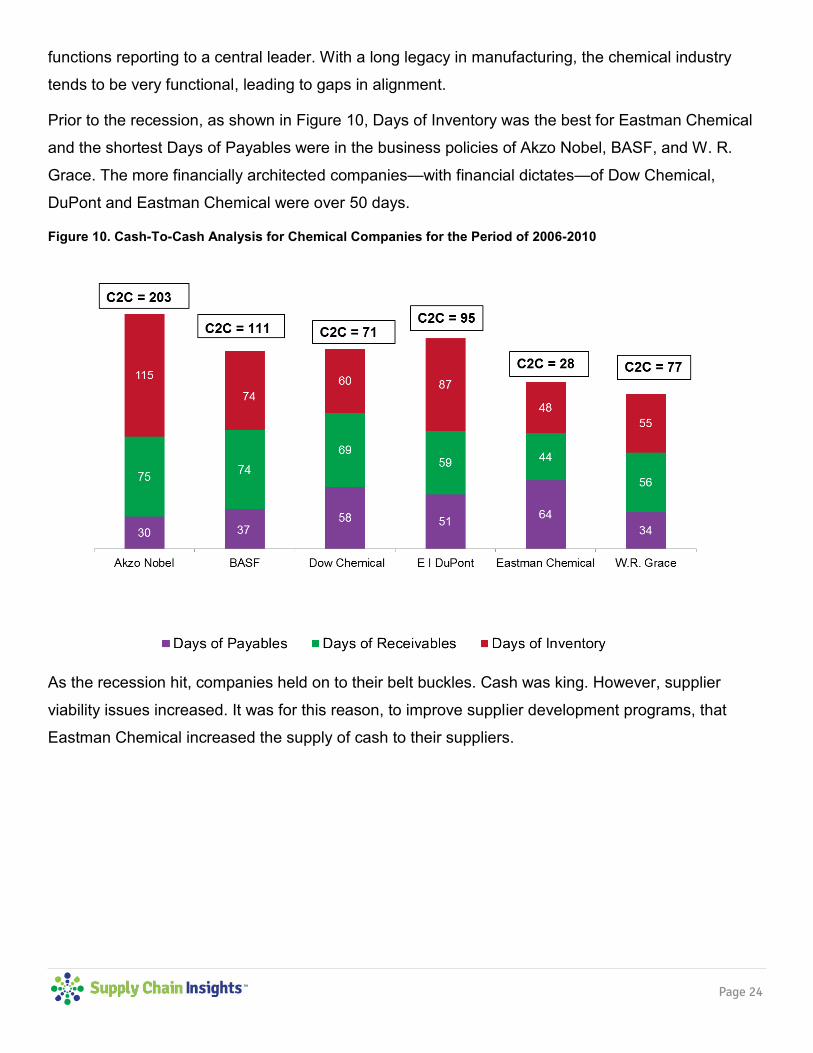
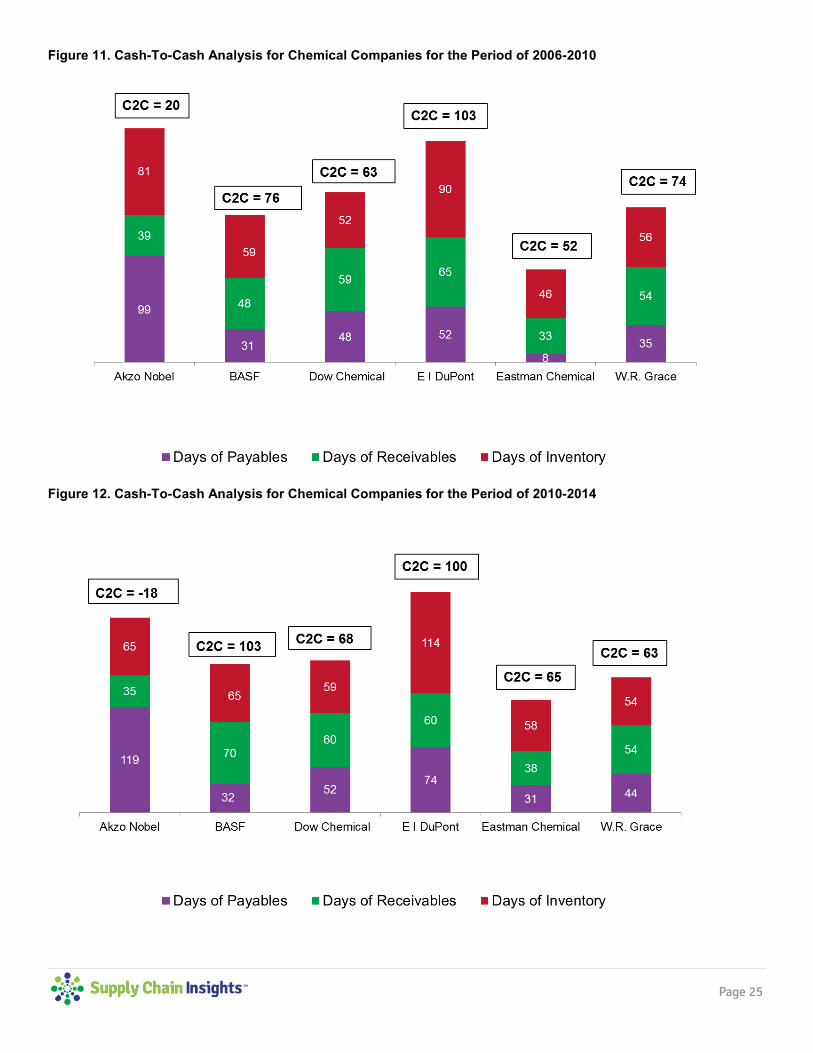
Prior to the recession, as shown in Figure 10, Days of Inventory was the best for Eastman Chemical
and the shortest Days of Payables were in the business policies of Akzo Nobel, BASF, and W. R.
Grace. The more financially architected companies—with financial dictates—of Dow Chemical,
DuPont and Eastman Chemical were over 50 days.
Figure 10. Cash-To-Cash Analysis for Chemical Companies for the Period of 2006-2010
As the recession hit, companies held on to their belt buckles. Cash was king. However, supplier
viability issues increased. It was for this reason, to improve supplier development programs, that
Eastman Chemical increased the supply of cash to their suppliers.
Page 25
Figure 11. Cash-To-Cash Analysis for Chemical Companies for the Period of 2006-2010
Figure 12. Cash-To-Cash Analysis for Chemical Companies for the Period of 2010-2014
Page 26
In the post-recession period, Akzo Nobel, and DuPont continued to lengthen the Days of Payables.
We do not find it surprising that the companies with the shortest Days of Payables also have the best
inventory management. The programs are more systemic, and less reactive, with a focus on driving
value in the value chain.
While many consulting companies will come into a company and recommend inventory targets and
lengthening Days of Payables, it is important to stay grounded on the basics of Supply Chain
Management. Inventory is the primary buffer for the supply chain and should not be artificially
manipulated to meet market expectations. Likewise, Days of Payables should not be leveraged to
self-finance the company. Both actions can throw the supply chain within the company out of balance.
Page 27
Recommendations In supply chain benchmarking, it is important to look at performance and improvement of peer
companies over time. The orbit charts are useful to see these patterns. As companies do this work,
we recommend that they:
1) Build a Guiding Coalition Based on Chemical Industry Data. Organizations should benchmark
companies within an industry. Each industry has unique rhythms and cycles.
2) Understand the Potential of Your Supply Chain and Orchestrate Trade-offs on the Effective Frontier. Supply chain leadership teams should analyze the total portfolio of metrics and study
progress at the intersections of the Effective Frontier. Companies with higher performance are using
more advanced analytics to plan outcomes and design the supply chain.
3) Apply Systems Theory. Teams should evaluate performance over time to understand improvement
while realizing that they are managing a complex system.
4) Focus on Building Value Networks. The chemical industry, overall, needs to build value networks.
The average company is not good at supply chain planning or network design, and they have been
slow to improve end-to-end value chains, from the customer’s customer to the supplier’s supplier. While
there are a myriad of consultants circulating within the chemical industry touting ‘best practices’, we find
that they are out of touch with the processes and improvements made within other industries such as
consumer packaged goods and high-tech and electronics. The end result is a more efficient supply
chain with the lowest cost per case, but without improvement in a balanced set of portfolio metrics.
5) Learn from Other Industries and Use a Steady Hand to Drive Improvement. Companies within
the chemical industry have been insular over the last decade. Funding for travel and conferences has
been difficult, and many of the supply chain projects have been led by Information Technology teams or
Finance. It is time for the supply chain leader to step up to the plate and drive a supply chain
transformation.
Conclusion The chemical industry had stronger performance in the period prior to the recession than after. With
the increase in connectivity, the chemical companies have been slow to adopt new technologies and
processes to improve the Effective Frontier. With so many stuck on the Effective Frontier, we must
ask if now the right time change these processes.
Page 28
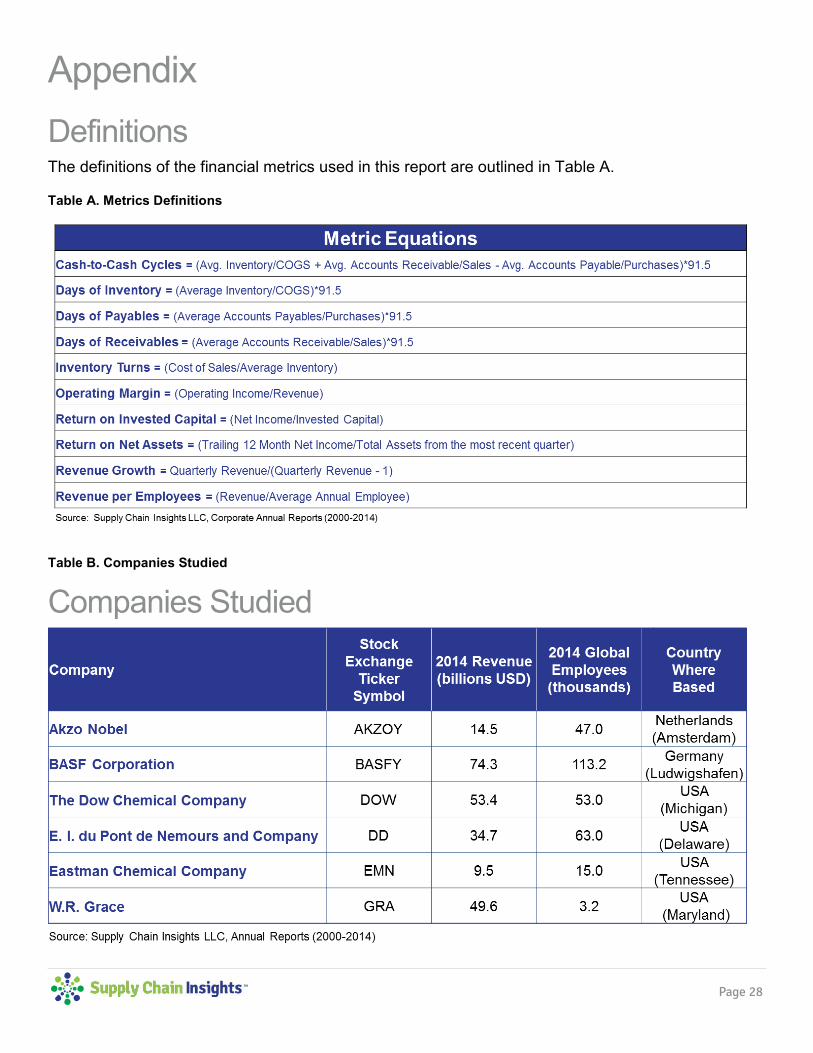
Appendix Definitions The definitions of the financial metrics used in this report are outlined in Table A.
Table A. Metrics Definitions
Table B. Companies Studied
Companies Studied
Page 29
Prior Reports in This Series Over the course of the last three years, our methodology has changed and matured. You can track
our progress, and while we are looking at each industry again in 2015 (and have finished a closer
look at the pharmaceutical manufacturing and the chemical industry), you can find industry-specific
information here:
Supply Chain Metrics That Matter: A Focus on Retail Published by Supply Chain Insights in August 2012.
Supply Chain Metrics That Matter: A Focus on Consumer Products Published by Supply Chain Insights in September 2012.
Supply Chain Metrics That Matter: A Focus on the Chemical Industry Published by Supply Chain Insights in November 2012.
Supply Chain Metrics That Matter: The Cash-to-Cash Cycle Published by Supply Chain Insights in November 2012.
Supply Chain Metrics That Matter: A Focus on the Chemical Industry Published by Supply Chain Insights in December 2012.
Supply Chain Metrics That Matter: Driving Reliability in Margins Published by Supply Chain Insights in January 2013.
Supply Chain Metrics That Matter: A Focus on Hospitals Published by Supply Chain Insights in January 2013.
Supply Chain Metrics That Matter: A Focus on Brick & Mortar Retail Published by Supply Chain Insights in February 2013.
Supply Chain Metrics That Matter: A Focus on Medical Device Manufacturers Published by Supply Chain Insights in February 2013.
Supply Chain Metrics That Matter: A Focus on Consumer Electronics Published by Supply Chain Insights in April 2013.
Supply Chain Metrics That Matter: A Focus on Apparel Published by Supply Chain Insights in May 2013
Supply Chain Metrics That Matter: A Focus on Contract Manufacturing Published by Supply Chain Insights in August 2013
Page 30
Supply Chain Metrics That Matter: A Focus on the Automotive IndustryPublished by Supply Chain Insights in October 2013
Supply Chain Metrics That Matter: A Closer Look at the Cash-To-Cash Cycle (2000-2012) Published by Supply Chain Insights in November 2013
Supply Chain Metrics That Matter: Third Party Logistics Providers Published by Supply Chain Insights in December 2013
Supply Chain Metrics That Matter: A Critical Look at Operating Margin Published by Supply Chain Insights in December 2013

Page 31
About Supply Chain Insights, LLC Founded in February, 2012 by Lora Cecere, Supply Chain Insights LLC is focused on delivering
independent, actionable, and objective advice for supply chain leaders. If you need to know
which practices and technologies make the biggest difference to corporate performance, turn to us.
We are a company dedicated to this research. Our goal is to help you understand supply chain
trends, evolving technologies and which metrics matter.
About Lora Cecere Lora Cecere (twitter ID @lcecere) is the Founder of Supply Chain Insights LLC and
the author of popular enterprise software blog Supply Chain Shaman currently read
by 5,000 supply chain professionals. She also writes as a Linkedin Influencer and
is a a contributor for Forbes. She has written three books. The first book, Bricks
Matter (co-authored with Charlie Chase). published in 2012. The second book, The
Shaman’s Journal, published in September 2014, and the third book, Supply Chain
Metrics Metrics That Matter, published in December 2014.
With over twelve years as a research analyst with AMR Research, Gartner Group, and Altimeter Group, and now as a Founder of Supply Chain Insights, Lora understands supply chain. She has
worked with over 600 companies on their supply chain strategy and speaks at over 50 conferences a
year on the evolution of supply chain processes and technologies. Her research is designed for the
early adopter seeking first mover advantage.