supply chain risk management fundamental theory and
TRANSCRIPT

UNIVERSIDAD DE VALLADOLID
ESCUELA DE INGENIERIAS INDUSTRIALES
Grado en Ingeniería en Organización Industriales
Supply Chain Risk Management fundamental
theory and guideline to build a resilient
supply chain
Autor:
Pando Villegas, Elena
Ángel Manuel Gento Municio
Albstadt-Sigmaringen University
Valladolid, diciembre, 2020.
TFG REALIZADO EN PROGRAMA DE INTERCAMBIO
TÍTULO: Supply Chain Risk Management fundamental theory and
guideline to build a resilient supply chain
ALUMNO: Elena Pando Villegas
FECHA: 18 de agosto de 2020
CENTRO: Centro en la universidad de destino
UNIVERSIDAD: Albstadt-SIgmaringen University
TUTOR: Dr. Bernd Stauß

Resumen
El presente informe recoge un Trabajo Fin de Grado realizado durante el semestre
de primavera 2020 en la Universidad de Albstadt-Sigmaringen. El objetivo es
investigar la teoría fundamental y presentar los hallazgos sobre la gestión de riesgos
dentro de una cadena de suministro y redactar una directriz genérica para
implementar un plan estratégico de gestión de riesgos que pueda aplicarse a
cualquier empresa.
Debido a la complejidad de las cadenas de suministro en la industria, la creciente
globalización y el paradigma evolucionando hacia una producción ágil y flexible, las
empresas enfrentan muchos riesgos en sus cadenas. Además, la situación
pandémica destaca la necesidad de un plan de acción estratégico para enfrentar
todo tipo de riesgos y construir una cadena de suministro resiliente. Estas tareas de
gestión son útiles tanto para eventos excepcionales, como para lograr una cadena
de suministro más eficiente que aporte una ventaja competitiva a la empresa.
Palabras clave: Gestión del Riesgo, Cadena de Suministro, Resiliencia, Logística,
Plan Estratégico
Abstract
The current report accounts a Bachelor Thesis made during the spring semester of
2020 at the University of Albstadt-Sigmaringen. The aim of this thesis is to
investigate the fundamental theory and present the findings about risk
management within a supply chain and write down a generic guideline to implement
a strategic plan for risk management that can be applied to any company.
Due to the complexity of supply chains in the industry, the increasing globalization
and evolving paradigm to agile and flexible production, organizations face many
risks regarding their supply chains. In addition, the living situation of a pandemic
highlights the need of a strategic action plan to face all kinds of risks and build a
resilient supply chain. These management tasks are not only helpful for exceptional
events, but to achieve a more efficient supply chain which could bring a competitive
advantage to the company.
Keywords: Risk Management, Supply Chain, Resilience, Logistics, Strategic Plan

Faculty of Engineering Business Administration and Engineering
Topic
Supply Chain Risk Management fundamental theory and guideline to build a resilient supply chain
Bachelor-Thesis Submitted in fulfilment of the requirements for the academic degree
Bachelor of Science
Submitted in the spring semester 2020 on 18.08.2020
Inquiries about this publication should be addressed to
Elena Pando Villegas Student number: 90665
Poststraße 22/1 72458 Albstadt
Business Engineering and Administration Semester 7
e-mail: [email protected]
1. Supervisor/Examiner: Prof. Dr. Bernd Stauß, University of Albstadt-Sigmaringen 2. Examiner: Prof. Dr. German Nemirovski, University of Albstadt-Sigmaringen


Table of content
I
Table of content
List of figures ............................................................................................................ III
List of tables .............................................................................................................. V
List of abbreviations ................................................................................................ VII
Academic honesty declaration .................................................................................. IX
Abstract ................................................................................................................... XI
1. Risk and Risk Management theory ..................................................................... 1
1.1 What is risk? ......................................................................................................... 1
1.2 Types of risk ......................................................................................................... 3 1.2.1 Sort out by nature ........................................................................................................... 3
1.2.2 Sort out by objective ....................................................................................................... 5
1.2.3 Sort out by perspective ................................................................................................... 7
1.3 Dealing with risk ................................................................................................... 8 1.3.1 Risk management ............................................................................................................ 9
1.3.2 Identify and analyse risks .............................................................................................. 13
1.3.3 Evaluate risks ................................................................................................................. 14
1.3.4 Risk management strategies ......................................................................................... 16
1.3.5 Methods to assess risks ................................................................................................. 17
1.4 Risk Management by law .................................................................................... 21
1.5 Globalization ...................................................................................................... 22
1.6 Pandemic risk management ................................................................................ 23 1.6.1 Classification ................................................................................................................. 23
1.6.2 Risks ............................................................................................................................... 23
1.6.3 Management ................................................................................................................. 24
1.6.4 Conclusions ................................................................................................................... 25
2 Fundamental Supply Chain Theory .................................................................... 27
2.1 Introduction to logistics ...................................................................................... 27
2.2 Supply Chain ....................................................................................................... 29 2.2.1 Introduction .................................................................................................................. 29
2.2.2 Network levels ............................................................................................................... 35
2.2.3 Vulnerability and global enterprise ............................................................................... 36
3 Resilience theory .............................................................................................. 39
3.1 History review .................................................................................................... 39 3.1.1 Definitions ..................................................................................................................... 39
3.1.2 Evolution ....................................................................................................................... 40
3.1.3 Application .................................................................................................................... 44
3.2 Factors ................................................................................................................ 45
References
II
3.2.1 Main factors .................................................................................................................. 45
3.2.2 Secondary factors .......................................................................................................... 45
3.2.3 Features ........................................................................................................................ 47
3.2.4 Intrinsic factors .............................................................................................................. 48
3.2.5 Measuring resilience ..................................................................................................... 50
3.3 Lean .................................................................................................................... 52 3.3.1 Aim of lean manufacturing and logistics ....................................................................... 52
3.3.2 Main concepts ............................................................................................................... 53
3.3.3 Balanced lean within supply chain ................................................................................ 55
3.3.4 Globalization ................................................................................................................. 57
3.3.5 Pandemic scenario ........................................................................................................ 58
4 Strategy for Risk Management in Supply Chains ............................................... 61
4.1 Introduction to methodology .............................................................................. 61 4.1.1 Features of a SCRM process .......................................................................................... 61
4.1.2 Resilience Managing Risks in Supply Chains .................................................................. 63
4.2 Problem formulation .......................................................................................... 64 4.2.1 Define the case of study ................................................................................................ 64
4.2.2 Describe the object of study ......................................................................................... 65
4.2.3 State goals ..................................................................................................................... 66
4.3 Data .................................................................................................................... 69 4.3.1 Collect ........................................................................................................................... 69
4.3.2 Process .......................................................................................................................... 71
4.3.3 Analyse .......................................................................................................................... 72
4.4 Processes of SCRM .............................................................................................. 72 4.4.1 Risk identification .......................................................................................................... 72
4.4.2 Risk analysis ................................................................................................................... 73
4.4.3 Risk evaluation .............................................................................................................. 73
4.4.4 Action planning ............................................................................................................. 75
4.4.5 Implementation ............................................................................................................ 80
4.4.6 Control and monitoring ................................................................................................. 80
4.5 Tools, technologies and resources ...................................................................... 83 4.5.1 Tools .............................................................................................................................. 83
4.5.2 Software technologies ................................................................................................... 90
4.5.3 Human resources .......................................................................................................... 92
5 Sectors of application ....................................................................................... 93
5.1 Health care ......................................................................................................... 93
5.2 Industry .............................................................................................................. 98 5.2.1 Automotive field ........................................................................................................... 99
5.2.2 Aerospace field ............................................................................................................ 102
5.2.3 Electronics field ........................................................................................................... 104
6 Conclusion ...................................................................................................... 107
References ............................................................................................................. 109

List of figures
III
List of figures
Figure 1.1. Risk management process -adapted from (Vasvári, 2015). ...................................... 13
Figure 2.1 Supply chain scheme ................................................................................................. 29
Figure 2.3 Supply chain levels -adapted from (Water, 2007) ..................................................... 36
Figure 3.1. Conceptual framework of resilience -adapted from (Rutter, 2013). ........................ 40
Figure 3.2. Measurement of resilience -adapted from (Pettit, Fiksel, & Croxton, 2010). .......... 42
Figure 3.3. Resilience in time -adapted from (Sheffi & Rice Jr, 2005) ........................................ 51
Figure 3.4. Balanced resilience -adapted from (Pettit, Fiksel, & Croxton, 2010) ........................ 56
Figure 5.1 Comparison of costs .................................................................................................. 96
Figure 5.2 Example of objective for a hospital ........................................................................... 98
Figure 5.3 Urgency of develop plans for SCRM .......................................................................... 99
Figure 5.4 Effect of strategies – adapted from (Chopra & Sodhi, 2004) ................................... 101


List of tables
V
List of tables
Table 1.1. Comparison of management attitudes ...................................................................... 12
Table 1.2. Qualitative methods .................................................................................................. 18
Table 1.3. Quantitative methods ................................................................................................ 20
Figure 2.2 Porter's value chain ................................................................................................... 31
Table 3.1 Secondary factors ....................................................................................................... 46
Table 3.2. Advantages and disadvantages of globalization ........................................................ 57
Figure 4.1. PDCA example .......................................................................................................... 62
Figure 4.2. General goals example ............................................................................................. 67
Figure 4.3 HTP method example ................................................................................................ 74
Figure 4.4. Strategic objective example ..................................................................................... 77
Table 4.1. Good practices for resilient supply chain risk management ...................................... 79
Figure 4.5 Flow process chart ..................................................................................................... 85
Table 4.2. Comparison of risk identifying methods .................................................................... 86
Figure 4.6 Cause-effect diagram ................................................................................................. 88
Figure 4.7 FMEA template .......................................................................................................... 89
Table 5.1 FMEA example for a hospital ...................................................................................... 95
Table 5.2 Strategies for shortage of protective equipment ....................................................... 96
Table 5.3 Common risks in automotive field ............................................................................ 100
Table 5.4 Proposed strategies for automotive field ................................................................. 101
Table 5.5 Risks for aerospace industry ..................................................................................... 103
Table 5.6 Example of strategic actions ..................................................................................... 104
Table 5.6 Comparison of companies’ performance facing same disruptive event .................. 105


List of abbreviations
VII
List of abbreviations
IT Information Technology
RM Risk Management
RPN Risk Priority Number
SC Supply Chain
SCRM Supply Chain Risk Management


Academic honesty declaration
IX
Academic honesty declaration
I, Elena Pando, hereby confirm that I have written the accompanying thesis by myself, without contributions from any sources other than those cited in the text and acknowledgements. This applies also to all graphics, drawings, maps and images included in the thesis.
Albstadt, August 18th, 2020
Elena Pando Villegas


Abstract
XI
Abstract
The current report accounts a Bachelor Thesis made during the spring semester of 2020 at the University of Albstadt-Sigmaringen. The aim of this thesis is to investigate the fundamental theory and present the findings about risk management within a supply chain and write down a generic guideline to implement a strategic plan for risk management that can be applied to any company.
Due to the complexity of supply chains in the industry, the increasing globalization and evolving paradigm to agile and flexible production, organizations face many risks regarding their supply chains. In addition, the living situation of a pandemic highlights the need of a strategic action plan to face all kinds of risks and build a resilient supply chain. These management tasks are not only helpful for exceptional events, but to achieve a more efficient supply chain which could bring a competitive advantage to the company.
This paper contains five main chapters around the topic and is structure as follows. The first chapter is an approach to the concept of risk in its complexity, so then focus on those present within an organization and how to manage them. The second one refers to the term of supply chain and describes its features, trends and elements. Then, the third chapter is focus on the need to build a supply chain that is able to overcome disruptions -a resilient one- looking first into the history of the concept of resilience and then applying and giving some keys and ways to achieve it. The fourth chapter is a guideline that describes the steps and methods of supply chain risk management that leads to a successful and competent structure thanks to action plans. The last chapter is a brief compilation of real cases where risk management was the key facing disruptive events, so some examples can enlighten procedures and strategies.
At the end, a conclusion to interpret briefly the findings of the investigation is presented.
Key words: Risk Management, Supply Chain, Resilience, Strategic Plan


Risk and Risk Management theory
1
1. Risk and Risk Management theory
1.1 What is risk?
Risks have ever existed, everybody is aware of the reality of risk, uses it in their daily lives and understands it as an undesirable thing and suffers it, but give a simple definition is not easy. This concept is complex and ambiguous because it depends on too many factors, still here we will try to make an approach.
Firstly, it must be said that the complexity of the risk lies in how it occurs, what causes it and what it causes. Risk can be measured by these factors: impact, frequency, and severity; but the risk itself is not an entity and is, therefore, complex.
Secondly, the risks differ in a wide range depending on the situation and individuals affected. The individuals part involves how they respond to these risky events, including people and companies, and the situation is related to their vulnerability. Notice here that competitors and stakeholders are also companies involved and that they management facing risks and adverse situation will also define the own company exposure and impact of a risky event. So, a risk can have an adverse outcome but, still, be beneficial compared with how it affects to your competitors (Hamilton, 1996).
In general terms, risk is defined by the British Royal Society as “the probability that a particularly adverse event occurs during a stated period of time, or results from a particular challenge” (Royal Society Study Group, 1992). But in that definition the factor of the consequences is not considered and seems incomplete.
Should be considered that the main feature of a risk is its uncertain nature. What makes a risk dangerous is the fact that no one knows exactly the consequences, when and how will happen. However, some events can be expected, or several scenarios and their size and probabilities, so a company can measure the risk in advance and take containment measures, but never know the reality before it takes place.
Into the society, a risk is seen as something negative and a great amount of definitions show it that way. The definition given by Sitkin and Pablo, solves the first problem about the uncertain nature missing on the previous description. They define risk as “the extent to which there is uncertainty about whether potentially significant and/or disappointing outcomes of decisions will be realized” (Sitkin & Pablo, 1992).
The second problem is the difference between risks with positive or negative outcomes. A risk always implies a potential adverse result, but sometimes there is also a chance for a good outcome. Hamilton sorts these two kinds of risks as dynamic or static. The static risks are the most common and known for everybody; the consequences are always negative and bring undesirable situations. On the other hand, the dynamic risks can bring both positive and negative outcomes, what means that are more likely to be managed because they can bring in a profit or loss, but also a company can manage to loss the least amount of money or affected resources. Hamilton also argue that a company that is steadfast arranging its static risk, would be better and would likely earning more profits from dynamic risks (Hamilton, 1996).

References
2
Taking into account the above, according to the ISO 31000:2018 standards, a risk is an “effect of uncertainty on objectives”, understanding effect as a potential -positive, negative or neutral- deviation from the expected, that brings opportunities or threats to the targets defined by the organization under different levels of strategic objectives (International Organization for Standardization, 2018). This way, both problems are solved and is the most accurate and realistic description. To understand the positive part better, may see an example: gambling is a risk that a lot of people take because one of the possible consequences is positive -earn a great amount of money- but, mainly, it turns into an undesirable situation.
Now that the main concept is a bit clearer, let us focus on the definition within different fields of application. Since risk also depends on context and environment, even the same risk may be different within one area from another or from one company to another.
As the topic of this work is related with risks becoming adverse events and manage them within the supply chain, we can see first an approach for an organization. The characteristics that risks have within organizations, despite being able to share them with other areas, are three described by Deloach and summarized as follows; the severity of exposure to adverse events, the possibility of such changes occurring and the competence to handle business impacts if they do occur (Deloach, 2000).
There are five categories where every risk in an organization can be classified according to Valla. Those are the following areas: technical, financial, service, delivery, and supplier and customer long-term connections (Valla, 1982). The last one is basically the supply chain, and implies more elements and, therefore, more risks. Is where managers are focusing, trying to improve the performance on that field. Moreover, this work wants to study that area, so the supply chain risk is being defined next.
Going more specifically, there are several attempts to define supply chain risk, although here we will see the most accurate ones. The definition is divided in two parts, according to different authors. Harland et al. made the following description: “adversely affects inward flow of any type of resource to enable operations to take place” (Harland, Brenchley, & Walker, 2003). The reason this definition is more precise, lies in the fact that they mention any type of resource. Other definitions are focus only on the flow of materials and problems with suppliers. However, workers and setbacks related with the correct performance of the work are also elements of the supply chain, therefore the managers should take care of the risks associated with those resources.
Nevertheless, another important element is missing on the previous definition: the customer. In that terms, Zsidisin made a compilation of several factors defining supply risk as
the probability of an incident associated with inbound supply from individual supplier failures or the supply market occurring, in which its outcomes result in the inability of the purchasing firm to meet customer demand or cause threats to customer life and safety. (Zsidisin G. A., 2003, pp.6).
The uncertainty of the outcomes is related to the changeability of the results, the lack of information about the disposal of the potential results and the impetuousness of achieving the results. For example, within a supply chain there may be uncertainties in results, which are
References
3
related to whether a supplier can make changes to product design and new product specifications in due course (Bidault, Despres, & Butler, 1998).
1.2 Types of risk
As it has been said, risk depends on several factors and is define by how it affects to the milieu and what causes it. Also, according to the definition, risk have a different relevance in order to the strategic objective. Each author makes their own classification of risks, although they all gather the same basis of risks. So the classification could be by the factors that cause that risk, if they are internal or external (Trkman & McCormack, 2009), continuous or discrete and so on; by the objective of the risk, that means, which field inside the company the risk impacts to: strategical, operational or competitive; and by which perspective of the balance scorecard is affected: financial, customers, internal processes or learning (Harland, Brenchley, & Walker, 2003).
The goal of distinguish between types of risk is to make easier the task of identify them. In addition, that helps to choose the suitable method to manage them. In the next section the risks considered are those that bring, at least, negative impact over the supply chain. This process is worth a little bit if the risk cannot be controlled or reduced by improving some of the actions within the supply chain flow or even transmission of information with the outsiders.
1.2.1 Sort out by nature
The first classification, called by nature, focuses on the events that cause the risks: the causes. The sorting given by Trkman and McCormack, divides the risks of a supply chain into two categories: endogenous risks caused by the activities of the company throughout the supply chain and exogenous risks caused by external environment which interact with the company in the supply chain (Trkman & McCormack, 2009).
1.2.1.1 Endogenous risks
When the source of the risk lies in the activities carried out by the organizations, more specifically throughout the supply chain, and over which there may be some control, they are called endogenous risks. They are closely related to the interactions between the different links of the SC and many of the solutions proposed below are based on this aspect.
The previously mentioned authors include the causes of endogenous risks in two subtypes, namely, turbulence in technology and the market. Turbulences are events that stress risks and make the task to forecast them more difficult. Some of them strike a single company, other are common for every organization within a field. Therefore, a large supply chain -which is integrated by companies from different sectors- is high likely to face more risks (Trkman & McCormack, 2009), although have support during adverse events in exchange.
- Technological turbulence. Today technological changes are rapid and affect the entire industry, so not knowing how to adapt to them is a risk. Innovation capacity also falls within this category. Technology can refer to the product or service offered or to the resources and machinery used (Hsu & Chen, 2004). The supply chain is important in this regard because, not only is it where the technological value for the customer is created and a

References
4
large part of the technological resources are used, but the transmission of information along the links is very important for respond quickly to constant technological changes (Fynes, de Búrca, & Voss, 2005). The success of knowing how to adapt to changes in technology does not reside just in the company itself, but also in all the partners. Retaining those suppliers that add competitive advantage is important and retaining those that do not provide that technological value implies exposing yourself to more risks (Trkman & McCormack, 2009). The main technological risks are exponential changes in trends, long-term unpredictability, obsolescence of resources, being a company reluctant to change and with little room for change.
- Market turbulence. Related to customers and market demand. As in the previous case, the changes are very fast and can affect only one company or the entire sector. However, the impact on relations with suppliers in the supply chain and the behaviour of the company vary depending on the speed of change, that is, on the market turbulence. A high level of turbulence implies greater risk exposure, so companies tend to reach agreements and make a joint effort to overcome the changes and risks they may face. In a less variable environment, cooperation is lower and companies prefer to assume less frequent risks but allowing a faster response since communication through the supply chain is not necessary (Chatterjee, 2004). Some of the events that cause the risks are short-term changes in the tastes and demands -often driven by innovation- of customers, the variation in demand, changes in manufacturing costs due to having to adapt to demand, price variation or dealing with competitors (Calantone, Garcia, & Dröge, 2003). In these cases, one way to avoid or at least reduce risks is to have a competitive advantage to face rivals and gain customer loyalty.
The risks that occur within the company are also called micro risks by Ho et al. (Ho, Zheng, Yildiz, & Talluri, 2015). Those are not considered turbulences as they are more recurrent events beginning straightforwardly from the internal activities of the companies or the connections between the partners in the supply chain and with less impact.
They can be divided into subcategories:
- Production risks: alludes to unforeseen situations or circumstances inside companies that influence their internal ability to deliver goods and services, the quality and chance of manufacture, just as rentability (Wu, Blackhurst, & Chidambaram, 2006).
- Demand and supply hazards: referred to the dangers of adverse occasions related with the partners and upstream and downstream procedures of an organization (Zsidisin G. A., 2003).
- Infrastructure dangers: for the correct performance of a supply chain several components interfere inside three basic frameworks such as information technology, logistic systems and financial issues (Wu, Blackhurst, & Chidambaram, 2006).
1.2.1.2 Exogenous risks
On the other hand, the sources of risks that escape from the internal management by the organization are exogenous risks. These events are difficult to control or avoid, because they do

References
5
not occur within the company, but are caused by environmental factors and can affect, for example, the entire sector or a specific geographical location. There are many ways to subdivide this type, but in this work we will focus on the classification given by Trkman and McComack (Trkman & McCormack, 2009) according to its performance throughout time: continuous and discrete events.
- Continuous events are those that are long-lasting in time, relatively easy to predict, low impact and normally affect the whole sector, although they can create other competition risks. To manage these causes, many related to financial impacts, the cost of damage can be predicted and calculated and included in the profit margins. Also, they tend to have a long-term impact but less severe. Some more common examples are inflation, the variation in the price of materials, as well as the change in the consumer price index (Aggarwal & Ganeshan, 2007).
- Discrete events have a greater impact and cost in the company. They are less frequent than continuous ones, but the consequences are worse for two reasons: they are usually significant disruptions, that is, with a very large impact, and they are less predictable, and companies are not prepared to face them as well as events. continuous. The last reason has to do with the perception of risk the manager has. Acting against any discrete event that may occur involves a significant outlay of money, and managers prefer to focus on reducing and controlling the continuous. Natural catastrophes, epidemics and pandemics, and political actions including laws, strikes, terrorism and other types of attack can be highlighted in this category. These cases are those with the greatest impact, least frequency and those that cause critical moments in a company. However, some natural disasters can be intuited as earthquakes in areas of high seismic activity (Faisal, Banwet, & Shankar, 2006). Other types of discrete events are setbacks in transportation or delivery (Wilson, 2007) which can be reduced with proper logistics management and collaborating with trusted, high-performing entities.
Aside from the common risks into this category, a questionnaire built by Trkman and McCormack shows proofs about the most significant sources of risk that worry the managers. Related to continuous risks the study highlights on the first places, and in that order starting from the most important: the interest rates and variations in the consumer price index, in the gross domestic product and in commodity prices. Moving to discrete events, the concerns about potential disruptions are highly focus on regulatory issues, man-made actions, natural hazards, unforeseen events during transportation and due to other discrete events (Trkman & McCormack, 2009).
1.2.2 Sort out by objective
There are three hierarchical or functional levels into which a company is divided: strategic, operational and competitive, and they are a risk objective. These levels are made up of tactics to correctly manage the company that may be affected or deviated from the original plan by both internal and external risks.

References
6
1.2.2.1 Strategic
The strategic objectives are the most general, encompassing the company at the organizational level. They analyse both the external environment and the internal situation. Then they set long-term goals. For these reasons, they are more exposed to risks and, normally, fill a great part of the workload of managers, as they are long-term and continuous -that is, high probability but less impact.
Risks at this level affect the implementation of strategic objectives. Simons developed a risk exposure calculator, which takes into account factors related to the potential growth and expansion of the company, the culture and mentality of the workers, and the management of the transmission of information. This method can be used at all levels, since it includes characteristics linked to all three.
At a strategic level, it is considered from the projection into the future to the decentralization of decision-making. Executives must measure and understand the level of risk exposure of their companies to link it to the strategy and establish consistent objectives. Being aware of exposure allows managers not to take too much risk on goals or to know where strategy is critical. On the other hand, the level of decentralization has been discussed, which helps to have defined information channels to facilitate the transmission of information, which when facing risks, rapid and complete communication is very important. Correct management of strategic risks leads to a balanced system between benefits, expansion and control (Simons, 1999).
1.2.2.2 Operational
This level is more closely related to the supply chain, as it includes all internal tasks of material transformation and manufacturing, the supply and distribution of the product to customers and demand. Risks at this level jeopardize the proper functioning of the chain and being able to produce or offer the service on time (Meulbroek, 2000). Other consequences affect operational, processing or even storage capacity. One of the stress points nowadays is the big expansion in the demand of goods and services, in a short time. Therefore, companies have to spread out their production capacity. A company that can adapt its production capacity quickly, producing with the same quality and at low cost, can better face the consequences of risks at this level. Although it is not enough to have the capacity, also adapt it, make it evolve and preserve it over time (Simons, 1999).
Therefore, some solutions that companies adopt is to work with several similar and nearby factories, operate at a lower capacity normally to have room for expansion when an adverse event occurs, or store more safety stock to face increases in demand or production shortages (Meulbroek, 2000). Despite being solutions, they can be very expensive and bring other risks such as the obsolescence of goods and resources.
1.2.2.3 Competitive
An external and internal analysis helps determine the threats that a company may face from competitors and the weaknesses that lie within the company, as well as the opportunities for improvement in the market and the strengths it has to combat weaknesses. The competitive level aims to differentiate a company from its competitors, be it for a distinguished product or service, brand image or competitive advantage in the process (Hamilton, 1996).

References
7
Competition is a threat itself and involves risks. It brings consequences such as loss of customers, decrease in benefits or obsolescence of own products or resources. There is also internal competition, which is related to internal risks or weaknesses. The most common cause is a lack of communication between departments or workers, believing that withholding essential information can be an individual advantage in getting a promotion or promotion (Simons, 1999) while the reality is that this actions add risks to the supply chain where quick and relevant communication is essential.
1.2.3 Sort out by perspective
The integrate management of the company is divided into four perspectives according to the balance scorecard: financial, clients, internal processes and learning and growth. These pillars are a target for the risks where they can impact, and the division into these categories facilitates their management because the tasks in each area can be separated individually so that the workload is simplified; and, on the other hand, these perspectives have to be interrelated and there are connections and a flow of communication per se for the management of the company, so the transmission of information about risks that may affect several perspectives is effective and an advantage.
Briefly, the perspectives with some of the most common risks and potential consequences are exposed below:
Financial
All risks affect the financial part, because they all involve cost and monetary losses, in addition it is the most important perspective. However, there are some events that are directly related. Recently, financial transactions have been placed in the spotlight as risky actions. Speculation and inflation, foreign coinage, trade agreements and other financial instruments has brought most large companies to adopt some financial policies to reduce related risks. When a partner, a debtor in that case, delay on the payment or has any loss or default, the company is also exposes to a potential risk related to loss of money (Meulbroek, 2000).
Customers
Corporate and production strategy has evolved to focus on the customer. Companies produce with the customer in mind and offering the best benefits. In addition, customers vary their demands in a short time and are more difficult external agents to control. For these reasons, this perspective is highly exposed to risks. Demand-related causes include demand variation or changes in requirements, so companies adapt the capacity of the production chain and develop new materials. For example, environmental awareness reflected in products and processes is booming today.
On the other hand, after-sales service is a very important task that not all companies take into account. When the customer purchases a good or service, any failure of the product is the responsibility of the company. This translates into possible monetary losses either by return, replacement or compensation; image damage (Hamilton, 1996). These consequences can be avoided by guaranteeing quality and adopting a good after-sales service strategy.
Keep in mind that the client is not only the final buyer, but also intermediaries and third companies to whom we can offer a service or sell part of a product. Thus, risks during the

References
8
transportation or related with the distributors are also included. Take care of the partnerships and trust in several channels for logistic is a good contingency measure.
Internal processes
Similarly to operational risks, the internal processes of a company include all those related to the supply chain, internal communications, quality and the product itself (Hamilton, 1996). This perspective is widely measured and controlled by managers. As previously mentioned, some of the key points to face risks lie in operating normally with less than 100% capacity or holding safety stock. To the performance of the processes and producing with quality affects the work environment, both physical and the relationship between workers. So, keeping the workspace clean and clear and machines and resources well cared reduces many of the risks in this perspective.
In addition, coping with changes in demand from the customer perspective is easier and more agile in a chain where the conversion ratio is high, that is, it easily adapts to product changes. This includes a rapid transmission of information, implying that well-defined communication channels also reduce risks.
Learning and growth
This perspective is more linked to the human factor of the supply chain. Workers are a key link, so talent must be retained within the company since satisfied and motivated workers make fewer mistakes. The risks in this perspective are divided into two main groups: human risks that workers commit, and risks to which workers are subjected. The former cover a higher percentage, as Reason indicates, the root of many of the risks lies in human errors, considering these errors as deviations in the correct sequence or logical operation of an activity due to a failure of a person, without the intervention of external agents (Reason, 1990). These errors can create disruptions in the supply chain, production and reduce quality, which are, in fact, the higher threat to the company. The second refers to, for example, damages that workers may suffer in the course of their normal work, a low retention of talent that causes losses to both the company and the worker, or exposure to safety hazards, toxic compounds or others.
To deal with these causes, the company must develop training programs both to reduce human error and to create and retain talent. Favourable conditions for the development of work are regulations by law (Meulbroek, 2000) and also reduce workplace accidents - risks - and help motivate employees.
1.3 Dealing with risk
The goal of knowing the risks is to be able to face or manage them. A risk that cannot be managed evolves to a threat. All risks can be attacked in some way. Typically, managers have to choose between facing the risk, passing it on or taking it on. In case of facing the risk, a strategic plan must be planned, which includes all the measures, either they are prevention, contingency, mitigation or elimination.
This process of decision making and implementation of measures is called risk management. Next, is explained what it is and, more specifically, within supply chain, as well as the processes that comprise it.

References
9
1.3.1 Risk management
Risks are inherent to every action, therefore knowing how to manage them is an important task for everyone. For the royal academy, risk management is “the process whereby decisions are made to accept a known or assessed risk and the implementation of actions to reduce the consequences or probability of occurrence” (Royal Society Study Group, 1992). As risks are abstract entities, to measure and assess it should be considered as an event. These events are brought about factors that can be analysed, and they provoke impacts over which the company can take action, mitigate and control. In addition, most of the risk events are interconnected since one factor can lead to several risk scenarios (Aqlan & Lam, 2015).
In order to face risk in an organization, associated with uncertainty, to reduce the risk we shall anticipate possible scenarios to prevent and act according to how the impact and consequences can turn to our favour. If the chances or effects impact negatively, take actions to reduce the outcomes; for positive effects, predict the most profitable scenario and carry out that situation (Borge, 2002). Risk management allows to evaluate and manage uncertainties while creates value by lining up corporate strategy, internal processes of the SC, human resources, technology and knowledge (Deloach, 2000).
As risks have increased exponentially over the past decades, in part due to the globalization and complex of the companies and, specifically, the supply chains, all the technologies and connections around the world. For that reason, manage risks have become also a gargantuan task (Christopher, Mena, Khan, & Yurt, 2011). Every company hopes to guarantee stability as it grows only by managing the threats that affect the process and the business. Not knowing the risks that may affect the business can cause the organization to suffer losses. For the contrary, be able to predict risks means have an advantage.
1.3.1.1 Elements
There are three components that shape risk management, that are common to every risky situation, not only into a company.
- Hazards. Are the undesirable part of the risks. Include all the factors and danger events that trigger adverse risks, as well as the negative outcomes. Both risks and consequences can be in short, medium or long-term, and that also determines whether the impact is less or more significant (Royal Society Study Group, 1992). Knowing the reality and the likelihood of the risks allow the organization to designate assets effectively. On the off chance that the organization comprehends the risks that influence them, they will realize which ones need more consideration and assets, and which ones can be disregarded. This process also empowers organizations to find a way to relieve vulnerabilities before significant damage happen and choose the proper method to tackle the risk and sources.
- Assessment. This is the whole process that embraces the research of decisions due to uncertain outcomes. It is basically the part of the risk management process where risks are identified and evaluated. The process can turn out to be tedious, costly and lasting because of lack of information. The important of communication is seen in that cases, but other are just hazards that cannot be analysed. The choice to either assess those

References
10
risks that we know and have enough data about, or invest a lot of time and resources in managing all risks. Both stages are extent described next on this chapter.
- Actions. Those are all the tasks, measures and ways taken by every individual person as worker, enterprise as society and the company to handle the risks. The actions can be proactive or reactive. Companies that choose the first ones take action before the adverse event occurs, applying measures such as eliminate or mitigate directly to the root of the problems, the causes. Here, what is being handle is the exposure to risk, not the risk itself. The second ones are applied after the event occurs trying to diminish the bad outcomes.
- Communication. Going through the supply chain the transmission of information and relevant data must be always update and be quick for the daily production. To manage risks this task intensifies. Reacting in time is vital to either prevent an adverse risk from occurring before it is too late or to reduce the negative consequences. To accomplish this labour, information technologies help make effective communication and ensure that the person who needs it receives important information when they need it. Many risks are interconnected, and communicate this information may save time, money and resources. Moreover, many SCRM strategies fail because of lack of communication and ignore the interconnections (Ho, Zheng, Yildiz, & Talluri, 2015).
1.3.1.2 Exposure to risk
It was mentioned the exposure to risk and should be explained because is an interesting issue. This term is not a measurable factor, because it depends on the perception of each person and experiences. It is more related to social context attitudes and believes. While we are assessing a risk, there are real consequences that will affect the company in a measurable way -could be at financial level, competitive or so on- but other component of the risk is the perception. At the time to choose the actions, believe that a risk is more important or could be more dangerous than the real impact is also a risk because may turn aside the view of relevant hazards. Also, the company could destiny a great amount of physical and financial resources that are not necessary. Moreover, misjudgements may create risk where there are none. On the other side, underestimate a risk is a bad practice as induce to do not take action even when the risk was identified (Royal Society Study Group, 1992).
People are expose to risks, but according to different situations, adaptability or previous experiences, different people facing the same risk will not act neither react the same way. In that way, Renn questions if risks are social constructions. For a company the situation is alike, but here the risk managers must be objective and do not react following feelings or social values. The causes of over perceive risks may lie in the abstract level of the risk, when it is not observable people tend to do not believe it is real; if the consequences are immediate or not -a practical example is the pollution risk- because both society and companies act only when they are in imminent danger; or if it is a new risk or there are previous experiences to copy the management or the consequences are estimated according to last situations. Related to this, when a risk is known but it has not occurred in a long time, the risk perception is lower (Renn, 1998).

References
11
1.3.1.3 Leadership attitudes for management
An action plan and the strategies adopted by each company can vary, since each supply chain is unique. Still, all managers need to consider some basic factors when planning the strategy. First, risk, then the corporation, and finally integration. Most companies delegate risk management to a trusted and experienced risk expert or employee, or management makes direct decisions based on strategy. They are separate but not independent strategies (Fraser, 2003). In other words, many companies take a single approach without taking into account that risk management has many points of view and involves many elements and even external organizations. There is a majority belief that risk management is beneficial and brings improvements to the organization and saves costs, but implementation has yet to be fully developed.
• Attitude 1: A manager assumes risk management in a company.
In this case, an expert in risk control and evaluation is responsible for investigating and analysing the chain, determining weak points, risks and taking control of preventive or acting actions depending on the moment. It is therefore responsible for creating the risk strategy. Normally, this is some person with characteristics that make them favourable for this job but who is foreign to the company and the SC. This means that they do not know in depth the processes, the connections or how the elements of the chain work.
This person must be the risk manager, because they are the most qualified to deal with risks and know how to act in each situation. He/she must act fast and think creatively.
• Attitude 2: The risk owner is assigned to manage the risk.
Owner is understood as the person responsible for the process, operations or element where the disruption occurs. This person is the one who knows the process and the supply chain best, who can best identify risks, some that can even escape an expert, because they know how the chain works and if there are certain links in which there is a weakness or a Repetitive failure due, for example, to a human factor. This person is indicated because they have specific knowledge and skills in the study SC, but they do not have specific strategy or risk management knowledge, only experience. In addition, each risk has an owner and are not related, when the risks are often related.
This person must be the actuator, who applies the strategies, supports and advises the manager at the risk identification stage. You must have experience in the company and know SC well.
• Attitude 3: Executives are in charge of planning.
This may be a committee, company executives, or strategic team, but they must know the overall strategic plan of the company and have experience in strategy planning. Typically, managers are highly knowledgeable about strategy and have a clear focus on the projection of the company. However, about risks and management, they can get to know the information they collect from interviews with employees and some similar method. They do not really know how SC works and their strategies are often oriented towards financial, administrative and managerial decisions, but they do not take into account SC needs.

References
12
This group must establish a strategy and projection of the supply chain. You must provide guidelines and objectives to align them with the SCRM.
• Attitude 4: Integration.
The previous points focused on a person or only a management point of view. As has been said, SCRM is not a single approach, and risks and the supply chain can be so large and complex that it cannot be left to one individual. Integrating risk management into the supply chain is a holistic approach, as Water calls it (Water, 2007). You must integrate the three previous elements is the roles that most fit. First, the board is the one who must give the vision of the company, create the culture of risk management and encourage the participation of employees to detect and apply the agreed measures. Although we have called the risk owner the person who works directly in risk operations, in the end the company and, therefore, the executives, are the owners of all risks in general and should be the precursors of the risk initiatives. Risk management. With clear guidelines, an expert or group of managing experts will proceed to analyse the chain and risks with the support of employees with deep knowledge in each area. During the process, different analysis techniques can be used, which may even lead to hypothetical situations for isolated and discrete cases. The risk-owning employees are in charge of applying the agreed measures, always under the supervision of the manager who provides the overall vision of the company and coordinates the actions.
In a committee where both executives, managers and employees participate, an action plan, risk plan, strategic plan or similar must be established in writing. This integration is transferred through all the SC.
Therefore, the fourth position defends a higher and better approach, compared to the other three as shown in Table 1.1.
Table 1.1. Comparison of management attitudes
Aspect
Attitude
Risk management knowledge
Knowledge about company’s supply chain
Level of collaboration
1: Manager High Low Low
2: Risk owner Low High Low
3: Executives Medium Medium Low
4: Integration High High High
1.3.1.4 Risk management process
Risk management is divided into departments, processes and capacities in an organization – it is a common component for all companies. Starting from this, there is a need of a standard procedure from to manage risks cause and consequences (Aqlan & Lam, 2015). The process is compound by the main stages showed in Figure 1.1.
References
13
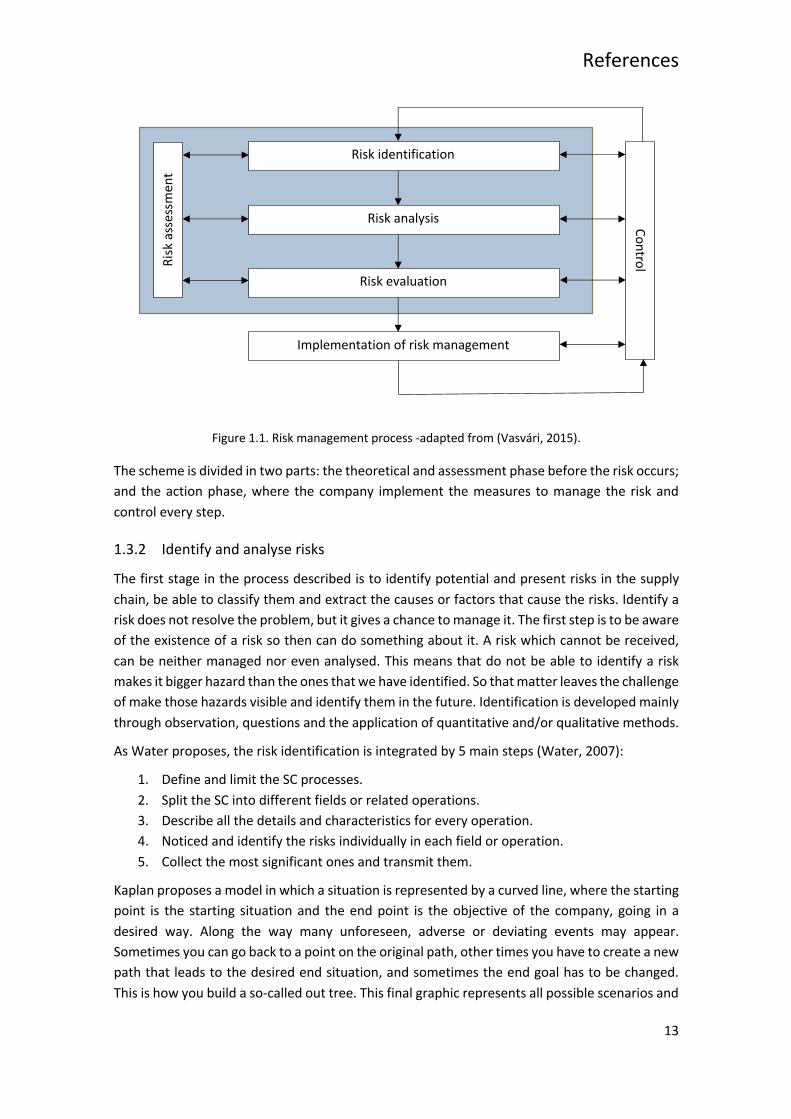
Figure 1.1. Risk management process -adapted from (Vasvári, 2015).
The scheme is divided in two parts: the theoretical and assessment phase before the risk occurs; and the action phase, where the company implement the measures to manage the risk and control every step.
1.3.2 Identify and analyse risks
The first stage in the process described is to identify potential and present risks in the supply chain, be able to classify them and extract the causes or factors that cause the risks. Identify a risk does not resolve the problem, but it gives a chance to manage it. The first step is to be aware of the existence of a risk so then can do something about it. A risk which cannot be received, can be neither managed nor even analysed. This means that do not be able to identify a risk makes it bigger hazard than the ones that we have identified. So that matter leaves the challenge of make those hazards visible and identify them in the future. Identification is developed mainly through observation, questions and the application of quantitative and/or qualitative methods.
As Water proposes, the risk identification is integrated by 5 main steps (Water, 2007):
1. Define and limit the SC processes. 2. Split the SC into different fields or related operations. 3. Describe all the details and characteristics for every operation. 4. Noticed and identify the risks individually in each field or operation. 5. Collect the most significant ones and transmit them.
Kaplan proposes a model in which a situation is represented by a curved line, where the starting point is the starting situation and the end point is the objective of the company, going in a desired way. Along the way many unforeseen, adverse or deviating events may appear. Sometimes you can go back to a point on the original path, other times you have to create a new path that leads to the desired end situation, and sometimes the end goal has to be changed. This is how you build a so-called out tree. This final graphic represents all possible scenarios and
Low Moderate High
Low
M
oder
ate
H
igh
Vulnerability
Ca
pabi
lity Increasing resilience
Risk identification
Risk analysis
Risk evaluation
Implementation of risk management
Control Risk
ass
essm
ent

References
14
is a task prior to those events occurring. Ideally, Kaplan says that all scenarios should be studied, but the difficulty is that it is not always physically possible or it is very expensive to study each case and take measures for each potential risk (Kaplan, 1997). Therefore, we must identify the important ones for our company.
The 90–10 principle is a theory explained by Viscusi where he discusses that companies allocate 90% of risk investment to manage 10% of risks. This implies allocating a lot of money to risks that may be difficult to solve or complex but that really do not have great relevance or impact (Viscusi, 1998). The appropriate point of view would be the Pareto Law, since it stipulates that 20% of the causes cause 80% of the consequences (Pareto, 1964). So, let us focus on reducing that 20% that results in further risk reduction, thus find balance between costs associated to manage the risks and cope with the consequences.
In this regard, correctly identifying risks implies classifying them according to nature, area, objective, ... but also identifying whether they belong to those that are more frequent with less impact or less probable but greater impact, ect. Then, those that are considered of highest priority are identified according to the chosen quantitative, qualitative or combination method and only those are the ones that are evaluated and actions are taken on them.
Some studies foreground that the most used methods in the identification stage -due to the lack of evaluation of negative impacts of the risks and factors are not that advisable for evaluation stage- are the qualitative ones, although hybrid methods such as analytic hierarchy process (AHP), risk mapping or the hazard of operability studies (HazOp) are also applied (Diaz, Gento, & Marrero, 2018). More about these methods are explained later this chapter.
While the managers are analysing the possible risks, the logic process consists in asking 3 questions: what possible scenarios there are, the likelihood for every situation to happen and the possible consequences if happens (Kaplan, 1997). Risk analysis involves the methodical identification and assessment of hazards and their sources. The estimate must include the probability of the adverse event to occurs and its potential results. With proper risk research, one can choose the right activities to ensure safety and calmer against risks.
1.3.3 Evaluate risks
After identifying and collecting all the relevant information about the risks, they should be considered and evaluated. This stage aims to measure the impact, the probability of occurrence and how likely it is to detect it. With these three factors, the Risk Priority Number is determined, which helps to detect the most significant risks, which ones are imperative to reduce and in which aspect are they most critical (Ben-Daya & Raouf, 1996). The RPN is calculated as Equation (1.1),
RPN = S * O * D
Equation 1.1. RPN calculation
Where S stands for severity of the impact, O stands for probability of occurrence and D stands for detection (how likely to be detected before occurs is). However, sometimes it is not possible to collect all the necessary data and therefore the task of assigning values or quantifying risks is more difficult.

References
15
Risk assessment can be a very extensive task, which is why it is divided into different fields according to SC elements, thinking of a pull system - this means that factories produce on demand and production orders are transmitted backwards through the SC- since it is the most used (Ho, Zheng, Yildiz, & Talluri, 2015). Next, an evaluation of each particular element is presented.
Demand risk
Variations in demand are a very frequent risk that companies continuously manage. The consequences vary from a delay in the delivery of orders to loss of image and customers, with the associated cost that both entail. In a pull system, as most companies operate today, this first element has very clear causes and the consequences are also related to not being able to meet demand. However, the measures are more related to other elements of the supply chain such as production capacity. It is what is called the whip effect, and it affects the entire supply chain, making it the most complicated and serious, since they multiply at each echelon in the supply chain (Småros, Lehtonen, Appelqvist, & Holmström, 2003).
In this case, several models -although validated only by simulation- have been proposed to assume the increases in demand. The most common is to keep safety stock, but it can be very expensive. More advanced models like the Talluri et al. balance the safety stock with a dynamic reference according to the variations in supply and demand (Talluri, Cetin, & Gardner, 2004). On the other hand, Betts and Johnston go further and analyse a Just in Time model with the replacement of components on demand, where they ensure that the JIT model is more effective (Betts & Johnston, 2005).
Production risk
Because the production process is the most extensive and requires the synchronization and use of many components and resources, it is where most failures occur and is the element most exposed to risks of many natures. The causes can reside from the malfunction of a machine to the design of the product. For its part, the consequences can be seen in quality, they can cause stoppages in production, substitution of resources, etc. The latter implies that different plants, production stages or even jobs are susceptible to different risks and need to be evaluated separately with the failure tree method and have their own management plan (Cigolini & Rossi, 2010). A risk assessment matrix is quite common for its simplicity, although it involves little detail (Dietrich & Cudney, 2011). On the other hand, with an incremental margin analysis, a company can improve its risk visibility to reduce non-quality risk (Tse & Tan, 2011).
Supply risk
Properly evaluating and selecting suppliers avoids exposure to risks such as poor quality of raw materials or other materials, late delivery, lack of capacity or interruption of supply. In addition, the inexperience in risk management and involvement affect our company to manage our own. Suppliers are normally evaluated based on their history and data provided such as capacity, lead times, tolerances and quality adjustments or financial data (Zsidisin, Panelli, & Upton, 1999). From these characteristics, the most appropriate and reliable ones are evaluated and selected using stochastic, multi-objective or data envelopment analysis programming methods and their

References
16
variants (Wu & Olson, 2008). As for any company, it must be considered that there are variations and the evolution of the parameters consulted is not fixed or linear.
As for any company, a risk associated with the methods is the existence of variations and the evolution of the parameters consulted is not fixed or linear, and that the reliability and precision of the data provided by the suppliers themselves may not be completely reliable. Still, the methods are accurate and consistent in simulation to choose the most desired providers and to rule out those who are not good partners.
Financial risk
For a company, financial risks are very important since the objective is to obtain benefits. In the supply chain they are related to the flow of money. Suppliers and customers are a balanced form of investment and financing, and when any inflow or outflow fails, it can lead to solvency or other financial risks. The causes, mainly, are associated with non-payment by customers and changes in prices and supplier policies. In this sense, collaborating with partners with good solvency and trust are preventive measures (Tsai, Liao, & Han, 2008).
Information risk
Although it is an area that is not much investigated or managed, it is present in the entire flow of the SC. Includes all relationships with customers and suppliers and within the company between departments. When the flow of information is stopped or delayed, it involves a risk in delivery times, failures in the synchronized production system or even, when the information to be communicated is the occurrence of a risk, can greatly increase the impact (Dekkers, Kühnle, Durowoju, Chan, & Wang, 2012). This category includes acts of vandalism such as hacking of important information, so computer security is a measure against this type of risk.
1.3.4 Risk management strategies
Depending on the conditions in which there is a risk, the consequences that it entails and the available resources, managers can determine the strategy to be applied. The most common strategies are (Project Management Institute, 2000):
Mitigate.
This strategy aims to decrease risk. The actions taken are aimed at reducing the impact and / or the probability of occurrence (more information on these terms can be seen later or in Chapter 1. This implies that the risk management team must establish corrective and preventive measures that minimize the aforementioned values and address it with a well-planned strategy. Also establish a series of individual objectives, action plan and control.
This technique is used in cases where risks are unavoidable, little known for which there is insufficient information or resources to eliminate it, or which do not depend on the SC or organization directly, if not collaterally affected, but the company itself You can take steps to make the impact less.
Transfer.
When a risk can be shared between companies, departments, processes or elements, the management is assumed by the one who has the best resources or has tools for managing a risk

References
17
and, therefore, can manage it more efficiently. This strategy transmits the risk and it is assumed that the other party involved can and will manage the risk, but it may also be that the risk is transmitted to another company and that as a consequence the impact on the SC itself is less. However, this technique does not eliminate the risk and you have to be careful with it.
Accept.
An identified risk may not pose a great threat to the SC or it can be coexisted with it without affecting performance, quality or other important factors that prevent the achievement of the objectives. This strategy identifies, recognizes and accepts the risk, however it should not be forgotten. In these cases, an action plan must also be created to, first, integrate the risk into the daily activities and processes of the SC and, second, correct and amend the damage caused when the risk occurs.
Remove.
Although very unlikely, some risks can be completely eliminated. It may be because good identification work has found the root cause and it is easy to eliminate, or it may be because the action plan has been very successful and mitigation has been totally eliminated. This is achieved with a commitment of workers and experts, continuous improvements in the mitigation plans until the elimination is achieved and the investment in extra resources. What must be taken into account in this case is the cost of added resources and investment, since it is often not profitable and, simply, it is decided to adopt a mitigation strategy and control the risk to acceptable levels.
Exploit.
As previously discussed, risks can involve opportunities with positive consequences. Some risks or deviations can result in improvements, so in these cases we do not seek to eliminate or mitigate the risk, but rather we must invest in it and make the most of it. The action plan will focus on the reoccurrence of that event and reach a better performance.
1.3.5 Methods to assess risks
The processes of identifying, analysing and evaluating risks are systematic, they serve to understand all the elements of a risk and take the appropriate actions so that the company is not seriously affected. In order to carry out this comprehensive assessment, several appropriate methods have been mentioned to identify, evaluate and make decisions. Different situations are required for each situation, risk and company, since they vary greatly; some are fast but simple and others very complex but precise. The important thing is to determine which method to use that best suits the needs of the company according to its activity, complexity, size, ... Large companies usually use a combination of several.
The methods are classified according to the level at which they can be quantified, or the data used to measure properties. When numbers are used to quantify, they are called quantitative, the ones that use attributes are the qualitative ones and other methods combine the previous two. All of them must fulfil several requirements stated by Hamilton (Hamilton, 1996):
- Applicability. The method can be applied with enough data and without physical restrictions.
References
18
- Understandability. The results should be in terms that managers understand, interpret and apply.
- Utility. First, the method must be objective and risk adjusted; then, the costs associated with the analysis must be less than the cost of the losses derived from an unmanaged risk and, in addition, add value.
- Credibility. The uncertainty and variability of the results must be acceptable and within low limits.
1.3.5.1 Qualitative methods
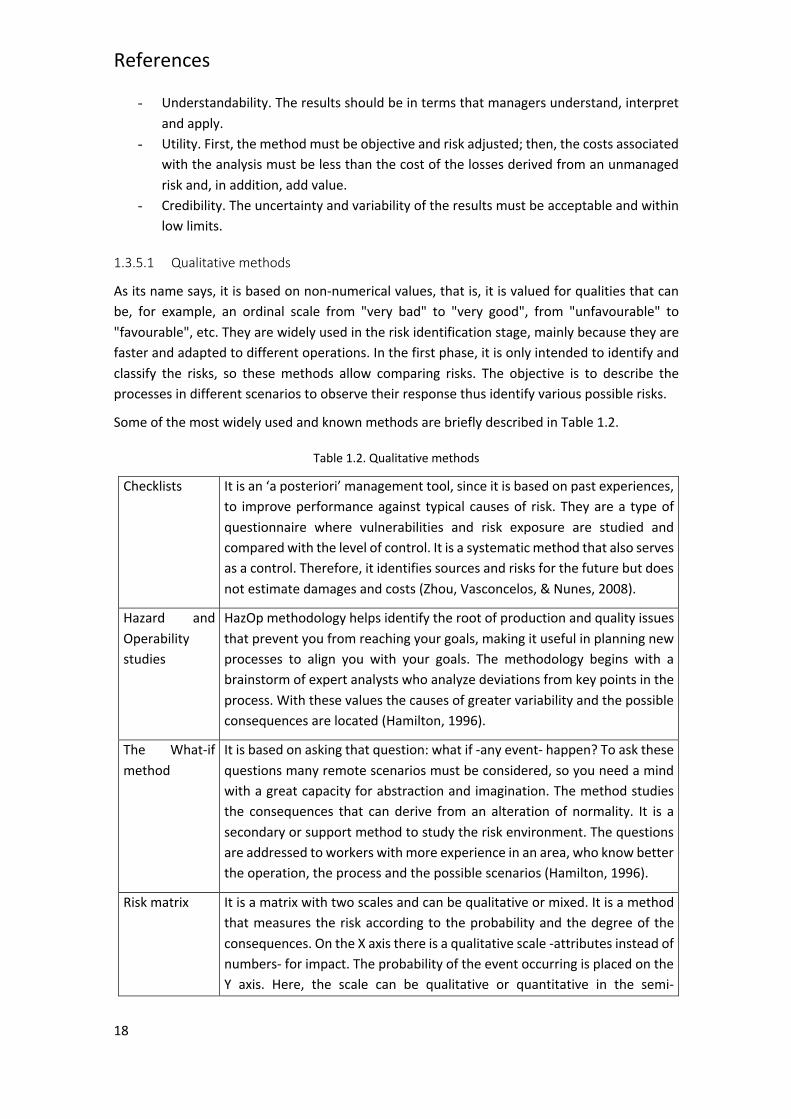
As its name says, it is based on non-numerical values, that is, it is valued for qualities that can be, for example, an ordinal scale from "very bad" to "very good", from "unfavourable" to "favourable", etc. They are widely used in the risk identification stage, mainly because they are faster and adapted to different operations. In the first phase, it is only intended to identify and classify the risks, so these methods allow comparing risks. The objective is to describe the processes in different scenarios to observe their response thus identify various possible risks.
Some of the most widely used and known methods are briefly described in Table 1.2.
Table 1.2. Qualitative methods
Checklists It is an ‘a posteriori’ management tool, since it is based on past experiences, to improve performance against typical causes of risk. They are a type of questionnaire where vulnerabilities and risk exposure are studied and compared with the level of control. It is a systematic method that also serves as a control. Therefore, it identifies sources and risks for the future but does not estimate damages and costs (Zhou, Vasconcelos, & Nunes, 2008).
Hazard and Operability studies
HazOp methodology helps identify the root of production and quality issues that prevent you from reaching your goals, making it useful in planning new processes to align you with your goals. The methodology begins with a brainstorm of expert analysts who analyze deviations from key points in the process. With these values the causes of greater variability and the possible consequences are located (Hamilton, 1996).
The What-if method
It is based on asking that question: what if -any event- happen? To ask these questions many remote scenarios must be considered, so you need a mind with a great capacity for abstraction and imagination. The method studies the consequences that can derive from an alteration of normality. It is a secondary or support method to study the risk environment. The questions are addressed to workers with more experience in an area, who know better the operation, the process and the possible scenarios (Hamilton, 1996).
Risk matrix It is a matrix with two scales and can be qualitative or mixed. It is a method that measures the risk according to the probability and the degree of the consequences. On the X axis there is a qualitative scale -attributes instead of numbers- for impact. The probability of the event occurring is placed on the Y axis. Here, the scale can be qualitative or quantitative in the semi-

References
19
quantitative method. The level of the two factors together determines the level of risk (Garvey & Lansdowne, 1998).
Risk mapping It is a graph that shows risks according to their criticality. With this tool, executives and heterogeneous groups from various areas identify and prioritize risks by placing them on a scatter graph with the severity scales of the impact and the probability of occurrence. Further, it is appropriate for experts in the field to rank risks by priority for operations.
On the other hand, it is recommended to make several maps according to the temporal factor of the consequences. A risk does not have the same severity of impact in the short as in the long term, so one should be carried out in the short, one in the medium and one in the long term (Deloach, 2000).
Risk driver mapping
It consists of detecting threats and opportunities and finding the key factors, or risk drivers, that are most influential and that lead to risks having a greater impact. Those key drivers have to be supervised and exploited in favour of the company (Deloach, 2000).
Delphi-technique
It is an evaluation technique based on questions until agreement is reached. Each member of a group with experience and knowledge of the company is individually evaluated on a series of issues related to a risk area. Then the answers are shared to give all points of view, reflect and expand the vision of the members. The process is repeated until the different evaluations reach a consensus or a few points of view and address the risk from there (Linstone & Turoff, 1975).
Ishikawa diagram
Or Cause-Effect diagram, is a tool that helps detect the root causes of a problem, analyzing all the factors that involve the execution of the process. The factors are divided by areas usually defined by processes, environment, human resources, material resources and management. Within each area are included factors that can cause a risk or failure that affects the product. It is usually done as a method of solving problems from a specific risk (Ishikawa, 1968).
Preliminary Hazard Analysis (PHA)
The objective is to determine, in the early stages before developing a project or starting a production, in which element of the supply chain is the cause of risks. It can also be used as a complementary method in more detailed areas of an existing system. It is based on past experiences and knowledge-know-how. Then it allows classifying according to the level of severity. Study both environmental factors and the internal processes, maintenance and safety of the work area (Rausand, 2005).
1.3.5.2 Quantitative methods
Quantitative methods are those based on numerical data and that order risks according to criteria defined by each method. They are very useful methods and are usually fast if they are

References
20
previously programmed, since inserting the data is sufficient and the analysis is immediate, in addition to allowing simulating various situations with other data. However, they are subject to the uncertainty of the input data which may contain errors and cause deviations and erroneous results.
They are more used to assess risks, since they allow them to be quantified and prioritized, not so much to identify them and know the root of the problem. It is more focused on measuring risk and its consequences. The combination of several methods to obtain a more global and reliable vision is very common. Some of the most used methods are described in Table 1.3.
Table 1.3. Quantitative methods
Mathematical programming
It is a widely used method to solve constrained optimization problems. By programming mathematical models, low-cost simulations are created that help decision-making by simulating various possible scenarios and optimizing the response, that is, finding solutions that minimize risk. This method allows to add some constrains to the model, so the simulation is more realistic (Waters & Waters, 2008).
AMFE The Failure mode and effects analysis it is a procedure for analysing potential failures in a classification system determined by the severity or the effect of failures in the system. Use the RPN (S*O*D) to prioritize risks. By the number assigned to each risk, an order of preference is assigned, with those with the highest values being the most dangerous (Teng & Ho, 1996). Each company determines a policy, but a common procedure is to manage all risks with an RPN above a certain value and also all those that, at least in one of the 3 factors to calculate it, have a high value.
AHP It is a structured method based on mathematics and psychology to organize and analyse complex decisions. The experts have to compare the different alternatives for each criteria, using the pairwise comparison, assigning an odd number from 1 to 9. Thus, the relative importance of each alternative in the different criteria is known (Saaty, 1978).
DEA In this type of analysis, the relative efficiency for each decision-making unit is calculated by comparing its inputs and outputs with respect to others. This analysis stops at identifying the best behaviour. It is specially used to choose suppliers comparing significant attributes among all possibilities and related to the best option (Wu & Olson, 2008).
Event Tree Analysis (ETA)
It is a probability method in which the possible events that can trigger a specific risk event are studied. It takes into account both the process responses and security measures, which are usually less variable, and the human response, which can be more unpredictable. The result is different paths with chained and computer events chronologically. Each event is assigned a probability of occurrence to determine the total probability of each scenario (Berger, Gerstenfeld, & Zeng, 2004).

References
21
Fault Tree Analysis (FTA)
This analysis investigates the causes and factors that contribute to an event occurring. It is complementary to the event tree analysis since it is based on the same procedure but backwards from the risk event (Cigolini & Rossi, 2010).
Multiple regression
This method explains the relationships between various factors where one is dependent on the other, for example, cause and risk or the risk and the possible consequences that it entails. It helps to identify the variables that may influence the response and also detects interactions. In this way, a broad view of the interconnections between risks can be obtained (Laeequddin, Sardana, Sahay, Waheed, & Sahay, 2009).
1.4 Risk Management by law
Risk management is developed within a company, but we must not forget that it is a dependent institution. In other words, it is linked to other organizations and, above all, to one or more countries where it operates. This means that there are certain regulations, restrictions, and laws that one must follow and cannot internally control or modify. This is important because the activity of a company is often limited by political and ethical conflicts.
Some of the risks have to do with directly socio-political issues, such as new laws, nationalization, confiscation, social strikes or terrorism that are considered political risks. Politically unstable countries are more susceptible to shocks, which can quickly and unpredictably change the conditions of economic life. Those kinds of conflicts are impossible to control for a company and all the responsibility is from the governments, but the fact is that enterprises suffer the loss as much as the country does. Therefore, there are significant political risks when owning companies in these countries. Even more, when a company operates between countries, there are regulations between them, and is not the same if the countries belong to, for example, the same continent or use the same currency or not (Hamilton, 1996).
Risk policy is not easy, because personal perception of risk is often incorrect. People often overestimates significant risks, such as explosions and risks beyond personal control. Exposure to the media and believe it among real things is also important. If people cannot obtain complete information about the dangers, they will not be able to adapt their behaviour to the real risk situation. From a political point of view, it may be tempting to say that we cannot accept any risk in a certain area, but the fact is that, in most cases, eliminating all risks is very costly or even impossible. However, for a long time, among risk regulators, it is generally believed that reporting procedures cannot effectively change behaviour, and more direct intervention through regulatory actions is required, as is the case of cigarettes and all the laws of regulation and warning about their risks (Viscusi, 1998).
Other social policies that affect the financial environment of the company derive from internal risks of the company. Some of the risks discussed refer to damages to the customer for a defective product or physical or moral harm to workers. By law, the payment of compensation for the damages caused is regulated in most countries, even a judgment can be executed and

References
22
then the image of the company is also damaged (Hamilton, 1996). The reality of these laws is that there is great amount of money involved but for large multinationals it is cheaper to pay compensation than to solve the root of the risk caused by the problem and to dispose of the inventory, re-manufacture the product, reconfigure the machines, etc. This is when ethics must be one of the company's values.
Another controversial regulation has to do with the environment. Increasingly, society is aware of the risk of pollution and governments take measures to regulate industrial activity, since most toxic emissions come from industry and factories. Therefore, companies have to evolve to a “greener” process and reduce pollutant emissions, not only by compliance with the law but also by image towards society and customers (Hamilton, 1996). As in the previous case, large companies weigh whether it is convenient to reduce emissions or pay a fine for non-compliance with the law. Thus, speculation arises of emissions that have become a good of sale, so that large companies buy the share of emissions that a small company is allowed. Fortunately, awareness is increasing and regulations are stricter.
1.5 Globalization
The integral management of the supply chain is one of the main concerns of the company in the current environment. In the last decades, the supply chain has undergone important changes due to the higher level of globalization and the higher rate of innovation. This increasingly important role of the global supply chain and the increasing interconnection between suppliers and manufacturers have resulted in companies becoming increasingly dependent on the supply chain and its complexity increases (Christopher, Mena, Khan, & Yurt, 2011). Therefore, despite the enormous benefits of expansion, the expanded supply chain is more fragile and exposes organizations to greater risks.
Related to that point, risk management has become one of the main desirable topics in the supply chain management literature (Narasimhan & Talluri, 2009). The focus highlights the interest in the world economy for its uncertainty, increased outsourcing and other business tendencies, the development of information technology, and other complex elements and interrelationships.
The increasing role of global supply chains leads to greater dependency between companies on supply chains and a higher level of complexity. So, despite their great benefits, the supply chains are getting larger, adding more elements and, therefore, more vulnerable, exposing organizations to higher levels of risk (Christopher, Mena, Khan, & Yurt, 2011).
Distance communications are those that allow organizations to establish relationships with other companies and be able to collaborate while being in different countries. In other words, it promotes and favours the creation of global companies and a worldwide market (Trkman & McCormack, 2009). Firstly, it should be noted that it has many advantages, especially to economic-financial issues, and that reduce the risks related to location. Examples are economies of scale, reduction of the costs, access to more resources available in other countries, or expansion of market share. It also reduces risks in several ways: being able to locate factories in any location allows choosing sites close to raw materials to reduce transportation time and react faster to changes in demand and setbacks, and also choosing a location where discrete events such as natural disasters are less likely (Water, 2007).

References
23
However, only communications through digital media are not enough when there must be transportation of materials. Despite carrying out transformation and manufacturing operations close to raw materials, then the final or intermediate product must be distributed to the market in other locations and countries. When the distance to be travelled is too long, the risks in transport increase considerably (Water, 2007). There are also certain government and border barriers that can be an impediment. In addition, the managers have to be aware of every law, social and political situation in the other country to adapt the strategy to that conditions.
1.6 Pandemic risk management
A pandemic is known as “an outbreak of a disease that occurs over a wide geographic area and affects an exceptionally high proportion of the population” (Merriam-Webster, 2020). They are generally caused by diseases originating in zoonotic pathogens that, due to human action, have leaped from species.
1.6.1 Classification
A pandemic is a specific, discrete risk, but it can last indefinitely over time - not to be confused with continuous. It affects the entire company, in financial terms, productive capacity, workers and customers due to possible spread and contagion, ... The level that has the greatest role in the event of a pandemic is the strategic one, since the survival of the company depends on it.
According to the causes, it is a natural risk since it is a disease. However, many of the diseases come from animals and the species jump occurs due to human action. The case of COVID-19 is caused by human action.
1.6.2 Risks
A pandemic strike to human health system. Therefore, the main and greatest risk of a pandemic is death, it is the most extreme situation it can have and, once the triggering event has occurred - in a pandemic it is the leap of the disease species - the severity of the impact cannot be reduced, only the number of deaths can be diminished (Jonas, 2013). Contagions themselves are a very dangerous risk, because in some cases the symptoms do not manifest but it does not mean that the disease does not exist in an individual and that it is a focus of spread. Therefore, contagions are a risk with great potential to cause more infections and deaths and, once the disease is unleashed, they are the main objective to minimize and take action against it.
In RPN the severity of a pandemic is the highest score since it implies death of people, but the probability of occurrence is very low. This implies that the severity cannot be reduced and, since it has a low probability, it is not taken into account in the daily risk management. Detection can be improved but it also has drawbacks, since very drastic measures can be applied without apparent justification -that is why it is important to take into account the perception of risk- and trigger other types of economic risks -financial crisis-, social -revolts and manifestations- or political - strict laws, change of government.
Associated risks are economic, social and health costs. In the last century, before the current COVID-19 pandemic, the 1918 flu was the most severe. The registered data report a mortality of between 2.5% and 5% of the world population - between 50 and 100 million deaths - and with monetary losses of more than $ 3 trillion (World Bank, December).

References
24
Companies face financial risks when they have to stop the activity, either due to the establishment of a state of alarm that does not allow the industrial activity to be carried out or because the product or service is not of primary necessity and, by law, cannot continue with activity. On the other hand, companies that produce essential goods and services have to bear large costs to adapt jobs and the supply chain to health safety requirements, and to cope with the increase in demand.
1.6.3 Management
The fact that most of them are caused by human action - species leap - means that the root cause can be prevented by controlling these human activities. Many of these practices are immoral, but they are allowed in certain parts of the world, others have their origin in underdeveloped countries where the sanitation conditions are minimal. Since a pandemic is prone to affect a large part of the population and several countries -mostly due to the globalization- it is everyone's duty to reduce those conditions in which the pandemic originates. The detection and control of diseases in animals has lower costs than managing a pandemic. As shown in figure 1.2. the case of a pandemic is due to the mismanagement of many previous factors (National Research Council, 2010).
Figure 1.2. Opportunities to prevent zoonotic diseases (National Research Council, 2010).
Communications between different parts of the world are immediate, information technologies are a great advantage over previous decades. Pandemics are epidemics first, this means that with effective communication between countries and sharing true data, containment and prevention measures can be taken to prevent the spread of the disease and to cross borders (Jonas, 2013). This is the second most common management failure, because many countries do not want to make other data available that could harm international relations and other political issues.
The economic consequences of a pandemic are very severe, both for individual families and for companies and, consequently, for the country. Controlling the pandemic, finding a cure, and caring for the infected people then requires a great deal of research and dedicate many resources to investigation. Public research and health systems are the ones that, with great efforts, manage to stop this type of disease. A good practice is the management of public hospitals and laboratories, allocating all the necessary physical and human resources. This

References
25
operation should be implemented as normal so as not to saturate the centers in the event of a crisis.
As discussed above, risk perception is a risk in itself, and when an entire population is involved and does not know how to manage a risk, reporting the real situation and raising awareness is essential. On the other hand, the government and the institutions can prepare the population for individual risk management (Gasmi, et al., 2020).
All risk factors affect companies in the same terms, since pandemic risk is not a priority for them and the measures are often unpredictable. In addition, many of the companies that provide basic goods and services, have to continue with the productive activity, but adapting to security measures, new laws, increased demand, even changes in products. The best way to adapt to changes is to build a resilient company, that is, a company characterized by taking advantage of adverse situations, with a mindset and culture of change, resources with double functionality that can adapt to exceptional situations and, ultimately, who know how to overcome crises, being affected as little as possible and evolving through continuous improvement (Jonas, 2013).
1.6.4 Conclusions
Humans are the dominant species on planet Earth and we are most responsible for many catastrophes, terrorist acts, the destruction of biodiversity and the creation and spread of deadly diseases for the human being himself. Therefore, in an increasingly globalized world, social awareness and mutual support is necessary to be responsible with our actions.


Fundamental Supply Chain theory
27
2 Fundamental Supply Chain Theory
2.1 Introduction to logistics
Human beings have always had the need to transport materials, exchange them, move themselves,... all processes that involve a movement activity are included within logistics. In a company, logistics is made up of all the material movement operations, both within the company and with suppliers and customers; of people who, depending on the company, can only be workers or workers and clients; and also external and internal exchange of information and money flows. In short, logistics are all the connections which form the network of companies and allow a process to be a continuous, orderly and fluid process. From the point of view of an enterprise, the logistics is upstream when is referred to suppliers and downstream when it is about clients. Correctly managing all these connections and movements provide an advantage in the face of normal activity to face risks, since it allows a much faster management and response. In these strategic management terms, Christopher defines logistics as
the process of strategically managing the procurement, movement and storage of materials, parts and finished inventory (and the related information flows) through the organization and its marketing channels in such a way that current and future profitability are maximized through the cost-effective fulfilment of orders (Christopher, 2016, pp. 4).
This definition is fairly recent, as it includes a new concept in this definition, which is the marketing channels, as external connections. For suppliers, communication and marketing channels serve to reduce costs, acquire the best prices and quality, etc. With customers it is about increasing profit from the other side, with higher income. Also reducing transportation costs. The most commonly used method is the Wilson equation, or economic order quantity (EOQ), to reduce costs with batch orders (Wilson R. H., 1934). This equation is the result of the integration of the total costs, which are made up of the unit costs, shipping costs of a batch, of possession, of breaking,... Depending on the type of demand, the level of inventory, the desired accuracy or the size of the company, concepts can be erased or replaced in the formula. The objective is to minimize all the costs having in mind capacity restrictions and others specific for a company. With the next notation, the complete function is as follows in Equation 2.1, with 2.2 restriction and can be seen more detailed in (Kelle, Woosley, & Schneider, 2012).
ci: unitary costs of product i ei: issuance costs for product i, the cost of deliver a new order hi: holding costs for product i, the cost of having the product in the warehouse pi: rupture costs for product i, the cost if the warehouse runs out of product and is necessary either ask for an emergency order or find an alternative Qi: quantity of product i ordered Di: expected demand for product i in a certain period and used to calculate the optimal number of orders Hi: expected average stock for product i in a certain period. Can change over the time Pi: average probability of stock rupture for product i si: order point for product i, that is the minimum amount of product that should left as security stock

Fundamental Supply Chain theory
28
Si: order level for product i, that is the quantity that should be ordered to refill the storage. vi: needed quantity for product i M’: available total space for all products
Min ∑ "c! ∙ Q! + e! ∙ "!#! + h! ∙ H!(s!, S!) + p! ∙ P!(s!, S!)1
Equation 2.1. Objective extended function to optimize quantity and number of orders
2(v!S!) ≤ M$
Equation 2.2. Capacity constrains
In a general and simplified way, using an average and guessed demand and production, also unit costs uniform, Wilson's formula is reduced to that shown in Equation 2.3, that is the result of the integration of the previous 2.1 respecting quantity Q considering only unitary, holding and issuance costs.
!∗ = #2 · &" · '"ℎ" · q
Equation 2.3. Wilson’s formula to optimize orders.
where,
Q*: optimal quantity per batch;
q: time or period in which the company want to do the calculation.
Based on this, there are others that allow optimizing logistics processes such as POQ (Period Order Quantity), batches by sections, production with stock break,... The differential equation that must be integrated to obtain this formula may contain other terms, such as costs related to stock break, that is, when a company does not produce enough to accomplish demand, what would be the costs associated with late delivery or non-delivery.
Logistics can be divided into three types: inbound, outbound, and materials management (Water, 2007). The first two constitute external logistics and the last internal logistics. The entry processes require coordination with suppliers, warehouse control, transmission of information outside the company, receipt of materials and outgoing flow of money. The output of products occurs to customers and distributors, with the same flows but in the opposite direction: money and material outflow. Internal processes depend on the company and can control all movements. In that way, Harrington describe the role of the logistics as both the rails that hold together and give sense to the materials flow (Harrington, 1996). Logistics has a lot of different activities and every company manage the movements their own way, although there are several activities that everyone has in common. In Figure 2.1 we can see those basic steps.
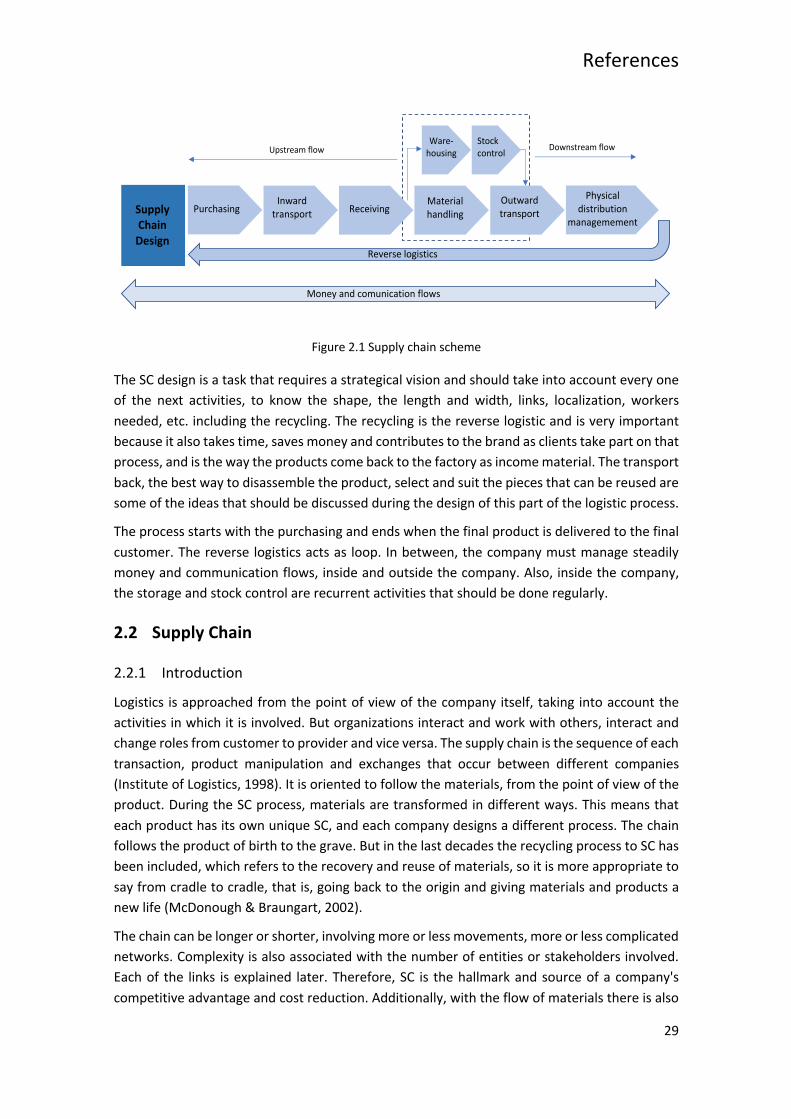
References
29
Figure 2.1 Supply chain scheme
The SC design is a task that requires a strategical vision and should take into account every one of the next activities, to know the shape, the length and width, links, localization, workers needed, etc. including the recycling. The recycling is the reverse logistic and is very important because it also takes time, saves money and contributes to the brand as clients take part on that process, and is the way the products come back to the factory as income material. The transport back, the best way to disassemble the product, select and suit the pieces that can be reused are some of the ideas that should be discussed during the design of this part of the logistic process.
The process starts with the purchasing and ends when the final product is delivered to the final customer. The reverse logistics acts as loop. In between, the company must manage steadily money and communication flows, inside and outside the company. Also, inside the company, the storage and stock control are recurrent activities that should be done regularly.
2.2 Supply Chain
2.2.1 Introduction
Logistics is approached from the point of view of the company itself, taking into account the activities in which it is involved. But organizations interact and work with others, interact and change roles from customer to provider and vice versa. The supply chain is the sequence of each transaction, product manipulation and exchanges that occur between different companies (Institute of Logistics, 1998). It is oriented to follow the materials, from the point of view of the product. During the SC process, materials are transformed in different ways. This means that each product has its own unique SC, and each company designs a different process. The chain follows the product of birth to the grave. But in the last decades the recycling process to SC has been included, which refers to the recovery and reuse of materials, so it is more appropriate to say from cradle to cradle, that is, going back to the origin and giving materials and products a new life (McDonough & Braungart, 2002).
The chain can be longer or shorter, involving more or less movements, more or less complicated networks. Complexity is also associated with the number of entities or stakeholders involved. Each of the links is explained later. Therefore, SC is the hallmark and source of a company's competitive advantage and cost reduction. Additionally, with the flow of materials there is also
Purchasing Receiving Inward
transport
Physical distribution
managemement
Outward transport
Material handling Supply
Chain Design
Money and comunication flows
Reverse logistics
Ware-housing
Stock control Downstream flow Upstream flow

Fundamental Supply Chain theory
30
an exchange of information and a corresponding flow of money (Peck H. , 2010). In more specific terms, SC can be described as “the network of organizations that are linked through upstream and downstream relationships in the different processes and activities that produce value in the form of products and services in the hands of the ultimate customer” (Christopher M. , 2016).
The objective of the SCs is to unite and overcome barriers, usually physical location, between customers and suppliers, offering the possibility of obtaining the best qualities of raw materials and sources, and distribute to global markets. These connections need management. The correct management of the SC must avoid the risks and minimize the consequences. Managing the entire SC is a huge job for a single organization. The commitment of each involved in the SC in its internal management facilitates the process and, therefore, the managers focus on this part. The main activity is to control that the movement of materials occurs without contingencies and to resolve them in the event that they occur, adjust production to variable demand and manage the stock according to demand and supply. Inventory management is a very important area because it is where a large amount of money is invested and it is often poorly managed because the low flexibility of the chain is solved with a large amount of stock, which causes unnecessary expenses and possible obsolescence of stored products (Water, 2007). The stock problem is very present in seasonal demands and supplies. Certain raw materials and products are seasonal, such as some fruits, sugar cane, nougat or ice cream. In these cases, in the low season the stocks increase and it may be convenient to have warehouses for rent, not their own, to save costs in the high season. Another form of management is to reinvent the company so that the production chain can be adapted to other similar products.
Regarding external management, we have already commented that trust and commitment are important to facilitate global management of the entire chain. However, a company may at some point act for its own benefit but harm the rest of the SC. One method of reaching an agreement between all parties is known as the prisoner's dilemma (Poundstone, 1993). This theory raises how two or more organizations can or cannot collaborate even when an agreement would benefit all parties. On the other hand, it establishes scenarios where one of the companies could deviate from the equilibrium situation -that is, that the global benefit is optimal- in its own favour and decreasing the total profit. To avoid these situations, an incentive is established with which, for each company involved, its best situation coincides with that of equilibrium.
This last point is still a poorly integrated factor in companies because the general trend is the concern of each company for its own internal environment and its individual performance without thinking about how its actions affect collaborators and how the actions of partners affect the own company.
2.2.1.1 Evolution
The supply chain was first conceived as simple connections between two companies or processes, each of the movements that the product had to follow from the raw material to the final customer. You can't exactly call it supply chain because the processes were rather independent. Furthermore, the process did not add value to the product.
In fact, logistics was initially viewed as an obstacle, as a part of the mandatory operational process. More than half a century ago, Drucker referred to logistics as the most neglected area

References
31
with the greatest potential. Large amounts of money, time and resources were lost in logistics (Drucker, 1962). Since then, communication channels have changed a lot, as have business forms, being increasingly digital and telematic, with communications and computerization being of great importance. The factors that have most driven change are related to:
- The mindset and awareness that logistics is an important part where you lose a lot of money with poor management, so the potential for savings is greater than in any other area. On the other hand, the management of the SC affects the strategic objectives of the company.
- Recognize the customer as a focus, direct the strategy towards customer satisfaction, linked to logistics. This achieves a competitive advantage in an industry with increasing competition.
- The improvement of digital communications and its associated globalization. - Development and emergence of technologies applied to the internal process and
external transport. - Social issues that determine the character of a company such as pollution and creating
"green" processes.
By joining together all the links and managing them individually, but contributing to a global benefit, one can speak of the supply chain. With this, it was sought, on the one hand, to disaggregate the different activities although within the same process so that the management and control of each part is simple. On the other hand, create a customer-centric strategy and add value at each stage (Christopher M. , 2016). The value chain emerges from this idea, a model described by Porter that indicates the primary and support activities of the supply chain as an internal analysis of the company and are described in Figure 2.2. Each activity must take into account what the client is willing to pay, that is, what adds value for the client and what does not, so as not to include it in the process and reduce costs to obtain greater profits.
The value chain is divided into two categories of activities: primary and support. The primary ones are inbound and outbound logistics, internal operations, marketing and sales, and customer service and after-sales. They are the ones that are essential to develop the activity of the company and directly add value to the product for the customer, in short, they are the
Risk identification
Risk analysis
Risk evaluation
Implementation of risk management
Control Risk
ass
essm
ent
Firm infrastructure
Human resources
Technology
Procurement
Inbo
und
logi
stics
Oper
atio
ns
Outb
ound
lo
gist
ics
Mar
ketin
g &
Sal
es
Serv
ice
Supp
ort a
ctiv
ities
Pr
imar
y ac
tiviti
es Marg
in
Margin
Figure 2.2 Porter's value chain
Fundamental Supply Chain theory
32
activities that must be managed to create a competitive advantage. Secondary activities are infrastructure, human resources, technology, and the acquisition of goods or supplies. They help primary activities to increase value and effectiveness. As every enterprise goal, manage these activities leads to greater profits and a wider margin of benefits (Porter, 1985).
The objective is to add value for the client in every stage, in every activity. To achieve it is necessary to focus individually, manage every discrete activity that integrate the supply chain, all with the same objective. This way is easier to know where there are extra activities, which are the costs of each stage, where those can be minimized and which activities adds more value to the final product. Those extra activities that do not add value, should be removed or externalized is they are basics and necessary for the business activity. That creates a competitive advantage either in costs, differentiation or service.
Externalizing some activities, the outsourcing effect was born. That means that the supply chain is every time more and more outside the company, is into the links between companies. That also makes companies to focus of their main activities, that means, for instance, that an automotive company that assembles cars will only focus on that, the manufacturing and production of the components are done by other companies or other independent divisions. It also implies a higher specialization in each area although more complex networks and supply chains that requires a better manage performance.
After Porter made the value chain model, marketing is incorporated as the main activity. A foretime, marketing and the production process were separate departments between which there was no connection, in fact, their objectives were opposite. As the production chain was understood, it was based on the times and efficiency of the chain, cost reduction and standardization. Marketing was a non-production department that wanted to compete in service and variety, which is not compatible with standardization and cost savings in machine preparation. This caused internal struggles that did not favour the corporate and strategic objectives of the company.
Today, these activities are coordinated together and marketing has given manufacturing the customer-oriented vision. With this point of view, inventory control methods, JIT production, first-time quality, etc. have been developed. to reduce production costs. This change in perspective has been the most significant and defines the current organizational structure and objectives.
2.2.1.2 Prevalent schemes
Due to the outsourcing of activities and globalization, SCs are more complex and larger, which implies exposing themselves to more risks and vulnerabilities. Current trends do not help reduce risk, in fact, many times they increase it because they focus on reducing costs at any price and producing at the pace of demand without slack. In the last century, the birth of the lean concept and its development has become the most studied field and the method most applied by companies. This does not mean that it is well applied or that the management is correct. Many companies look for such a streamlined process that they only take into account the short term and small variations in demand that can be predicted (Water, 2007). But they are much more vulnerable in the long term or to greater variations and more severe risks. The solution translates into creating more effective and ultimately resilient SCs.
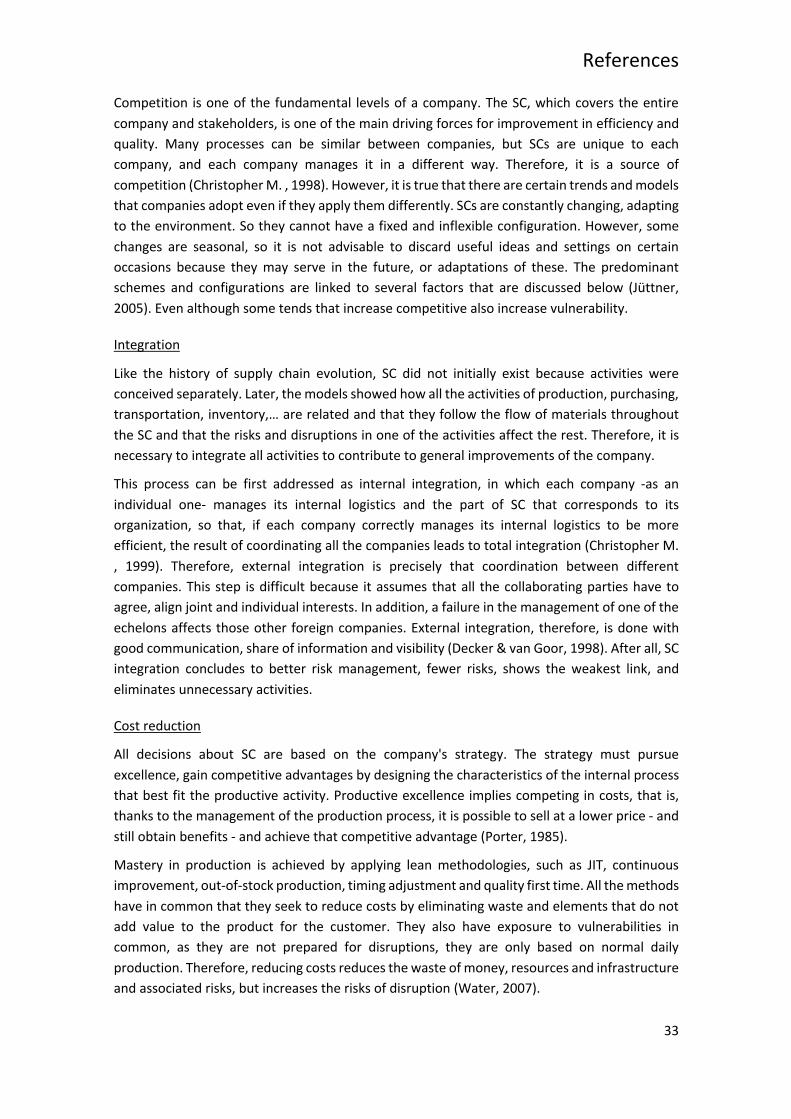
References
33
Competition is one of the fundamental levels of a company. The SC, which covers the entire company and stakeholders, is one of the main driving forces for improvement in efficiency and quality. Many processes can be similar between companies, but SCs are unique to each company, and each company manages it in a different way. Therefore, it is a source of competition (Christopher M. , 1998). However, it is true that there are certain trends and models that companies adopt even if they apply them differently. SCs are constantly changing, adapting to the environment. So they cannot have a fixed and inflexible configuration. However, some changes are seasonal, so it is not advisable to discard useful ideas and settings on certain occasions because they may serve in the future, or adaptations of these. The predominant schemes and configurations are linked to several factors that are discussed below (Jüttner, 2005). Even although some tends that increase competitive also increase vulnerability.
Integration
Like the history of supply chain evolution, SC did not initially exist because activities were conceived separately. Later, the models showed how all the activities of production, purchasing, transportation, inventory,… are related and that they follow the flow of materials throughout the SC and that the risks and disruptions in one of the activities affect the rest. Therefore, it is necessary to integrate all activities to contribute to general improvements of the company.
This process can be first addressed as internal integration, in which each company -as an individual one- manages its internal logistics and the part of SC that corresponds to its organization, so that, if each company correctly manages its internal logistics to be more efficient, the result of coordinating all the companies leads to total integration (Christopher M. , 1999). Therefore, external integration is precisely that coordination between different companies. This step is difficult because it assumes that all the collaborating parties have to agree, align joint and individual interests. In addition, a failure in the management of one of the echelons affects those other foreign companies. External integration, therefore, is done with good communication, share of information and visibility (Decker & van Goor, 1998). After all, SC integration concludes to better risk management, fewer risks, shows the weakest link, and eliminates unnecessary activities.
Cost reduction
All decisions about SC are based on the company's strategy. The strategy must pursue excellence, gain competitive advantages by designing the characteristics of the internal process that best fit the productive activity. Productive excellence implies competing in costs, that is, thanks to the management of the production process, it is possible to sell at a lower price - and still obtain benefits - and achieve that competitive advantage (Porter, 1985).
Mastery in production is achieved by applying lean methodologies, such as JIT, continuous improvement, out-of-stock production, timing adjustment and quality first time. All the methods have in common that they seek to reduce costs by eliminating waste and elements that do not add value to the product for the customer. They also have exposure to vulnerabilities in common, as they are not prepared for disruptions, they are only based on normal daily production. Therefore, reducing costs reduces the waste of money, resources and infrastructure and associated risks, but increases the risks of disruption (Water, 2007).

Fundamental Supply Chain theory
34
Globalization
Transportation and communication facilities between different parts of the world have allowed a way to reduce costs by locating factories close to raw materials and suppliers, strategic geographical areas, where the cost of production -for materials, construction or labour- is less or where the price and quality are favourable. On the other hand, demand is also globalizing, allowing companies to sell to customers worldwide, including in various markets. The result is lower costs in the upstream flow and higher revenues by expanding the downstream market (Bowersox, 2002).
The facilities and the large number of transport connections mean that delivery times are also short but also that the probability of adverse events during transport increases. Reducing waiting times adds other risks. Finally, the location itself can have natural or political-social risks.
Outsourcing
Lean trends result in outsourcing. By eliminating from the SC itself activities that do not add value to the product or that are not necessary for the main activity of the company, these processes and activities are subcontracted to external companies with which a partnership is established (Water, 2007). They are typically development and manufacturing activities for components and other materials. They can also be cleaning, human resource management, financial management, ... In this way, all the efforts and resources that the company dedicates go to the SC, to reduce costs and time in it.
Although a greater specialization in the core business is beneficial, the quality of the components and the outsourced activities are not under the control of the company. It also implies a much larger SC with its risks and having to manage all communications (Lonsdale, 1999).
Agile logistics
In contrast to the cost reduction strategy, agile logistics competes in customer service. This strategy makes the SC more flexible and can react to adverse and unforeseen adverse situations. The procedure consists of having all the products and orders available immediately to be delivered to the customer in a short period of time, so the customer service is fast and customized. This methodology gains importance because product life cycles are reduced, processing time, demand is less stable, and customer requirements change. This makes the supply chain have to be flexible and agile. Having all the materials and that there is no failure, delay or unforeseen during the process entails higher costs. In order for a company to be prepared to solve unforeseen problems without wasting time, it is necessary to have inventories and some redundancies, not to work at maximum machine capacity and, therefore, to lose productivity (Water, 2007).
In short, there are also risks when applying this strategy exclusively, so no methodology should be taken to the extreme, you must know the strengths and limitations of each case and combine lean and agile to improve efficiency (Evans & Powell, 2000).
E-business

References
35
Electronic commerce, telematic transactions, online documentation control, etc. streamline many of the administrative and purchasing processes. They allow having large amounts of data instantly, as well as reducing waiting times and communications between providers. In the past, only the acquisition process could take days or weeks of meetings and agreements. Today, this process is practically online, several providers can be consulted in a short time, monetary flows are also carried out online.
Despite revolutionizing logistics models and streamlining the entire process, digitization has its own risks, as computer attacks, viruses, and other types of threats grow exponentially. A company exposes large amounts of data both about the company and about suppliers and customers. At the same time, within the organization, all devices are interconnected to allow this agility and transfer of information, so an attack or virus on one of the devices means that it spreads very quickly to the rest of the devices to which it is connected (Peck, 2004). Therefore, a type of computer management is added, which includes cybersecurity to external backups.
2.2.2 Network levels
A supply chain can take different shapes and configurations, some are longer and narrower, others shorter and wider, but in general they all have in common the basic division: supplier, organization or manufacturer and customer. Between these elements are distributors and logistics services between companies. Both upstream and downstream the supplier and customer levels follow a tree-like scheme and are divided into levels, as schematically represented in figure 2.3. This scheme is given from the point of view of the organization (Water, 2007). Thus, for a car manufacturer, a first-level supplier can be a seat manufacturer and a second-level supplier that provides textiles to manufacture the seats. However, from the seat manufacturer's point of view, a textile supplier is its first-level supplier. Companies often have multiple suppliers and direct clients – level 1 - to ensure some flexibility in the chain.

Fundamental Supply Chain theory
36
Figure 2.3 Supply chain levels -adapted from (Water, 2007)
A supply chain follows a product from the supplier of raw materials to the final consumer. Only this partial vision can become very complex and, expanding it to all the connections that an organization manages, supposes an overly large and complex image, which also includes the flows of money and information. In the figure it can also be seen that there are interconnections between the different levels, since the same supplier can provide raw materials to several clients and a client can buy from several suppliers. For this reason, the global vision is usually seen as a network rather than as a chain. In addition, knowing the connections helps to make strategic decisions, prioritize some relationships over others, expand the network to other companies or eliminate those that do not add value to the product (Porter, 1985).
Although the connection between complexity and increased risk has not been studied, Snow and Miles demonstrate that as long as the supply network is stable, the company can better manage its supply network (Miles & Snow, 1992). Furthermore, this stability may come from sources such as: designing both a supply network structure and appropriate tools, practices and controls to select and retain the suppliers that are of interest, also choosing the appropriate type of supplier relationship; and control the quality of raw materials and trends to adapt to the future. Therefore, related to suppliers, as company we can assure a certain stability by prioritizing and establishing an action strategy to face risks and disruptions. For each link a manager can attach a probability or a rate of efficiency to determine which one is the best way that maximizes the overall efficiency and which partnership to attend first after a disruption.
2.2.3 Vulnerability and global enterprise
The ultimate goal of a company is always to make a profit. Each company can adopt a strategy but basically it is about reducing the flow of outgoing money and increasing the flow of incoming
Level 1 Level 2 Level 1 Level 2 Level 3 Level 3
Upstream flow - suppliers Downstream flow - customers Organization

References
37
money (profit = income - costs). Logistics is, in addition to being an essential activity and present in each phase of the product, very expensive. Therefore, reducing costs is achieved by collecting raw materials and components close to the source, in a strategic geographical area and with better quality. In turn, expanding the market to a broader area. Thus, international, multinational and global companies are born.
On the one hand, expanding the frontiers of the company has notable benefits related to costs, development and certain risks. On the other hand, internationalization has its own risks, created from this phenomenon. The objective of expanding the company is to reduce costs and increase market share. Below is shown for each area -costs, market/demand and develop and culture - most common benefits and vulnerabilities.
- Costs. To reduce costs, factories where the raw material is cheaper due to its proximity to the extraction source are built, suppliers and the different factories are located equally close to reduce movements, distance and streamline JIT production. Another reason why moving a company to a certain location is due to its level of danger, that is, the probability of certain risks, for example a natural one, occurring (Water, 2007). In contrast, allocate the entire production process and elements upstream of the chain in one place is dangerous. The explanation is that, in the event that a disruptive event happens - which can be from an earthquake to a power outage, through a terrorist attack - absolutely all that part of the SC would be obsolete and there is no margin for action or flexibility to cover the other part of the chain that is demand. Another factor is the choice of location between several possible. If it is in another country, you must take into account manufacturing policies, work culture, export costs,... so the cost reduction must be a balance between the decrease in cost of materials and more, and the outgoing material flow costs. However, there are organizations that must have a certain location, but also a strategic one, such as hospitals and health centers. In this case, both external and internal logistics have a great burden, and costs are not the most important factor, but time and speed of response and action are (Chen, Preston, & Xia, 2013).
- Market. Expanding the market to different countries allows a company to gain market share. In addition, it can also reduce costs with the expansion of demand because you work with economies of scale, that is, produce more and cheaper -by fixing costs. In this regard, there are emerging markets in developing regions, so it may be an opportunity. Although investing in a new market always carries risks related to innovation, exploring the market, being a pioneer,... An investment in a new market is very risky that can lead to great benefits or great losses (O'sullivan & Sheffrin, 2007). On the other hand, some industries have to adapt the offer to the destination, mainly for cultural or religious reasons. This means that, for each geographical area, different or slightly modified products must be developed, which implies decentralization of the strategy. Wanting to reach a very broad market implies that, although the phase corresponding to suppliers is usually focused on a small group, transport and distribution to customers can take long distances. In addition, by itself, supply chains become larger and longer to cover the entire market and get all the necessary supplies.

Fundamental Supply Chain theory
38
- Develop and culture. For certain sectors, technology and development are very important to stay in a good competitive position. Some countries have technologies that are not available in other parts of the world, so locating yourself in one of these locations is a favorable strategy (Wu, Yeniyurt, Kim, & Cavusgil, 2006). However, these locations are often the opposite of cost theory, they are more expensive or more likely risk. The flip side of development is that it creates a culture of "the immediate." The clients are more and more demanding with the terms of delivery, reason why it involves massive displacements to be constantly supplying what the clients ask for as they request it. All without neglecting quality and price.
Despite the current management methods developed, computer and digital support and the large number of global links, most of the risks and vulnerabilities that affect the SC have to do with poor logistics management. In fact, several studies and surveys (Hill, 1994) (Poirier, 2006) reflect management failures in figures. Specifically, surveys show that a large part of companies are not clear on what expenses and costs are included in logistics. Moreover, most of the traditional methods to obtain the costs are not accurate for logistics, as every step adds value to the product and the related cost may be different. Calculations should include other rates like profitability (Christopher M. , 2016). Considering that logistics is the area where there is more waste of money and where more can be saved in the budget managers should, at least, be clear about what costs and expenses to include within that budget in order to optimize it, reduce total costs and create a competitive advantage. In general, the costs of supply, storage, internal movements, flows related to production, distribution and sales are included within logistics. It is appreciated that the logistics costs are made up of everything that results from a displacement (Shapiro & Heskett, 1985). The positive part of logistics costs is that, once the policy to be applied in the company is established, the percentage allocated to these costs is quite constant.

Resilience theory
39
3 Resilience theory
The aim of this chapter is to approach the concept of resilience because is a fundamental feature to build a supply chain able to face crises and unforeseen events thus help risks management.
The next pages will treat different definitions, the evolution of this concept until reach organizations, suggestions for applications, know how to find out the level of resilience and compare and join this term with other sought-after management system like lean.
3.1 History review
The current subchapter is written to clarify and present definitions, how this concept was born, a review of previous literature and what resilience means within supply chain area and its importance to successfully manage a company.
This concept is used widely in fields such as engineering, physics, live sciences and organizational inquiry. As this project is focused on organizational and logistics fields, several definitions will be shown as well as applications including health-care sector.
3.1.1 Definitions
Finding out a way to manage risk for a supply chain, a trouble shows up when a company must deal with the huge outlay that preventive measures entails, or face overrun trying to fix the damage a risk causes after it occurs. The first choice is a cost not all entrepreneurs are willing to take. At this point, a resilient supply chain makes sense to build a system that can save money at the same time that does not allow risks to impair the company.
According to Merriam-Webster dictionary, the first known use of the term resilience was in 1807. The most elemental use is within engineering field as the capability of a strained body to recover its size and shape after deformation caused especially by compressive stress (Merriam-Webster, 2020). As first acceptation could be a good approach as far as it includes the suggestion of overcome a stressful situation. But is suitable to search into previous literature to find proper meanings and understand that nowadays, more than ever, this term becomes very important worldwide to face the current crisis.
When we talk about resilient people there is a great difference between human and physical definition. For psychological terms M. Rutter asserts resilience to be a foundation over hazard and protection, and also an interactive phenomenon that is inferred from findings indicating that some individuals have a better outcome despite having experienced serious stresses or adversities than other individuals on the same circumstances (Rutter, 2013).
Therefore, the previous experiences also help to learn how to face adversities and know when the right time is to apply them (Elder, 1986). But that is not enough, also the internal framework -brain, muscles and skeleton for humans as workers, machines and organization for companies- will define the damage a risk can cause. However, is hard to know those factors that make an entity being more resilient: whether is about adaptation, learning, nature.
It is undeniable that all human beings are looking for perfection and are inspired by the shapes and behaviour of the nature (Haksöz, 2018). Thus, Brian Walker and David Salt (Walker & Salt,

Resilience theory
40
2012) explain how the natural adaptative cycle scheme based on resilience helps an ecosystem to be itself sustainable. For that reason is why one of the definitions is found in an ecosystem context as the ability of a system to return to its original state or move to a new, more desirable state after being disturbed (Christopher & Peck, 2004). The important part of this statement is to understand that we always must move on and go forward to a better version of our system itself. Nevertheless, that change could not be possible, hard to reach or economically unfeasible.
The same principle is applied for organizations. A company should be prepared for any risk, to face it with the least waste of money and resources. However, while for materials is necessary to return to its original form, is not relevant for organizations. Actually, is not desirable thus the system can learn from the errors, predict new threats and be prepared for future risks (Pettit, Fiksel, & Croxton, 2010). The same configuration and organization will be weak facing the same adversities and new ones.
There is not a unanimous definition for organizational resilience, every author gives a part of the whole vision. For instance, Kirby and Fraser (Kirby & Fraser, 1997) describe resilience according to the reaction and how compete an entity is under stress. Both internal and external factors affect to an organization, and resilience is about how it reacts and the knowledge it absorbs to improve its future actions. A conceptual framework is showed in Figure 3.1.
Figure 3.1. Conceptual framework of resilience -adapted from (Rutter, 2013).
Therefore, to give three notions of how a resilient company should operate is considered the best option to understand a bit more this concept. Weick and Sutcliffe (Weick & Sutcliffe, 2011), enumerate the imperative abilities that make an organization resilient:
Ability 1: be able to assimilate stress and still continue working at, if not the same, almost the same performance level before disruption.
Ability 2: overcome the adverse situations and recover the previous capacity and manufacture level.
Ability 3: learn from the experience, apply lessons and evolve to a new and better resilient organization.
3.1.2 Evolution
Going back through the literature, can be found that the applied concept of resilience has its origins in psychiatry and psychosocial fields. Experts in this area understand resilience as long as
0%
20%
40%
60%
80%
100%
RESILIENCE
Time
Perfo
rman
ce
1
2 5
3
4
7
8
6
Inside actions (capabilities and abilities)
Experiences and
changes
External interventions (stakeholders)
New situation after overcame the
adversity
Situation of adversity or crisis
BUILD RESILIENCE

References
41
risk and adversity exist. A resilient system is not that one without risks or that never has experienced mishaps, resilience resides in the overcome from those adversities and the evolve of the system to its immunity (Rutter, 1993). According to that, is essential to be aware of the risks in order to build a resilient system. Also, the source of the risks should be determined both inside and outside the organism since vulnerabilities can hit both externally and internally to a supply chain (Christopher & Peck, 2003). Here, several authors refer to resilience with other notions such as invulnerable or invincible.
In psychological terms, Anthony described children that can manage to survive, even prosper, in an extremely or highly strain situation as invulnerable children (Anthony, 1974). In this situation, the environment is considered, even if the conclusions are at an individual level, but not the risks or adverse situation itself.
On their side, Werner and Smith completed a study to find invincible people. They defined with those people that are born into a risky environment or where the conditions are hostile but thrive anyway (Werner & Smith, 1982). The conclusions they made are based on the idea of an invincible person despite adversities and being potentially vulnerable. However, as Werner said later, this condition of invincible makes someone tough facing any plight in the future, like a permanent characteristic.
However, each one of these notions express a wrong idea of resilience but, at the same time, are so close to it. This first approached concepts of vulnerability and invincibility have the same shortcoming, they are static and do not evolve as a resilient should do. Those terms seem outdated so have no enough support against the idea of resilience. Owing to Rutter, the resilience theory changed and is the most crucial switch of view. He made the statement that resilience is a fluid quality, the opposite as the previous theories and methods (Rutter, 1987). Also, he explains the benefits of this revision of the term:
First, invulnerability implies completely resistance to damage, no matter the risks, which is inappropriate and does not include an evolution neither boundaries for stress. Second, not all risk circumstances are the same and resilience cannot be generalized for everything as Anthony did with invulnerability. Third, is not just an intrinsic trait inasmuch as social context and stakeholder should be borne in mind. Last, and more important, the static conceptualization is far from the real resilience. Resilience changes as the entity develops (Rutter, 1993).
People into the same context may have experienced different adversities and being completely different psychologically speaking (Plomin & Bergeman, 1991). Companies also can be into the same sector but the risks they face are not the same either for the localization, the suppliers, the local demand,...
The risk a supply chain faces can be measured by its vulnerability. This way, the resilience would be the opposite: the resistance facing those risks. However, the concepts are not directly related as vulnerability express how potential risks can affect a supply chain while the resilience is how quickly a enterprise goes back to its regular load work and timings after a disadvantage happens (Water, 2007).
With that definitions, we can guess that vulnerability and resilience can coexist and are not independent. One does not mean the absence of the other (Waller, 2001). The association between them is explained by Petit et al. measuring resilience according to vulnerability and

Resilience theory
42
capability. Thus, resilience will increase as capabilities do cause the recovery speed would be faster, and as exposure to vulnerability is low, as shown in Figure 3.2 -adapted from (Pettit, Fiksel, & Croxton, 2010). This second factor refers to all those attributes required for performance or accomplishment (Merriam-Webster, 2020), that involves all the physical, human and technological resources an entity can dispose.
The last decades, Taylorian theories have step aside and managers choose the humanization of systems and organizations. That stands for a company focused on the people, its workers and customers, instead of schedules and times, or only product. So, a culture of organizational resilience is growing up, creating systems where everybody implied is aware of the risks and knows how to manage a resilient supply chain. Therefore, a main element to face adversities, is an according leadership. A resilient leader is the best way to ensure that your organization will prosper in a very chaotic and uncertain future (Stoltz, 2004), and are more liable to survive those non resilient business. Here experience bring to bear its relevance. The know-how is a precious value for enterprises. The know-how represents what Edward de Bono calls transfer (De Bono, 1983). An executive that does not know anything about what happens or how the whole company works, could be missing information and opportunities. Once an area has integrated risk management measures and has become resilient, the same principles can be applied to another. Is not about do the same processes but know how to do it, and that is only human knowledge.
Nonetheless, there is not a huge development of applied resilience in supply chains so far. All the companies that enforce and believe on the effectiveness of resilient systems are in a very
Figure 3.2. Measurement of resilience -adapted from (Pettit, Fiksel, & Croxton, 2010).
Low Moderate High
Low
M
oder
ate
H
igh
Vulnerability
Ca
pabi
lity Increasing resilience

References
43
early stage. Even though their managers are conscious about the added value of a proper management of the risks and are aware of the existence of vulnerabilities, not many of them are willing to invest money and resources fixing it or taking preventive measures (Christopher et al, 2002). Others have just applied resilient principles to separate logistics’ activities, but far from an integrated risk management including all the company.
Contrasted with past crises, individuals and organizations currently depend on person-to-person (P2P) and goods-to-person (G2P) technology to access more data from a bigger number of people than any time before (Carey, 2002). ICTs cultivate interfaces among people and gatherings as well as link associations to whole populaces of stakeholders. Companies have extended the correspondence alternatives on their sites to incorporate official statements, intelligent visit, and continuous video to speak with publics (Perry, Taylor, & Doerfel, 2003). However, hardly any examinations address how ICTs can be utilized as assets by organizations and leaders in light of unforeseen circumstances like a natural disaster or a pandemic. While there are numerous ways that an association can adjust to evolving conditions, Chewning et al assert that adapting the technological structure through ICT use is one key to enacting organizational resilience (Chewning, Lai, & Doerfel, 2013). On their dissertation also explain that this tendency makes technology capable to resolve adverse situations and to assist organizations work accurately during and after the crisis. Basically, to use technology to solve crisis puts an added value to the organization strategy with implications in a near and far future.
One-way companies may achieve resilience during emergency is adjusting current routines, including ICT use, which may thus prompt changes or even making of new ones. The fact that ICT had no genuine job in an association before emergency but turn into the foundation of its mechanical structure following emergency, could be because the utility of an technology resides in the manner we use it instead of the technology itself (Orlikowski, 2000). Along these lines, utilizing ICTs in setting. As people react to the changed conditions made by catastrophe, they can bring about a fortified feeling of conventional communication, or the making of new and innovative structures (Sutton, Palen, & Shklovski, 2008).
There is likewise proof that using several, instead of just one, technologies together can assist a recovery following catastrophe. Combining technologies grants that the system is unblemished by embracing worldwide boundaries. As a reliance of technology exists, managing different ICTs gets more profits than using a simple gadget -see example of mass communication and use of ITCs during outrage at (Dutton & Nainoa, 2003). The main point is to keep the communication between all the parts implied and adjust the ICT use to fit the conditions even establishing new technological structures.
Summarizing, applied resilience was first conceived as a static quality for someone indestructible. Then, emerged a trendier conception of resilience as a fluid characteristic, considering external factors and extending the application to other sectors as management. During 21st century, it has become an inherent into cultural organization that dwell not only in supply chain elements but its workers, managers and stakeholders. By last, technology development and ICTs are helping to progress in implementation and tracing of resilient organizations.
Resilience theory
44
3.1.3 Application
Despite the fact that resilience is a multi-field concept, this current work is focus on the organizational resilient. Inside a company there are many elements where a disruption may take place. Disruption is an abrupt rupture which produces unforeseen business problems, and it can occur in any of the areas of the company such as sales, human resources, suppliers, investments, inventories,... Some stages of disruption are managed differently according to the circumstances of each organization, demonstrating that organizational resilience works in various settings (Carlson, 2012).
Situations of risk can arise, for example, in the financial area, when customers delay their payments or decrease their purchase orders and so brings serious consequences producing a financial crisis. Maybe internal or external events produce the stoppage of the production line leading to a decrease in sales.
Some crises become symbolic due to their impact, degree or intensification, because they jeopardize the future viability of the organization. Therefore, flexibility can be incorporated into the organization's strategic process. Organizations are currently researching and dealing with the concept of resilience to find some key factors to predict and overcome moments of crisis to achieve greater effectiveness. Regarding destruction as a precursor to an elastic process, it can be divided into three categories according to their probability of occurrence: 1) natural disasters, 2) accidents and 3) intentional attacks. These categories differ in the role humans play and the random causal factors involved.
On the other hand, risks are inherent in any organization -even a resilient one- because they can exist in a single business unit or in a project. Sheffi proposes the elements of business resilience, for what he uses a "vulnerability map". To specify the area of vulnerability, it is divided into four quadrants: financial, strategy, risk and operational (Sheffi Y. , 2005).
- The financial section includes a wide range of issues, including internal financing, as well as general economic and market aspects.
- In the strategy section, the action of competitors or new ones is considered. - The risk component includes random interference, such as adverse weather conditions,
earthquakes or accidents, and vandalism, such as international terrorism or toxic waste management.
- Regarding operations, the scope ranges from supplier-related interruptions to interruptions in the production process.
Resilience is large applied in psychology and, as one of the most important strengths of organizations is their human resources, they must accept that problems exist and that their income depend on the survival of the company. Therefore, to help the companies in crisis must become resilient people creating the sense of having the capacity to value in a transcendental way the events that are presented to them.
Even more important is managers being resilient (Stoltz, 2004), they must be ready to know how to cope with instability and to take advantage of the difficulties, since one of the virtues of organizational resilience is to turn difficulties into new opportunities, and understand that organizations they have to adapt to the changes that their environment demands.

References
45
In the next chapter the main risk consider is classified as discrete and external but last in time (Trkman & McCormack, 2009). Also, specific cases of application in sundry fields like motoring, health care and electrical.
3.2 Factors
An undeniable fact is that build a resilient supply chain is not easy. There is not even a consensus about its definition, because there are so many factors to take care of. Therefore, every author selects a couple of them to define resilience and, maybe, add some more for context. Besides some discrepancies there are several features a majority of writers share. Some are considered as pillars (main factors), others are upholders for the main ones (secondary factors), then we can consider physical characteristics that can be measured and give an empirical notion about how resilient the system is. By last, we are assuming factors within the organization, that are already implicit in the previous factors or are inherent to the system.
3.2.1 Main factors
Among all the different considerations, let’s choose the simplest and forthright one. First because the clearer something can be explained in a few words the better, and second to shorten this presentation.
According to Christopher and Peck, a supply chain needs to fulfil with four main factors to be resilient (Christopher & Peck, 2004). Those factors are not physical but related with the organizational culture inside the company.
- Don’t wait until a disruption occurs, a resilient system can be constructed before it happens.
- Teamwork and good rapport are needed in order to detect and handle risks. - As resilience is determined by the quick response facing a disadvantage, agility is a must
for a rapid performance to deal with unforeseen affair. - All people implied in the supply chain processes and study of risks, must be aware of the
importance of resilience and be engaged to risk management’s culture.
Basically, that defines what resilient supply chain is: the ability of the affected parties to communicate and reorganize across periods of rapid change or chaos (Chewning, Lai, & Doerfel, 2013).
As a relatively recent quote, this embrace the requirement of culture of resilience into the organization and collateral parties implied like stakeholders and all the supply chain since the raw material to the customer. Besides, the first statement says that resilience is not a consequence of disruption, but a contingent measure. That is the reason culture is essential, because to take a risk with no previous restraint could be lethal.
3.2.2 Secondary factors
Those secondary factors are capabilities or attributes implicit in the main factors. Their function is to help achieve the main objectives. A summary describing those factors is shown in Table 3.1.
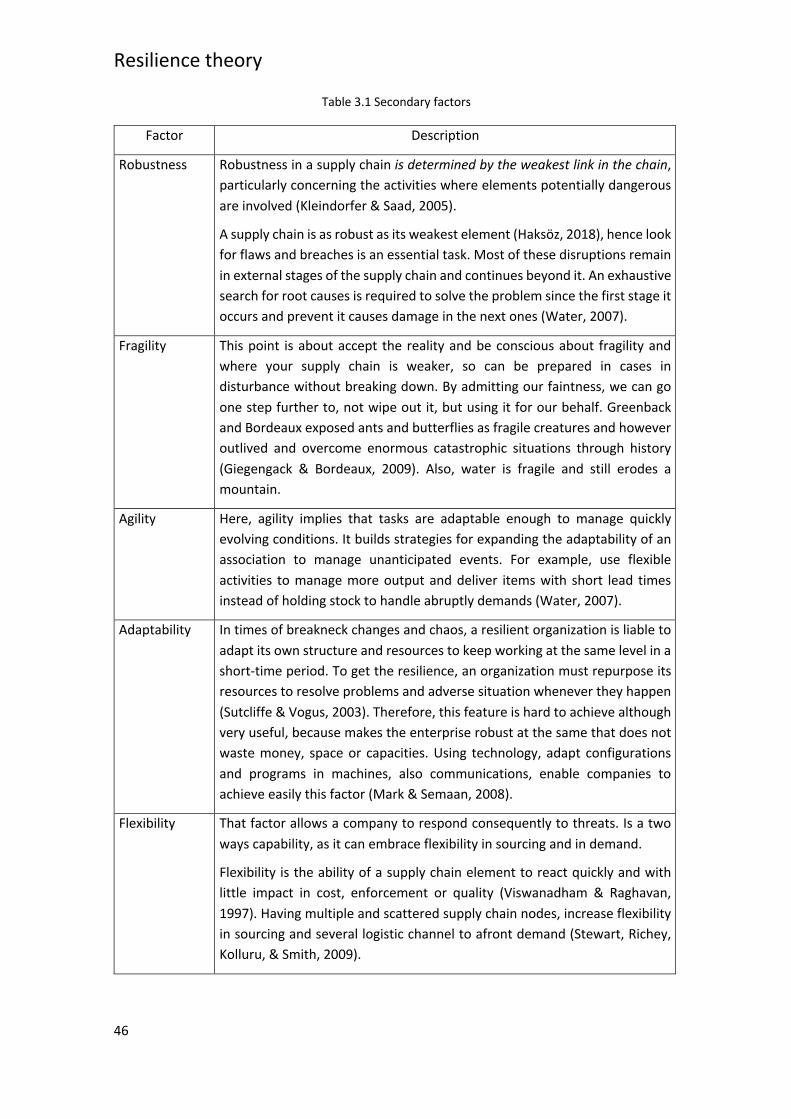
Resilience theory
46
Table 3.1 Secondary factors
Factor Description
Robustness Robustness in a supply chain is determined by the weakest link in the chain, particularly concerning the activities where elements potentially dangerous are involved (Kleindorfer & Saad, 2005).
A supply chain is as robust as its weakest element (Haksöz, 2018), hence look for flaws and breaches is an essential task. Most of these disruptions remain in external stages of the supply chain and continues beyond it. An exhaustive search for root causes is required to solve the problem since the first stage it occurs and prevent it causes damage in the next ones (Water, 2007).
Fragility This point is about accept the reality and be conscious about fragility and where your supply chain is weaker, so can be prepared in cases in disturbance without breaking down. By admitting our faintness, we can go one step further to, not wipe out it, but using it for our behalf. Greenback and Bordeaux exposed ants and butterflies as fragile creatures and however outlived and overcome enormous catastrophic situations through history (Giegengack & Bordeaux, 2009). Also, water is fragile and still erodes a mountain.
Agility Here, agility implies that tasks are adaptable enough to manage quickly evolving conditions. It builds strategies for expanding the adaptability of an association to manage unanticipated events. For example, use flexible activities to manage more output and deliver items with short lead times instead of holding stock to handle abruptly demands (Water, 2007).
Adaptability In times of breakneck changes and chaos, a resilient organization is liable to adapt its own structure and resources to keep working at the same level in a short-time period. To get the resilience, an organization must repurpose its resources to resolve problems and adverse situation whenever they happen (Sutcliffe & Vogus, 2003). Therefore, this feature is hard to achieve although very useful, because makes the enterprise robust at the same that does not waste money, space or capacities. Using technology, adapt configurations and programs in machines, also communications, enable companies to achieve easily this factor (Mark & Semaan, 2008).
Flexibility That factor allows a company to respond consequently to threats. Is a two ways capability, as it can embrace flexibility in sourcing and in demand.
Flexibility is the ability of a supply chain element to react quickly and with little impact in cost, enforcement or quality (Viswanadham & Raghavan, 1997). Having multiple and scattered supply chain nodes, increase flexibility in sourcing and several logistic channel to afront demand (Stewart, Richey, Kolluru, & Smith, 2009).

References
47
Redundancy The intention is to hold more resources than the needs of inventory, raw and intermediate material and even suppliers, and also operate under the maximum capacity. This way, when a disruption occurs, the system performance can be increased to recover the losses (Stewart et al., 2005; Sheffi & Rice Jr, 2005).
However, that entail a huge waste of money and, sometimes, does not worth it comparing with the loss of money the disruption would cause (Sheffi & Rice Jr, 2005). To find a balance for this situation will be discussed on subchapter 3.3.
Velocity It refers basically to how fast materials go through from suppliers to customers. Thereby profit some advantages like shorten lead times, more agility, decrease stock or increase responsive tasks. That can be achieved by making actual activities quicker and more proficient or erase useless operations that do not add value to clients (Water, 2007).
Visibility To share important information -like stocks levels, irregularities, demand changes- all through the supply chain is the premise of visibility, that implies how much one individual can perceive of what is going on at all points of view in the chain. When this happens, managers can follow the track of items from early providers. However, it may have increasingly outcomes when one part recognizes a significant hazard yet does not pass this information on (Water, 2007).
Nowadays, technologies allow this communication to be faster and more secure.
Tinkering To tinker is give materials and resources unexpected and original function creating -not recombining- a new one adapted to the adverse situation (Jakob, 1977).
Very close to adaptability, tinkering requires a creative mind that can work under pressure and chaos (Weick, 1993). Noticeably, it is not chaotic and requires all possible resources and by hand. Meanwhile, design goods so they can be reused during crises in a good preventive measure.
3.2.3 Features
An overview of physical characteristics of a resilient supply chain. Those features are defining for a completely resilient supply chain, giving a strict vision of them. A balance will be discussed further this chapter.
Parallel paths
When a company faces disruptions, either internal or external should have in mind that if its supply chain is too lean, production could stop. This point is especially focused on the external links but can also be applied for internal.

Resilience theory
48
As we will see next subchapter, collaboration and confidence are intrinsic factors and are keys to overcome disruptions. Nevertheless, should not sin trustful: if a company have only one supplier, is more vulnerable because an external mishap would act as an internal one. Depend just on one supplier or one client means that the rotation index is low and should be high. The rotation index shows the susceptibility of a company to suffer risks. If the financing comes only from one source, implies more risk. The same happens for investment.
So, combining agility and redundancy, we can reduce risks. With just one track, there is no chance to avoid risks, one handicap affects to the whole supply chain (Water, 2007). When one link fails, a supply chain with alternative paths can quickly respond and change the track, so de production never stops or is minimally affect. The financing comes from clients, so have several trustful customers is better and implied higher customer rotation index.
That also enforce to resources and products. Those several clients and suppliers should as well take a similar load. To make a closer approach: never let a manufacturer should not take more than 20% of overall revenue; neither a customer absorbs more than 50% of resources (Lawless, 1998). More measures include having multiple logistics channels and live tracking.
Shorter supply chains
Build a shorter supply chain stand for depend on less echelons and keep the partners closer. This way, the materials have to travel shorter distances and the overall resilience rate increase as it depends on less stakeholders. That method brings advantages for Just in Time operations, to reduce transport times and produce according to the demand. However, is a problem for globalization and keep all your supply chain -called cluster in an industrial context- in a limited geographical area enhance risks.
All these problems between lean, robustness and agile, will be discussed next on subchapter 3.3.
Higher stock
Following the theory of redundancy factors, hold extra stocks of raw, intermediate and finished materials will reduce the risks as that allows roominess in a supply chain. Raw materials reduce supply risks, intermediate materials enable operations continue working with that work in progress and finished products to accomplish the demand.
Nevertheless, this solution is too expensive and has its own risks such as obsolescence or highly and risky investment. Also, it can hide the root of basic problems within the supply chain or operations. Anyway, essential stocks are always needed. We will see more about this problem and how to solve it further this chapter in 3.3.
3.2.4 Intrinsic factors
We have looked into features of a resilient supply chain and guidelines or principles that should follow. But there are other links, more human, that are implicit in a well working supply chain. However, managers do not act on these connections always and let partners and workers get demotivated and poorly interested in working on building resilience.
Some of the factors considered more relevant are the following ones.

References
49
Collaboration
To build a resilient chain is mandatory that individuals cooperate to take care of shared issues, guarantee integration. This joint effort can befall from informal discussion to strategic alliances (Water, 2007). The most well-known structures share data to raise visibility rate. Despite coordinated effort is hard to accomplish, supervisors must be convinced that is wise to work with current structures. No matter the nature of the collaboration, the alliances are bound to manage issues from coordinated action. The two ways to front facing this are the following and none of these methodologies are characteristically right or wrong. Make a choice will depend on the conditions:
- A close joint effort with few firms working so intently together that a misstep of only one link would mean fatal consequences for the whole supply chain.
- Expand distance. Arrange an extensive contact list of suppliers thus the failure of one part would not affect to the rest by building a parallel path.
Confidence in partners
The previous mentioned collaboration is only achieved with trust. In other words, confidence not only at a professional level that includes a certain that quality, times and related characteristics of the product, but at a more personal level. Growth a partnership to guarantee that you can trust the other part to share information and that is going on your side facing disruptions and a supportive risk manager (Christopher & Lee, 2004). For this essential task, secondary factors like visibility and reliability are very important because the partners must report each other when a potential risk may occur, or already happened and is dealing with it. The confidence means that you can both trust the other part to inform you and give report without losing the link. That kind of partnership is built through time and shaping a reputation.
In addition, according to Water, lower confidence between partners brings an increase of all the physical factors that should be reduced like safety stocks, lead times,... Therefore, more risk in the supply chain (Water, 2007).
Supplier relationship management
Those partnerships and collaboration should last in time and create new ones. Manage the relationships entails procedures that help to hold on current suppliers and clients, generate new ones thanks to a good reputation and successfully overcome breaches (Water, 2007). The interest of two companies sometimes may not be the same, because partnerships can be between different fields or between public and private sector. At this point, have clear contracts and statements than define the relationship is essential; where measures, expectations and monitoring actions should be reflected.
Organization
As we saw previously, resilience is a whole system term as Horne and Orr (1998) argue. To be aware of the resilient rate, we must consider all the echelons of the supply chain, because organizational resilience is an efficient response of the whole to a disruption that affects any of the processes without get stuck in a prolonged recessive performance and continuous losses (Horne & Orr, 1998).
Resilience theory
50
A company can performance independently and its profits and costs can as well, but it depends on other companies and organisms -stakeholders- and vice versa. An individual good practice does not have value when the collective performance is deficient. Individuals can make count when they work together and support each other. That is what organization means, not just links but create a strong framework.
3.2.5 Measuring resilience
Among possible measures of how resilient a supply chain is, may be considered not only theoretical numbers, but also physical characteristics, localization and virtual and logical connections between nodes.
3.2.5.1 Resilience triangle
The empirical method to measure resilience is called the “resilience triangle”. This concept arises out of disaster inquiry. It aims to show visually the damage a risk causes and the lack of functionality. Sheffi (Sheffi Y. , 2005) explains in some books and articles this method and we will see an overview of them. Drawing a graphic in time where the recovery time is represented on the abscise axis and the performance level of a company on the ordinate axis. The performance is an index given by several factors such as profits, production, customer satisfaction or capacity. This methodology can be applied to certain areas, the supply chain or the whole company.
Before any disruption, the performance level will be considered as 100% -representing the point that should be achieved after the disruption, not as full workload or perfect performance. After the adverse event, the performance lightening decrease. By last, the organism recovers slowly the previous and searched performance level.
As mentioned before, this performance comprehends several factors, and recover the same level does not mean that the values of the individual factors are the same as resilience is about evolve to a new and better state, not just go back to the same state as before.
However, real life is a bit more complicating and the process of the disruption and the recovery are not linear. Sheffi and Rice (2005) give a more detailed process, composed by 8 phases to know:
1. Preparation to risk. For certain cases, there are warnings and companies are ready for disruptions and that reduce its effects.
2. Disruptive event. The time the breach takes place. 3. First response. Just after the disruption, quickly actions to control the situation or
make the impact less severe. 4. Initial impact. This state may not happen because the impact is so hard that the
disruption is total since it strikes. In normal cases, it takes longer to fully affect the company but still spoils the performance.
5. Full impact. When disruption causes the main and biggest damage to the performance level.
6. Recovery preparation. This period can start even start before the disruption, thus implies both preventive and active actions to recover the performance level.
7. Recovery. All the process of “back to normal” adopting the convenient actions.
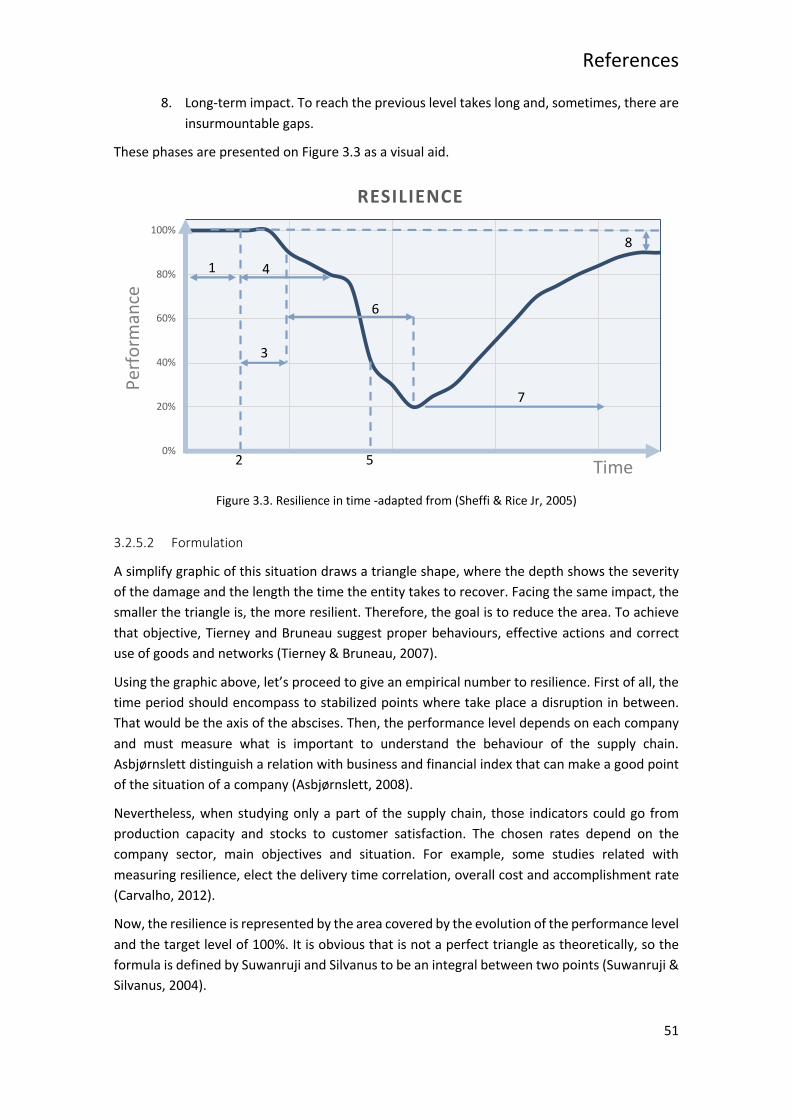
References
51
8. Long-term impact. To reach the previous level takes long and, sometimes, there are insurmountable gaps.
These phases are presented on Figure 3.3 as a visual aid.
3.2.5.2 Formulation
A simplify graphic of this situation draws a triangle shape, where the depth shows the severity of the damage and the length the time the entity takes to recover. Facing the same impact, the smaller the triangle is, the more resilient. Therefore, the goal is to reduce the area. To achieve that objective, Tierney and Bruneau suggest proper behaviours, effective actions and correct use of goods and networks (Tierney & Bruneau, 2007).
Using the graphic above, let’s proceed to give an empirical number to resilience. First of all, the time period should encompass to stabilized points where take place a disruption in between. That would be the axis of the abscises. Then, the performance level depends on each company and must measure what is important to understand the behaviour of the supply chain. Asbjørnslett distinguish a relation with business and financial index that can make a good point of the situation of a company (Asbjørnslett, 2008).
Nevertheless, when studying only a part of the supply chain, those indicators could go from production capacity and stocks to customer satisfaction. The chosen rates depend on the company sector, main objectives and situation. For example, some studies related with measuring resilience, elect the delivery time correlation, overall cost and accomplishment rate (Carvalho, 2012).
Now, the resilience is represented by the area covered by the evolution of the performance level and the target level of 100%. It is obvious that is not a perfect triangle as theoretically, so the formula is defined by Suwanruji and Silvanus to be an integral between two points (Suwanruji & Silvanus, 2004).
0%
20%
40%
60%
80%
100%
RESILIENCE
Low Moderate High
Low
M
oder
ate
H
igh
Vulnerability
Ca
pabi
lity Increasing resilience
Time
Perfo
rman
ce
1
2 5
3
4
7
8
6
Figure 3.3. Resilience in time -adapted from (Sheffi & Rice Jr, 2005)

Resilience theory
52
Defining the next concepts, we can rate resilience of a supply chain with the Equation 3.1:
Ri: resilience index searched for a company i;
Pi: average performance level when the company i it is not distressed by a risk;
Pit: evolution through time of performance level for a company i during period t;
t0: start point of the period a company wants to examine its resilience performance level, usually referred to an average level before the disruption;
t1: finish point of the period a company wants to examine its resilience performance level, usually referred to a recovered time after the disruption;
R! = 1 −∫ (P! − P!%) ∂t%"%#P!(t& − t')
≅ 1 −∑ (P! − P!%)%"%(%$P!(t& − t')
= 1 −∑ (1 − P!% P!> )%"%(%$P!(t& − t')
Equation 3.1. Measure of resilience -made from (Suwanruji & Silvanus, 2004).
Where 0 is the lower limit and 1 the upper limit of the period.
This rate turns out values for Ri between 0 and 1, where the lowest result means a completely lack of resilience and the highest shows a strong resilience against the disruption and, moreover, the company can maintain at the same level its workload and performance during that period of time.
Some simulating researches, found out that just one risk affecting to one echelon of a supply chain endanger the whole chain, causing damage to allied companies direct or obliquely (Carvalho, 2012). The propagation along the supply chain creates a similar pattern as the resilience triangle, whence the equation can be extrapolated to a joint of companies (Tierney & Bruneau, 2007).
3.3 Lean
In contraposition to the features of redundancy and robustness, we find the concept of lean. Is a practice that is more present and highly demanded for managers to reduce costs and lead times. However, as seeing before, according to the resilience theory that lean can be dangerous and expose the company to more risks if the actions are too severe.
3.3.1 Aim of lean manufacturing and logistics
Lean manufacturing exists since the beginning of history. The first attempt alludes to Sakichi Toyoda that invented several tools and methods to produce with no fails. But the methodology as we know it today was born just after war -that means, a disruption- in the motoring field with Toyota, although with a different name “The Toyota way”. Taiichi Ohno, designed a method to produce with no waste and by demand. In common with resilience, lean methodology is based on continuous improvement and reduce costs.
The aim of lean is to focus on the client, forgetting Taylor procedures fixed only on efficiency, methods and times. Lean thinking combines the efficiency of the process allowing no waste while manufactures what and when the customer wants.

References
53
The term as we know it now, was coined for the first time in 1988 by Krafcik and described by Womack and Jones according to 5 steps (Womack & Jones, 1996) they observed in Toyota method:
1. Define value precisely from the perspective of the end customer in terms of a specific product with specific capabilities offered at a specific price and time.
2. Identify the entire value stream for each product or product family and eliminate waste. 3. Make the remaining value- creating steps flow. 4. Design and provide what the customer wants only when the customer wants it -pull
system. 5. Pursue perfection.
The Lean model is intended to produce without waste or minimize it, so the least possible resources are used but achieving greater value for the customer. It eliminates all waste, processes and failures that are unnecessary and do not add value to the final product and, therefore, that the customer is not willing to pay. Inside those wastes, is including the transportation of products, materials and human. So, the lean logistics is both internal and external. Involve keep the suppliers and all the link close so materials are quickly available, also the workplace must be designed to avoid unnecessary displacements.
Organizations seeking to implement lean methodologies or some of their tools clearly pursue targets related to improving process performance. In this search, Marvel and Standridge endorse that many organizations did not achieve significant enhancements (Marvel & Standridge, 2009). This failure usually is attached to the misunderstanding or wrong application of the methodologies. For example, use only one tool or the same lot of them to all the problems instead of analysing what the issue needs, so do not end up using the wrong tool (Pavnaskar, Gershenson, & Jambekar., 2003). Therefore, it is very important to consider that lean production is a philosophy that requires organizational contributions and cultural adaptation.
Taiichi Ohno noticed the differences between American and Japanese processes methods. In fact, many people across the last decades have tried to copy enterprises from other countries and fail. That issue is believed to be related with cultural differences lying into the way a company is managed, the work culture -for instance, in United States a worker can stop going to work without prior warning and that is a risk to take into account- or even technical boundaries (Flinchbaugh, 1998).
3.3.2 Main concepts
Once we have a basic notion of the lean system, let’s proceed to also explain some of the main techniques and lean tools.
KAIZEN
As said before, the aim of resilience is evolving, so this tool means continuous improvement through observation, with which you can find solutions to problems that arise in production or jobs (Alukal & Manos, 2006).
Standardization

Resilience theory
54
It consists on set up a logic and the best method to develop a task. It must be the same for those equal tasks and every worker must fulfil with the standard to achieve times and goals. Common to all shifts, that achieve the cost, quality and deadline objectives of the client, guaranteeing the safety of the operator. There are four elements that must be in any standard: procedure, key points -critical phase that can put the operator, product or process in danger if not done correctly-, target time and standard stock (Myerson, 2012).
Kanban
Kanban refers to a method grounded on cards that help the operation of pull-systems to give production orders, knowing the demand and the stock. The customer request is the start point, the petition runs backwards from the client to the raw material supplier, going through all the stages asking for the necessary elements in each stage. The same way, if any intermediate stage runs out of material resources, can ask to the previous one for more assets. Synchronize all the processes is the hardest task, where communication and dynamic data exchange are overriding. Thus, the information is quickly transfer when a disruption occurs (Shah & Ward, 2003).
Six sigma
improvement methodology and complex problem solving. Six sigma means "six standard deviations from the mean," which translates mathematically to less than 3.4 defects per million. It is an strategy that allows the minimum range deviation tolerance in processes as a way to reduce waste, defaults and roughness in both products and services (Pinedo, 2010).
6S
Is an indicator of the quality of the management in a company. In the beginning it was compound by only 5S and later a sixth one was added. The name comes from its six principles with their original Japanese name: Seiri -select-, Seiton -order-, Seiso -clean-, Seiketsu -standardize-, Shitsuke -discipline- and Safety -the last one, added in English literature (Sukdeo, 2017).
7+2 wastes
There are processes that add no value to the final product and should be deleted. Those can be classified in waste, instability and inflexibility. There are 7 + 2 wastes, which help to identify the symptoms that the production system suffers for not producing as it should or does not reach the objectives to satisfy the customer (Myerson, 2012).
The 7 wastes are overproduction, stock, transport of pieces, defects, movement of operators, waiting and over processing. In addition are included waste of talent and resistance to change.
Jit
Just-in-Time methodology is an inventory management system that consists of keeping stocks at a minimum level from where suppliers deliver just what is needed at the necessary time when the customer requires it. To avoid failures, suspensions and delays in daily production it is important to be very organized. However, it does not guarantee being prepared for unforeseen disruptions without a safety stock (Schwarz & Weng, 2000).

References
55
3.3.3 Balanced lean within supply chain
Since the beginning of this chapter, the attention has been focused on the trade-off among robustness and efficiency. Meanwhile, the lean thinking culture is stronger every day, so is time to change the perspective and also give importance to the balance between leanness and reliability of systems (Kleindorfer & Saad, 2005).
As all the features of a resilient supply chain may look like this concept is just in order to achieve a strong and prepared for adversity supply chain, no matter what. So, in this section we will see some methods to not fall in a fever of resilience and try to find an intermediate point where the company is not wasting money nor time and still be resilient.
Shape of the supply chain
It makes sense that a tangled supply chain has a higher level of risk than a basic one. The first ones have more echelons and more connections, summing up more things to turn out in a disruption. Yet, a supply chain vulnerability lay upon, not only the amount of members, also how they are organized.
The set up could be in parallel or in series, just like electrical circuit. As analogy, if a supply chain is arranged as a series circuit, means that every echelon goes after another, in a row. In that situation, as soon as one step fails, the whole supply chain fails as well. Therefore, the probability of risk is bigger. Conversely, elements placed in parallel can work independently. If one element fails, the others can still work with no problem. As consequence, the probability of completely failure decrease exponentially (Water, 2007).
As example, if a supply chain is constituted by 3 elements, each one with the same reliability of 90%, the global would be:
Series: Reliability = 0.9n ; (n=3) à Reliability = 0.729
Parallel: Reliability = 1-(1-0.9)n ; (n=3) à Reliability = 0.999
Previously, it was mentioned that characteristics for a resilient supply chain, concluding that should be short and with parallel paths. That example implies just three elements and in real cases supply chains are composed by more.
The first configuration refers to a completely leaned supply chain, considering just the essential elements. When the process is too lean, we add impact level of risks. The second one is an overly resilient supply chain; is robust but has too many redundancies and the company may be likely avoiding profits or wasting too much money. The solution is a mix of both models, trying to find the balance between exposure to risks and avoid profits.

Resilience theory
56
Therefore, the resilient zone search for this balanced situation and considering the same factors for the definition of resilience, an improved representation is showed in Figure 3.4.
Spare capacity
Two of the features of a supply chain are agility and flexibility, that consist in leave some extra capacity so, in times of disruption, when the process needs to increment its capacity to produce more in order to manage the adverse event, can quickly change the configuration and performance a rapid response. When the system in working at maximum capacity, this manoeuvre range is not possible (Braithwaite & Hall, 1999).
The resilience theory suggests holding high stocks, and also not to operate at full but to leave spare capacity. At this point the question is how much unexploited resources should we leave? Again, the balance between a too much resilient and a too much leaned process. Working under the maximum capacity carries loss of potential production and, hence, money. But facing a disruptive event work at full capacity entails a collapsed system which is not able to adapt its production to the requirements.
A method to leave the needful free capacity is an analogy proposed by Goldratt and Cox into the theory of constrains of the main author. It consists of compare a production system with a boy scout march (Goldratt & Cox, 2016). This method was planned to solve bottlenecks, a kind of internal issue and frequent one, which are the weakest element regarding capacity and stablish the production “rhythm”. It is indeed a disruption although an expected one. The method can be applied to external and unpredicted risks if we consider an entire echelon as bottleneck in a global vision.
Low Moderate High
Low
M
oder
ate
H
igh
Vulnerability
Ca
pabi
lity
Resilience zo
ne
Erosion of profits
Exposure to risk
Figure 3.4. Balanced resilience -adapted from (Pettit, Fiksel, & Croxton, 2010)

References
57
3.3.4 Globalization
Due to the complexity of the supply chains nowadays, partially to globalization and high request sourcing, connections, displacements and a huge number of communications in general make the management of supply chains even more difficult. The way these connections between partners are organized and overseen can have the effect among benefit and misfortune (Christopher & R Towill, 2002).
The globalization of systems was boosted by technologies that enable companies work together even from different countries, transport materials from all over the world to guarantee the best source materials,... thanks to the development of the web and the fast evolution of telecommunications, it is possible to communicate instantly and efficiently from almost anywhere in the world. The companies that were not able to change or were sceptical to give this step into technology, turned out to be overwhelmed by more updated and global companies, now known as ‘big giants’. In addition, the globalization of the markets has generated a greater interest in news and current events in world terms, since what happens in one point of the planet can have positive or negative repercussions on the economy or on international relations.
Globalization has generated greater openness, advantages, in economic, social, technological and cultural terms. It also brought disadvantages while the creation of trade alliances between nations and the massive displacements that globalization has fuelled. Some authors explain several positive and negative impacts of globalization such as Feenstra and Hanson (1996), Marin and Verdier or Clegg and Porras (2007). In Table 3.2 a summary of the most relevant for enterprises is shown. (Feenstra & Hanson, 1996), (Marin & Verdier, 2003), (Clegg & Porras, 2007).
Table 3.2. Advantages and disadvantages of globalization
Advantages Disadvantages
Greater and more efficient economic exchange
The displacement and exchange of products and services around the world have stimulated new economic and commercial policies that standardize a lot of previous processes, simplifying them.
Increased risks
This phenomenon itself is a risk as induces more treats to an organization. A company have to be aware of the affairs all over the world, because not only is affected by local matter, or national restrictions and laws, but for all these events in other countries where it has partnerships. The environment and field a company is into, add specific risks that other fields do not have to face.
Technological exchange
Before globalization, emerging economies and underdeveloped countries could take a long time to access cutting-edge technologies. This implied a backwardness in productive
Widening the inequality gap
Globalization brought capitalism, and this has resulted in the concentration of capital in global business conglomerates, to the detriment of local small and medium-sized companies and helping to increase

Resilience theory
58
terms, further deepening the gap with developed countries.
Globalization has allowed greater and easier access to technological resources that have a positive impact. This, in sum, stimulates development, inventiveness and innovation, which contributes to progress.
unemployment levels in the world. This hinders the creation of small companies and their prosperity because they are crushed by big multinationals.
Cultural diversity
Within the company there is cultural diversity that contributes various points of view and mentalities to conceive the production process. This provides a greater range of creative solutions to problems.
Global environmental degradation
The excessive increase in the production of goods and consumption generates a series of problems that affect the environment. From the use of chemicals in the textile industry to the inconveniences generated by the amount of plastic and technological waste, to name a few, without counting on deforestation for the exploitation of wood or soil.
In conclusion, globalization brings a great development of processes, communication and, in general, contribute to build greater companies, more efficient production systems and better technologies as well as transfer know-how. But the development is so fast, it exposes the society and companies to more risks that only with a joint effort and responsibility can be managed.
The dangerous thing about globalization, is the exponential increase of links and speed of manufacture, the covetousness of human beings.
3.3.5 Pandemic scenario
A simulation-based study with 3 scenarios shows the consequences of globalization in an epidemic and provides useful results and measures for companies facing changes in supply, production capacity and demand. The study focuses on a company located in China, focus of the SARS-CoV-2 pandemic and with distribution centres in different parts of the world including Germany, United States and Brazil. The simulation follows a logical flow through the SC, first affecting the production centre in China, then spreading to the distribution centres and, finally, to customers with interrupted demand.
In summary, the simulations are carried out in a staggered manner and several simulations of each scenario result depending on the speed of propagation (45, 60 or 90 days), the time of supply interruption in the distribution centres (30 or 60 days) and the interruption of demand (45 or 90 days), with a fixed reduction of 50% (this value could also be changed).
The results, as expected, indicate that the longer the duration of the interruption, the greater the losses and the negative effects on SC. The impact decreases performance, causes stockouts and price inflation. However, performance is a different function for each scenario.
In the first case it is proportional to the duration of the interruption.

References
59
The second scenario includes the speed of propagation to distribution centres and the duration of the interruption in them. Based on the simulation data, performance is a function of downstream outage time and virus spread, with outage time being much more significant, but upstream outage does not have as much of an impact.
In the third, something similar to the previous one occurs, where the upstream interruption is not statistically significant. The observation that deserves the most mention is that, when the negative effects are coordinated over time, performance improves compared to other situations in which, despite being the shortest total interruption, the effects and closing times are not synchronized and they make the negative effects add up.
In the event of an epidemic, it may be that only part of the chain is affected and, therefore, resilience practices as parallel paths and seeking alternative providers is a viable option. The problem is accentuated when the entire SC is affected as well as the alternatives. The most commonly used options in disruptions may be inventory accumulation or outsourcing, and they may be valid for a short period of time at first, but stronger measures are needed. The construction of a resilient SC must focus on more permanent solutions, responses that adapt to an exceptional situation but that is also a change in the conception of the SC itself, to improve its regular performance. Now, thanks to current studies and known cases, it is possible to estimate losses and the evolution of disruptions in the pandemic quickly, so that many companies can anticipate changes in demand and performance of the SC. Using this data, they can manage risks proactively.
In long and complex SCs, risks must be identified and mapped at all levels, not just the first level. Much more important is flexibility and adaptation to external disruptions (Pavlov et al., 2019a, 2019b) as well as having an early detection and control system. Flexibility can be achieved in both the SC and the product. It is increasingly common to manage the SC from the product, reducing the number of individual components, standardizing and creating a design that allows customization, the exchange of parts, and even the recycling of parts (taking into account the product return process within the SC). From a logistical and productive point of view, robots and AI usurp jobs on the production line and transport within the factory, which allows the process to be much more automated and, in this pandemic case, serves as containment of the virus, as they cannot spread it.
The general conclusion of the COVID-19 pandemic is that the companies that have been able to adapt their SC to the restrictions and changes in demand -in other words, with a high level of resilience- have been strengthened. Companies in the automobile or textile sector have had to stop their production and regular points of sale because they are not essential goods. However, factories in the automotive field have adapted their machines and processes to manufacture fans and other urgent and much needed machines for hospitals. Meanwhile, textile companies have dedicated their production to laboratory coats, masks and other products necessary for health and researcher employees.

Strategy for Risk Management in Supply Chains
61
4 Strategy for Risk Management in Supply Chains
At this point, where the fundamental theory has been expounded, it is convenient to adapt it for its application. In this section the aim is to state the steps to set up a valid and functional model for a company to its specific affair and explain the steps that lead to the creation of a plan for supply chain risk management (SCRM). The scope reaches all the companies so is a procedure guide that can be valid for any field.
4.1 Introduction to methodology
A company with a risk action plan is a more prepared, competent and less vulnerable one. Developing a strategy requires following a methodology that helps planning, implementing, and controlling the process. SCRM is about to figure out how to get to know the needs and expectations of the supply chain.
A methodology for SCRM addresses the main questions that determine how to obtain data, analyse information and structure the procedure. Then the method implements the processes. The five main steps are (Aqlan & Lam, 2015):
• Analyse the SC to know each element and the relationships between them and simplify the following steps (4.2 Problem formulation).
• Identify and analyse the risks that affect each component, more complex systems and interconnections (4.4.1. Identify risks and 4.4.2. Analyse risks).
• Evaluate each risk to determine the key features (4.4.3. Evaluate risks). • Plan action strategies against risks (4.4.4. Action planning). • Continuous improvement (4.4.5. Control and monitoring).
4.1.1 Features of a SCRM process
The main function of a supply chain is to move, compose and add value to a product. When one of the elements of the chain does not work as it should, the supply chain breaks. A supply chain has to accomplish quality, deadline and cost requirements. If one of those factors is affected in any way, the supply chain is not functional. So how does a company get a functional SC? And how can this state be maintained?
The main key is about build a supply chain based on the resilient principles and manage it so it is continuously improved. The first step to optimally manage a SC is to have knowledge about it. Know the chain, its weak and strong points, analyse the entire chain and abstract it into smaller elements. The chain cannot be controlled and managed if one cannot understand and explain it (Deming & Edwards, 1982). The goal of SCRM is not to create a risk-free SC or to develop a plan that eliminates all risks. As previously has been said, managers only focus on the threats that carry the risks and eliminate, mitigate, or transfer them. But the risks also have positive consequences. Therefore, the SCRM theory aims to understand threats and opportunities, reduce the former and take advantage of the latter.
The most common theories deal with ongoing risks, usually originated in production, variation in demand, supply, or deviations in capacity. They are the aspects that most concern managers and that represent daily savings. For these types of risks, a widely used procedure is to analyse

Strategy for Risk Management in Supply Chains
62
risks and past events, review the history to learn from previous experiences, determine probabilities of occurrence and impact, calculate the estimated cost,... Furthermore, estimating the cost is a method of choosing the action, in most cases it is used to know the expense in repairing or compensating the negative consequences. Currently, managers continue to prefer to assume a risk expense than to take corrective and preventive actions. Basically, focus on financial terms (Tsai, Liao, & Han, 2008).
The point of view is to consider the SCRM a cyclic process, where the SC is always under supervision to adapt it to the changeable conditions of the environment. The cycle is called cycle of Deming or PDCA (Deming & Edwards, 1982), from the capitals of its steps: Plan, Do, Check and Act. Is about search for new ideas to manage risks.
- Plan means to observe and analyse the SC so some action plans can be discussed according to the conditions and include them into the management planning (4.4.4. Action planning).
- Do is the action, the implementation of the plans and also when the data is collected to know the quality of the performance (4.4.5. Implementation).
- Check if, according to the data and the later analysis, the performance and results of the plans adopted are good enough and achieve the goals (4.4.6.1. KPIs).
- Act in consequence of the previous results. If the plans are successful, then they must be completely integrated and controlled. If the actions are still causing problems or do not achieve the goals as expected -that could happen while the controlling process from a successful plan-, then another plans should be taken into consideration and the cycle starts over (4.4.6.2. Automatic control system).
In order to show that it is valid either for internal and external processes in the SC, some brief ideas for risks related with providers is shown next in Figure 4.1.
Figure 4.1. PDCA example
Definitely, a functional supply chain is not that one free of risks or to suffering adversity, but that one that can overcome a disruptive event and stands up back to normal activity in a short
PDC
APromote suppliers End contract with suppliers Carry new opportunities
Ckeck and follow action plans results
Evaluate performance Develop action plans
Choose suppliers State quality features

References
63
time and wasting few resources, thanks to an action plan and applying strategies previously considered. In addition, a functional and effective SC is capable of turn upside down the risks and take advantage of the opportunities (Jacobs, Chase, & Aquilano, 2004).
4.1.2 Resilience Managing Risks in Supply Chains
The risk management culture is fostered by the management and the managers, that is, by those who must directly influence strategic decisions regarding facing risks. Although the paradigm is changing, until a few decades ago risk aversion in companies was very high. The strategies were very conservative and it was preferred to solve the negative consequences of the risk rather than face it before it occurred. Later, the supply chains gave a change to a trend that today is dominant, consisting of lean. This trend, although it does not face the risks, it reduces those related to the predictable variation of production and demand, or mechanical failures and alike - usually short-term risks. Despite this, for risk management it is not the most appropriate strategy, since it generates other risks by making the SC much more vulnerable.
A halfway perception is the resilience. Building a resilient SC is the best way to manage risks, without taking losses and improving the production and logistics process (Woods & Wreathall, 2003). To adopt this vision, those responsible for managing risk should have characteristics that promote the correct application and introduction of the resilient mindset in the company and thus take it to all areas. First, they need to be aware that risks exist, accept them so that they can be identified and analysed, and make the right strategic decision. Not being aware of the existence of the risk does not exempt the company from suffering the consequences. Also, managers must be able to find the opportunities, that is, the positive consequences of the risks and fight for them to occur. In addition, it must have a global focus. Do not focus on a specific item, on a specific type of risk or filter by its probability. While it is true that there are ongoing risks in SC that need to be controlled more often, it is necessary to include an action plan for discrete risks.
The role of resilience is important here because it provides the necessary flexibility in the SC that allows reusing existing resources to handle the crisis caused by the disruption and does not suppose an unnecessary continuous expense. It is about following a systematic and integrated approach throughout the chain and at any time. In addition, a disruptive event is unexpected, but a resilient approach to SC assumes that the reaction to the event is not chaotic, excessive or hasty, if not the opposite: it brings a certain calm and stability to the situation (Christopher and Lee, 2004). There is no single, universal solution for risk management through creating a resilient SC. It is about following the principles of this theory, understanding the characteristics and applying them to the extent that the company itself can support. With early risk management, better and more creative solutions can be proposed since you do not work under pressure, then apply the planned changes and improvise according to the unexpected consequences. Of course, a manager is required who understands the situation and works effectively in these situations. Moreover, a resilient company tries to improve with each disruption, evolve to a better and more prepared organization, so it is increasingly capable of detecting more risks and solving them more efficiently.
Strategy for Risk Management in Supply Chains
64
4.2 Problem formulation
This section includes the pre-planning processes that include analysing the supply chain, knowing weak and strong points and the existing relationships within the chain.
Before collecting data, planning possible actions and taking direct action on risks, it is necessary to study the chain to find out how it works, what elements it is made of and what resources it has. The methodology applied here is known as a case study (Yin, 2017). In the MRI context, risk is an intervention in the normal development of SC activity. It is generally applied to explain interconnections between risks and elements, defines the context and environment of the risk and describes the current situation.
4.2.1 Define the case of study
Whether a risk has been detected or not, the supply chain is always exposed to them, so from the first moment in the conception of a company risks must be taken into account. A case is a process or event in an organization or part of it, such as the Ellram supply chain (Ellram, 1996). Therefore, in the case study, what is intended is to investigate the conditions and context of a risk or set of risks that occur in a supply chain process, to understand it and be able to act on it later.
The preparation phase, before planning, is crucial in that it is where the context, scope, general goals, strategic needs are defined, a time horizon is established and responsible.
Managers and executives must meet to learn about the objectives of risk management. The case presentation includes the topic studied, objectives, requirements, scope, the general strategy of the company and that applicable to risk management, description of all the procedures that make up the object of study, evaluation criteria and taking decisions, and key questions to consider both in data collection and in decision-making for actions. In this description, certain causes, incompatibilities or issues that must be included in the planning can already be observed (Sjoberg, Williams, Vaughan, & Sjoberg, 1991).
- The object of study must be well identified; if it is the supply chain, it must include all the processes, elements and stakeholders that it is made up of and that will be studied. For a process, each activity is also described in detail. (Activity: Specific actions to be taken to develop the work packages. The work packages can be subdivided into smaller and easier to manage components, called activities. They must be a basis for estimating resources, durations and costs).
- The scope includes everything to be addressed in planning, those processes that are part of risk management and exclude what is not within the plan, which are hypotheses or are external (i.e. if risks are transferred).
- The strategy aims to know the company. A risk management strategy must be defined in accordance with the global one.
- The objectives are formulated in a general context, which identifies the goals to be achieved with risk management. They can include anything from reducing risks to a few percent, such as increasing opportunities in certain risks. It also includes the application time horizon.

References
65
- The decision criteria define ranges of quantitative values to make one decision or another, qualitative factors and the methods to be applied.
4.2.2 Describe the object of study
As for any strategic plan, knowing the object of study is the first step to make the decisions that fit each case. There is no universal template that can always be applied to all organizations, each one is different and has characteristics that make them unique. Describe the object of study means to arrange a list of every component, their features and connections. This information is obtained from observation and documents the company has. This process is not standardized, but a method to do it properly, in order and avoid skipping any element, is by doing an internal and external analysis and make up a strategic plan for the SC.
Normally, the strategic plan of a company is an existing document, at least essential for its proper performance and establishing adequate strategic objectives (Bryson & Alston, 2010). Therefore, the information on the description of the company would be fairly well collected in this document. A similar analysis can be made for the supply chain, first external to the chain and then internal.
In the external analysis, the PESTEL analysis and an analysis of the specific environment are carried out (Carr & Nanni Jr, 2009).
• PESTEL. Is a study of 6 environment perspectives. For the supply chain, the environment is the same as for the company, adding only some factors specific for the company, such as internal policies that affect the SC, own developed technologies that can be used, etc.
Pers
pect
ives
Political Includes political issues that affect directly like taxes, labour laws, environmental laws, customs, trade restrictions,...
Economic Are the variations in economy that may affect demand, customer power acquisition, currency changes, raw material prices,...
Social The social tendencies affect changes on demand, the target clients,...
Technological The available technologies for the SC automatization, control and management software or advantages for an improved SC performance.
Ecological Environmental issues related with the SC activities, making a special mention to the logistics and transportation tasks.
Legal This includes from labour laws to quality standards.
• Specific environment. Following the Porter Forces model (Porter, 1979), relevant aspects
are collected to carry out the analysis of the organization's situation at the present moment, as well as in the future. In this way, both new threats and opportunities can be distinguished, thus defining a future strategy. It is made up of 5 factors or "powers" that threaten or are key to competitors: threat of new entrants, threat of substitutes, power of customers, power of suppliers and competitive rivalry. Focusing on the SC, let just describe the three more relevant factors:

Strategy for Risk Management in Supply Chains
66
Bargaining power of customers. Since income depends on the extent of market share, customer loyalty, etc. A great bargaining power of the clients is detrimental to the company, since it supposes that the control is held by the clients and the company must comply with the requirements of prices, delivery times, quality,... And it affects the income received.
Bargaining power of suppliers. A resilient SC has several suppliers and, being part of the costs, the bargaining power implies absorbing higher or lower costs. The quality and delivery times are also included.
Competitive rivalry. In the current society, SC is a matter of time, quality and cost. Customers require their products as soon as possible, and always look for the supplier with the shortest delivery time, lowest price and highest quality.
The internal analysis is the most relevant in the case study, since it is particularly different both from other companies and from the organization itself. The strategic profile and the value chain must be included.
• Strategic profile. Compares the SC or the company with competitors. It is done in terms of production, commercial, financial, technological, human and organizational resources.
• Value chain. Chapter 2 discusses this tool in the context of adding value to the product through SC. This analysis is also useful to know all the elements that compose it, the activities, the relationships and the resources. As represented in Figure 2.2, it is made up of primary and support activities. For each one, a detailed investigation is carried out, which includes all the activities that make up the chain and the resources available to it (Porter, 1985). This analysis allows identifying critical activities and processes, those that do not add value to the product, unnecessary movements, overuse or underuse of resources, technologies and labour, etc.
After internal and external analyses, it can be collected in a SWOT analysis. It is an analysis that shows strengths and weaknesses (internally) and opportunities and threats (externally), making it easier to identify risks at this point. The advantage of this analysis is that risks can be distinguished, in general, it is not only focused on those with negative consequences, since opportunities are a potential advantage of the environment and strengths include all the resources that make up the SC and serve to manage favourably the risks (Crockford, 1986). Therefore, this analysis overcomes the conservationist and fixed barrier of managers who only focus on visible risks, which pose a measurable, immediate and negative threat.
By this analysis, the organization can know their weakest and strongest elements -remember that a SC is as vulnerable as its weakest point- and, therefore, its needs. The needs are all the aspects where the SC should improve its performance or act over.
4.2.3 State goals
To know the main objectives of RM, the managers have to study the causes that provoke the problem or problems. These are the conclusions that are obtained from the SC external and internal analysis of the study case and that are the input data for the objectives. When the availability and needs of the company are known, you can start talking about actions and strategies. The objectives established in the previous phase are general, they point to the overall strategy of the company and not to the individual one to face each risk.

References
67
The objectives can be collected in a document or a table. Normally an Excel table containing the objectives with colour scales and charts to see their evolution is highly recommended. In order to determine them, it is appropriate to ask research questions that answer where measures should be applied, what is to be achieved, how it is to be achieved, who is responsible and what is the horizon of application.
Where: from the analysis of the company the abstraction of the elements, processes or areas that make up the SC is obtained and it is for each of the elements that a goal is established.
What: is the goal itself. They are the values or characteristics to be achieved in an area or element.
How: generally describe resources, previous applications, or preliminary plans.
Who: write down the responsible for that element / area / process.
When: is the time horizon in which each objective is applied or must be achieved.
A short example is shown in Figure 4.2 with the filling gaps mentioned above.
Figure 4.2. General goals example
The global objectives can have a quality, demand, time, financial focus,... But normally to get to the top one has to translate it in terms of costs and benefits. This is calculated once the action plans have been determined, according to resources and time, an estimated cost can be calculated and the margin for improvement gets the benefits.
Strategy for Risk Management in Supply Chains
68
4.2.3.1 State criteria values
Decision criteria are the limit values, value ranges, qualitative description or other forms of measurement established in the objectives, with which decisions will be made. For example, for an FMEA analysis it is necessary to previously establish an RPN value from which the risk has to be treated. These values are determined by the company based on its particular strategy and general objectives.
To adopt a strategy, one must first establish the criteria and steps to follow to determine which of the five strategies to adopt. As is described in the first chapter of this thesis, the most common risk management strategies are mitigation, transfer, acceptance, elimination and exploitation. For each one, conditions are determined under which one strategy or another would be applied. For example, for a quality risk, where it is measured on a 5-level qualitative scale from poor to excellent, the criteria could be:
• Mitigate: the criterion would be if the quality value is less than the third “neutral” level, the failure is visible by the customer and the problem is detected within the organization, a mitigation strategy is adopted, and corrective or preventive actions are proposed.
• Transfer: the criterion would be if the quality value is less than the third “neutral” level and the problem is detected outside the organization / SC / process, the risk is reported and transferred to the party involved.
• Accept: the criterion would be if the quality value is between level 2 "bad" and 3 "neutral" and is not perceived by the client, it is accepted.
• Eliminate: the criterion would be if the quality value is in the first “lousy” level and is perceived by the customer, it must be eliminated.
• Exploit: the criterion would be if the quality value is at level 5 “excellent”, an exploitation strategy is adopted and plans are created to incorporate it into the SC.
This is an example and each SC must determine its own according to its needs and objectives. Some companies may need more oriented strategies to maintain a level and others to correct huge risks. For risk assessment, it is necessary to establish the scale of values from 1 to 10 that define the characteristics of a risk so that its severity, probability of occurrence and ease of detection are scored. In relation to the score obtained by the above factors, the risks will be classified from lowest priority to highest. For each level there must be a range of values previously established in this phase. Depending on the company policy, they can be linear ranges, equal or not. Later, the 4 phases into which they are divided will be distinguished.
Last criteria to mention here is the priority of suppliers and clients when a disruption occurs. According to the enterprise strategy, could be beneficial to prioritize those clients that have a higher purchasing power or that are more profitable or important in the marketing context, or the criteria is just to share the commitment and share the production with all the suppliers in a smaller quantity or according to some weighted weights.

References
69
4.3 Data
In this subchapter are shown ways to obtain data that can turn into useful knowledge and statics orderliness to analyse and extract conclusions with few data by multiple regression and other methodologies.
Data are discrete elements worthless in and of themselves but, with accurate treatment, lead to useful information. Data is defined by its form, content and origin (Bellinger, Castro, & Mills, 2004).
- In form they can be structured -if they are collected from a formal and classified environment- or unstructured -when they are obtained from a normally more informal environment, of conversations, reports, etc.
- The content can be numerical, qualitative, descriptive, etc. - The origin refers to whether it is external or internal to the company or, in the case of
study, to the supply chain, whether they are current or historical, etc.
4.3.1 Collect
Data collection is the first step to know the risks present in the SC. A good data collection procedure must meet three requirements (Yin, 2017): obtain data from various sources, develop a database that structures and serves it in the future; and follow a flow of evidence, that is, a logic that triggers events.
4.3.1.1 Type of data
Although statistical methods, such as factorials, can be used to purge factors and data, having a good initial database is an advantage. This means that the data must have some characteristics: be useful, sufficient and understandable (Wang & Strong, 1996).
- Useful data are those that fit the purpose for which they are intended. For example, for the study of a risk related to a supplier in the SC, the annual benefit of the previous year of our company is not relevant.
- Sufficient data implies two things. The first, that the amount of a type of data collected is enough to be able to analyse it both manually and statistically and that the results are reliable and complete, that is, that they do not give wrong or equivocal results because the data is not homogeneous. Secondly, the least amount of data possible is needed, that is, if all the requirements can be covered with one type of data, it is better than having to collect 3 different types to reach the same conclusion.
- Understandable data is data that can be easily interpreted and is not misleading.
4.3.1.2 Big data
SCM tries to improve the drawn out exhibition of the organizations and the resilient supply chain all in all by planning business capacities (Mentzer, 2001). In this sense, an organization must look for a key direction of the supply chain, where SCRM is a fundamental point of reference to successfully adjust the flexibly chain system and the structure inside the structure of the company, human resources, IT and organizational measures (Esper, Clifford Defee, & Mentzer, 2010). The utilization of information and data streams has for some time been a necessity,

Strategy for Risk Management in Supply Chains
70
however as SCM has advanced, it has become a methodology dependent on better utilization of data for the decision making process. There is an acknowledgment that big data can be received at tactical, operational and strategic levels (Kache & Seuring, 2017).
Big data and informatics analysis can help both to make better decisions and to track products within the SC. According to several authors (Basole & Nowak, 2018), (Yu, Chavez, Jacobs, & Feng, 2018), (Wang, Gunasekaran, Ngai, & Papadopoulos, 2016), some basics implication are:
- Implement tracking technologies in the SC. - Financial performance data. - Effect of capacities and structures. - Theory based on analysis of transaction costs. - Improve performance thanks to the coordination between partners to improve the
response to changes in demand.
4.3.1.3 Sources
Depending on the model used, a different type of data is required. For risk management studies they can be:
- Primary data that is collected specifically for the study and is current data used for new or recently detected risks, for the first time a risk is managed, or for the control and evaluation of methods already applied. These methods can be interviews, samplings, observations, records of machines and processes, etc. (Saunders, Lewis, & Thornhill, 2009).
- Secondary data, which already existed or was collected for another purpose, but which are also useful for current management. They are usually historical data, reports from other years or from external companies that have managed similar risks. They can also be obtained from magazines and articles of success stories. (Saunders, Lewis, & Thornhill, 2009).
Also, depending on the method used, quantitative or qualitative data or both are required. The first ones are collected from empirical sources, numerical samples, figures provided by machines, yields, costs,... The qualitative ones are usually obtained from interviews and reports, forms that express data with words or opinions. Normally, both or several data sources are combined to obtain greater truthfulness and more complete information when obtaining data from various points of view and the strengths and weaknesses are combined and covered.
4.3.1.4 Methods
Integration implies that managers rely on employees and people with specific knowledge in each area, supply chain and company to obtain data and useful information to develop the appropriate strategies. The most used methods are:
Interviews
It is the fastest and easiest way to obtain potential information. Managers interview employees with in-depth knowledge of a specific area for which there is not as much information as one would like about past experiences. The person selected to be interviewed has a very important role, so they must provide useful, complete, truthful and neutral information. In most cases,

References
71
these requirements are difficult to achieve, so this method depends on the objectivity of the interviewee.
Group meetings
To avoid the prejudices and lack of objectivity that a single person can give, groups of people are created, also with extensive knowledge but not in a single subject. This method is usually adopted when some prior information is already available and it is intended that they identify significant risks and that innovative and creative ideas emerge to manage the risks detected.
The most efficient form of this method is known as Brainstorming. The work environment is more informal, so the participation of all members is encouraged and the ideas that emerge tend to have more innovative content. This last factor is due to the fact that groups tend to make riskier decisions than individuals. The dynamics are fed by the own ideas that arise that encourage the rest of the members to think from that idea or change to a completely opposite one, that is, once a basic idea emerges, developing new proposals is easier (Chapman, 1998).
Delphi method
It is an adaptation of group meetings but in writing and more formal. It consists of a standard questionnaire that each member must fill out individually on ideas for coping with risks, measures and risk detection. The coordinators analyse the responses and send a report to the members and the questionnaire is repeated. By observing the ideas of classmates, new ideas may emerge or change your mind and support one of the ideas. The process is repeated several times until reaching a consensus or a small range of responses that allow making an accurate decision.
It is an anonymous questionnaire, so it overcomes personality barriers such as shyness or, on the contrary, a person who talks too much and tends to impose his ideas at any cost, or a person who always supports the opinion of “the strongest". It allows people who can have very good ideas but do not express fear or shyness, to expose them (Linstone & Turoff, 1975).
4.3.2 Process
The data collection step can accumulate a lot of data, some that may be useful and some less useful, or may contain errors. When the data sample is not clean or does not meet any of the data requirements, it is necessary to adopt an experimental statistical model to process the data. Also, it is necessary to transform them on occasions to be able to apply the methods of analysis and risk assessment. Therefore, it is necessary to process the collected data before you can apply it and obtain information from it. Various processing may have to be used, below are data purging, transformation and standardization.
4.3.2.1 Clean/purge
One of the data requirements is that they are relevant and concise. By cleaning, those that are not useful for the objectives and identification of risks are eliminated. Furthermore, as many of the methods used are informal and qualitative - through meetings and interviews - it is necessary to “scan” or review all the documents collected to extract the necessary data.
A common problem, especially in interviews, is that, when collecting the opinions of individuals, some data is contradictory. In these cases, it is convenient to obtain a representative sample

Strategy for Risk Management in Supply Chains
72
and collect more interviews. As a disadvantage, this method can be time consuming and require further processing in statistical software to obtain the most relevant opinions. The alternative is to send standard questionnaires to many members of the work team in each process, but one risk is added: the truthfulness and commitment of the testimonies.
4.3.2.1 Transformation
From the opinions and interviews, the data obtained is mostly qualitative, however, the preferred and most used analysis methods are quantitative or require operations with them. This means that they have to be transformed into numerical data. This process is very simple, it only requires established criteria to match a qualitative value with a number. Most common scales used are colours, sad/smiley faces or an opinion that goes from “very bad” to “very good” going through different levels. This scale can be easily transformed into a 1 to 5 scale.
4.3.3 Analyse
Nowadays, the amount of data is so huge it is almost impossible to analyse all of it. Here is where IT and statistics fulfil the prior workload. Analyse process consist on extract conclusions to make the data useful to plan strategies.
In quantitative data it is very frequent that there is a large amount of data and it is not known which are relevant and which are not. In these cases it is necessary to eliminate factors that do not provide variability -another way of looking at it is that only concise data is extracted- with factorial experiment designs. Statistical software is capable of carrying out these experiments and, in addition, with an analysis of normality it is possible to detect and eliminate erroneous data and also correct incomplete or non-compliant data -i.e. if a numerical value was required in a questionnaire and the data entered is alphanumeric. These statistical experiments also determine the most relevant factors, so more data to evaluate the risk later can be collected from them. To know more about experiments design see (George, et al., 2005).
4.4 Processes of SCRM
The pre-planning phase is where the company, the supply chain and the elements are observed and known, and objectives and priorities are established. To achieve these goals it is necessary to establish an action plan that is made up of several processes.
As defined in Chapter 1, SCRM is made up of three main elements: the assessment consisting of identifying, analysing and evaluating risks; the planning, evaluation and implementation of actions; and continuous improvement through monitoring and evaluation.
4.4.1 Risk identification
The identification of risks is the detection of all the events that suppose a deviation in the normal operation of the SC. This first step of SCRM aims to understand the potential and existing risks, identify them and classify them according to the categories described in Chapter 1.
From the previous study of the object of study, this step is relatively simple if it has been carried out correctly, since all the activities and relationships that make up the SC are well defined and structured. With the identification of risks, a list of the potential risks associated with each element must be established. It is a methodological process in which common, related risks and

References
73
risks that others trigger can be found (Water, 2007). So following an orderly procedure is essential. There are several methods to find the risks, the most common are shown in 4.5.1.1 where they are explained in more detail. Using various methods allows a more complete view. Still, each company can determine its own methods and combinations.
4.4.2 Risk analysis
Once the list of risks has been drawn up, mapped or any other technique, they must be analysed to determine their consequences. The identification methods provide a list in any format as output documentation, classified according to their nature, area of application,… Now, the analysis methods study each of the risks individually so that possible effects that would be triggered in case that they occurred. Another factor that analyses is the resources implied, so a list should be arranged. It is more desirable to obtain objective information, but this is not always possible or available, so it has to be subjective. The most common methods and tools are shown in 4.5.1.2.
At this stage uncertainties are analysed. There are known consequences for frequent risks, but in general many possible scenarios are studied, the consequences are analysed from a root cause or vice versa and hypothetical scenarios are proposed (Viscusi, 1998). Then, it is possible to establish relationships between the consequences, extract the ones that appear the most, and group them by areas and by frequency so that histograms can be drawn for later evaluation and it is easier to assign values of severity, frequency of occurrence and detection.
4.4.3 Risk evaluation
In this step, values are assigned and risks are prioritized. They can be divided by relevance, impact and negative or positive consequences.
Previously, the risks were analysed to know their consequences. In the evaluation, these consequences will be considered based on factors such as their impact and their probability of occurrence (Wu, Blackhurst, & Chidambaram, 2006). With the FMEA method the detection level is added -how easy to detect it is. Other companies may determine that the cost of repairing the damage is included in the assessment, or they perform a transformation, and apply a compensatory multi-attribute method, such as weighted sum, to make one factor more relevant than the other.
Management is directly or indirectly involved in strategic decisions, and costs are an important part of running a business. It is then necessary to consider not only the relevance of the risks, but also the associated costs and classify them again.
The classification by levels according to the consequences score is translated on a numerical scale from 1 to 4 (letters can be attributed and distinguish more levels, but it must be common to all and must be established in the criteria). This index is also called HTP (Hazard Totem Pole) (LORD), so it is referred to by this name in this section. For costs, it is classified in the same way into 4 levels, also defined by the company according to its level of earnings, profit margin, EBITDA, etc. Now, each risk has an associated risk priority index and an integrated cost index, which serve to identify various categorical levels (Xie, Anumba, Lee, Tummala, & Schoenherr, 2011).

Strategy for Risk Management in Supply Chains
74
• An example to better understand this classification is the following:
A company establishes a classification of severity, occurrence and detection with values from 1 to 10. The classification according to consequences is in the 4 levels described above, with the same characteristics. The costs and the HTP index are made up of 4 levels.
A detected risk results in a low severity S = 2, it is very easy to detect D = 1 but the frequency is very high O = 9. The RPN = 2 * 9 * 1 = 18 and falls within the trivial risks, so a value for the HTP index of 4 is assigned. The associated cost of implementation is also low, so the cost index is 1 .
Comparing, for example, with another risk that has a very serious impact S = 9, a low detection D = 8 although a very low occurrence O = 1, has an RPN = 9 * 1 * 8 = 72. With this number and description is a serious or big risk, so an HTP of 1 is associated. Being unpredictable, the associated costs without a plan can be very high, they can even ruin the company. However, establishing an action plan saves many costs and the investment is much less, at a level 2.
By combining the two indices, this serious risk would be in first position. The classification prioritizes the second risk, allocating resources first to solve this risk. Figure 4.3 shows an example of a classification according to this method.
Figure 4.3 HTP method example
At the top of the diagram are risks with great impact and that the action plans to mitigate, reduce or the established strategy are very low, therefore, it is a risk that must be addressed first. Since it is practically impossible to deal with all the risks, with this classification it is also possible to determine criteria for which, according to the value of the RPN, HTP or cost factors, one strategy or another is chosen. For example, for a very small RPN value, companies often accept the risk and include the consequences within the company's normal activities as a known risk. This approach addresses those most important and critical risks.
An impediment to this approach lies in the fact that the strategy adopted may be mitigation. That is, the associated resources and costs simply reduce risk rather than eliminate it. Mitigation may be enough to control the consequences and considerably reduce the impact, but it is an aspect that managers must value. As a solution, several diagrams of this type can be made where the risks classified in the first positions are studied and the associated costs related to each type

References
75
of strategy are simulated. In this way, several possible scenarios can be reclassified and also considered. However, it can be time consuming to carry out all studies and simulations.
The conclusion is that each consequence has an attributed value, all consequences are evaluated in the same range and with the same criteria. According to the undesirable consequences score, the risks can be divided into four levels (Crockford, 1986):
- Trivial. These ones have a low score because the severity and non-detection are very low. However, the frequency is very high. They are small failures and risks to which a SC is continuously exposed and usually occur but are not relevant or affect the normal development of the chain. Being so predictable and common, that risk is normally included in both time and cost calculations.
- Little. The severity is still low and it is relatively easy to detect them, although it is not always possible. The frequency is also quite high. They are common risks and are normally known but not considered in depth, so they sometimes occur at undesired times and can cause small disruptions in the chain, albeit with a fairly quick return to normality. Action plans are made up of routine measures.
- Medium. In this case, the frequency is medium-low and the predictability is reasonable. However, the severity is medium and they begin to cause more serious damage. This classification is the risks that managers study the most, since they can be recurring events over a period of time, that is, with a constant amplitude, but they can also be random and the highest non-detection. They require more elaborate and creative action plans.
- Big. The frequency is very low, but the gravity is very high and the pre-detection is very low. This makes these risks very dangerous and underlines the importance of this classification. Risks classified as major consequences have a very high impact, but, being rare, many companies and managers do not develop an action plan for these cases, but rather wait for them to occur before taking hasty actions.
In the criteria setting step, you must assign the values that comprise each level. Each company can assign a range of values that fit its objectives and activity. In addition, with this classification, a bar chart can be drawn to apply a Pareto analysis and determine 20% of the risks that cause 80% of the consequences and apply to those urgent action plans.
4.4.4 Action planning
The planning of actions for each risk concentrates great responsibility, since the success and achievement of the objectives will depend on this decision-making. In this phase the risks, their consequences are known and are classified by their relevance. With more analysis, even the most important risks can be determined, those that, taking action on them, influence the majority of the consequences. Action plans are measures chosen from among brainstorming that are considered to be the most efficient to carry out a strategy on a risk and be successful (Swaminathan & Tomlin, 2007). There are two ways to deal with them: with proactive or anticipated responses that act on probability; or reactive or containment responses, which act on the impact.
Sometimes it is difficult to limit a disruptive event. For example, in the case of an epidemic, an exact moment is not detected when it breaks out like a fire, and it can take months to affect the

Strategy for Risk Management in Supply Chains
76
SC while measures are not taken because it does not feel like a real risk that could really affect. Suppliers and even governments give a reassuring image, which isolates from reality. But there comes a point where communications collapse and the alarm state actions to be taken accumulate in a very short time. Then, the company suffers a crisis. It is at this time when you have to have an action plan to avoid panicking and control the situation.
An action plan must contain all the measures and the ordered procedure, the strategies adopted for each risk, the objective to be achieved, the resources assigned, the time of action and those responsible. Resilient employees and collaborators who take initiatives and act quickly help to face the risks. It is important to build a flexible and resilient SC in equal parts so that action plans are effective, require less cost and have a greater impact.
4.4.4.1 Individual objectives.
With the risks identified, ranked and ranked by relevance, it is time to describe the individual objectives for each risk. In other words, goals must be established according to the chosen strategy (Fraser, 2003). The individual objectives are usually drawn up in a computerized table and usually consist on a combination of the following fields, and an example of one objective is shown in Figure 4.4:
- ID number. It is a unique identifier that facilitates the recognition of each individual objective and streamlines the transmission of information, does not lead to interpretation errors or other failures.
- Line of action. It refers to the risk that is acted on. - Strategy. The approach with which the company wants to address risk. - Activity/Measures. For line of action and strategy there are usually several activities. It
is the action plan itself, the measures adopted. It usually has an associated document that explains the complete procedure.
- Indicators. They are the KPIs chosen to measure the performance of the action plan. - Unit of measurement. Indicates the standard unit in which the corresponding KPI is
measured. - Responsible for execution. The person or persons in charge of executing the risk
reduction measures - Responsible for supervision. The responsibility falls on a single person to facilitate
management. He is the one who controls that the measures are being executed correctly and makes decisions in case this is not the case or if there is any variation.
- Weight. To manage a risk there can be several actions or activities and each one can have a relative weight that indicates the total performance of the line of action. Percentages are assigned according to the importance of each objective so that they complete 100% for the line of action.
- Initial value. It is the value of the KPI, it is the indicated unit, just before implementing the actions.
- Goal value. It is the value of the KPI, it is the indicated unit, which is expected to be achieved at the end of the period of application of the actions. There may also be intermediate objectives to compare the evolution and modify the plan if necessary before finalizing.

References
77
- Real value. It is the KPI value, it is the indicated unit, in each instant of time. It can be a value that evolves and reflects the evolution in a graph or several measures can be obtained at the time of the reviews.
- Performance. Shows the current situation in a scale (normally with colours, signals, arrows,...)
- Review frequency. To check if the objectives are met, it is established how often the objectives must be checked and the quality of the plan must be controlled. It can be constant or infrequent depending on whether it is a long-term, short-term objective, if constant measurements cannot be obtained (for example, if what is measured is meetings, the periodicity is how often the appointment takes place)
- Budget. The budget for taking actions against risk. This amount is collected here and can be updated if the goal is modified.
Figure 4.4. Strategic objective example
4.4.4.2 Measures
The measures or activities adopted usually come from proposal in a brainstorming or copying measures that were previously adopted or in another SC. They can be more or less creative and the exclusivity of the strategy will depend on it and it is a source of competitive advantages (Jacobs, Chase, & Aquilano, 2004). Therefore, there is no single manual to apply based on risk. However, the most successful measures that require less investment and resources have to do with resilience. Chapter 3 explained the factors and characteristics of resilient SC and ways to incorporate that resilience. By introducing flexibility in supply, distribution, product transformation, control systems and / or corporate culture, resilience is created (Sheffi Y. , 2005).
In a SC the risks can be reduced by creating redundancies by storing intermediate and final stock or availability of alternatives to suppliers, with a good ICT infrastructure and effective communication with customers and suppliers (Tohamy, 2009). A simple and very useful example is pull production. The "sell what you have" mentality is used without promising inventory that you don't have. It serves both to face risks of variation in demand and to cover the established demand in case of disruption and not to generate new risks such as customer dissatisfaction when not having the promised goods. It is important to note that some strategies and actions may involve the incorporation of new risks or negatively affect existing risks when the strategy is not well implemented (for example, as seen in Chapter 2 how taking processes to the extreme

Strategy for Risk Management in Supply Chains
78
adds vulnerabilities, hence the importance of resilience and knowing the relationships between risks and consequences).
The measures or techniques more used for companies to face risks and proved as effective are mention as follows. Those are a compilation of several sources that discuss the effectiveness of various techniques (Lee & Billington, 1993), (Knemeyer, Zinn, & Eroglu, 2009), (Yao, Evers, & Dresner, 2007).
- Storage safety stock inside and have available external stock to cover disruptions from suppliers, notated as Equation 4.1 and more detailed explained in (Uthayakumar & Priyan, 2013) along with more stock management formulas.
si = ki σi√@
Equation 4.1. Safety stock
where, si: safety stock ki: safety stock factor for product i that fulfils the probability in Equation 4.2 σi: demand standard deviation for product i L: delivery time in days
Pr(Xi > ri) = qi
Equation 4.2. Probability of stockout
Xi: lead time demand for product i ri: reorder point for product i qi: permissible stockout for product i in the delivery time.
- Multiple sourcing. - Centralize strategies, operations and decisions making. - Locate upstream supply chain echelons near between each other. - Plan and apply systematic procedures of check and control. - Delegate SCRM to an expert risk manager. - Let transparency to exchange information and a fluid communication between partners
and internal departments and processes. - Establish several scenarios for plight. - Use advance programming systems for planning or some software like EnterpriseIQ,
FactivityAPS or Preactor. - Care the relationship with collaborators and provide help in crisis situations and to
improve the global performance of the whole SC - Work for long term contracts with the best suppliers and clients, and state penalties for
the non-compliance of the terms, late delivery,... • After-sales service and collaboration with suppliers
A disruptive event often has negative consequences and is therefore undesirable. But when it happens and it is inevitable, it is necessary to offer the best resources of the company so that the impact is less and does not mean bankruptcy in the company. One must look at the opportunities from which can take advantage. When the disruptive event affects SC within the company and risks face a shortage of stock and demand cannot be met until losses are recovered and production is normal, the correct mode of action is to communicate with clients, with

References
79
transparency, sincerity and offering alternatives. On the one hand, communication reassures customers, so offering a good after-sales service covers both risks related to customer dissatisfaction and offering information and advice in the face of more serious disruptive events. Today many of these after-sales services are highly computerized and it is possible to track and trace shipments online as well as reassign orders or change shipping addresses.
Offering alternatives when the company itself cannot meet demand is a sign of honesty and help. It is not only a matter of justifying that it is not possible to offer the services or products due to a risk that may be catastrophic, it is necessary to communicate with other suppliers who can offer a similar product and collaborate with them to meet demand, find the most suitable alternatives and offer them to customers. In this way, it is possible to generate a good brand image and reinforce customer loyalty after the disruption (Chopra & Sodhi, 2004).
On the other hand, the SC can be affected on the part of the suppliers and that affects the company as collateral damage. For example, a natural disaster that prevents the supply of raw materials, so that its own production stops. Although the risk is not your own, it is advisable to adopt the sharing strategy, so that you actively participate in repairing the damage caused by the disruption as soon as possible. In this way, two things are achieved: first, that the response time and overcoming the risk are less, so that it can occur again more quickly; and second, to gain a competitive advantage (Choi, 2007).
4.4.4.3 Good practices
There are some cases and studies in the literature that resume average and extended practices and responses to reach a resilient SC. Those mentioned in Table 4.1 are collected from cases and reports from several sources such as (Johnson, 2001) and (Rice & Caniato, 2003).
Table 4.1. Good practices for resilient supply chain risk management
Supply resilience
• Alternative channels • Modify stock levels • Local sources • Shortage strategies • Contract for supplier flexibility
Logistics resilience
• Supplemental outsourcing • Electronics supply chain • Product diversion • Channel coordination • Retail ready products
Manufacturing and production resilience
• Standardize product parts • Match channel and product • Combine off-setting seasonal products • Modify capacity and performance levels • Identify and rent support facilities • Product extensions and branding
Communication and IT resilience • Use scope of correspondence media (9)

Strategy for Risk Management in Supply Chains
80
• Backup data • Contract for reinforcement IT framework • Set up and work parallel IT framework
Human resources resilience • Train employees in a cross level • Standardize production process • Support knowledge and know-how
Currency fluctuations and political issues • Financial and operational hedging • Diversify supply
4.4.5 Implementation
The implementation phase consists of carrying out the proposed action plans and applying a constant PDCA cycle with data collection for the KPIs, maintenance and control that the measures are applied correctly, etc. In this step it should be noted that you can start implementing strategies and action plans before completing the full planning study or as trial and error methods and the next described control and monitoring step has to be present at all times. It is not an easy task and requires a rigorous commitment from the employees, the supervisors, the managers and the executives. Some clues to performance this stage successfully is by training the employees with a specific knowledge about the plans to be adopted, do not over allocate resources so everything is available when requires and maintain a permanent communication flow.
4.4.6 Control and monitoring
Once the model is running and the plans taking action, it should be monitored thus know no mishap occurs as well as prove that the indicators goals are accomplished. It is also useful to collect data for forthcoming events and automatically amend index formulations for the future. The main aims of control systems are to detect a disruption, detect a variation on the tolerance, severity levels, costs or other factors, or the non-achievement of objectives and quickly activate action plans.
This is a necessary process, because measures taken as good as they may seem or even if a study does not detect risks at any given time, conditions change and discrete unexpected risks arise at any time. Then, the control processes must detect variations in the environment and in the process itself and, in addition, in a short period of time. Variations can be external to the company but within the supply chain, or internal. The external ones can have controllable, predictable or unexpected causes, such as variation in the quality of raw materials (controllable), price or time inflation (predictable) or a traffic accident (unexpected). The internal ones have their origins in the performance of the machines, a failure of one of the systems, human errors,... Variations are sometimes small and may not pose an immediate risk, but there are patterns and a trend of increasing variation. Early detection makes a big difference in cost, impact and time.
References
81
4.4.6.1 KPIs
The first objective of this step is to examine the evolution of the adopted action plans and compare it with the objectives. Targets for reduction, elimination, etc. are set out in the sheets describing the action plans. and the time horizon to achieve it.
KPIs are key indicators that can be a different factor for each risk. They serve to measure and compare the initial situation with the expected final one and, in between, compare the evolution towards the achievement of the objective. These indicators are identified by each company based on its strategic objectives, measurement capabilities and methods used, but they are data and, as such, they must be correct, consistent and timely. To define the KPIs, it is necessary to verify that they comply with some characteristics (Doran, 1981):
Specific. Is clear and focused on performance objectives.
Measurable. Can be expressed as a quantitative value.
Attainable. The target is realistic and achievable.
Relevant. It has a directly connection to the work area or plan to be done.
Timely. Is bounded and measured in time.
Some common ones in a SC are delivery time, level of customer satisfaction, quality of raw materials, performance of a process, supply time,… Here are 5 relevant ones that are considered to need further study:
I. Cash-to-Cash time cycle
In financial terms, this metric is used to calculate the transformation time of cash resources. That is, the time it takes for a resource from the time it is purchased to become money with its sale and collection. This KPI shows the period from the time a company pays suppliers and charges its customers based on 3 values (Farris & Hutchison, 2002): inventory days (DoI), days payable (DoP), and days receivable (DoR). It is calculated as
DoI + DoR - DoP
This conversion period is preferable to be short to be more solvent. In the face of a disruptive event such as a natural catastrophe or the like, it means that more liquidity is available to deal with losses and to invest in recovery.
II. Perfect order fee
It is a critical KPI, as it measures the level of success to deliver orders successfully and without incident. In a SC, the transport of products occupies a large part of the processes and is one of the factors that are being tried to reduce by locating suppliers near the company. However, it is the delivery to the customer that later determines customer satisfaction, brand image, perceived quality, etc. Thus, it helps to solve risks related to inventory damage, loss or obsolescence, inaccuracies, delays or returns. This KPI is desirable to have a high value.
III. Inventory rotation
It is a purely logistical KPI, specific to SC. It is very useful because it is a sign of the internal health of the SC. You can know the production efficiency, the optimal inventory capacity to reduce costs and work with values that bring the SC closer to a resilient one and establish process

Strategy for Risk Management in Supply Chains
82
strategies to reduce times, movements and also costs. It is a source of competitive advantage in that data can be extracted to calculate optimal inventory and optimal shipments. In other words, minimizing storage and shipping costs, which would either reduce prices to compete with other companies or to obtain a greater profit margin. The ideal is to distinguish between each product or component an own rotation ratio to also know the individual profitability of each product.
IV. Inventory speed
A key indicator of the supply chain, they provide a picture of the amount of inventory expected to be consumed in a given period of time. It is calculated as the division of the initial stock between the sales forecast for the stipulated period and is expressed as a percentage. The calculations are usually made in monetary terms. It is used for risks related to satisfaction and variation in demand.
V. Days of supply inventory
Relative to the previous KPI, dealing with serious disruption, this KPI is very important. Determines the number of days that supply and orders can be fulfilled only with the available inventory, without producing more nor receiving raw materials and components from suppliers. For both a disruptive event that affects the production system and one that affects one or more suppliers, this KPI allows you to prepare and calculate the desired inventory level and the days available, in case the risk occurs, to implement action plans that allow to re-stock or to find a solution to return to normal production or, at least, enough to cover demand in the days following the disruption.
4.4.6.2 Automatic control systems
A management system assists in the control task following a modular structure that must contain all the updated data values and KPIs, as well as those of the severity, frequency and detection to automatically calculate the RPN, HTP and the costs to establish the automatically ranking, the risks detected in the SC that can also serve to detect risks in other areas or in the future, and the restrictions that apply such as policies, hours, rates,... In short, it is a balance scorecard but for risks. This panel can be created in any spreadsheet or even compute a simple program.
On the other hand, to control a more complicated or larger SC, it requires more complete, specialized and automated software. There are commercial solutions based on SaaS and other developers. Below are some of the most useful in risk management due to their capacity and flexibility in times of greatest crisis.
• Infor Supply Chain Management.
It is a SCRM software specialized in the industrial sector, so it has a large capacity. It has many intelligent functionalities that connect the entire SC and has complete control over each process. That is, it connects from suppliers to distributors through internal processes, controls the flows not only of materials, but also of information and money. It has specific functionality for storage control. It is made up of advanced algorithms that allow all these tasks to be carried out and the interconnection to be effective.
An added value feature is that it is designed to be installed in the cloud, that is, it is available from any device, allowing remote control and ease of telecommuting. In addition, it facilitates

References
83
and improves relationships with suppliers and customers, which means better visibility and collaboration when a major disruptive event occurs.
• Generix Group.
It is intended to work in the cloud too. It is more specialized software and focused on the management of the company's internal SC. It is useful to manage internal risks with greater precision. The areas it focuses most on are warehousing, manufacturing, transportation, packaging, and shipping. It is compatible with other software, so it can be integrated with other specific ones for accounting, suppliers, SaaS, etc. The advantage of this option is that it guarantees traceability of operations.
• SAP.
It is a company that provides management software, and one can choose the most suitable plan for their company with personalized features. This option stands out for its planning capacity. Includes functionalities oriented to contemporary demands. This means that it provides sales forecast information and connects demand to inventory to manage optimum levels. It is very customer oriented, controls and manages the SC upwards as a pull system. Manage the production cycle and calculate product costs. It has data and analyses it in real time, making it easier to detect risks and make decisions.
It is a precursor to technological transformation and one of the best known.
• Oracle SCM.
It is another of the best known and most modern. It focuses on the vision of the future, making it powerful in risk management. Its programming includes artificial intelligence systems, which makes it a very complete, automated software capable of detecting risks with greater precision. With more modern management techniques, focusing on reducing operating costs, you can manage storage and also calculate inventory forecasts.
The highlight of this software is risk management, which is highly advanced as it detects and analyses failures, immediately communicates these variations and allows for faster decision-making while reducing risks.
It has functionalities in the area of supply, storage, manufacturing, ordering and distribution, and it is compatible with software within the same developer to integrate the accounting and human resources departments. So control over SC is plenary.
4.5 Tools, technologies and resources
In this chapter some of the methods, technologies, software and approaches to apply the SCRM processes are shown. This is a compilation of the most applied tools.
4.5.1 Tools
4.5.1.1 Tools to identify risks
Five Whys
Strategy for Risk Management in Supply Chains
84
It is a method that can be used once a risk has occurred, to identify the root of the problem and avoid negative consequences in the future. It is also useful from a historical data from previous experiences. The method consists of asking questions repeatedly until the root cause is found and also knowing the probability that it will occur in the future from the individual probability of each linked event. It starts from the final consequence and asks why it has happened, that is, the just previous event that caused it (Serrat, 2017). For this new previous scenario, the why is asked again and so on until the root cause is found.
For each question there can be several answers or causes. This also allows reaching various root causes from a single problem and relating them to other risks that may or may not be visible or that may or may not have already occurred.
It is known as the 5 whys method because according to its creator, Taiichi Ohno, it does not take more than 5 questions to get to the root cause.
Once the cause is known, probabilities of occurrence can be assigned to each event and thus the total probability can be identified and action strategies and corrective or preventive measures can be developed.
Flow process chart
Consist of a detailed list of each activity that makes up a process. Several lists can be made to achieve a higher level of abstraction and identify the risks that occur only in one element, those that affect a larger area, etc. They are represented in a flow or process diagram so that the study is systematic and orderly. With the list, experts critically analyse each activity, identifying in each one the potential risks. For a better understanding and to take into account each type of activity - normally there is a risk that is repeated and is common within a type - the diagram may be made up of figures that represent a type of activity or compose the list as an analytical course of the process (Graham, 2004). This type of process box is made up of 5 types of activities to which each process can belong:
Operation à Any direct action.
Transport à Movement of the product from one place to another.
Inspection à Quality and quantity are checked.
Wait à Indicates a deliberate or unintended delay or pause in the process.
Storage à The product is stored temporarily or permanently.
The time each activity lasts is usually pointed out, so that those that are critical can be determined and in which times can be improved, and which ones are risky for the SC overall process. That time can be also used to draw a Gantt chart so the critic path, which pose a risk due to their duration and other related failures can be easily detected. For movement activities, distance is added. This helps to better plan the structure of the SC and avoid transport failures. An example is shown in figure 4.5.
Here all the activities that compound a process can be seen and, for each one, is marked with points the kind of activity (operation, transport,...). For transport activities the distance the product has to be moved is shown in the second column, for operations the time is written down in the third column. The flow chart shows the order and change from activity to the next one by

References
85
matching the points with a line. This way, risks can be detected for every activity, and the track of the causes is easier.
Figure 4.5 Flow process chart
Brainstorming
This method is useful both to identify risks and to propose solutions and action plans, and is widely used by companies. It is an informal meeting where several members of work teams participate in the proposal of ideas around a central theme. It consists of expressing opinions and establishing an informal but controlled debate to find critical phases of the SC process, find the causes, consequences and propose solutions (Rawlinson, 2017). The idea is that it is a creative process, that it is a hallmark for the company, and that the ideas of some members trigger other ideas until they reach the most appropriate one. So it is a feedback method.
Mapping
Is a methodology wherein the SC and its products, communications and cash flows are drawn from upstream providers, all through the internal processes of the SC, to downstream clients. It is a strong tool to align both the SC and for the global enterprise strategies. The drawing can be a map of the SC with a scale of colours (usually from green to red) as a visual aid to help managers to focus better on those areas or elements which contain a higher amount of potential risks (Gardner & Cooper, 2003). Another alternative is a chart with two axes where elements and its risks are classified according to two relevant factors (as is shown in chapter 3 to measure resilience).
This method is useful to detect critical areas and divide the SC into smaller departments, so the management is easier.
Checklists
A format that serves common risks is a checklist. To identify risks, a list of previously detected risks is used, in other elements or in other SCs and it is checked if they exist in the study SC.

Strategy for Risk Management in Supply Chains
86
Historical data can come from both inside and outside the company, from forums, research, studies,... It is useful as it is a quick method and does not work from scratch, in fact, much of the work is done and It is a source of knowledge from previous experience. Also, is a way to record the frequency or how often a risky event occurs (Zhou, Vasconcelos, & Nunes, 2008).
On the other hand, each SC is unique and, although it is true that many risks are common between chains, other important ones can be omitted, as well as listing a long list of trivial risks that do not require study. This method also focuses on those continuous, routine and most common risks, so the action plans are also usually routine and not very innovative. For cases of discrete and unforeseen risks it is not usually useful.
A variant is the analysis of assumptions, where you work with assumptions and hypotheses. Each proposed situation is applied -usually simulated- and it is verified if the assumption is valid or not for the study SC. If it is valid, the consequences are considered and the action plans are in accordance with them. In this case, it is possible to work with discrete events, posing a crisis situation and proposing, for example, if it could cover an increase in demand with a reduction in productive capacity and the consequences of the SC not supporting that productive load.
Event Tree
It is a graphical representation in the form of a tree that starts from an event and searches for all possible triggers chronologically. It studies both the responses of the process and possible human behaviours before the event, which are more unpredictable, so this method can lead to considering a large number of alternatives. It can be more or less complex, choosing to include only the most probable and common events or expand it to many alternatives, even if they are remote. Starts from an event that occurs in an element, so it is a study that is done before the event happens (Berger, Gerstenfeld, & Zeng, 2004).
A modification of this is the Failure Tree, which starts from the final consequence and seeks different possible explanations for how it has happened until finding the event or events that have led to that situation. That is, it does the above procedure backwards (Cigolini & Rossi, 2010).
Summarizing, the pros and cons are compiled in Table 4.2.
Table 4.2. Comparison of risk identifying methods
Pros Cons
5 whys Identifies the root cause
Previous data can be used
Could cover too many branches and takes too long to study every risk
The event has already happened
Flow process chart
Is very detailed and systematic
It uses empirical and quantitative data
Takes too many time
Needs some people that know the process
Brainstorming Easy and simple
Multifaceted
Sometimes does not lead to a useful conclusion
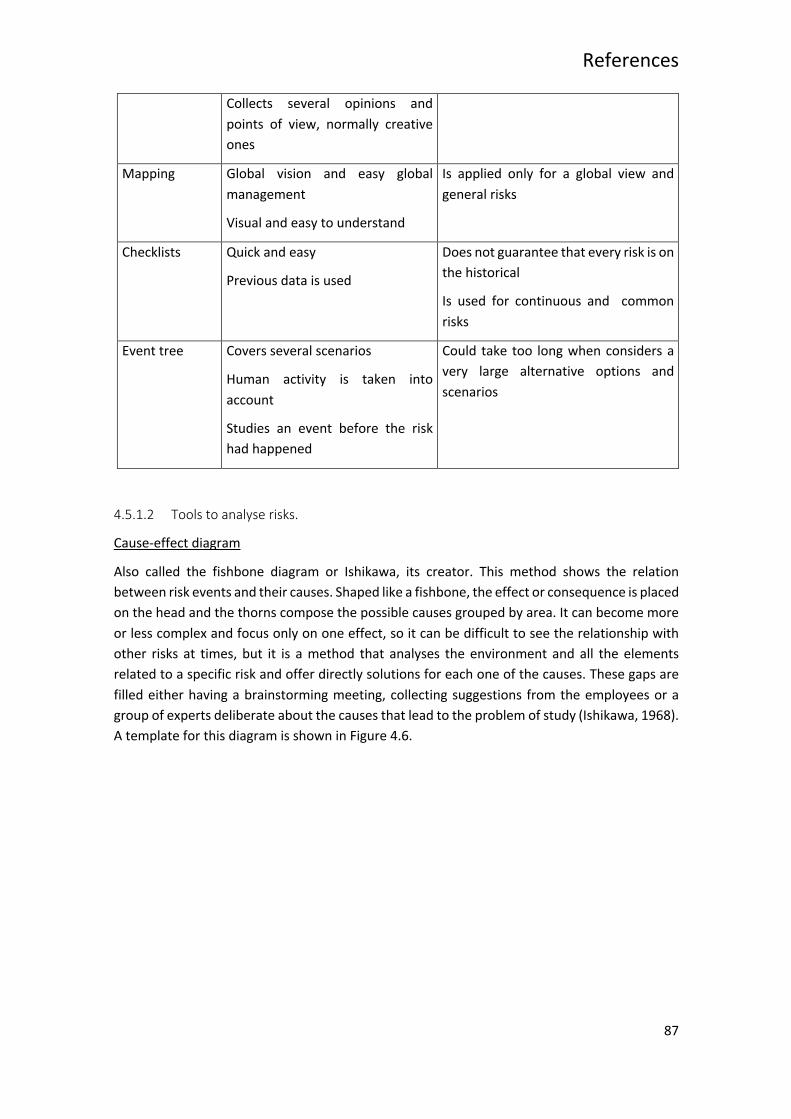
References
87
Collects several opinions and points of view, normally creative ones
Mapping Global vision and easy global management
Visual and easy to understand
Is applied only for a global view and general risks
Checklists Quick and easy
Previous data is used
Does not guarantee that every risk is on the historical
Is used for continuous and common risks
Event tree Covers several scenarios
Human activity is taken into account
Studies an event before the risk had happened
Could take too long when considers a very large alternative options and scenarios
4.5.1.2 Tools to analyse risks.
Cause-effect diagram
Also called the fishbone diagram or Ishikawa, its creator. This method shows the relation between risk events and their causes. Shaped like a fishbone, the effect or consequence is placed on the head and the thorns compose the possible causes grouped by area. It can become more or less complex and focus only on one effect, so it can be difficult to see the relationship with other risks at times, but it is a method that analyses the environment and all the elements related to a specific risk and offer directly solutions for each one of the causes. These gaps are filled either having a brainstorming meeting, collecting suggestions from the employees or a group of experts deliberate about the causes that lead to the problem of study (Ishikawa, 1968). A template for this diagram is shown in Figure 4.6.

Strategy for Risk Management in Supply Chains
88
Figure 4.6 Cause-effect diagram
FMEA (Failure mode and effective analysis)
It is a prevention method that, through a systematic analysis process, contributes to the effort to identify the potential causes of problems and can analyse both the design and the processes. The FMEA method seeks to identify, classify and eliminate in advance the failures of a company. This method of managing risk begins with identifying the errors (Military, U. S., 1949). These are then classified by scoring the risks according to frequency, severity and detection, determining the Risk Priority Number for each one. In addition, it includes sections to take actions and reduce the RPN.
The activities identification phase can be obtained by the methods shown above as a flow chart. Risks are also identified by studies, reports, claims and historical data. After having classified and prioritized them, the most serious failures are established, which are addressed as a priority (McDermott, Mikulak, & Beauregard, 1996).
An FMEA template is shown in Figure 4.7. This template must be completed with each activity and its risks. They are scored according to
o Severity: significance of the failure in the degree of customer dissatisfaction or with the disturbance that the failure may produce in the production process;
o Occurrence: indicates the frequency or probability that a risk will occur; o Probability of Detection: indicates the probability of not detecting the failure before
delivering the product to the customer, or during its manufacture;
from 0 to 10, where 10 means very high impact, very high frequency and little probability of detection. The RPN is obtained by multiplying the three previous factors.
RPN = S * O * D
Each company establishes a NPR value for which, when it is greater than this limit, this risk must be analysed, the causes that originate it and establish corrective measures to reduce it. Furthermore, if the severity value is 9 or 10, this cause of failure should always be analysed since its effect affects the physical integrity of the customer.
Event 1 Event 2 Event 3 Event 4
Why? Why? Why? Why? Why?
Final consequence Root cause
Materials
Human Machine
Model Management
Milieu
Problem/risk
Causes Efects
Posible solutions

References
89
Normally, to decrease the value of D one must act on the quality system, to decrease the value of O one must act on the maintenance system and to decrease the value of G one must change the design of the production system or the product.
Figure 4.7 FMEA template
Pareto Analysis
It is a statistical principle that establishes that 20% of the causes trigger 80% of the risks. This tool is useful for processing and determining which causes to prioritize or allocate more resources efficiently and without spending unnecessary money. A Pareto analysis of risk events can also be done to determine which are most likely to occur in the future (Pareto, 1964). This last approach is not very useful in the case of disruptive events, but it is useful for establishing the strategy based on similar past events. Through historical data, few key factors can be determined to achieve a resilient SC against natural risks of great impact and magnitude, so that managing what could be a great crisis is reduced to the correct management of few factors.
Simulation
Simulation is a method that can be used throughout the entire SC and can span from only a small area to the entire system. It consists of creating a scenario that represents the SC or the study area and, establishing different parameters, analysing various scenarios that may occur. There are simulation softwares that allow a large number of options. Some specific computer programs for SC simulation are mentioned later in computing resources.
A widely used simulation method is Monte Carlo. It is a numerical statistical method, used to approximate complex and expensive situations to evaluate accurately from the generation of random numbers with certain characteristics and statistical distributions. To know more about this method see (Mooney, 1997).
4.5.1.3 Tools to control risks
In risk control it is very common to use templates made with Excel made up of tables with KPIs, objectives, evolution charts, colour scales to determine the current state of the action plan, statistical bar charts and many other representations. Although it is relatively easy to create such a panel, there are companies that offer very complete templates as a risk control and monitoring tool. For the usual risk control, some of the most used panels are:
Procurement Optimization Panel
It is the tool used to control the upstream SC. It focuses on the drive to reduce expenses by the company. Actually, it has several functions since it collects data on suppliers such as delivery
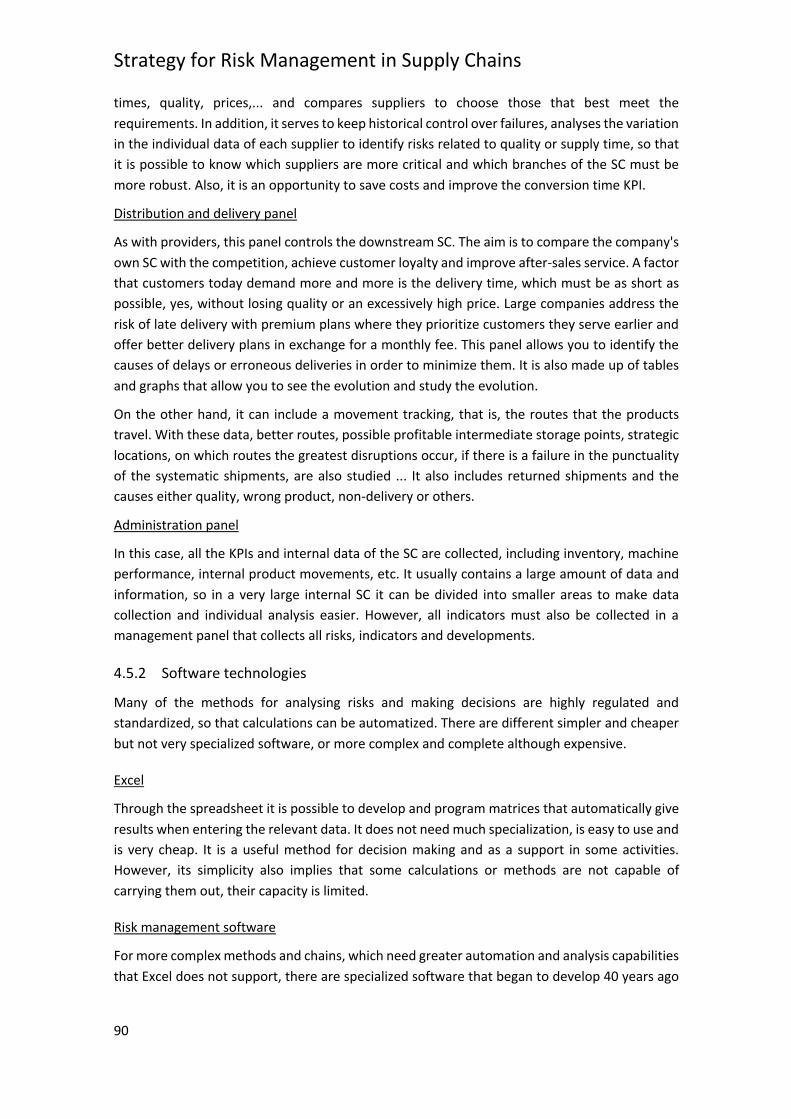
Strategy for Risk Management in Supply Chains
90
times, quality, prices,... and compares suppliers to choose those that best meet the requirements. In addition, it serves to keep historical control over failures, analyses the variation in the individual data of each supplier to identify risks related to quality or supply time, so that it is possible to know which suppliers are more critical and which branches of the SC must be more robust. Also, it is an opportunity to save costs and improve the conversion time KPI.
Distribution and delivery panel
As with providers, this panel controls the downstream SC. The aim is to compare the company's own SC with the competition, achieve customer loyalty and improve after-sales service. A factor that customers today demand more and more is the delivery time, which must be as short as possible, yes, without losing quality or an excessively high price. Large companies address the risk of late delivery with premium plans where they prioritize customers they serve earlier and offer better delivery plans in exchange for a monthly fee. This panel allows you to identify the causes of delays or erroneous deliveries in order to minimize them. It is also made up of tables and graphs that allow you to see the evolution and study the evolution.
On the other hand, it can include a movement tracking, that is, the routes that the products travel. With these data, better routes, possible profitable intermediate storage points, strategic locations, on which routes the greatest disruptions occur, if there is a failure in the punctuality of the systematic shipments, are also studied ... It also includes returned shipments and the causes either quality, wrong product, non-delivery or others.
Administration panel
In this case, all the KPIs and internal data of the SC are collected, including inventory, machine performance, internal product movements, etc. It usually contains a large amount of data and information, so in a very large internal SC it can be divided into smaller areas to make data collection and individual analysis easier. However, all indicators must also be collected in a management panel that collects all risks, indicators and developments.
4.5.2 Software technologies
Many of the methods for analysing risks and making decisions are highly regulated and standardized, so that calculations can be automatized. There are different simpler and cheaper but not very specialized software, or more complex and complete although expensive.
Excel
Through the spreadsheet it is possible to develop and program matrices that automatically give results when entering the relevant data. It does not need much specialization, is easy to use and is very cheap. It is a useful method for decision making and as a support in some activities. However, its simplicity also implies that some calculations or methods are not capable of carrying them out, their capacity is limited.
Risk management software
For more complex methods and chains, which need greater automation and analysis capabilities that Excel does not support, there are specialized software that began to develop 40 years ago

References
91
as risk management in projects. Today the capacity is much higher and they can manage entire supply chains and offer integrated and personalized risk management support.
The software must be able to, at least:
- Follow the stock and track products sold, total cost of products and total price of items sold.
- Generate inventory reports - Detect errors related with the shortage of stock, a performance under capacity, delays
in order or deliveries,... - Hold and actualize KPIs and the fulfilment of objectives.
A good risk management software must be parameterizable that allows adapting the conditions and needs of each company as well as complying with the regulations and legality of each location, integrable with the rest of the company's devices that streamlines the transmission of information both with customers. and suppliers as with internal systems such as the control system of a factory or accounting, and that has an optimal support service that performs complete risk management and results in valid and useful actions (Boehm, 1989). Software usually work with simulations to obtain more feasible probabilities and situations, different scenarios for solutions and schedules.
The advantage of using a management software is that all the SC is connected, the information flows and communications are easier and faster, also money flows are digitalized which brings a safe of time, money and space. It reduces the chance of duplication, that means that detects if the same order has been sent two times by error.
Some of the best known and used are @Risk, by Palisade; SE Risk, by SoftExpert; or RiskyProject Professional, by Intaver Institute.
Statistical software
For the analysis of isolated data, it is necessary to interpret them through statistical models. The amount of data can be extremely large to process manually. With statistical programs, regressions can be performed, filtering information to obtain relevant factors with factorial designs and obtain probabilities (Laeequddin, Sardana, Sahay, Waheed, & Sahay, 2009).
Communications and online processes
When a disruptive event occurs, the speed and quality of communication between processes, departments and even companies is a key factor. With an early warning of risks, it is possible to act quickly and avoid more serious consequences. The structure of the communications, the established hierarchy and the links are elements that must always be present in a SC -and a company in general- to make an effective communication. In the face of a disruptive event of great impact, an effect that always occurs is an avalanche of communications within the company and outside with suppliers and customers. In this situation, a server crash due to saturation is a very likely risk, which is why the technical infrastructure and ITCs have to be robust (Wu, Yeniyurt, Kim, & Cavusgil, 2006).
The loss of information due to saturation is another derived risk that would be eliminated if the previous risk management is adequate. However, it is preferable to have all the information in “the cloud”, on external servers, so all the information and data of the company, suppliers and

Strategy for Risk Management in Supply Chains
92
customers is outside the company. This makes the SC resilient to discrete events such as a computer attack, a flood that affects servers, a pandemic crisis,... In addition, with the data available on the network and the computerization of processes, it is possible to control them remotely. This makes switching to telecommuting so much easier and simpler.
4.5.3 Human resources
The most important part of a company is people. Despite the increasing automation of logistics and production processes, human resources are still necessary. For all methods of identification, analysis, data collection, etc. the experience and participation of employees is required. Additionally, to create innovative risk management ideas and act in unexpected moments of crisis, people are the most effective resource. They also perform the application of corrective measures and interpret the data collected from the control.
Another issue of importance in human resources is their involvement in risks. Despite people's independence, flexibility and adaptability, they also make mistakes, and many of the mistakes -even more so in a supply chain- are caused by human failure. To avoid these failures and improve the effectiveness of the workers' actions, measures are taken such as specific learning in risk management, instruction and also training in the workplace and standardization of activities so that, complying with the established diagram and the certain times, do not give rise to failures (Deloach, 2000). The last component is motivation based on incentives, rewards and recognition, and maintaining a clean, tidy, and stress-free workspace.
On the other hand is the researcher, that must fulfil some skills to do a good research. Between the most important characteristics one can find to be an active listener, flexible, adaptative and resilient, must be able to ask good and the correct questions, as well as interpret the answers (Feagin, Orum, & Sjoberg, 1991).
On their side, the executives have to be openminded and willing to make changes. They define the strategy and the global enterprise action, the vision and mission. So every decision taken following those standards stated by the executives will have repercussions in the performance of the company.

Sectors of Application
93
5 Sectors of application
The SCs are becoming more complex. The urgent demand, stressed for the timings, highlights the need for action plans, but uncertainty is the big obstacle. With globalization the risks increase and human actions do not make it easier. Natural disasters, terrorist attacks, epidemics, and pandemics have increased exponentially in recent decades. In the last century there have been 4 highly deadly pandemics, and a few other epidemics. The first of these 4, in 1918 involved the death of between 2.5% and 5% of the world population and infected around a third of the world population. The same occurs with natural catastrophes such as hurricanes, tsunamis and earthquakes, which occur every year and, although they are natural events, the increased frequency is due to human action on the creations of nature (Jonas, 2013).
Some cases and studies dealing with disruptive events of this nature are shown in this section. There are successful and failure cases, to understand the importance of the attitude, the action plans and the conception in its entirety of the SC instead of only the internal one. There is no single strategy and concrete measures that work for all companies and to face all existing risks, everyone must be able to understand their needs. That is why several stories are shown to understand the way of thinking and acting in each case, from different points of view and ways to respond.
5.1 Health care
The healthcare sector is very critical. Risk management is crucial because it involves people's health and lives. In other words: errors are expensive and unacceptable, as well as the economic impact they can cause by judicial means (lawsuits, fines for recklessness, ...). Companies and organizations related to the health sector are hospitals, pharmacies, laboratories, ...
SCs in hospitals can be divided into transportation, acquisition, replacement and administration of drugs; movement and location of patients and visitors (clients); and assignment and movement of employees (doctors, nurses, clerks, cleaners,...).
The SARS COVID-19 virus pandemic was declared on March 11, 2020, and since then governments, communities and companies have worked to reduce cases and stop the spread of the disease (Singhal, 2020). For all affected countries, the measures of the state of alarm have been similar. The CDC is in charge of managing and controlling diseases of this type and, since it was alerted to the danger of the virus, they have published strategies for the supply risks that a pandemic of this magnitude can cause (Centers for control disease and protection, 2020).
General measures are basically related to reducing contact between humans by maintaining a safety distance of 2 meters, with the proper and mandatory use of a facial mask that covers the mouth and nose, continue use of sanitizer,… With these considerations, the criticality it resides in the reorganization of spaces to ensure the safety distance, adopt hygiene and disinfection measures and manage the resources of masks, medicines and scarce resources.
Hospitals and organizations related to the health sector are the most affected, as they face the greatest risks and threats, with very difficult management.
• Knowing the case.
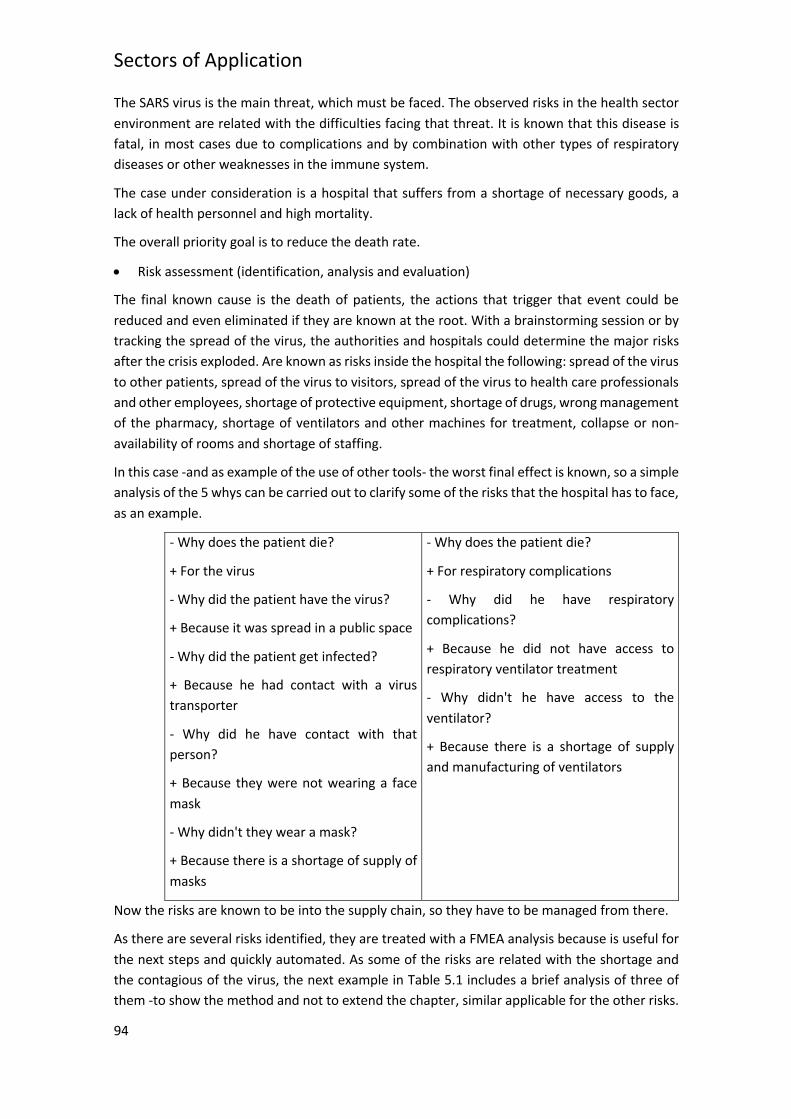
Sectors of Application
94
The SARS virus is the main threat, which must be faced. The observed risks in the health sector environment are related with the difficulties facing that threat. It is known that this disease is fatal, in most cases due to complications and by combination with other types of respiratory diseases or other weaknesses in the immune system.
The case under consideration is a hospital that suffers from a shortage of necessary goods, a lack of health personnel and high mortality.
The overall priority goal is to reduce the death rate.
• Risk assessment (identification, analysis and evaluation)
The final known cause is the death of patients, the actions that trigger that event could be reduced and even eliminated if they are known at the root. With a brainstorming session or by tracking the spread of the virus, the authorities and hospitals could determine the major risks after the crisis exploded. Are known as risks inside the hospital the following: spread of the virus to other patients, spread of the virus to visitors, spread of the virus to health care professionals and other employees, shortage of protective equipment, shortage of drugs, wrong management of the pharmacy, shortage of ventilators and other machines for treatment, collapse or non-availability of rooms and shortage of staffing.
In this case -and as example of the use of other tools- the worst final effect is known, so a simple analysis of the 5 whys can be carried out to clarify some of the risks that the hospital has to face, as an example.
- Why does the patient die?
+ For the virus
- Why did the patient have the virus?
+ Because it was spread in a public space
- Why did the patient get infected?
+ Because he had contact with a virus transporter
- Why did he have contact with that person?
+ Because they were not wearing a face mask
- Why didn't they wear a mask?
+ Because there is a shortage of supply of masks
- Why does the patient die?
+ For respiratory complications
- Why did he have respiratory complications?
+ Because he did not have access to respiratory ventilator treatment
- Why didn't he have access to the ventilator?
+ Because there is a shortage of supply and manufacturing of ventilators
Now the risks are known to be into the supply chain, so they have to be managed from there.
As there are several risks identified, they are treated with a FMEA analysis because is useful for the next steps and quickly automated. As some of the risks are related with the shortage and the contagious of the virus, the next example in Table 5.1 includes a brief analysis of three of them -to show the method and not to extend the chapter, similar applicable for the other risks.

References
95
Table 5.1 FMEA example for a hospital
Risk Process Step/Input
Potential Failure Mode
Potential Failure Effects
Potential causes S O D RPN
Wrong management
of the pharmacy
Storage of drugs stock
Damage to the product
Product in improper spot
The effect of the treatment is non-
effective or causes more
damage
Manpower 5 4 3 60
Management operations ruptures
Run out of product
The patient cannot receive
treatment
Manpower
Method 7 6 3 126
Spread of the virus
Store the protective
equipment in the required conditions
Damage to the product
The effect of the equipment is non-
effective
Manpower
Milieu 8 4 4 128
Shortage of protective equipment
Storage of equipment
Management operations ruptures
Disruption in the income of
products
Run out of product
Product in improper spot
More infected people
Lag between the current stock and
the system
Manpower
Milieu
Method
8 6 4 192
• Action planning
Once the risk assessment has been done, a strategic action plan must be drawn up to face the identified risks and allocate the necessary resources and money according to the priority and previous classification. Some of the strategies for the risks mentioned are discussed below and treated to improve the healthcare supply chain performance according to some authors researches (Woosley, 2009), (Kelle, Woosley, & Schneider, 2012), (Uthayakumar & Priyan, 2013).
o Risk: wrong management of the pharmacy.
Some study cases (Kelle, Woosley, & Schneider, 2012), (Uthayakumar & Priyan, 2013) show in a more or less complex way how the management of the stock flow can improve the performance of the SC, reduce costs and avoid risks related with the shortage of drugs. There could be several scenarios, starting just from a problem of capacity constraints, to include rupture of stock costs. The studios quoted show very detailed formulas and follow of the empirical case. The aim of the study of the management of the pharmacy is to reduce the costs at the same time that the

Sectors of Application
96
system guarantees a successful service and avoid shortage. A great advantage is that the pharmacy can be easily automated and controlled with a management software, as the Pyxis MedStations (Kelle, Woosley, & Schneider, 2012). Basically, the complete model includes unitary costs, issuance or emission costs, holding costs and rupture costs; and has restriction for the amount of drugs that can be storage. According to Equation 2.1 and with the empirical data collected, Figure 5.1 is the graphic comparing the current costs of storage for the hospital studied and the reduction applying stock management having in mind holding costs and issuance costs, not allowing rupture or shortage, that is P(shortage for drug i) ≤ 1−αi where is the service level ( = 1 for a complete cover of demand). Therefore, the final function is
∑ "c! ∙ Q! + e! ∙ "!#! + h! ∙ H!(s!, S!)1;
With the capacity constrain ∑( v!S!) ≤ M$;
And service level P(shortage for drug i)=0.
Figure 5.1 Comparison of costs
o Risk: shortage of personal protective equipment.
For this case, two categories have been drawn to define the critical situation. The first one figures out how to solve temporarily short periods of change or unexpected sudden events. The last one, crisis capacity, refers to long periods of change, unexpected demand and continuous disruption. For each scenario, the CDC suggests strategies for the shortage of protective equipment (Centers for control disease and protection, 2020) such as facemasks, eye protection and isolation gowns (Table 5.2).
Table 5.2 Strategies for shortage of protective equipment
Facemasks Eye protection Isolation gowns

References
97
Cont
inge
ncy
capa
city
stra
tegi
es
Defer or cancel appointments and procedures that require the use of facemasks but are not urgent or priority.
Prioritize facemasks to supply healthcare facilities from public spaces.
Reuse facemasks -if it is not damaged- for patients with same disease and stage, without removing it and as long as it is not damaged or visibly soiled.
Prioritize facemasks for staff rather than infected patients.
Defer or cancel appointments and procedures that require the use of facemasks but are not urgent or priority.
Use reusable goggles and face shields, guaranteeing the same protection after washing and disinfect them.
Use of air purifiers.
Reuse eye protection -if it is not damaged- for patients with same disease and stage, and without removing it except for cleaning.
Defer or cancel appointments and procedures that require the use of gowns but are not urgent or priority.
Use reusable fabric gowns, which can be reused, guaranteeing the same protection after washing.
Wear overalls that cover the whole body and with zippers that meet the mandatory laws and standards.
Reuse expired gowns for training instead of spending new ones.
Crisi
s cap
acity
stra
tegi
es
Cancel all appointments and non-urgent processes that requires use facemasks.
Extend the useful life of face masks during care activities.
Use homemade masks or other alternatives as scarfs, taking extremely high precautions.
State a limit number of reuses for the facemasks and elaborate a removing protocol to guarantee safety.
Prioritize the use of facemasks in activities where the contact with the patient is more likely and prolongated.
Cancel all appointments and non-urgent processes that requires use eye protections.
Extend the useful life of eye protection devices using the same one for several patients known to have the same kind of virus and share the location.
Give priority to the use of eye protection equipment in activities with a high risk of contagion.
Shift eye protection to glasses that cover not only the eyes but the side.
Cancel all appointments and non-urgent processes that requires use gowns.
Extend the useful life of isolation gowns using the same one for several patients known to have the same kind of virus and share the location.
Wear fabric gowns that can be reused and washed.
Use both disposable or washable patients and laboratory gowns
Give priority to the use of gowns in activities with a high risk of contagion.
These are the possible strategies to follow and should be matched with the objectives. In this line, Figure 5.2 represents an example of individual objective.

Sectors of Application
98
Figure 5.2 Example of objective for a hospital
o Risk: hospital jam.
Hospitals are usually under the maximum capacity occupancy to have a spare space for emergency crisis. However, those crises could bring more than a 40% increment of demand the first week for disasters and disruptive events (Naser, Ingrassia, Aladhrae, & Abdulraheem, 2018), and hospitals are not ready for that because operate normally with less than a 70% of the capacity means a waste of physical and human resources and money. For the case, the proposed solutions (Centers for control disease and protection, 2020) are referred next:
- Program and schedule work timings to fit the available staff covering all the necessary activities.
- Hire more healthcare personal. - Schedule working hours to adjust it to demand and program rotate positions. - Cancel non-essential activities and procedures. - Identify alternatives care sites to relocate staff and patients with specific symptoms. - Transfer patients and designate staff to alternative locations -adapt pavilion or other
infrastructures- so the virus is controlled in a specific area. - Allow infected healthcare personal with no symptoms or discomfort who can still
work, to treat patients, taking adequate protective measures. - Allow infected personal who must be isolated do some tasks like telemedicine. - Implement telehealth services to avoid unnecessary movements and decongest the
hospital.
5.2 Industry
In manufacturing and production industries, losses can lead to bankruptcy of companies and, in fact, it is a reality. The occurrence of natural disasters and this type of events has drawn a lot of attention in the studies (Jüttner, 2005), but there is no much applicable cases and companies do not usually take preventive actions (Tang, 2006) due to the widespread belief that they cannot be prevented.

References
99
5.2.1 Automotive field
The automotive field is the forerunner of changes in production models due to the demands of its environment. This industry combines the need for customization with JiT production and very tight timing sequences (Stevenson & Spring, 2007). Always look for methods that speed up the SC without losing quality, since an automotive company cannot have quality failures since any failure can put the safety of passengers at risk.
The CSs in this sector are characterized by being very agile although vulnerable, with high collaboration but decentralized and highly complex due to specialization, globalization and outsourcing (Jüttner, 2005). Knowing how these SCs deal with risks is a source of innovative ideas, possible risks and a way of behaving in the face of disruptions, due to both successes and failures.
The research presented (Trkman & McCormack, 2009) below analyses the German automotive industry, since it is one of the most important and with the most complex SCs. The real data with which we work collects the records of 67 companies, mainly first-level suppliers, that is, manufacturing and assembly.
Around 75% of managers consider their SC to be robust in terms of vulnerability or, at least, they do not consider them to be very vulnerable. Regarding the factors, in the automotive sector globalization, product customization and efficiency are the ones that generate the most risks to the SC because they increase its complexity. Anyway, managers still consider the urgency of develop plans for SCRM as important in the areas in Figure 5.3. according to the study (Blos, Quaddus, Wee, & Watanabe, 2009)
Figure 5.3 Urgency of develop plans for SCRM
The type of risk has an unexpected result since, although it is true that internal risks have a high frequency and are usually less serious than external ones, the total impact of internal risks in SC is greater according to the study.
Companies that develop action plans and that, in general, have high risk management, achieve higher performance. However, there are differences in performance and goal between reactive and preventive measures. Reactive measures improve the response to external disruptions and

Sectors of Application
100
support the bullwhip effect, while preventive measures are more flexible, react to internal interruptions and are more efficient in reducing costs and inventory.
Many disruptive events have stroked automotive industry over the last decades such as a fire that shut down a key partner for Toyota (Nakamoto, 1997), the Kobe earthquake or the attacks of September 11 that brought to bankruptcy of many companies, including the only supplier of chassis to Ford (Lester, 2002). These events usually carry similar risks that are collected in Table 5.3. The investigation carried out in (Chopra & Sodhi, 2004) highlights this risks and actions The strategies proposed for the study are mostly for mitigation, they cover several risks and, the same way, one risk can be approached by several strategies and actions (Table 5.4). Those strategies are thought to reduce risks but, as has been commented before, the risks are related between each other, and could happens that a good practise to mitigate several risks turns out to increase or create another risk (Figure 5.4). Then, better practises have to be implemented to balance the risk.
Table 5.3 Common risks in automotive field
Supplier Internal Client
Disruptions
(I) A factory shuts down for a long period (II) The capacity or performance drops overnight
(III) A key location shuts down for a long period unexpectedly (IV) Capacity drops overnight
(V) Demand increases abruptly for all or a key product (VI) Demand decrease unexpectedly
Delay
(VII) Reception of a key component purchase is delayed
(VIII) Production or internal logistics fails and the product is delayed
(IX) Delivery to a client is delayed
Systems and communication
(X) The system to order a purchase fails
(XI) Procurement system to any direction (internal or external) fails (XII) The system to control inventory or account fails
(XIII) Deliver system goes down (XIV) Personal and credit card/monetary information is stolen/hacked
Purchases
(XV) Delivery time takes more time than expected (XVI) A supplier increases the prices of product noticeable (XVII) Logistic costs increase suddenly
(XVIII) Cash flow incidentals or losses requires delay in payment
Receivables (XIX) Payment not
received for a long period of time

References
101
(XX) Delays in payments of an increase number of customers
Table 5.4 Proposed strategies for automotive field
Strategy Risk Actions
Adjust capacity
(III), (V), (VI) - Carry a low-cost prices strategy - Decentralize the capacity for foreseeable demand - Centralize the capacity for unforeseen demand
Adjust security stock
(I), (II), (IV), (VII)
- Decentralize for highly predictable products of lower value - Centralize for less foreseeable products of higher value
Multiple suppliers
(I), (VII), (XV), (XVI), (XVII)
- Add redundant sources for product that requires big volumes
- Centralize suppliers for lower volume products to few adaptable or flexible sources
Adjust flexibility
(III), (VII), (V), (VI)
- Increase for unpredictable demand in low volume products - Reduce for high-volume products with predictable
behaviour - Centralize when the costs are high in very few sites
Adjust capability
(IV), (V), (VI) - Favour capability for products with a high-risk probability and value
- Reduce for low value and stable behaviour products. - Centralize high capability in flexible sources
Figure 5.4 Effect of strategies – adapted from (Chopra & Sodhi, 2004)

Sectors of Application
102
5.2.2 Aerospace field
The aerospace industry, unlike the automobile industry, is characterized by much slower production but has certain features of interest. Producers of aircraft components and machinery manufacture on demand, in a model between workshop and project. They are highly dependent on demand and the raw materials must be of high quality, meet marked standards (ISO 9000 is the most used and the one required in the case study below) and in large quantities.
In this section we want to talk about a study that investigates how a company in the aerospace sector applies the methodology step by step. Therefore, it does not focus on a specific risk, but rather on the methodology and proposals for various risks. The interview-based study carried out by (Sinha, Whitman, & Malzahn, 2004) describes the SCRM process. The author highlights that in additional interviews with other companies related to this industry they face similar risks and that the methodology and findings of this study can be extrapolated to other companies.
Firstly, as a description of the company, the so-called Supp-Aero company, manufactured parts and components for aircraft, specialized in machined parts. As first-level clients, large aircraft production/assembly companies such as Boeing, Raytheon or Cessna stand out; and a large number of suppliers due to the diversity of raw materials and materials, adding up to 35. The negotiating power of Porter's forces is very low both upstream and downstream. It is, therefore, a relatively short but very wide SC. This does not guarantee, however, that it has parallel paths. For some materials such as aluminium, the supplier is unique and common to other competing Supp-Aero companies. The demand for aluminium and the monopoly of a company mean that either the raw materials do not arrive on time and there is a delay, even the loss of a customer, or that the price to be paid by priority is very high. The main objective is to manufacture high quality parts in the shortest time and with the requirements ordered on demand and on time. The culture of the organization focuses on a technical team and employees with high capacities, experience and training, so that they add value to the chain and specific knowledge.
Below are the steps of the SCRM process for this company outlined.
1. Risk identification: in this case they worked with the brainstorming method. During a brainstorming session involving members of multidisciplinary teams, a list of possible risks related to both suppliers and customers, and both external and internal, was generated. The brainstorming procedure is clear and described in the previous chapter. With all the ideas that emerged, a compilation and selection of ideas was made to identify those relevant and unique risks (not redundant or that meant the same as other ideas, although expressed differently).
2. Risk analysis: later these risks were also grouped according to the application areas, so that the subsequent risk treatment is easier and thus identify in which areas they affect and the possible consequences. The second classification is according to the perception of risk. This has to do with the culture and risk perception of managers, executives and employees. Those that can be measured and evaluated quantitatively were divided into foreseen risks (Sage & White, 1980); and at perceived risk, those who do not have tangible, measurable data or arguments to support the risk, are simply beliefs, experiences and speculations. The most relevant results of these two steps are collected in Table 5.5, where various detected risks are grouped.

References
103
3. Risk evaluation: first, a group of experts measured each of the risks and gave a score on a qualitative three-level scale according to the high, medium or low impact. Mainly subjective measures were used by members of the work teams for severity and probability to perform the FMEA. An RPN was calculated with a representative sample of these values to prioritize risks. On the other hand, to determine the strategy, they were divided according to whether they were controllable or not, those who are external being understood as not controllable.
4. Action planning: in the same way, through a directed brainstorming session, various proposals for solutions to risks were collected. Evaluated by experts and according to their feasibility and costs, the most appropriate were chosen. An example of the measures is shown in Table 5.6 for new risks.
5. Implementation: Implementation was conceived as a smooth, staggered transition process to face resistance to change. Also, the employees responsible for carrying out the implementation were trained and specialized for each task.
6. Control and monitoring: the FMEA booklet are also used for control. In this company, where the bargaining power of the clients is high and it is manufactured according to the requirements of the demand, the processes and requirements to face the risks change equally (Whitman, Rogers, Johnson, & Huff, 1999). Therefore, it is necessary to continuously evaluate the variations. Otherwise, the measurements may be insufficient or become obsolete.
Table 5.5 Risks for aerospace industry
Standards Supplier Technology Practices
Perceived risks
(1) Fluctuation in lead-time
(2) Inaccuracy in forecasts
(3) Excessive expediting of deliveries
(4) Uncertainty in technology
(5) Risks with single sourcing
(6) Lack of collaboration
Foreseen risks
(7) Conflict in metrics utilized
(8) Lack of common terminology
(9) Conflict in clients (OEM) requirements
(10) Difference in communication standards
(11) Lack of raw material availability
(12) Failure to deliver on time
(13) Dependence on vendors
(14) Poor quality
(15) Lack of information transparency
(16) Lack of capability
(17) Competing on cost
(18) Risk with long-term contracts
(19) Risk with short-term contracts
(20) Excessive holding of inventory

Sectors of Application
104
(21) Reliance on serial engineering
Table 5.6 Example of strategic actions
Risk Actions
(6) Implement the best technology Good contract with customer Mass customization
(12) Effective maintenance
Visibility of demand to vendor
Have multiple vendor
Training
Proper company culture
(14) Select the right quality material
Add clauses to the contracts
Use correct quality programs
Training
Supplier assessment
5.2.3 Electronics field
Electronics has a great weight in society, 67.11% of the world population has a mobile phone or some electronic device (O'Dea, 2020). The production of these devices, although not as personalized as in the automotive industry, produces in large quantities and has to be in continuous development and research to compete technologically in the market. This advancement and urgency for innovation has increased in the last decade and there are many associated risks (Water, 2007). However, in this section we are going to consider a case that was a great disruption for some brands. The same risk will describe the actions of two companies: a case of success and another of failure, in this way the differences can be compared.
The case is known as the fire that changed the industry by (Mukherjee, 2008). A fire broke out at a Philips chip factory in Albuquerque on May 17, 2000 due to a lightning strike that struck a power line and spread to the Philips plant. This production plant manufactured chips for Nokia and Ericsson.
The SC in this case begins on the power line through the Philips plant and eventually affects Nokia and Ericsson. This is a clear example of how gravity increases or intensifies as risk is transmitted along the chain. For the electricity company, lightning can mean the temporary shortage of electricity for a small number of customers. In fact, electricity companies bear this type of risk in mind - as lightning is known to be electrically charged - and have action plans and protection measures. The Philips factory was the focus of the disruptive event, where the fire occurred. The fire itself lasted a short time thanks to the rapid action of the staff, who managed to reduce the fire in 10 minutes; and it did not seriously damage the entire production; in fact, 8 trays of silicone chips were lost, which, although they were destined to manufacture thousands of mobile phones, did not represent a high percentage of production. Ultimately, it was an adverse event, which would cost money, time, and resources, but not a complete bankruptcy.
However, the chips must be manufactured and maintained in a completely clean and sterilized zero contamination room. Smoke, ash, and water and firefighting foam penetrated that room

References
105
and contaminated chips that were stored. Greater production was then lost. In addition to having to completely decontaminate the room completely and replace damaged machinery and production. At this point, the impact could be considered much greater.
For their part, two manufacturers of mobile devices depended solely on Philips as a chip provider: Nokia and Ericsson. The responses of both were very different and represented a great decisive change for the future of both companies.
Immediately, thanks to continuous monitoring and control of incoming raw materials, they detected a disruption at the Nokia factory in Helsinki. At first instance Philips reported the fire and losses, approaching a one-week production stoppage and a delay in supply. However, from the experience of the managers at Nokia, they took several measures. First, they had daily contact with Philips to find out the evolution and the real significance of the damage (Sheffi & Rice Jr, 2005). Thus, they were able to know in advance that the cleaning, recovery and return to normal work at Philips had been underestimated and were going to take longer. From this situation, the decisions they made were:
- Collaborate closely with the Philips workforce to speed up the recovery process. - Redesign chips and components that could be manufactured in other plants in order to
continue producing and reduce the demand for that Philips plant. - Find other suppliers that will cover the supply in this interruption time.
This allowed for much lower losses for both Philips and Nokia and reduced recovery time.
On the other hand, Ericsson did not detect any immediate variations, interpreting the interruption in the supply of chips as a setback or delay so it was not aware of the disruption until three days later when Philips informed its customers. At that time, the delay approximation was one week and Ericsson continued manufacturing with the available materials and had no further contact with Philips. Ericsson's production model was based on efficiency and cost reduction, which allowed it to be the largest Swedish company, but also made it more vulnerable with a single supplier. Neither its ability to detect disruption, nor communication with the supplier, nor the flexibility to adapt its products to other chips were present in its production model. When they realized that cleaning up and repair the damages would take longer, two weeks had passed since the fire took place and Ericsson was also facing a shortage of products. Finally, the Philips factory closed completely for an additional 4 weeks and took up to 6 months to manufacture at half capacity than before the disruption. By then, all chip production was committed to Nokia, which helped re-establish production and took active measures.
The result was the resurgence of Philips, sales compliance for Nokia and big losses for Ericsson. This last company reported losses of $ 1.7 billion and could not continue as its own brand. That experience, itself, was a great lesson for the future.
Table 5.7 shows a comparison of the three companies mentioned.
Table 5.6 Comparison of companies’ performance facing same disruptive event
Philips Nokia Ericsson
SC model • Focus on quality, producing in clean-room conditions
• Sole supplier • Supply chain
trouble-shooter
• Efficiency • Low costs

Sectors of Application
106
• Storage of chips to detected shifts and take rapid actions
• Fast delivery • Sole supplier
Negative effects • 8 trays of silicon wafers • Millions of chips
contaminated • Production stopped
• Lack of chips supply
• Production stopped
• Lack of chips supply
• Production stopped
Actions • Quick response extinguishing the fire
• Warn and inform customers
• Collaborate with clients to find other supplier sources
• Daily communications with the supplier
• Collaboration with the supplier to restore the production
• Beneficial contracts to engage the production
• Active search for other suppliers
• Keep producing until they ran out of chips
Recommended further actions
• Better estimation of the losses and recovery time
• Hermetic seals for the chips to avoid contamination
• Better insulation systems in the clean-room place
• Multi-source supplier
• Multi-source supplier
• Active communication
• Help with recovery process, being aware of the external SC performance
• Early risk detection system
Results • The disruption barely affected the sells
• Reinforcement on its SC and risk management
• $400 million losses directly for the disruption
• $1.7 billion losses that year
• Bankruptcy

Conclusion
107
6 Conclusion
Since the beginning, has been noticed that the supply chain is a complex interrelation between companies and processes that involves physical and human resources, and flows of money, information and materials. Considering that, this work pretends to be a compilation of the most studied strategies, trends and features of a supply chain within the risk management area, both for daily risks and exceptional ones.
This paper contains theory and practice cases from where can be concluded that a good supply chain risks management plan is a key piece for the success of a company. Summarizing, the supply chains are the spine of the industry, a required element in any company. The risk management does not only help to overcome stressful situation but makes a competitive advantage.
Learn from the own mistakes and also from the experience of others is the very best prove of strength and leads to success. It is not only about learning, but about knowing how to recover from those setbacks and continuously improve the performance of the supply chain. In this way, supply chains become more consistent and better cope with risks without losses.
Further research would be required for a deeper knowledge and regarding to new updates and changes. After the current year, new models and ways to understand the supply chain will show up because disruptive events cause abrupt changes. Therefore, this work tries to enlighten the importance for the companies to be more aware about the importance of a correct management of risks and build a resilient supply chain.


References
109
References
Aggarwal, P., & Ganeshan, R. (2007). Using risk-management tools on B2Bs: An exploratory investigation. International Journal of Production Economics, 108(1-2), 2-7.
Alukal, G., & Manos, A. (2006). Lean Kaizen: a simplified approach to process improvements. Quality Press.
Anthony, E. J. (1974). The syndromeof the psychologically invulnerablechild. En E. J. Anthony, & C. Koupernik, The child in his family: Children at psychiatric risk (págs. 201-230). New York: Wiley.
Aqlan, F., & Lam, S. S. (2015). A fuzzy-based integrated framework for supply chain risk assessment. International Journal of Production Economics, 161, 54-63.
Asbjørnslett, B. E. (2008). Assessing the Vulnerability of Supply Chains. En Z. G. A., & R. B., Supply Chain Risk: A Handbook of assessment, Management and Performance. (págs. 15-33). New York: Springer Science & Business Media.
Basole, R. C., & Nowak, M. (2018). Assimilation of tracking technology in the supply chain. Transportation Research Part E: Logistics and Transportation Review, 114, 350-370.
Bellinger, G., Castro, D., & Mills, A. (2004). Data, information, knowledge, and wisdom.
Ben-Daya, M., & Raouf, A. (1996). A Revised Failure Mode and Effect Analysis Model. International Journal of Quality & Reliability Management 13 (1), 43–47.
Berger, P. D., Gerstenfeld, A., & Zeng, A. Z. (2004). How many suppliers are best? A decision-analysis approach. Omega, 32(1), 9-15.
Betts, J. M., & Johnston, R. B. (2005). Betts, J. M., & Johnston, R. B. (2005). Just-in-time component replenishment decisions for assemble-to-order manufacturing under capital constraint and stochastic demand. International Journal of Production Economics, 95(1), 51-70.
Bidault, F., Despres, C., & Butler, C. (1998). New product development and early supplier involvement (ESI): the drivers of ESI adoption. International journal of technology management, 15(1-2), 49-69.
Blos, M. F., Quaddus, M., Wee, H. M., & Watanabe, K. (2009). Supply chain risk management (SCRM): a case study on the automotive and electronic industries in Brazil. Supply Chain Management: An International Journal, 14 (4), 247-252.
Boehm, B. (1989). Software risk management. European Software Engineering Conference (pp. 1-19). Berlin: Springer.
Borge, D. (2002). The book of risk. John Wiley & Sons.
Bowersox, D. J. (2002). Supply Chain Logistics Management. McGraw Hill.
Braithwaite, A., & Hall, D. (1999). Risky business? Critical decisions in supply chain management. Supply Chain Practice, 1(2), 40-55.

References
110
Bryson, J. M., & Alston, F. K. (2010). Creating and implementing your strategic plan: A workbook for public and nonprofit organizations. John Wiley & Sons.
Calantone, R., Garcia, R., & Dröge, C. (2003). The effects of environmental turbulence on new product development strategy planning. Journal of product innovation management, 20(2), 90-103.
Carey, J. (2002). Media use during a crisis. Prometheus, 20(3), 201-207.
Carlson, J. L. (2012). Resilience: Theory and Application. Argonne, IL: Argonne National Lab.
Carr, L. P., & Nanni Jr, A. J. (2009). Delivering results: managing what matters. Springer Science & Business Media.
Carvalho, H. (2012). Supply chain redesign for resilience using simulation. Computers & Industrial Engineering 62.1, 329-341.
Centers for control disease and protection. (25 de June de 2020). CDC. Obtenido de https://www.cdc.gov
Chapman, R. J. (1998). The effectiveness of working group risk identification and assessment techniques. International Journal of Project Management, 16(6), 333-343.
Chatterjee, P. (2004). Interfirm alliances in online retailing. Journal of Business Research, 57(7), 714-723.
Chen, D. Q., Preston, D. S., & Xia, W. (2013). Enhancing hospital supply chain performance: A relational view and empirical test. Journal of Operations Management, 31(6), 391-408.
Chewning, L. V., Lai, C. H., & Doerfel, M. L. (2013). Organizational resilience and using information and communication technologies to rebuild communication structures. Management Communication Quarterly, 27(2), 237-263.
Choi, T. (2007). Supplier-supplier relationships: why they matter. Supply Chain Management Review, 11 (5), 51-56.
Chopra, S., & Sodhi, M. S. (2004). Managing risk to avoid supply-chain breakdown. MIT Sloan Management review, fall edition, 53-61.
Chopra, S., & Sodhi, M. S. (2004). Managing risk to avoid supply-chain breakdown. Sloan Management Review, 46 (1), 53-61.
Christopher et al, M. (2002). Supply Chain Vulnerability. Cranfield, Bedford: School of Management, Certified University.
Christopher, M. (1998). Logistics and supply chain management: strategies for reducing costs and improving services. Financial Times Prentice Hall.
Christopher, M. (1999). Global logistics: the role of agility. Logistics and Transport Focus, 1(1).
Christopher, M. (2016). Logistics & supply chain management. Pearson UK.
Christopher, M., & Lee, H. (2004). Mitigating supply chain risk through improved confidence. International journal of physical distribution & logistics management, 34(5), 388–396.

References
111
Christopher, M., & Peck, H. (2003). Creating resilient supply chains: A practical guide. Cranfield: Cranfield University School of Management.
Christopher, M., & Peck, H. (2004). Building the resilient supply chain. International Journal of Logistics Management, Vol. 15, No. 2, pp1-13.
Christopher, M., & Peck, H. (2004). The five principles of supply chain resilience. Logistics Europe, 12, 16-21.
Christopher, M., & R Towill, D. (2002). Developing market specific supply chain strategies. The international journal of logistics management, 13(1), 1-14.
Christopher, M., Mena, C., Khan, O., & Yurt, O. (2011). Approaches to managing global sourcing risk. Supply Chain Management, 16(2), 67-81.
Cigolini, R., & Rossi, T. (2010). Managing operational risks along the oil supply chain. Production Planning and Control, 21(5), 452-467.
Clegg, S., & Porras, S. (2007). Encontrando sentido a la globalización en la teoría de la organización. Estudios organizacionales y asuntos globales, UAM, 133-169.
Computer Sciences Corporation. (2004). Global Survey of Supply Chain Progress. Waltham, MA: CSC.
Crockford, N. (1986). An introduction to risk management. Woodhead-Faulkner.
Crockford, N. (1986). An Introduction to Risk Management. Woodhead.
De Bono, E. (1983). Opportunities: A handbook of business opportunity search. Penguin Books.
Decker, H., & van Goor, A. (1998). Applying activity-based costing to supply chain management. Proceedings of the 1998 Logistics Research Network Conference. Cranfield University.
Dekkers, R., Kühnle, H., Durowoju, O. A., Chan, H. K., & Wang, X. (2012). Entropy assessment of supply chain disruption. Journal of Manufacturing Technology Management, 23, 998-1014.
Deloach, J. (2000). Enterprise-wide risk management: Strategies for linking risk and opportunity. London: Financial Times, Prentice Hall.
Deming, W. E., & Edwards, D. W. (1982). Quality, productivity, and competitive position. Cambridge, MA: Massachusetts Institute of Technology, Center for advanced engineering study.
Diaz, A., Gento, A. M., & Marrero, F. (2018). Tools for risk management in supply chains: a review of literature. Direccion y organizacion, 64, 5-35.
Dietrich, D. M., & Cudney, E. A. (2011). Methods and considerations for the development of emerging manufacturing technologies into a global aerospace supply chain. International Journal of Production Research, 49(10), 2819-2831.
Doran, G. T. (1981). There’sa SMART way to write management’s goals and objectives. Management review, 70(11), 35-36.
Drucker, P. F. (1962). The economy’s dark continent. Fortune, 65(103), 265-270.

References
112
Dutton, W., & Nainoa, F. (2003). The social dynamics of wireless on September 11: reconfiguring access. Crisis Communication, 69-82.
Elder, G. H. (1986). Military times and turning points in men's lives. Developmental psychology, 22 (2), 233.
Ellram, L. M. (1996). The use of the case study method in logistics research. Journal of business logistics, 17(2), 93.
Esper, T., Clifford Defee, C., & Mentzer, J. (2010). A framework of supply chain orientation. The International Journal of Logistics Management, 21 (2), 161– 179.
Evans, B., & Powell, M. (2000). Synergistic thinking: a pragmatic view of ‘lean’ and ‘agile’. Logistics and Transport Focus, 2 (10), 26–32.
Faisal, M. N., Banwet, D. K., & Shankar, R. (2006). Mapping supply chains on risk and customer sensitivity dimensions. Industrial Management & Data Systems, 106(6), 878-895.
Farris, M. T., & Hutchison, P. D. (2002). Cash-to-cash: the new supply chain management metric. International journal of physical distribution & logistics management, 32(4), 288-298.
Feagin, J. R., Orum, A. M., & Sjoberg, G. (1991). A case for the case study. UNC Press Books.
Feenstra, R. C., & Hanson, G. H. (1996). Globalization, outsourcing, and wage inequality. American Economic Review, 86 (2), 240-245.
Flinchbaugh, J. (1998). Implementing lean manufacturing through factory design. Massachusetts Institute of Technology, 1998.
Fraser, B. (2003). Managing risk proactively. Strategic Finance, 84 (10), 36–40.
Fynes, B., de Búrca, S., & Voss, C. (2005). Supply chain relationship quality, the competitive environment and performance. International Journal of Production Research, 43(16), 3303-3320.
Gardner, J. T., & Cooper, M. C. (2003). Strategic supply chain mapping approaches. Journal of business logistics, 24(2), 37-64.
Garvey, P. R., & Lansdowne, Z. F. (1998). Garvey, P. R., & Lansdowne, Z. F. (1998). Risk matrix: an approach for identifying, assessing, and ranking program risks. Air Force Journal of Logistics, 22(1), 18-21.
Gasmi, A., Noor, S., Tippairote, T., Dadar, M., Menzel, A., & Bjørklund, G. (2020). Individual risk management strategy and potential therapeutic options for the COVID-19 pandemic. Clinical Immunology, 215.
George, E. P., Hunter, J. S., Hunter, W. G., Bins, R., Kirlin IV, K., & Carroll, D. (2005). Statistics for experimenters: design, innovation, and discovery. New York: Wiley.
Giegengack, R., & Bordeaux, Y. (2009). Information networks in the history of life. . En P. R. Kleindorfer, The Network Challenge: Strategy, Profit, and Risk in an Interlinked World (págs. 105-123). New Jersey: Wharton School Publishing.
Goldratt, E. M., & Cox, J. (2016). The goal: a process of ongoing improvement. 3rd edition. Routledge.

References
113
Graham, B. B. (2004). Detail process charting: speaking the language of process. John Wiley & Sons.
Haksöz, Ç. (2018). Risk intelligent supply chains: How leading Turkish companies thrive in the age of fragility. CRC Press.
Hamilton, G. (1996). Risk management 2000. Studentlitteratur.
Harland, C., Brenchley, R., & Walker, H. (2003). Risk in supply networks. Journal of Purchasing and Supply Management 9 (1), 51–62.
Harland, C., Brenchley, R., & Walker, H. (2003). Risk in supply networks. Journal of Purchasing and Supply management, 9(2), 51-62.
Harrington, L. (1996). Untapped savings abound. Industry Week, 245(14), 53-56.
Hill, G. V. (1994). Assessing the cost of customer service. Logistics and Distribution Planning, 25-35.
Ho, W., Zheng, T., Yildiz, H., & Talluri, S. (2015). Supply chain risk management: a literature review. International Journal of Production Research, 53(16), 5031-5069.
Horne, J. F., & Orr, J. E. (1998). Assessing behaviors that create resilient organizations. Employment relations today, 24(4), 29-39.
Hsu, L.-L., & Chen, M. (2004). Impacts of ERP systems on the integrated-interaction performance of manufacturing and marketing. Industrial Management & Data Systems, 104(1), 42-55.
Institute of Logistics. (1998). Members’ Directory. Institute of Logistics and Transport.
International Organization for Standardization. (2018). Risk management — Guidelines to use ISO 31000. Obtenido de https://www.iso.org/obp/ui#iso:std:iso:31000:ed-2:v1:en
Ishikawa, K. (1968). Guide to quality control. Tokyo: Asian Productivity Organization.
Jüttner, U. (2005). Supply chain risk management. International Journal of Logistics Management, 16 (1), 120–141.
Jacobs, F. R., Chase, R. B., & Aquilano, N. J. (2004). Operations management for competitive advantage. Boston: Mc-Graw Hill.
Jakob, F. (1977). Evolution and tinkering. Science 196, 1161–1166.
Johnson, M. E. (2001). Learning from toys: Lessons in managing supply chain risk from the toy industry. California management review, 43(3), 106-124.
Jonas, O. B. (2013). Pandemic risk. . Washington, DC: World Bank.
Kache, F., & Seuring, S. (2017). Challenges and opportunities of digital information at the intersection of big data analytics and supply chain management. International Journal of Operations & Production Management, 37 (1), 10-36.
Kaplan, S. (1997). The words of risk analysis. Risk analysis, 17(4), 407-417.
References
114
Kelle, P., Woosley, J., & Schneider, H. (2012). Pharmaceutical supply chain specifics and inventory solutions for a hospital case. Operations Research for Health Care, 1(2-3), 54-63.
Kirby, L. D., & Fraser, M. W. (1997). Risk and resilience in childhood.(pp. 10–33). NASW Press.
Kleindorfer, P. R., & Saad, G. H. (2005). Managing disruption risks in supply chains. Production and operations management, 14(1), 53-68.
Knemeyer, A., Zinn, W., & Eroglu, C. (2009). Proactive planning for catastrophic events in supply chains. Journal of Operations Management, 27 (2), 141–153.
Laeequddin, M., Sardana, G. D., Sahay, B. S., Waheed, K. A., & Sahay, V. (2009). Supply chain partners' trust building process through risk evaluation: the perspectives of UAE packaged food industry. Supply Chain Management: An International Journal ,14(4), 280-290.
Lawless, J. (26 de April de 1998). Challenges of going global. Sunday Times.
Lee, H., & Billington, C. (1993). Material management in decentralized supply chains. Operations Research, 41(5), 835–847.
Lester, T. (2002). Inside Track: Making It Safe To Rely on a Single Partner. Financial Times, 7.
Linstone, H. A., & Turoff, M. (1975). The delphi method. Reading, MA: Addison-Wesley.
Lonsdale, C. (1999). Effectively managing vertical supply relationships: a risk management model for outsourcing. Supply chain management: An international journal, 4(4), 176-183.
Marin, D., & Verdier, T. (2003). Globalization and the new enterprise. Journal of the European Economic Association, 1(2-3), 337-344.
Mark, G., & Semaan, B. (2008). Resilience in collaboration: Technology as a resource for new patterns of action. Proceedings of the 2008 CSCW conference., 137-146.
Marvel, J. H., & Standridge, C. R. (2009). Simulation-enhanced lean design process. Journal of Industrial Engineering and Management 2.1, 90-113.
McDermott, R., Mikulak, R. J., & Beauregard, M. (1996). The basics of FMEA. SteinerBooks.
McDonough, W., & Braungart, M. (2002). Remaking the way we make things: Cradle to cradle. New York: New York: North Point Press.
Mentzer, J. (2001). Supply Chain Management, SAGE. Thousand Oaks.
Merriam-Webster. (11 de May de 2020). Merriam-Webster Dictionary. Obtenido de https://www.merriam-webster.com/dictionary/resilience
Merriam-Webster. (11 de May de 2020). Merriam-Webster dictionary. Obtenido de https://www.merriam-webster.com/dictionary/capability
Meulbroek, L. (2000). Total strategies for company-wide risk control. Financial Times, 9, 1-4.
Miles, R. E., & Snow, C. C. (1992). Causes of failure in network organizations. California management review, 34(4), 53-72.

References
115
Military, U. S. (1949). Procedure for performing a failure mode effect and criticality analysis. United States military procedure MIL-P-1629.
Mooney, C. Z. (1997). Monte carlo simulation (Vol. 116). Sage publications.
Mukherjee, A. S. (2008). The fire that changed an industry: a case study on thriving in a networked world. Financial Times, 1(1), 10-12.
Myerson, P. (2012). Lean supply chain and logistics management. New York, NY: McGraw-Hill.
Nakamoto, M. (1997). Fire Hits Parts Supply Network at Toyota. Financial Times, 34.
Narasimhan, R., & Talluri, S. (2009). Perspectives on risk management in supply chains. Journal of Operations Management, 27(2), 114-118.
Naser, W. N., Ingrassia, P. L., Aladhrae, S., & Abdulraheem, W. A. (2018). A study of hospital disaster preparedness in South Yemen. Prehospital and disaster medicine, 33(2), 133-139.
National Research Council. (2010). Sustaining global surveillance and response to emerging zoonotic diseases. National Academies Press.
O'Dea, S. (27 de June de 2020). Statista. Obtenido de https://www.statista.com/statistics/330695/number-of-smartphone-users-worldwide/
Orlikowski, W. J. (2000). Using technology and constituting structures: A practice lens for studying technology in organizations. Organization science, 11(4), 404-428.
O'sullivan, A., & Sheffrin, S. M. (2007). Prentice Hall Economics: Principles in Action. Pearson/Prentice Hall.
Pareto, V. (1964). Cours d'économie politique (Vol. 1). Geneva: Librairie Droz.
Pavnaskar, S. J., Gershenson, J. K., & Jambekar., A. B. (2003). Classification scheme for lean manufacturing tools. International Journal of Production Research 41 (13), 3075-3090.
Peck, H. (2004). Resilience: surviving the unthinkable. Logistics Manager, 16–18.
Peck, H. (2010). Supply chain vulnerability, risk and resilience. Global Logistics: New Directions in Supply Chain Management, 192-207.
Perry, D. C., Taylor, M., & Doerfel, M. L. (2003). Internet-based communication in crisis management. Management communication quarterly, 17(2), 206-232.
Pettit, T. J., Fiksel, J., & Croxton, K. L. (2010). Ensuring supply chain resilience: development of a conceptual framework. Journal of business logistics, 31, 1-21.
Pinedo, M. (2010). Operational control in asset management: Processes and costs. . SimCorp StrategyLab.
Plomin, R., & Bergeman, C. S. (1991). The nature of nurture: Genetic influence on “environmental” measures. Behavioral and brain sciences, 14, 373-386.
Poirier, C. C. (2006). Survey of supply chain progress: still waiting for the breakthrough. Supply Chain Management Review, 10(8), 18-26.

References
116
Porter, M. E. (1979). The structure within industries and companies' performance. The review of economics and statistics, 214-227.
Porter, M. E. (1985). Competitive Advantage: Creating and Sustaining Superior Performance. New York: Free Press.
Poundstone, W. (1993). Prisoner's Dilemma/John Von Neumann, game theory and the puzzle of the bomb. New York: Anchor.
Project Management Institute. (2000). A guide to the project management body of knowledge (PMBOK guide). Project Management Institute.
Rausand, M. (2005). Preliminary hazard analysis. Trondheim: Norwegian University of Science and Technology.
Rawlinson, J. G. (2017). Creative thinking and brainstorming. Routledge.
Reason, J. (1990). Human error. Cambridge: Cambridge university press.
Renn, O. (1998). The role of risk perception for risk management. Reliability Engineering & System Safety, 59(1), 49-62.
Rice, J. B., & Caniato, F. (2003). Building a secure and resilient supply network. Supply chain management review, 7(5), 22-30.
Royal Society Study Group. (1992). Risk: analysis, perception and management. London: The Royal Society.
Rutter, M. (1987). Psychosocial resilience and protective mechanisms. American journal of orthopsychiatry, 57(3), 316-331.
Rutter, M. (1993). Resilience: Some Conceptual Considerations. Journal of adolescent health, 626-631.
Rutter, M. (2013). Annual Research Review: Resilience - clinical implications. The journal of child psychology and psychiatry, 474-487.
Saaty, T. L. (1978). Exploring the interface between hierarchies, multiple objectives and fuzzy sets. Fuzzy sets and systems, 1(1), 57-68.
Sage, A. P., & White, E. B. (1980). Methodologies for risk and hazard assessment: a survey and status report. IEEE Transactions on Systems, Man, and Cybernetics, 10(8), 425-446.
Saunders, M., Lewis, P., & Thornhill, A. (2009). Research methods for business students. Pearson education.
Schwarz, L. B., & Weng, Z. K. (2000). The design of a JIT supply chain: The effect of leadtime uncertainty on safety stock. Journal of Business Logistics, 21(2), 231-253.
Serrat, O. (2017). The five whys technique. In Knowledge solutions, 307-310.
Shah, R., & Ward, P. T. (2003). Lean manufacturing: context, practice bundles, and performance. Journal of operations management, 21(2), 129-149.
Shapiro, R. D., & Heskett, J. L. (1985). Logistics strategy: cases and concepts. West Group.

References
117
Sheffi, Y. (2005). The resilient enterprise: overcoming vulnerability for competitive advantage. MIT Press Books 1.
Sheffi, Y., & Rice Jr, J. B. (2005). A supply chain view of the resilient enterprise. MIT Sloan management review, 47(1), 41.
Simons, R. (1999). How risky is your company? Harvard Business Review 77 (3), 85–95.
Singhal, T. (2020). A review of coronavirus disease-2019 (COVID-19). The Indian Journal of Pediatrics, 1-6.
Sinha, P. R., Whitman, L. E., & Malzahn, D. (2004). Methodology to mitigate supplier risk in an aerospace supply chain. Supply Chain Management: an international journal, 9 (2), 154-168.
Sitkin, S. B., & Pablo, A. L. (1992). Reconceptualizing the determinants of risk behavior. Academy of management review 17(1), 9-38.
Sjoberg, G., Williams, N., Vaughan, T., & Sjoberg, A. (1991). The case study approach in social research. 1991). A case for case study, 27-79.
Småros, J., Lehtonen, J. M., Appelqvist, P., & Holmström, J. (2003). The Impact of Increasing Demand Visibility on Production and Inventory Control Efficiency. International Journal of Physical Distribution & Logistics Management, 33, 336– 354.
Stevenson, M., & Spring, M. (2007). Flexibility from a supply chain perspective: definition and review. International journal of operations & production management, 27(7), 685-713.
Stewart, G. T., Richey, R. G., Kolluru, R., & Smith, M. (2009). (2009). Leveraging public-private partnerships to improve community resilience in times of disaster. International Journal of Physical Distribution & Logistics Management, 39(5), 343–364.
Stoltz, P. G. (2004). Building resilience for uncertain times. Leader to Leader, 2004(31), 16-20.
Sukdeo, N. (2017). The application of 6S methodology as a lean improvement tool in an ink manufacturing company. IEEE International Conference, (págs. 1666-1671)).
Sutcliffe, K. M., & Vogus, T. J. (2003). Organizing for resilience. En K. S. Cameron, J. E. Dutton, & R. E. Quinn, Positive organizational scholarship: Foundations of a new discipline. (págs. 94-110). San Francisco: Berrett-Koehler.
Sutton, J., Palen, L., & Shklovski, I. (2008). Backchannels on the front lines: Emergent uses of social media in the 2007 California wildfires. Proceedings of the 5th Conference on ISCRAM. Washington D.C.
Suwanruji, P., & Silvanus, T. E. (2004). Evaluating the performance of supply chain simulations with tradeoffs between multiple objectives. Winter Simulation Conference, Vol. 2, (pp. 338-342). Washington, DC.
Swaminathan, J. M., & Tomlin, B. (2007). How to avoid the risk management pitfalls. Supply Chain Management Review, 11(5), 34-42.
Talluri, S., Cetin, K., & Gardner, A. J. (2004). Integrating Demand and Supply Variability into Safety Stock Evaluations. International Journal of Physical Distribution & Logistics Management, 34, 62–69.

References
118
Tang, C. S. (2006). Perspectives in supply chain risk management. International journal of production economics, 103(2), 451-488.
Teng, S. H., & Ho, S. Y. (1996). Failure mode and effects analysis. International journal of quality & reliability management, 13, 8-26.
Tierney, K., & Bruneau, M. (2007). Conceptualizing and measuring resilience: A key to disaster loss reduction. TR news, 250, 14-17.
Tohamy, N. (2009). Can Indian parlay its IT services success into manufacturing outsourcing? Boston, MA.: Supply Chain Technologies and Services, AMR Research.
Trkman, P., & McCormack, K. (2009). Supply chain risk in turbulent environments: A conceptual model for managing supply chain network risk. International Journal of Production Economics, 119(2), 247-258.
Tsai, M. C., Liao, C. H., & Han, C. S. (2008). Risk perception on logistics outsourcing of retail chains: model development and empirical verification in Taiwan. Supply Chain Management: An International Journal, 13, 415–424.
Tse, Y. K., & Tan, K. H. (2011). Managing product quality risk in a multi-tier global supply chain. International Journal of Production Research, 49(1), 139-158.
Uthayakumar, R., & Priyan, S. (2013). Pharmaceutical supply chain and inventory management strategies: Optimization for a pharmaceutical company and a hospital. Operations Research for Health Care, 2(3), 52-64.
Valla, J. (1982). The Concept of Risk in Industrial Buying Behaviour. Workshop on Organisational Buying Behaviour. Brussels: European Institute for Advanced Studies in Management.
Vasvári, T. (2015). Risk, risk perception, risk management–a review of the literature. Public Finance Quarterly, 60(1), 29-48.
Viscusi, W. K. (1998). Rational Risk Policy: The 1996 Arne Ryde Memorial Lectures (Vol. 4). Oxford: Oxford University Press.
Viswanadham, N., & Raghavan, N. S. (1997). Flexibility in manufacturing enterprises. Sadhana, 22(2), 135-163.
Walker, B., & Salt, D. (2012). Resilience thinking: sustaining ecosystems and people in a changing world. Island press.
Waller, M. A. (2001). Resilience in ecosystemic context: Evolution of the concept. American journal of orthopsychiatry, 71(3), 290-297.
Wang, G., Gunasekaran, A., Ngai, E. W., & Papadopoulos, T. (2016). Big data analytics in logistics and supply chain management: Certain investigations for research and applications. International Journal of Production Economics, 176, 98-110.
Wang, R. Y., & Strong, D. M. (1996). Beyond accuracy: What data quality means to data consumers. Journal of management information systems, 12(4), 5-33.
Water, D. (2007). Supply chain risk management: vulnerability and resilience in logistics. Kogan Page Publishers.

References
119
Waters, D., & Waters, C. D. (2008). Quantitative methods for business. Pearson Education.
Weick, K. E. (1993). The collapse of sensemaking in organizations: The Mann Gulch disaster. Administrative science quarterly, 628-652.
Weick, K. E., & Sutcliffe, K. M. (2011). Managing the unexpected: Resilient performance in an age of uncertainty. John Wiley & Sons.
Werner, E. E., & Smith, R. (1982). Vulnerable but invincible: A study of resilient children. New York: McGraw-Hill.
Whitman, L., Rogers, K. J., Johnson, M., & Huff, B. L. (1999). Understanding the supply chain impact of a manufacturing process change. Portland International Conference on Management of Engineering and Technology.
Wilson, M. C. (2007). The impact of transportation disruptions on supply chain performance. Transportation Research Part E: Logistics and Transportation Review, 43(4), 295-320.
Wilson, R. H. (1934). A scientific routine for stock control. Harvard: Harvard University.
Womack, J. P., & Jones, D. T. (1996). Beyond Toyota: how to root out waste and pursue perfection. Harvard business review, 74(5), 140-172.
Woods, D., & Wreathall, J. (2003). Managing risk proactively: The emergence of resilience engineering. Ohio: Columbus: Ohio University.
Woosley, J. M. (2009). Improving healthcare supply chains and decision making in the management of pharmaceuticals. Lousiana: Louisiana State University.
World Bank. (December). Connecting Sectors and Systems for Health Results. Public Health Policy Note.
Wu, D., & Olson, D. L. (2008). Supply chain risk, simulation, and vendor selection. International journal of production economics, 114(2), 646-655.
Wu, F., Yeniyurt, S., Kim, D., & Cavusgil, S. T. (2006). The impact of information technology on supply chain capabilities and firm performance: A resource-based view. Industrial Marketing Management, 35(4), 493-504.
Wu, T., Blackhurst, J., & Chidambaram, V. (2006). A model for inbound supply risk analysis. Computers in Industry, 57(4), 350-65.
Xie, C., Anumba, C. J., Lee, T. R., Tummala, R., & Schoenherr, T. (2011). Assessing and managing risks using the supply chain risk management process (SCRMP). Supply Chain Management: An International Journal, 474-483.
Yao, Y., Evers, P., & Dresner, M. (2007). Supply chain integration in vendor-managed inventory. Decision Support Systems, 43 (2), 663–674.
Yin, R. K. (2017). Case study research and applications: Design and methods. Sage publications.
Yu, W., Chavez, R., Jacobs, M. A., & Feng, M. (2018). Data-driven supply chain capabilities and performance: A resource-based view. Transportation Research Part E: logistics and transportation review, 114, 371-385.
References
120
Zhou, L., Vasconcelos, A., & Nunes, M. (2008). Supporting decision making in risk management through an evidence-based information systems project risk checklist. Information management & computer security, 16, 166-186.
Zsidisin, G. A. (2003). A grounded definition of supply risk. Journal of purchasing and supply management, 9(5-6), 217-224.
Zsidisin, G., Panelli, A., & Upton, R. (1999). Purchasing organization involvement in risk assessments, contingency plans, and risk management: an exploratory study. Supply Chain Management: An International Journal 5 (4),, 187–197.