supply chain risk mitigation in …chss.uonbi.ac.ke/sites/default/files/chss/osundwa final...
TRANSCRIPT
SUPPLY CHAIN RISK MITIGATION IN PHARMACEUTICAL
INDUSTRY IN KENYA
BY: SILAS FRANCIS OSUNDWA
D61/62862/2011
SUPERVISOR: MR. KONGERE
MODERATOR: DR. NJIHIA
A Management Research Project Submitted in Partial Fulfillment of the
Requirements for the award of the Degree of Master of Business
Administration (MBA), School of Business, University of Nairobi.
November, 2013

ii
DECLARATION
I hereby declare that this my original work and has not been submitted for presentation
and examination for any award of Degree in this university or any other university.
Signature ……………………………………………….. Date ………………………
Name: Silas Francis Osundwa
D61/62862/2011
Signature ……………………………………………….. Date…………………………
Supervisor: Tom Kongere
iii
ACKNOWLEDGEMENTS
I wish to acknowledge my sincere appreciation to the following people without whom
this research work would not have been successful. It may not be possible to mention all
by name but the following were singled out for their exceptional contributions. My
profound gratitude goes to my supervisor Mr. Tom Kongere, my moderator Dr. Njihia for
their commitment and personal interest in the progress of this study. Their wise counsels,
encouragement, patience, constructive and innumerable suggestions made this work
come to completion. They were true captains of this ship. I also thank very sincerely, the
chairman of Management Science department, Dr. Njihia who assigned to me the
supervisors and my boss Mr. Stephen Wood for planting the seed and encouraging me to
undertake this degree.
My gratitude goes to GlaxoSmithKline Nairobi for sponsorship. The sponsorship enabled
me to pursue the course. My heartfelt appreciation and indebtedness also goes to my
wife: Mrs Evelyn Kasoha for making my dream come true by offering me moral support
and maintaining the family during my postgraduate studies. I do not want to forget the
larger Osundwa family of Emabole village who had to do without my regular visits
during the duration of the study.
Finally I also like to thank my father, Harrison Osundwa who spent enormous resources
on education and for encouragement throughout the study.
iv
DEDICATION
This project is dedicated to the almighty God, Son and Holy Spirit for granting me the
academic journey mercies.

v
ABSTRACT Supply chain risk mitigation is important in any organisation to eliminate the possibility
of the risk occurring, shift a risk or outcome to a third party, reducing the impact of a
risk, reducing the probability of an event occurring and to establish contingency plans
that reduce the impact after an event occurs. Although a number of studies have been
done on the concept and context of supply chain, none has been done within the context
of Supply chain risk mitigation in pharmaceutical industry. The purpose of the study was
to determine supply chain risk mitigation adopted by pharmaceutical firms in Kenya. The
objectives of the study were to determine the supply chain risk mitigation by the
pharmaceutical firms in Kenya, identify challenges faced in adoption of this Supply chain
risk mitigations and to determine how pharmaceutical companies in Kenya overcome
challenges in implementing supply chain risk mitigation. The study used descriptive
design with the target population of study being all the pharmaceutical firms in Kenya.
From the findings, one can conclude the following based on the objectives of the study;
supply chain management processes in most pharmaceutical firms in Kenya are bad
because of lack of supply chain risk management leadership teams in place and lack of
computerized risk management system. However the safety management processes in
most pharmaceutical companies in Kenya is good according to the findings of the study.
The researcher recommended that pharmaceutical firms need to; have in place a supply
chain risk management leadership team and computerize their risk management systems.
Future research should be done to; determine impact of supply chain risks on the
financial performance of pharmaceutical organizations in Kenya, impact of supply chain
risks on product quality among pharmaceutical organizations in Kenya and Supply chain
risk mitigation on other fast moving consumer industry in Kenya
vi
TABLE OF CONTENTS
DECLARATION ................................................................................................................ ii
ACKNOWLEDGEMENTS............................................................................................... iii
DEDICATION................................................................................................................... iv
ABSTRACT........................................................................................................................ v
TABLE OF CONTENTS................................................................................................... vi
LIST OF TABLES............................................................................................................. ix
LIST OF FIGURES ............................................................................................................ x
LIST OF ABBREVIATIONS............................................................................................ xi
CHAPTER ONE: INTRODUCTION................................................................................. 1
1.1 Background to the study ............................................................................................... 1
1.1.1 Supply chain risk mitigation .................................................................................. 2
1.1.2 Pharmaceutical industry in Kenya ......................................................................... 4
1.2 Research Problem ......................................................................................................... 5
1.3 Research General Objective.......................................................................................... 7
1.3.1 Specific objectives ................................................................................................. 7
1.4 Value of the study ......................................................................................................... 7
1.4.1 The Pharmaceutical Companies............................................................................. 7
1.4.2 The regulatory bodies and Government................................................................. 8
1.4.3 Academic Researchers ........................................................................................... 8
CHAPTER TWO: LITERATURE REVIEW..................................................................... 9
2.1 Introduction................................................................................................................... 9
2.2 Supply chain risk mitigation: ........................................................................................ 9
2.2.1 Risk management process.................................................................................... 12

vii
2.2.2 Safety management.............................................................................................. 12
2.2.3 People................................................................................................................... 13
2.2.4 Production trade-offs ........................................................................................... 14
2.3 Supply chain risk mitigation challenges ..................................................................... 14
CHAPTER THREE: RESEARCH METHODOLOGY ................................................... 16
3.1 Introduction................................................................................................................. 16
3.2 Research Design.......................................................................................................... 16
3.3 Target Population........................................................................................................ 16
3.4 Sampling design.......................................................................................................... 17
3.5 Data Collection ........................................................................................................... 17
3.6 Data analysis ............................................................................................................... 18
CHAPTER FOUR: DATA ANALYSIS...........................................................................19
4.1 Introduction................................................................................................................. 19
4.2 General Information.................................................................................................... 19
4.2.1: Respondents’ Company by Name....................................................................... 20
4.2.2: Respondents Title ............................................................................................... 21
4.2.3: Respondents Departments................................................................................... 22
4.2.4 Gender of the Respondents .................................................................................. 23
4.2.5 Distribution of the Respondents by Age.............................................................. 24
4.2.6: Ownership of the Company ................................................................................ 25
4.2.7: Duration Worked in the Organization ................................................................ 25
4.3 Supply Chain Risk Management Process ................................................................... 27
4.4 Safety Management .................................................................................................... 32
viii
4.5: People Capability....................................................................................................... 38
4.6: Production tradeoffs................................................................................................... 41
4.7: Supply chain risk mitigation challenges .................................................................... 44
CHAPTER FIVE .............................................................................................................. 48
SUMMARY, CONCLUSION AND RECOMMENDATIONS....................................... 48
5.1 Introduction................................................................................................................. 48
5.2 Summary of Findings.................................................................................................. 48
5.3 Conclusion .................................................................................................................. 51
5.4 Recommendations....................................................................................................... 53
5.5 Limitation of the study................................................................................................ 55
5.6 Areas for Further Study .............................................................................................. 55
REFERENCES ................................................................................................................. 56
APPENDIX 1: COMPLIMENTARY LETTER TO THE RESPONDENTS................... 62
APPENDIX 2: LIST OF REGISTERED PHARMACEUTICAL COMPANIES IN
KENYA............................................................................................................................. 63
APPENDIX 3: QUESTIONNAIRE ................................................................................. 64
ix
LIST OF TABLES
Table 4.1: Name of company............................................................................................ 20
Table 4.2: Respondents title.............................................................................................. 21
Table 4.3: Respondents Departments ............................................................................... 22
Table 4.4 Gender of the Respondents ............................................................................... 23
Table 4.5: Age of Respondents......................................................................................... 24
Table 4.6: Ownership of the Company............................................................................. 25
Table 4.7: Duration Worked in the Organization ............................................................. 26
Table 4.8: A Crostabulation of Respondent Title and Years-Worked.............................. 27
Table 4.9: Mean, Median, Standard Deviations, and Percentiles ..................................... 28
Table 4.10: Percentages of Responses per Question ........................................................ 28
Table 4.11: Correlations.................................................................................................... 31
Table 4.12: Mean, Median, Standard Deviations, and Percentiles Statistic ..................... 33
Table 4.13: Percentages of Responses per Question (Question 9a-9r) ............................. 33
Table 4.14: Correlations.................................................................................................... 37
Table 4.15: Mean, Median, and Standard Deviations....................................................... 38
Table 4.16: Percentages of Responses per Question (Question 10a-9i) ........................... 38
Table 4.17: Correlation ..................................................................................................... 40
Table 4.18: Mean, Median, Mode, and Standard Deviation............................................ 41
Table 4.19: Percentages of Responses per Question (Question 11a-i) ............................. 42
Table 4.20: Correlation ..................................................................................................... 43
Table 4.21: Mean, Median, Mode, and Standard Deviation............................................. 44
Table 4.22: Response on supply chain risk mitigation challenges ................................... 47
x
LIST OF FIGURES
Figure 4.1: Gender of Respondents…………………………………………………23
Figure 4.2: A Geographical Presentation of Respondent by age……………………24
Figure 4.3: Duration Worked ……………………………………………………….26

xi
LIST OF ABBREVIATIONS
SCM Supply Chain Management
KPI Kenya Performance Indicators
GSK GlaxoSmithKline
OTC Over the Counter
S&OP Sales and Operation planning
FMEA Failure modes and effects analysis
VAT Value added Tax
IDF Imported declaration form
WHO World health Organization
SPSS Statistical Package for Social Sciences
STP Situation target proposal
OHS Occupational health and safety IT Information technology MNC’s Multinational corporations

1
CHAPTER ONE: INTRODUCTION 1.1 Background to the study
The impact of supply chain disruptions on company performance has increased over the
past few years (Hendricks & Singhal, 2005). Single sourcing (Hendricks & Singhal,
2005), low inventories (Craighead, Blackhurst, Rungtusanatham, & Handfield, 2007),
increased product complexity (Hendricks & Singhal, 2005) and a growing importance of
purchasing as a value creation function (Zsidisin, Panelli, & Upton, 2000) allow only
little margin for errors in this function and leave many supply chains highly vulnerable.
At the same time, global organizations face an increasingly unstable environment in
many of their markets (Manuj & Mentzer, 2008a; Wagner & Bode, 2008).
With more vulnerable supply chains on one hand and more dynamics and complexity in a
globalized world on the other hand, disruptions hit supply chains more often and with
much worse impact on the continuity of production (Barry, 2004). The negative
consequences are immense when risks are poorly managed or remain undetected
(Hendricks & Singhal, 2003). As firms continue focusing on market and financial
performance, little efforts are being made on the area of supply chain risk mitigation
which has great impact to achieve seamless supply chain. Managing risks in the modern
environment is becoming increasingly challenging (Christopher & Lee, 2004), primarily
because of uncertainties in supply and demand, global outsourcing and short product life
cycles.
2
1.1.1 Supply chain risk mitigation
Supply chain risk mitigation is about reducing the impact of a risk in supply chain
(Chakravarty, 2013). Kleindorfer and Saad (2005) argue that prevention is better than
cure, requiring risk managers to act fast and treat urgent risks first. However, fast action
can only be achieved when managers prioritize risk management activities and
understand risk management as one of their core management tasks. Supply chain risk
mitigation activities aim to reduce the probability of risk occurrences and reduce the
negative impact of an occurred risk (Tomlin, 2006). Supply chain risks can, for example,
be reduced by buffer inventories, information technologies, effective relationships with
suppliers and downstream customers, involvement of alternative or multiple suppliers,
risk pooling, and the conduct of “what if ’ analyses (Choi,2007; Choi and Krause, 2006;
Chopra and Sodhi, 2004; Cook, 2007; Mentzer et al., 2006; Stalk, 2006; Swaminathan
and Tomlin, 2007).
Chakravarty (2013) suggested that the aftermath of the March 2011 earthquake and
tsunami in Japan resulted to many manufacturers around the world suddenly discovering
how exposed their operations were to unanticipated interruption in their supply chains.
The hidden risk is that just-in-time supply chains often depend upon suppliers being
located closely to an assembly facility. So when regional disasters like the Japanese
earthquake strike, there’s a greater likelihood that a number of co-located companies –
perhaps the suppliers of their supplier –are all likely to be disrupted. In the opposite
situation, when suppliers are located in widely separated facilities scattered around the
world, the risk of transportation interruption in the event of a local calamity becomes of

3
paramount concern. Damaged chokepoints such as bridges, harbours and airports can halt
the flow of goods despite thoughtful contingency planning. But even logistics systems
with multiple redundancies can be rendered helpless by unexpected catastrophes such as
the 2010 Icelandic volcano, which spewed clouds of ash that halted air travel across
much of the North Atlantic.
Chakravarty (2013) identified four supply chain risk mitigation strategies which include
risk management, safety management, people and production trade-offs. On risk
management, he suggested at highest level companies must deploy risk management
processes and systems that make visible risks and proposed remediation of risk. These
identified risks should include external events and internal events for both supply and
distribution chains. Construction of an integrated software-based simulation model that
considers the consequences of interruptions to even small components of the value chain
will provide an ongoing capability for identifying risk in addition to the costs and benefits
of mitigation. On safety management, the safety problems that can interrupt business
exist in multiple suppliers and suppliers to suppliers. Information about safety
management practices that pose high risk of production interruption need to be reviewed
and documented, often by third parties. Concerning people, organizations should review
the people incentives, skills and knowledge within the organization to ensure that risk is
understood by employees, and that decisions and practices that increase risk are revealed
and discouraged. Finally on production trade-offs, explicitly modelling and managing the
trade-offs between key logistic variables can lead to superior supply chain performance.
These variables include duplication/redundancy, cost, capacity, inventory, lead time,
customer service level and product portfolio complexity.

4
According to Hahn (2000) effective communication and coordination among all elements
of the supply chain are essential to its success. Increasing the visibility of demand
information across supply chain reduces the risks (Chopra & Sodhi, 2004). Henriott
(1999) stated information sharing as a prerequisite for trust and current models for SCM
agree that the sharing of business information is a crucial element, which binds supply
chains together from end-to-end (Zhenxin, Yan, & Cheng, 2001; Schary & Skjøtt-Larsen,
2001). (Cachon & Fisher, 2000) and Lee et al. (2000) have analyzed the benefits of
sharing real-time information on demands and/or inventory levels between suppliers and
customers. In studies by Lee et al. (1997a, b) it was concluded that information sharing
can significantly minimize the consequences of the bullwhip effect. The bullwhip effect
occurs when the demand order variabilities in the supply chain are amplified as they
moved up the supply chain. Distorted information from one end of a supply chain to the
other can lead to tremendous inefficiencies (Hau, Padmanabhan, & Seungjin, 1997).
Further Lee and Whang (2000) suggested that information is a basic enabler for tight
coordination in a supply chain. Agility in the supply chain can as well help mitigate
supply chain risk. Agility is the ability to thrive in a continuously changing, unpredictable
business environment (Prater et al., 2001). According to Giunipero and Eltantawy
(2004), organizations are moving to adopt closer relationships with key suppliers in order
to mitigate supply chain risk.
1.1.2 Pharmaceutical industry in Kenya
A study conducted by Kalunda, Nduku, & Kabiru (2012) revealed that a pharmaceutical
company is a commercial business licensed to research, develop, market and/or distribute

5
drugs, most commonly in the context of healthcare. They deal in generic and/or brand
medications. There are 46 companies (See Appendix 1) listed as registered
pharmaceutical companies in Kenya (pharmacy and poisons board, 2012). The key
players in the industry in Kenya include multinational corporations (MNC’s) like
GlaxoSmithKline, Bayer, Aventis, Pfizer while key local establishments include Dawa
Pharmaceuticals Ltd, Cosmos Pharmaceuticals. The pharmaceutical industry consists of
three segments namely the manufacturers, distributors and retailers (Export Processing
Zones Authority– Kenya, 2005). They support the country’s health sector, which is
estimated to have about 8,006 health institutions countrywide (Kenya National Bureau of
Statistics, 2012). The industry compounds and packages medicines, repacking formulated
drugs and processing bulk drugs into doses. The bulk of locally manufactured
preparations are non-sterile, over-the counter (OTC) products. Kenya exported
pharmaceutical products worth Kenya shillings 4,457 million in 2008 (Kenya National
Bureau of Statistics, 2009).
1.2 Research Problem
Supply chain risk mitigation includes the development as well as the evaluation of
diverse mitigation strategies towards their potential value and required investments
(Chopra et al., 2007; Kleindorfer and Saad, 2005; Manuj and Mentzer, 2008b; Wagner
and Bode, 2006). According to Vikram (2013), importance of supply chain risk
mitigation is to eliminate the possibility of the risk occurring, shift a risk or outcome to a
third party, reducing the impact of a risk, reducing the probability of an event occurring
and establish contingency plans that reduce the impact after an event occurs. Vikram

6
(2013) identified four supply chain risk mitigation which include risk management, safety
management, people capabilities in risk management and production trade-offs.
However, effective communication and coordination among all elements of the supply
chain are essential for the success of supply chain risk mitigation (Hahn, 2000).
Key challenges facing pharmaceutical industry in Kenya include; government taxes on
import declaration form, illegal trade, inadequate legal framework for pharmaceutical
quality control, lack of responsiveness to procurement of emergency medicine, increased
production costs and lack of proper distribution network for products throughout the
country (WHO, 2010). Other challenges include: growing influx of counterfeit and
substandard medicines, deterioration of infrastructure and even higher utility costs,
domestic political risk, adverse currency exchange rate and deteriorating terms of trade,
global financial crisis—leading to financial constraints, inflation and high costs (United
Nations Industrial Development Organization, 2010). Thus making a need to undertake
this study on supply chain risk mitigation in Kenya.
Pankaj, Larry and Don (2004) undertook an analysis to establish methodology to mitigate
supplier risk in an aerospace supply chains. In Kenya Simon Momanyi (2011) studied
strategies adopted in GlaxoSmithKline in managing outsourced services; Fredrick
Wafukho (2011) researched on effectiveness of lean sigma strategy on continuous
improvement at GlaxoSmithKline; Kalunda et al.(2012) focused on the Pharmaceutical
manufacturing companies in Kenya and their credit risk management practices; Guyo,
Gakure, & Mwangi (2011) reserached on factors contributing to the employee turnover at
7
Ranbaxy Laboratories limited. They have majorly focussed on other areas of supply
chain risk and performance improvement within supply chain. None of them focused on
supply chain risk mitigation in pharmaceutical industry in Kenyan. This is therefore a
clear indication of a research gap that exists that this study is currently addressing. This
study therefore tries to address the following question: What is the supply chain risk
mitigation in the pharmaceutical industry in Kenya?
1.3 Research General Objective
To determine supply chain risk mitigation in pharmaceutical firms.
1.3.1 Specific objectives
1. To determine the supply chain risk mitigation by the pharmaceutical firms in
Kenya
2. Identify challenges faced in adoption of this Supply chain risk mitigations
3. To determine how pharmaceutical companies in Kenya overcome challenges
in implementing supply chain risk mitigation.
1.4 Value of the study
Specifically, this study can benefit the following:-
1.4.1 The Pharmaceutical Companies
The study makes managerial contributions for players in the pharmaceutical industry, in
that it provides a basis for the various companies to better understand supply chain risk

8
mitigations and its challenges. It creates awareness in pharmaceutical industry on supply
chain risk mitigation thus help firms position themselves competitively.
1.4.2 The regulatory bodies and Government
The research findings can also aid in the improvement of the already formulated policies
and enforcement of the same in order to facilitate supply of quality and safe
pharmaceutical products to the public. It can also help the government in formulating
policies to mitigate supply chain risk in pharmaceutical industry in Kenya.
1.4.3 Academic Researchers
The study makes a significant contribution to the growing body of research on the supply
chain risk mitigation. The findings can also be used as a source of reference for other
researchers. In addition, other academic researchers can use the study findings to
stimulate further research in this area of supply chain risk mitigation in pharmaceutical
industry and as such, form a basis of good background for further researches.
The paper assists corporate supply chain managers in making management decisions on
supply chain risk mitigation.
9
CHAPTER TWO: LITERATURE REVIEW 2.1 Introduction
This chapter seeks to outline and discuss the risk mitigation in organizations with special
focus on those arising from Supply Chain. This chapter discusses supply chain risk
mitigation its variables which include risk management, safety, people capability and
production trade off. It also looks at challenges in supply chain risk mitigation.
2.2 Supply chain risk mitigation
Recent studies focusing on transportation delays and port stoppages (Chapman et al.,
2002), accidents and natural disasters (Cooke, 2002), poor communication, part shortages
and quality issues (Craighead et al., 2006), operational issues (Chopra & Sodhi, 2004),
labour disputes (Machalaba & Kim, 2002), and terrorism (Sheffi, 2001) have all
documented the negative impacts of disruptions on supply chain structures. These studies
have also illustrated the impact of frequent and/or severe disruptions on individual
corporate or overall supply chain performance levels.
Skipper and Hanna (2009) noted that management of a highly interconnected supply
chain is an ever-increasing challenge in today’s competitive business environment.
Higher levels of uncertainty in supply and demand, shorter technology and product life
cycles, globalization of the market, and the increased use of distribution, manufacturing,
and logistics partners all results in a complex international network. Given the
complexity of many supply chains, experiencing a disruption is recognized by many
organizations as being inevitable. In reality, it is not a matter of a supply chain system
10
encountering a problem, but rather a matter of when a problematic event will occur and
the severity of the event. As the levels of complexity increase and supply chain
interdependency becomes more prevalent, increased levels of risk occur (Christopher,
1992). Wagner and Bode (2008) suggested that managers pay particular attention to these
risks and have issued a call for empirical research into supply chain performance,
strategic choice, and the context of risk. While disruptions and heightened risk levels can
cause serious challenges, several studies, including Fawcett et al. (1996), Goldsby and
Stank (2000), Fredericks (2005), and Swafford et al. (2006) have found that organizations
characterized by higher levels of flexibility are more capable of responding to unexpected
events such as a disruption in a more successful manner when compared to their non-
flexible counterparts.
Supply chain flexibility acts as a measure of risk management to organizations facing
increased supply chain risk. Disruptions that impact the day-to-day operations of a given
member of the supply chain are likely to have an impact on other supply chain network
member organizations. Entities may not always be able to predict or avoid a disruption,
but they can reduce their risk exposure by enhancing flexibility through the
implementation of key strategic planning tools such as forecasting, conformance to plan,
sales and operation planning(S&OP), contingency planning. These strategic planning
tools can enhance the ability of the organization or network to respond to a disruption
effectively, minimizing the negative impacts of the event on overall supply chain
performance levels. Contingency planning is a valuable strategic planning tool for many
organizations that can bring about enhanced flexibility. Specifically, contingency

11
planning is a special type of planning that provides a blueprint for responding to the risks
associated with an unknown event (La Londe, 2005). A properly prepared contingency
plan should detail a timely and complete response to a specific risk or a cluster of risks
(La Londe, 2005).
The increased globalisation of supply chains and the prevalent use of sub-contract
manufacturing and offshore sourcing contribute to the length of time it takes to complete
all the needed steps in the process. Associated with pipeline length is the lack of visibility
within the pipeline. Visibility in supply chain is where important information is readily
available to those who need it, inside and outside the organization, for monitoring,
controlling and changing supply chain strategy and operations, from service acquisition
to delivery (Schoenthaler, 2003). Hence, it is often the case that one member of a supply
chain has no detailed knowledge of what goes on in other parts of the chain. The key to
improved supply chain visibility is shared information among supply chain members
(Mason-Jones and Towill, 1997, 1998).
In addition to visibility, supply chain confidence requires the ability to take control of
supply chain operations. There has been much interest in the six sigma methodology as a
way of reducing variability in processes (George, 2002). Six sigma tools such as control
charts and failure modes and effects analysis (FMEA) can be very helpful in identifying
the opportunities for reducing process variability in supply chains. However, these tools
and methodologies are primarily of benefit within the business for the control of

12
repetitive activities. In looking to improve control across the wider supply chain a more
collaborative approach to control is required
2.2.1 Risk management process
Supply chain risk management is relatively new and rapidly expanding discipline that is
transforming the way that manufacturing and non-manufacturing operations meet the
needs of their customers (Gunasekaran et al., 2004). Formulating an appropriate and
effective organizational strategy can to a certain extent mitigate supply chain risks
(Finch, 2004). At the highest level, companies must deploy risk management processes
and systems that make visible risks and proposed remediation of risk. These identified
risks should include external events and internal events for both supply and distribution
chains. Construction of an integrated software-based simulation model that considers the
consequences of interruptions to even small components of the value chain will provide
an ongoing capability for identifying risk in addition to the costs and benefits of
mitigation (Chakravarty, 2013).
2.2.2 Safety management
In a distributed supply chain, understanding the level of risk due to safety management is
complex. The safety problems that can interrupt business exist in multiple suppliers and
suppliers to suppliers. Information about safety management practices that pose high risk
of production interruption need to be reviewed and documented, often by third parties
(Vikram, 2013). He also noted that reviewing safety management practices may provide
critical insights into the risk of interruption from doing business with an external supplier

13
or from risks that exist internally within a vertically integrated company. Safety problems
can trigger expensive investigations. A pattern of safety incidents or employee deaths is
not only costly and unconscionable, it provides justification for legal suits and
governmental regulation (Vikram, 2013). To assess supply chain risk exposures, the
company must identify not only direct risks to its operations, but also the potential causes
or sources of those risks at every significant link along the supply chain (Norrman and
Jansson, 2004). It is also necessary that a company identify risk indicators in its processes
that enable the firm to measure risk in its supply chains (Zolkos, 2003b).
2.2.3 People
Lack of trust is one of the major factors that contribute to supply chain risks (Sinha et al.,
2004). Lengnick-Hall (1998) argued that trust, developed through effective
communication, can create resources that lead to a competitive advantage. Trust among
people is an expectation that partners will not act in an opportunistic manner even if there
are short-term incentives to do so (Chiles and McMackin, 1996) and can contribute
significantly to the long-term stability of an organization and its supply chain (Spekman
et al., 1998). According to Vikram (2013), organizations should review people incentives,
skills and knowledge within the organization to ensure that risk is understood by
employees, and that decisions and practices that increase risk are revealed and
discouraged. Creating a culture where managers are both accountable for risk and
remunerated for risk management decisions is a requirement for success.

14
2.2.4 Production trade-offs
Explicitly modelling and managing the trade-offs between key logistic variables can lead
to superior supply chain performance. These variables include duplication/redundancy,
cost, capacity, inventory, lead time, customer service level and product portfolio
complexity (Vikram, 2013). A trade off is where an increased cost in one area is more
than offset by a cost reduction in another, so that the whole system benefits (Lysons &
Farrington, 2006).
2.3 Supply chain risk mitigation challenges
In Kenya, pharmaceutical importers are faced with a challenge as import Declaration
Fees (IDF) are levied and amount to indirect tax on pharmaceuticals (WHO, 2010). Duty
and Value added Tax (VAT) are also applicable to some packaging materials for
pharmaceuticals, which affect the final price (WHO, 2010). Studies by Kalunda et al.
(2012) identified pharmaceutical industry in Kenya as very competitive and is
characterised by price wars. Managing supply chains in today’s competitive world is
increasingly challenging. The greater the uncertainties in supply and demand, shorter and
shorter product and technology life cycles, increased use of manufacturing, distribution
and logistics partners, have led to higher exposure to risks in the supply chain
(Christopher et al., 2002). The closure of the US air space after the terrorist event of
September 11, 2001 is an example of event that paralysed supply chain flows. It has also
been suggested that the drive towards more efficient supply chains during recent years
has resulted in the supply chains becoming more vulnerable to disruption (Christopher
and Lee, 2004; McGillivray, 2000; Engardio, 2001). Studies carried out on transportation
15
delays and port stoppages (Chapman et al.,2002), accidents and natural disasters (Cooke,
2002), poor communication, part shortages and quality issues (Craighead et al., 2006),
operational issues (Chopra and Sodhi, 2004), labor disputes (Machalaba and Kim, 2002),
and terrorism (Sheffi, 2001) have all documented potentially negative impacts of
disruptions on various supply chain structures in nearly every industry. These studies
have also illustrated the impact of frequent and/or severe disruptions on individual
corporate or overall supply chain performance levels.

16
CHAPTER THREE: RESEARCH METHODOLOGY
3.1 Introduction
This chapter outlines the research methodology that was used in the study and has the
following structure: research design, target population, sample design, data collection
procedures, instruments, and the data analysis methods applied in the study.
3.2 Research Design
The study was a descriptive design. According to Uma Sekaran (2003), a descriptive
study is undertaken in order to ascertain and be able to describe the characteristics of the
variables of interest. Some empirical studies have employed the use of descriptive design
in survey studies. Wairegi (2009) used descriptive design in a survey of the influence of
competitive strategies on performance of oil firms in Kenya, while Wamiori (2009) used
the design to study Survey of pricing studies adopted by manufacturers of Fast Moving
Consumer Goods in Mombasa District and its environs. This study aimed at determining
supply chain risk mitigation in pharmaceutical industry in Kenya.
3.3 Target Population
The target population of study was all the pharmaceutical firms in Kenya. However, the
population of study was limited to pharmaceutical firms registered in Kenya, whose
number stood at 46 as at December 2012, See Appendix 2.

17
3.4 Sampling design
The subject of the study was limited to Supply Chain Managers working in the various
pharmaceutical firms in Kenya. The study was based on the assumption that these are the
officers with knowledge of the supply chain risk mitigation and were best placed to offer
valuable information to the study. A census of 46 companies was undertaken, involving
one supply chain manager in each of the 46 pharmaceutical firms in Kenya. A self-
administered questionnaire was considered for the study.
3.5 Data Collection
Both the primary data and the secondary data were collected. Primary data was collected
by personally delivering semi-structured questionnaire to Supply chain managers in the
pharmaceutical firms in appendix 2, personally delivered to them. This enabled the
researcher to get clarifications where necessary. The questionnaire consisted of both open
and close ended questions relevant to the study. The questionnaire was divided into three
sections. Section A containing aspects of bio data of the company, second sections (B to
E) containing questions on supply chain risk mitigation by the companies, and third
section F containing questions on challenges that influence their adoption of supply chain
risk mitigation (see Appendix 3).
Validity is the extent to which a test measures what we actually wish to measure (Cooper
& Schindler, 2008). Validity was measured by seeking expert opinions and carrying out
pilot study. Marczyk et.al (2005) observed that pilot test is the start phase in data
gathering of the research process. The researcher undertook a pilot survey to pre test the
validity and reliability of the questionnaire. This was done by administering the

18
questionnaire to three employees who were not part of the sample population. The
questionnaires were then adjusted accordingly for consistency, clarity and relevance.
3.6 Data analysis
Responses in the questionnaires were tabulated, coded, and processed by use of a
computer. The data was edited for consistency and completeness, coded, and classified so
as to present the results of the data analysis in a systematic and clear way. Data was
analyzed with the help of the Statistical Package for Social Sciences (SPSS) version 20.
Data analysis was based on research questions designed at the beginning of the research.
Descriptive statistics was used to analyze the data, including measures of central
tendency, measures of dispersion and inferential statistics. Scatter diagrams were used to
show if the relationships are linear. According to Mugenda and Mugenda (1999),
descriptive statistics enable meaningful description of a distribution of scores or measures
using statistics. The results of the study were compared with literature review to establish
the supply chain risk mitigation in the pharmaceutical industry in Kenya.
19
CHAPTER FOUR: DATA ANALYSIS
4.1 Introduction
This chapter presents analysis and findings of the study, which sought to determine the
supply chain risk mitigation, adopted by pharmaceutical companies in Kenya and further
establish the challenges faced in adopting the supply chain risk mitigation. Data was
collected from forty-six (46) managers involved in supply chain management roles in
Pharmaceutical firms in Kenya. Out of the forty-six (46) managers who were sampled
and the questionnaire administered, only thirty-seven (37) responded. This gave a
response rate of 80.43%, which is an adequate representation of the study population. The
collected data was presented in form of tables, figures, and charts. The analysis was
based on the objectives of the study namely: to determine the supply chain risk mitigation
by the pharmaceutical firms in Kenya; to identify challenges faced in adoption of this
Supply chain risk mitigations; and to determine how pharmaceutical companies in Kenya
overcome challenges in implementing supply chain risk mitigation.
4.2 Findings
In order to capture the general information of the respondents’ issues such as name of the
organization, respondent title, respondent department, gender, age, company ownership
and duration of work was captured in the first section of the questionnaire. This was
important because it enhanced reliability and gave the basic understanding of the
respondents.
20
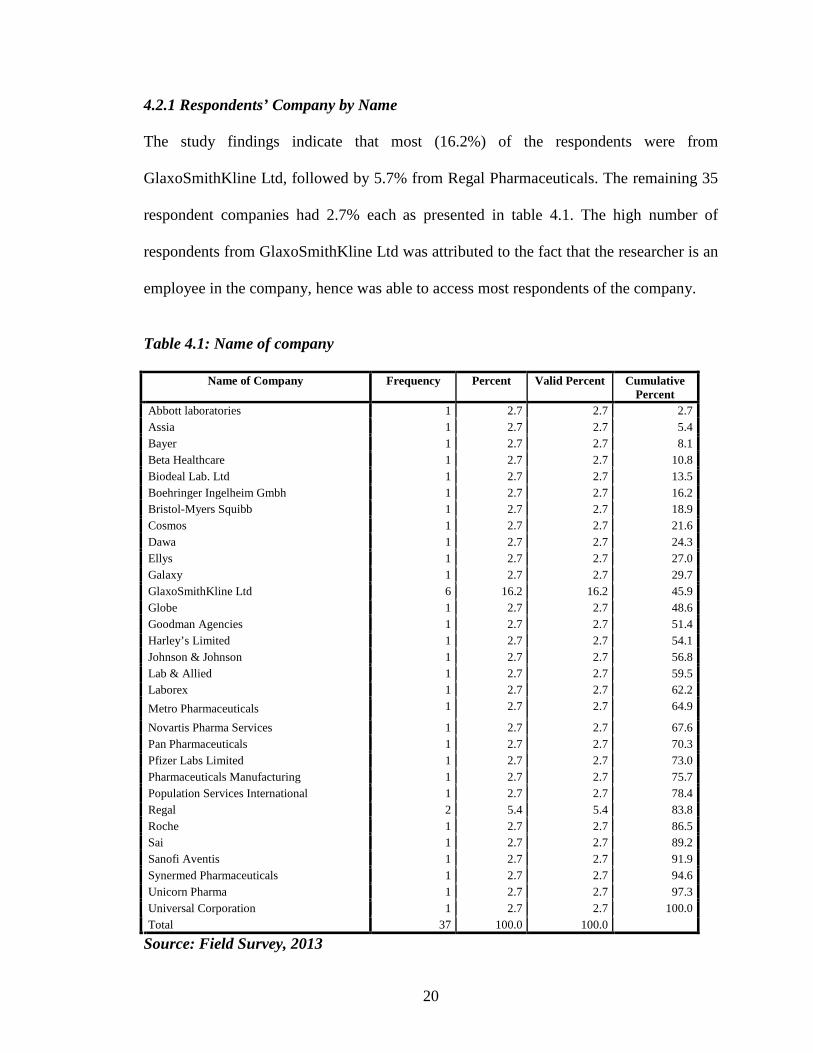
4.2.1 Respondents’ Company by Name The study findings indicate that most (16.2%) of the respondents were from
GlaxoSmithKline Ltd, followed by 5.7% from Regal Pharmaceuticals. The remaining 35
respondent companies had 2.7% each as presented in table 4.1. The high number of
respondents from GlaxoSmithKline Ltd was attributed to the fact that the researcher is an
employee in the company, hence was able to access most respondents of the company.
Table 4.1: Name of company
Name of Company Frequency Percent Valid Percent Cumulative Percent
Abbott laboratories 1 2.7 2.7 2.7 Assia 1 2.7 2.7 5.4 Bayer 1 2.7 2.7 8.1 Beta Healthcare 1 2.7 2.7 10.8 Biodeal Lab. Ltd 1 2.7 2.7 13.5 Boehringer Ingelheim Gmbh 1 2.7 2.7 16.2 Bristol-Myers Squibb 1 2.7 2.7 18.9 Cosmos 1 2.7 2.7 21.6 Dawa 1 2.7 2.7 24.3 Ellys 1 2.7 2.7 27.0 Galaxy 1 2.7 2.7 29.7 GlaxoSmithKline Ltd 6 16.2 16.2 45.9 Globe 1 2.7 2.7 48.6 Goodman Agencies 1 2.7 2.7 51.4 Harley’s Limited 1 2.7 2.7 54.1 Johnson & Johnson 1 2.7 2.7 56.8 Lab & Allied 1 2.7 2.7 59.5 Laborex 1 2.7 2.7 62.2
Metro Pharmaceuticals 1 2.7 2.7 64.9
Novartis Pharma Services 1 2.7 2.7 67.6 Pan Pharmaceuticals 1 2.7 2.7 70.3 Pfizer Labs Limited 1 2.7 2.7 73.0 Pharmaceuticals Manufacturing 1 2.7 2.7 75.7 Population Services International 1 2.7 2.7 78.4 Regal 2 5.4 5.4 83.8 Roche 1 2.7 2.7 86.5 Sai 1 2.7 2.7 89.2 Sanofi Aventis 1 2.7 2.7 91.9 Synermed Pharmaceuticals 1 2.7 2.7 94.6 Unicorn Pharma 1 2.7 2.7 97.3 Universal Corporation 1 2.7 2.7 100.0 Total 37 100.0 100.0
Source: Field Survey, 2013

21
4.2.2: Respondents Title
The findings of the study indicate that most of the respondents (27.0%) were pharmacists.
As shown in table 4.2, 16.2% were head of supply chain and quality and compliance
each; quality assurance managers were 8.1%, and supervisor, directors, heads of
production, site director, and logistics heads were 5.4% each. Purchasing officers and
executive officers were 2.7% each. Respondents who were heads of supply chain
departments were mainly from large pharmaceutical organizations. This was because the
supply chain departments in the large organizations were well established, with clear
roles and responsibilities. In most small organizations, managers/heads of other
departments also took care of the day-to-day running of the supply chain departments of
their respective organizations. See figure 4.2 for a graphical representation of respondents
by title.
Table 4.2: Respondents title
Respondents Title Frequency Percent Valid Percent
Cumulative Percent
Quality and Compliance 6 16.2 16.2 16.2 Director 2 5.4 5.4 21.6 Head Production 2 5.4 5.4 27.0 Head of Supply Chain 6 16.2 16.2 43.2 QA Manager 3 8.1 8.1 51.4 Pharmacist 10 27.0 27.0 78.4 Supervisor 2 5.4 5.4 83.8 Site Director 2 5.4 5.4 89.2 Logistics 2 5.4 5.4 94.6 Purchasing Officer 1 2.7 2.7 97.3 Executive 1 2.7 2.7 100.0
Total 37 100.0 100.0
Source: Source: Field Survey, 2013

22
4.2.3: Respondents Departments
According to the study findings, most of the respondents (25.7%) were from Quality
Assurance and Regulatory Departments each. As shown in table 4.3, those from GMS
and Supply Chain & Logistics were 17.1% each, followed by Production Department at
11.4% and Purchasing Department at 2.9% (see figure 4.3 for a graphical representation
of the findings). Most of the respondents from Supply Chain & Logistics Department
were mainly from larger pharmaceutical companies. In most smaller organizations, the
study found that heads of other departments such as Quality Assurance, Regulatory,
GMS, Production, and Purchasing also assumed supply chain management roles. In some
smaller organizations, supervisors were directly involved in the day-to-day management
of supply chain management processes of their respective organizations.
Table 4.3: Respondents Departments
Name of Department Frequency Percent Valid Percent
Cumulative Percent
GMS 6 16.2 17.1 17.1 Quality Assurance 9 24.3 25.7 42.9 Regulatory 9 24.3 25.7 68.6 Production 4 10.8 11.4 80.0 Supply Chain & Logistics
6 16.2 17.1 97.1
Purchasing 1 2.7 2.9 100.0
Total 35 94.6 100.0 System 2 5.4 Total 37 100.0
Source: Source: Field Survey, 2013

23
4.2.4 Gender of the Respondents
Table 4.4 and figure 4.1 show that majority of the respondents (75.7%) were males and
24.3% were females. The high percentage of male respondents is attributed to the fact
that males assume most of the supply chain management roles in the pharmaceutical
industry compared to their female counterparts.
Table 4.4 Gender of the Respondents
Gender
Frequency Percent Valid Percent Cumulative Percent
Male 28 75.7 75.7 75.7
Female 9 24.3 24.3 100.0
Total 37 100.0 100.0
Source: Source: Field Survey, 2013
Figure 4.1: Gender of Respondents
Source: Field Survey, 2013

24
4.2.5 Distribution of the Respondents by Age
The respondents were asked to indicate their age bracket from options that had been
provided on the questionnaire. The results were as presented in the table 4.5 and Figure
4.2.
Table 4.5: Age of Respondents Frequency Percent Valid Percent Cumulative
Percent
26-35 21 56.8 56.8 56.8
36-45 8 21.6 21.6 78.4 46-55 8 21.6 21.6 100.0
Total 37 100.0 100.0
Source: Field Survey, 2013
Figure 4.2: A Geographical Presentation of Respondents by Age
Source: Field Survey, 2013.
As shown in table 4.5 and figure 4.2, majority of the respondents (56.8%) were aged
between 26-35 years, while 21.6% were between 36-45 and 46-55 years of age each. This
study therefore establishes that majority of the supply chain management departmental
heads in pharmaceutical companies fall within the 26-35 age brackets. This is considered
25
by most pharmaceutical organizations as a prime age that possesses the requisite supply
chain management knowledge and skills, and is capable of understanding the risks
associated with supply chain processes within the pharmaceutical industry, a view that is
corroborated by Vikram (2013). According to Vikram (2013), there is need for
organizations to review the skills and knowledge of their employees with a view of
ensuring that they (the employees) have the effective understanding of the risks attributed
to supply chain management processes.
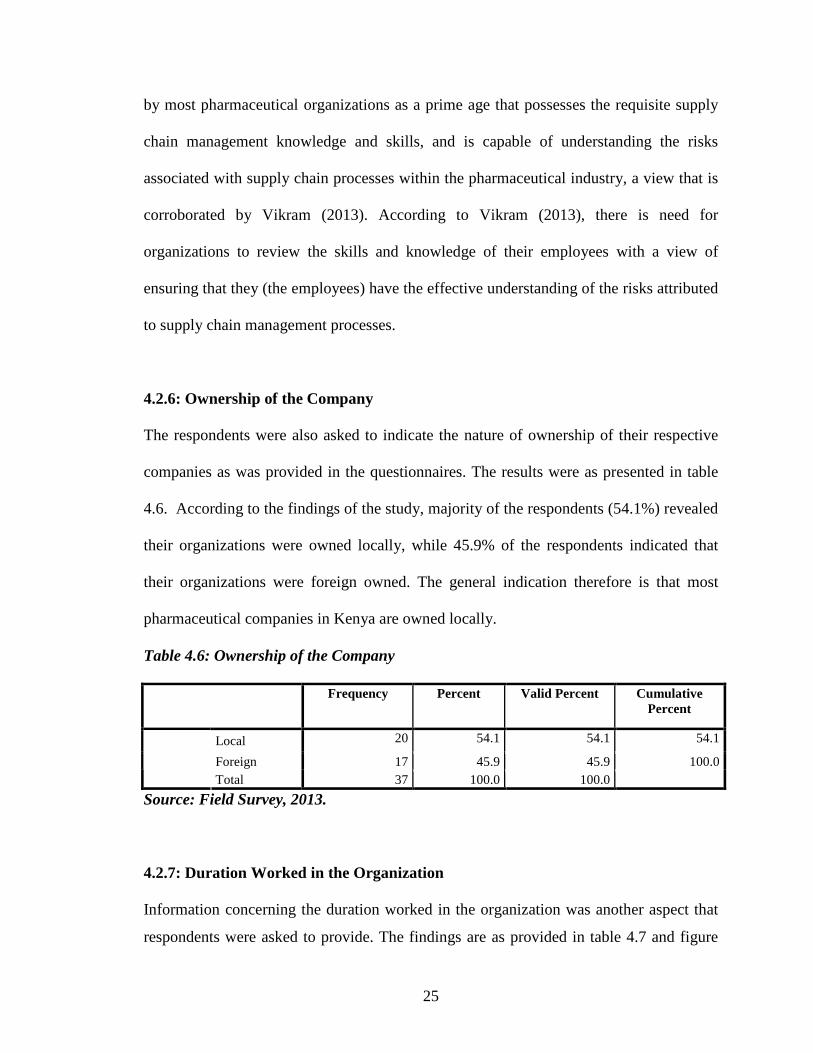
4.2.6: Ownership of the Company
The respondents were also asked to indicate the nature of ownership of their respective
companies as was provided in the questionnaires. The results were as presented in table
4.6. According to the findings of the study, majority of the respondents (54.1%) revealed
their organizations were owned locally, while 45.9% of the respondents indicated that
their organizations were foreign owned. The general indication therefore is that most
pharmaceutical companies in Kenya are owned locally.
Table 4.6: Ownership of the Company
Frequency Percent Valid Percent Cumulative Percent
Local 20 54.1 54.1 54.1
Foreign 17 45.9 45.9 100.0
Total 37 100.0 100.0
Source: Field Survey, 2013.
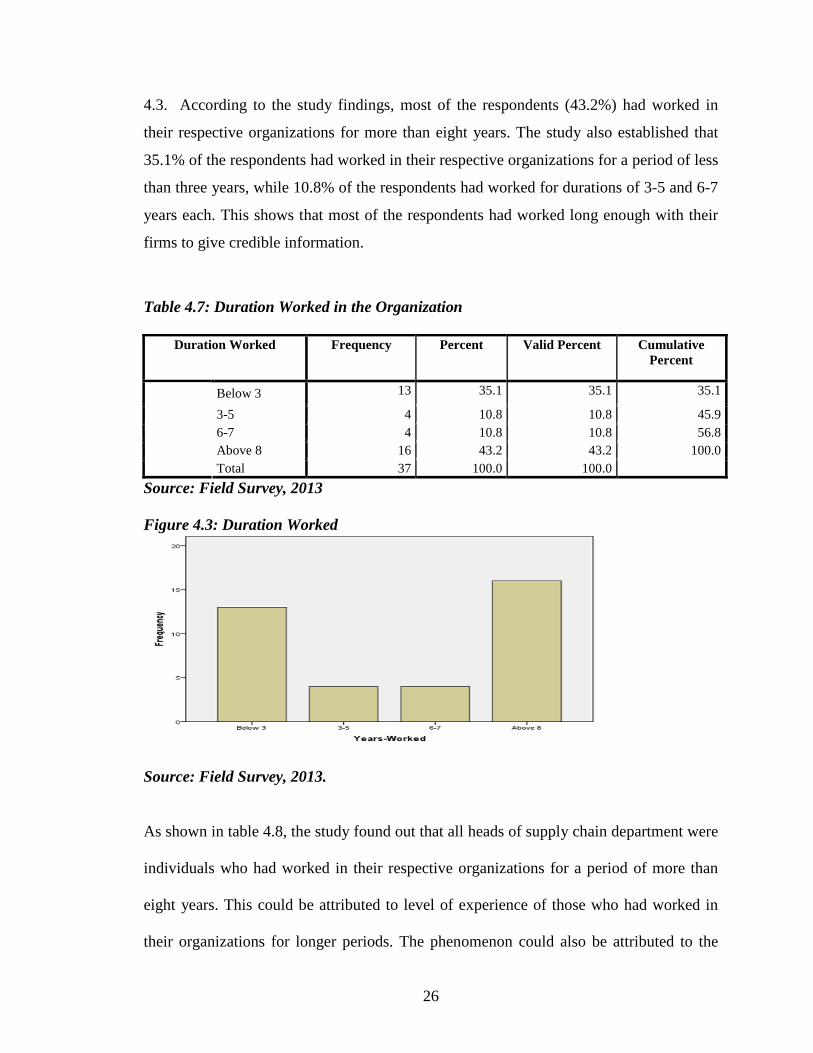
4.2.7: Duration Worked in the Organization
Information concerning the duration worked in the organization was another aspect that
respondents were asked to provide. The findings are as provided in table 4.7 and figure
26
4.3. According to the study findings, most of the respondents (43.2%) had worked in
their respective organizations for more than eight years. The study also established that
35.1% of the respondents had worked in their respective organizations for a period of less
than three years, while 10.8% of the respondents had worked for durations of 3-5 and 6-7
years each. This shows that most of the respondents had worked long enough with their
firms to give credible information.
Table 4.7: Duration Worked in the Organization
Duration Worked Frequency Percent Valid Percent Cumulative Percent
Below 3 13 35.1 35.1 35.1
3-5 4 10.8 10.8 45.9 6-7 4 10.8 10.8 56.8 Above 8 16 43.2 43.2 100.0
Total 37 100.0 100.0
Source: Field Survey, 2013
Figure 4.3: Duration Worked
Source: Field Survey, 2013.
As shown in table 4.8, the study found out that all heads of supply chain department were
individuals who had worked in their respective organizations for a period of more than
eight years. This could be attributed to level of experience of those who had worked in
their organizations for longer periods. The phenomenon could also be attributed to the

27
level of trust between the employees and the company. Sinha et al. (2004) point out that
lack of trust is one of the major factors that contribute to supply chain risks. According to
Lengnick-Hall (1998), trust between an organization and its employees can create
resources that lead to a competitive advantage. Spekman et al. (1998) observe that trust
between an organization and its employees can contribute significantly to the long-term
stability of an organization and its supply chain.
Table 4.8: A Crostabulation of Respondent Title and Years-Worked
Years-Worked Respondent Title Below 3 3-5 6-7 Above 8
Total
Quality and Compliance
0 2 0 4 6
Director 0 2 0 0 2 Head Production 0 0 0 2 2 Head of Supply Chain
0 0 0 6 6
QA Manager 3 0 0 0 3 Pharmacist 8 0 0 2 10 Supervisor 0 0 2 0 2 Site Director 0 0 0 2 2 Logistics 0 0 2 0 2 Purchasing Officer 1 0 0 0 1
Executive 1 0 0 0 1 Total 13 4 4 16 37
Source: Field Survey, 2013.
4.3 Supply Chain Risk Management Process
Under this section, the study sought to explore the supply chain risk management process
within the pharmaceutical organizations under study. The findings were as presented in
the subsequent sub-sections. Table 4.9 presents the mean, median, mode, standard
deviations, and percentiles for the questions that the respondents were asked under this
section.
28
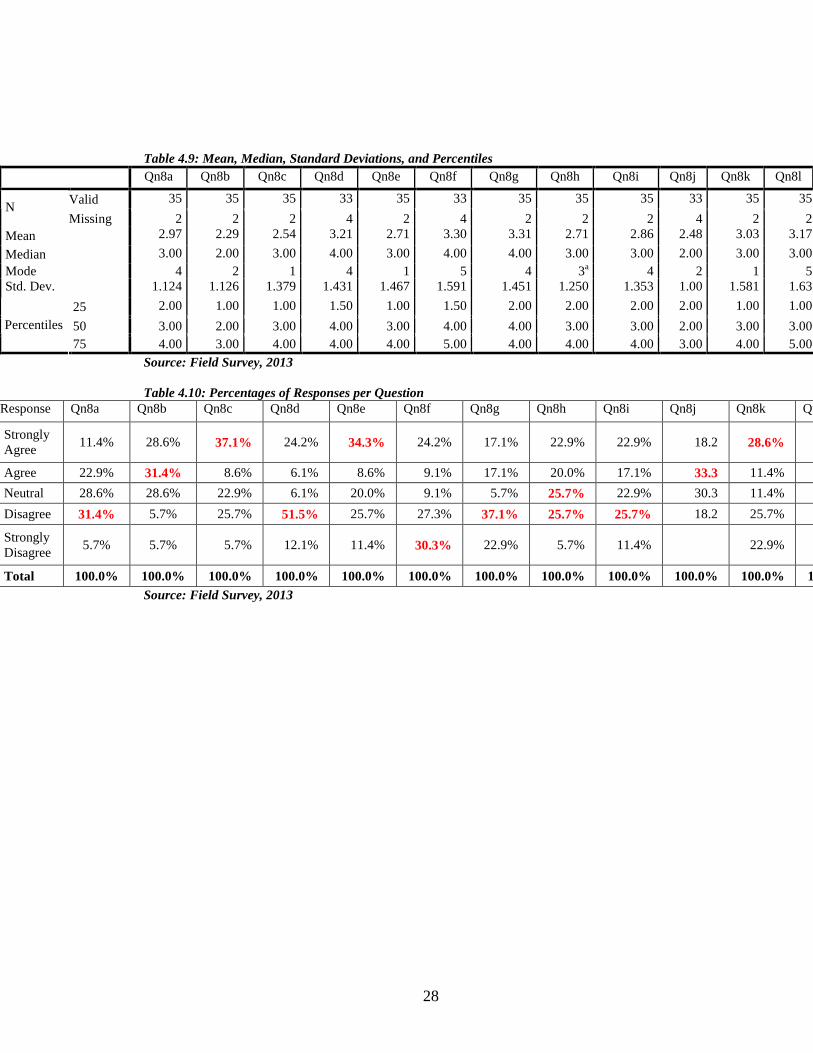
Table 4.9: Mean, Median, Standard Deviations, and Percentiles Qn8a Qn8b Qn8c Qn8d Qn8e Qn8f Qn8g Qn8h Qn8i Qn8j Qn8k Qn8l
Valid 35 35 35 33 35 33 35 35 35 33 35 35 N
Missing 2 2 2 4 2 4 2 2 2 4 2 2 Mean 2.97 2.29 2.54 3.21 2.71 3.30 3.31 2.71 2.86 2.48 3.03 3.17
Median 3.00 2.00 3.00 4.00 3.00 4.00 4.00 3.00 3.00 2.00 3.00 3.00 Mode 4 2 1 4 1 5 4 3a 4 2 1 5 Std. Dev. 1.124 1.126 1.379 1.431 1.467 1.591 1.451 1.250 1.353 1.00 1.581 1.63
25 2.00 1.00 1.00 1.50 1.00 1.50 2.00 2.00 2.00 2.00 1.00 1.00
50 3.00 2.00 3.00 4.00 3.00 4.00 4.00 3.00 3.00 2.00 3.00 3.00 Percentiles
75 4.00 3.00 4.00 4.00 4.00 5.00 4.00 4.00 4.00 3.00 4.00 5.00 Source: Field Survey, 2013 Table 4.10: Percentages of Responses per Question
Response Qn8a Qn8b Qn8c Qn8d Qn8e Qn8f Qn8g Qn8h Qn8i Qn8j Qn8k Qn8l
Strongly Agree
11.4% 28.6% 37.1% 24.2% 34.3% 24.2% 17.1% 22.9% 22.9% 18.2 28.6%
Agree 22.9% 31.4% 8.6% 6.1% 8.6% 9.1% 17.1% 20.0% 17.1% 33.3 11.4%
Neutral 28.6% 28.6% 22.9% 6.1% 20.0% 9.1% 5.7% 25.7% 22.9% 30.3 11.4%
Disagree 31.4% 5.7% 25.7% 51.5% 25.7% 27.3% 37.1% 25.7% 25.7% 18.2 25.7%
Strongly Disagree
5.7% 5.7% 5.7% 12.1% 11.4% 30.3% 22.9% 5.7% 11.4% 22.9%
Total 100.0% 100.0% 100.0% 100.0% 100.0% 100.0% 100.0% 100.0% 100.0% 100.0% 100.0% 100.0%Source: Field Survey, 2013
29
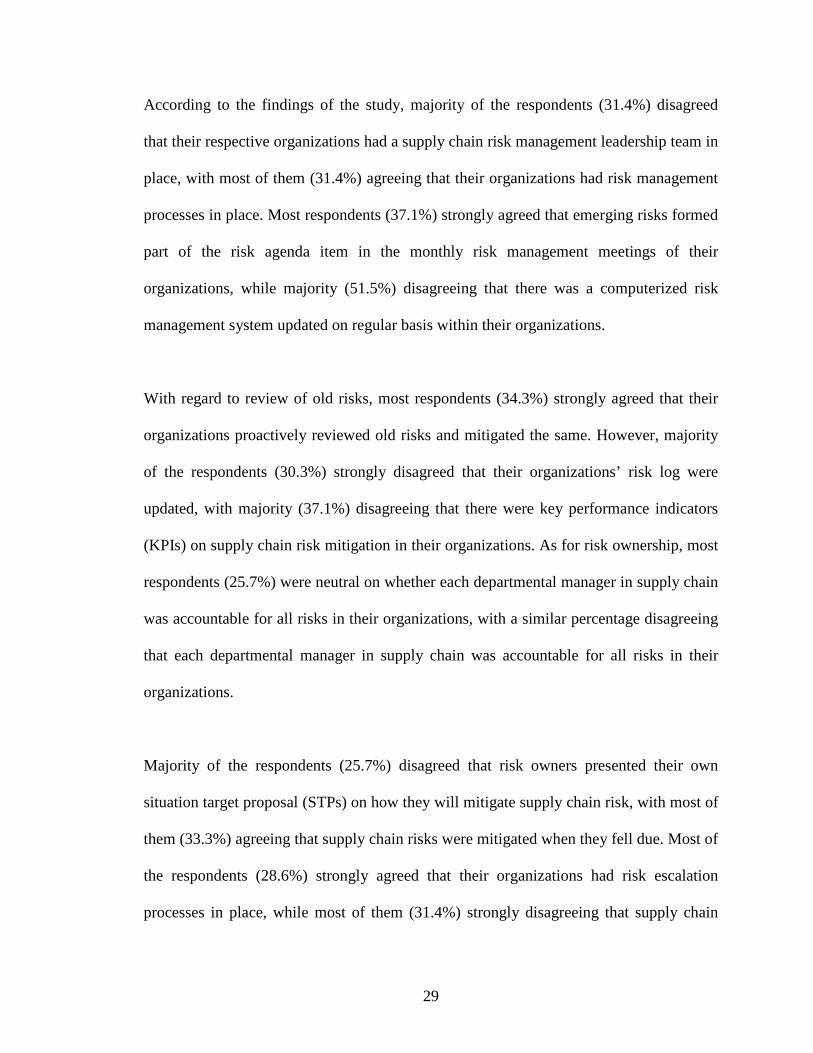
According to the findings of the study, majority of the respondents (31.4%) disagreed
that their respective organizations had a supply chain risk management leadership team in
place, with most of them (31.4%) agreeing that their organizations had risk management
processes in place. Most respondents (37.1%) strongly agreed that emerging risks formed
part of the risk agenda item in the monthly risk management meetings of their
organizations, while majority (51.5%) disagreeing that there was a computerized risk
management system updated on regular basis within their organizations.
With regard to review of old risks, most respondents (34.3%) strongly agreed that their
organizations proactively reviewed old risks and mitigated the same. However, majority
of the respondents (30.3%) strongly disagreed that their organizations’ risk log were
updated, with majority (37.1%) disagreeing that there were key performance indicators
(KPIs) on supply chain risk mitigation in their organizations. As for risk ownership, most
respondents (25.7%) were neutral on whether each departmental manager in supply chain
was accountable for all risks in their organizations, with a similar percentage disagreeing
that each departmental manager in supply chain was accountable for all risks in their
organizations.
Majority of the respondents (25.7%) disagreed that risk owners presented their own
situation target proposal (STPs) on how they will mitigate supply chain risk, with most of
them (33.3%) agreeing that supply chain risks were mitigated when they fell due. Most of
the respondents (28.6%) strongly agreed that their organizations had risk escalation
processes in place, while most of them (31.4%) strongly disagreeing that supply chain
30
risk-based audits were carried out in their organizations. Generally, majority of
respondents (42.9%) rated the supply chain risk management processes in their
organizations as bad.
31
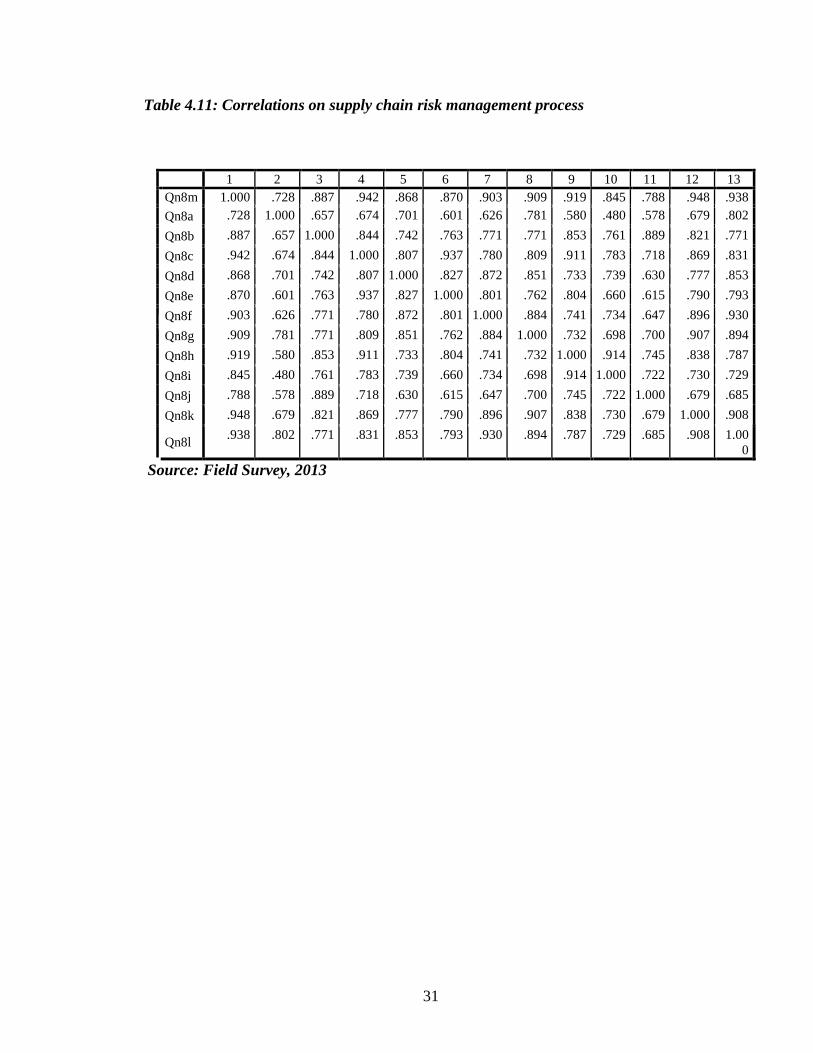
Table 4.11: Correlations on supply chain risk management process
1 2 3 4 5 6 7 8 9 10 11 12 13 Qn8m 1.000 .728 .887 .942 .868 .870 .903 .909 .919 .845 .788 .948 .938
Qn8a .728 1.000 .657 .674 .701 .601 .626 .781 .580 .480 .578 .679 .802
Qn8b .887 .657 1.000 .844 .742 .763 .771 .771 .853 .761 .889 .821 .771
Qn8c .942 .674 .844 1.000 .807 .937 .780 .809 .911 .783 .718 .869 .831
Qn8d .868 .701 .742 .807 1.000 .827 .872 .851 .733 .739 .630 .777 .853
Qn8e .870 .601 .763 .937 .827 1.000 .801 .762 .804 .660 .615 .790 .793
Qn8f .903 .626 .771 .780 .872 .801 1.000 .884 .741 .734 .647 .896 .930
Qn8g .909 .781 .771 .809 .851 .762 .884 1.000 .732 .698 .700 .907 .894
Qn8h .919 .580 .853 .911 .733 .804 .741 .732 1.000 .914 .745 .838 .787
Qn8i .845 .480 .761 .783 .739 .660 .734 .698 .914 1.000 .722 .730 .729
Qn8j .788 .578 .889 .718 .630 .615 .647 .700 .745 .722 1.000 .679 .685
Qn8k .948 .679 .821 .869 .777 .790 .896 .907 .838 .730 .679 1.000 .908
Qn8l .938 .802 .771 .831 .853 .793 .930 .894 .787 .729 .685 .908 1.00
0 Source: Field Survey, 2013
32
The study establishes that risk escalation process has the highest positive impact (.948)
on the general supply chain risk management process, followed by the culture of making
emerging risks part of the risk agenda item in the monthly risk management meetings of
an organization (at .942). According to the findings of the study, having a supply chain
risk management leadership team in place has the least positive impact on an
organization’s general supply chain risk management process at .728 (see table 4.11).
These findings corroborate Chakravarty’s (2013) call for the need for top organization’s
management to deploy risk management processes and systems that make visible risks
and propose remediation of the same.
4.4 Safety Management
Under this section, the study sought to assess the safety management status of the
pharmaceutical organizations under study. The findings were as presented in the
subsequent sub-sections. Table 4.13 presents the mean, median, mode, standard
deviations, and percentiles for the questions that the respondents were asked under this
section

33
Table 4.12: Mean, Median, Standard Deviations, and Percentiles Statistic

34
Table 4.13 shows that majority of the respondents (51.4%) strongly agreed that their
respective organizations had defined and documented their Occupational Health and
Safety (OHS) policy, with most of them (the respondents) (59.5%) agreeing that there
was evidence that safety management policy had been communicated and implemented
throughout their organizations. Similarly, majority of them (40.5%) agreed that their
organizations had a procedure to identify the appropriate OHS hazards and risks resulting
from its activities, with majority (42.9%) further agreeing that supply chain safety risk
assessments in their organizations addressed: processes, facilities, contractors, and off-
site working.
With regard to regulatory operational requirements, majority of respondents (37.8%)
agreed that all risks having legal and/or regulatory operational requirements had been
identified by their respective organizations. Most of the respondent (54.1%) also agreed
that there was a mechanism for communicating relevant safety information on legal and
regulatory requirements to employees and interested parties. In addition, majority
(56.8%) agreed that OHS objectives had been established at each relevant function and
level in their organizations. On roles and responsibilities, majority of respondents
(40.5%) agreed that responsibilities and levels of authority for all personnel managing
OHS management system had been defined and documented in their organizations.
Majority (40.5%) also agreed that core elements of the safety management system and
their interaction, had been described in electronic form, with most of them (45.9%)
agreeing further that systems were in place to communicate relevant procedures and/or
requirements, regarding OHS hazards associated with purchased: products, equipment
and services.

35
As for procedures, most of the respondents (54.1%) agreed that procedures had been
implemented to identify the potential for and response to incidents, accidents, and
emergencies within their organizations, while majority (54.1%) agreeing that there were
procedures in place to prevent and mitigate the impacts of incidents, accidents and
emergencies in their organizations. Majority (48.6%) also agreed that emergency
preparedness and response procedures were reviewed and revised as appropriate through
the risk assessment route, while most of them (45.9%) agreeing that emergency
procedures were tested where practicable. Most of the respondents (64.9%) agreed that
procedures in their organizations ensured that affected personnel were adequately trained
for foreseeable situations including use of emergency equipment where appropriate.
Moreover, most of them (43.2%) strongly agreed that internal safety audit procedures had
been developed, while majority (48.6) strongly agreeing that there was periodic
management reviews on safety management in their organizations. Overally, majority of
the respondents (56.8%) rated the safety management in their respective organizations as
good.
As shown in table 4.14, the findings of the study indicate that the independent variables
have significant impact on the general safety management in an organization. Reviewing
and revising emergency preparedness and response procedures appropriately through the
risk assessment route has the highest positive impact (at .875) on the overall safety
management in an organization (see table 4.14 for the correlations between the variables).
This finding therefore confirms Vikram’s (2013) assertion that information about safety
management practices that pose high risk of production interruption need to be reviewed
36
and documented, often by third parties. According to Vikram (2013), reviewing safety
management practices may provide critical insights into the risk of interruption from
doing business with an external supplier or from risks that exist internally within a
vertically integrated company. Therefore, to assess supply chain risk exposures, Norrman
and Jansson (2004) maintain that the company must identify not only direct risks to its
operations, but also the potential causes or sources of those risks at every significant link
along the supply chain.

37
Table 4.14: Correlation on safety management
Qn9r Qn9a Qn9b Qn9c Qn9d Qn9e Qn9f Qn9g Qn9h Qn9i Qn9j Qn9k
Qn9r 1.000 .788 .758 .859 .585 .531 .813 .753 .797 .791 .856 .865
Qn9a .788 1.000 .911 .790 .722 .497 .725 .574 .648 .656 .693 .698
Qn9b .758 .911 1.000 .752 .651 .366 .725 .526 .471 .485 .674 .601
Qn9c .859 .790 .752 1.000 .806 .647 .912 .621 .681 .755 .869 .739
Qn9d .585 .722 .651 .806 1.000 .715 .765 .424 .593 .575 .648 .478
Qn9e .531 .497 .366 .647 .715 1.000 .642 .311 .513 .469 .496 .528
Qn9f .813 .725 .725 .912 .765 .642 1.000 .686 .692 .669 .882 .7
Qn9g .753 .574 .526 .621 .424 .311 .686 1.000 .848 .616 .728 .617
Qn9h .797 .648 .471 .681 .593 .513 .692 .848 1.000 .795 .676 .710
Qn9i .791 .656 .485 .755 .575 .469 .669 .616 .795 1.00 .702 .736
Qn9j .856 .693 .674 .869 .648 .496 .882 .728 .676 .702 1.000 .653
Qn9k .865 .698 .601 .739 .478 .528 .703 .617 .710 .736 .653 1.000
Qn9l .831 .801 .698 .775 .570 .481 .784 .621 .681 .750 .718 .862
Qn9m .875 .807 .798 .751 .513 .235 .700 .627 .633 .785 .765 .794
Qn9n .729 .856 .707 .754 .604 .434 .639 .396 .574 .781 .647 .695
Qn9o .829 .839 .733 .647 .419 .343 .617 .524 .657 .721 .625 .776
Qn9p .868 .760 .671 .799 .527 .313 .693 .638 .697 .760 .782 .805
Pearson Correlation
Qn9q .813 .613 .518 .587 .400 .199 .511 .681 .803 .696 .628 .760
Source: Field Survey, 2013.
38
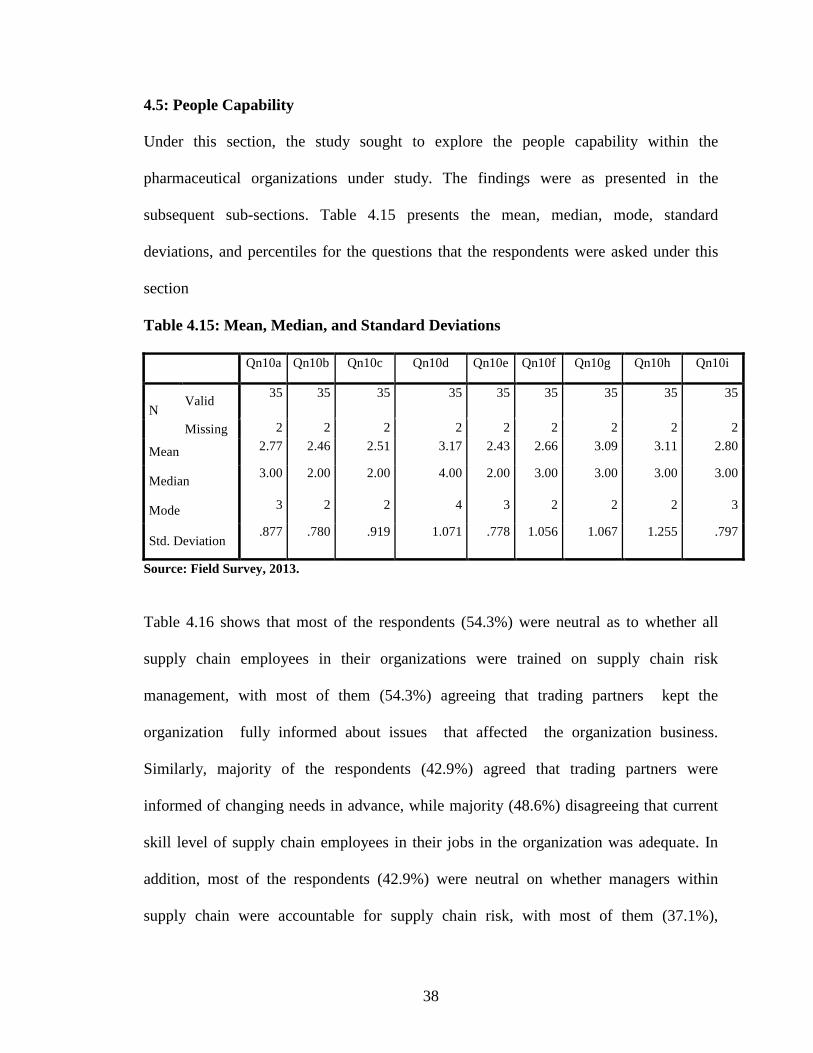
4.5: People Capability
Under this section, the study sought to explore the people capability within the
pharmaceutical organizations under study. The findings were as presented in the
subsequent sub-sections. Table 4.15 presents the mean, median, mode, standard
deviations, and percentiles for the questions that the respondents were asked under this
section
Table 4.15: Mean, Median, and Standard Deviations
Qn10a Qn10b Qn10c Qn10d Qn10e Qn10f Qn10g Qn10h Qn10i
Valid 35 35 35 35 35 35 35 35 35
N
Missing 2 2 2 2 2 2 2 2 2
Mean 2.77 2.46 2.51 3.17 2.43 2.66 3.09 3.11 2.80
Median 3.00 2.00 2.00 4.00 2.00 3.00 3.00 3.00 3.00
Mode 3 2 2 4 3 2 2 2 3
Std. Deviation .877 .780 .919 1.071 .778 1.056 1.067 1.255 .797
Source: Field Survey, 2013.
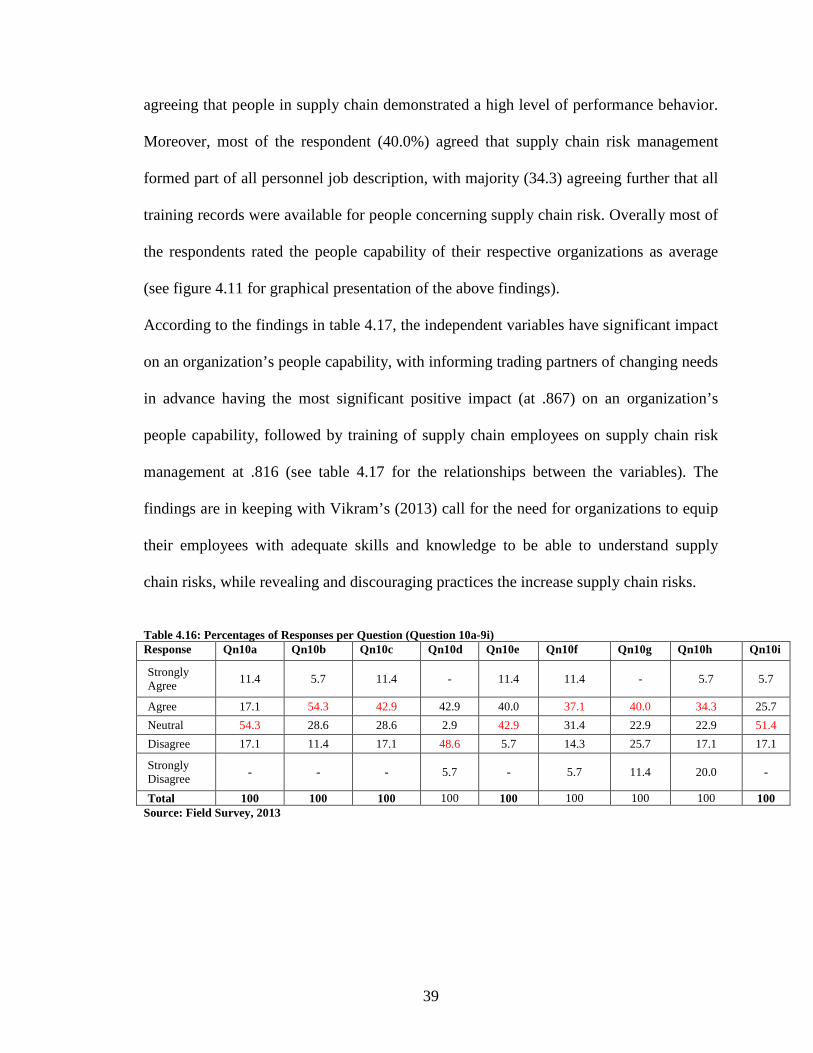
Table 4.16 shows that most of the respondents (54.3%) were neutral as to whether all
supply chain employees in their organizations were trained on supply chain risk
management, with most of them (54.3%) agreeing that trading partners kept the
organization fully informed about issues that affected the organization business.
Similarly, majority of the respondents (42.9%) agreed that trading partners were
informed of changing needs in advance, while majority (48.6%) disagreeing that current
skill level of supply chain employees in their jobs in the organization was adequate. In
addition, most of the respondents (42.9%) were neutral on whether managers within
supply chain were accountable for supply chain risk, with most of them (37.1%),
39
agreeing that people in supply chain demonstrated a high level of performance behavior.
Moreover, most of the respondent (40.0%) agreed that supply chain risk management
formed part of all personnel job description, with majority (34.3) agreeing further that all
training records were available for people concerning supply chain risk. Overally most of
the respondents rated the people capability of their respective organizations as average
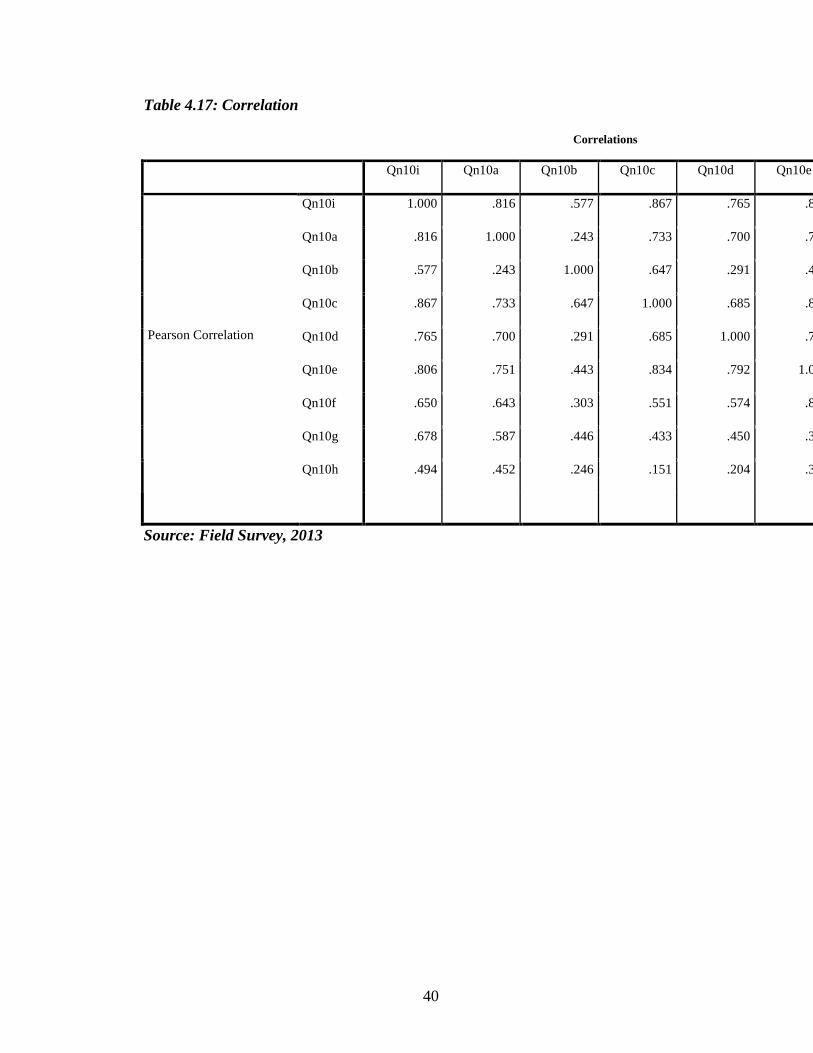
(see figure 4.11 for graphical presentation of the above findings).
According to the findings in table 4.17, the independent variables have significant impact
on an organization’s people capability, with informing trading partners of changing needs
in advance having the most significant positive impact (at .867) on an organization’s
people capability, followed by training of supply chain employees on supply chain risk
management at .816 (see table 4.17 for the relationships between the variables). The
findings are in keeping with Vikram’s (2013) call for the need for organizations to equip
their employees with adequate skills and knowledge to be able to understand supply
chain risks, while revealing and discouraging practices the increase supply chain risks.
Table 4.16: Percentages of Responses per Question (Question 10a-9i) Response Qn10a Qn10b Qn10c Qn10d Qn10e Qn10f Qn10g Qn10h Qn10i
Strongly Agree
11.4 5.7 11.4 - 11.4 11.4 - 5.7 5.7
Agree 17.1 54.3 42.9 42.9 40.0 37.1 40.0 34.3 25.7
Neutral 54.3 28.6 28.6 2.9 42.9 31.4 22.9 22.9 51.4
Disagree 17.1 11.4 17.1 48.6 5.7 14.3 25.7 17.1 17.1
Strongly Disagree
- - - 5.7 - 5.7 11.4 20.0 -
Total 100 100 100 100 100 100 100 100 100 Source: Field Survey, 2013
40
Table 4.17: Correlation
Correlations
Qn10i Qn10a Qn10b Qn10c Qn10d Qn10e
Qn10i 1.000 .816 .577 .867 .765 .806
Qn10a .816 1.000 .243 .733 .700 .751
Qn10b .577 .243 1.000 .647 .291 .443
Qn10c .867 .733 .647 1.000 .685 .834
Qn10d .765 .700 .291 .685 1.000 .792
Qn10e .806 .751 .443 .834 .792 1.000
Qn10f .650 .643 .303 .551 .574 .865
Qn10g .678 .587 .446 .433 .450 .344
Pearson Correlation
Qn10h .494 .452 .246 .151 .204 .370
Source: Field Survey, 2013

41
4.6: Production tradeoffs
Under this section, the study sought to examine the production tradeoffs within the
pharmaceutical organizations under study. The findings were as presented in the
subsequent sub-sections. Tables 4.18 present the mean, median, mode, standard
deviations, and percentiles for the questions that the respondents were asked under this
section.
Table 4.18: Mean, Median, Mode, and Standard Deviation
Statistics
Qn11a Qn11b Qn11c Qn11d Qn11e Qn11f Qn11g Qn11h
Valid 35 35 33 35 35 35 35 35 N
Missing 2 2 4 2 2 2 2 2
Mean 4.29 3.34 2.91 2.49 1.80 2.17 3.06 2.77
Median 5.00 3.00 3.00 2.00 2.00 2.00 3.00 3.00
Mode 5 2 2 2 2 2 3a 3
Std. Deviation 1.126 1.259 .843 .951 .797 .785 1.027 .547
a. Multiple modes exist. The smallest value is shown
Source: Field Survey, 2013
As shown in table 4.19, most of the respondents (57.1%) strongly disagreed on whether
product availability was always a consideration than quality in their organizations.
However, majority (37.1%) agreed that economy of scale was a main consideration in
production; with most of them (39.4%), agreeing further that tradeoff was key
consideration in making or buying decision within production. Similarly, most of those
who respondent (57.1%) agreed that the production/service process was automated, with
most of them (51.4%) agreeing that significant investments were being made in
enterprise-wide information systems than manual work. With regard to informational
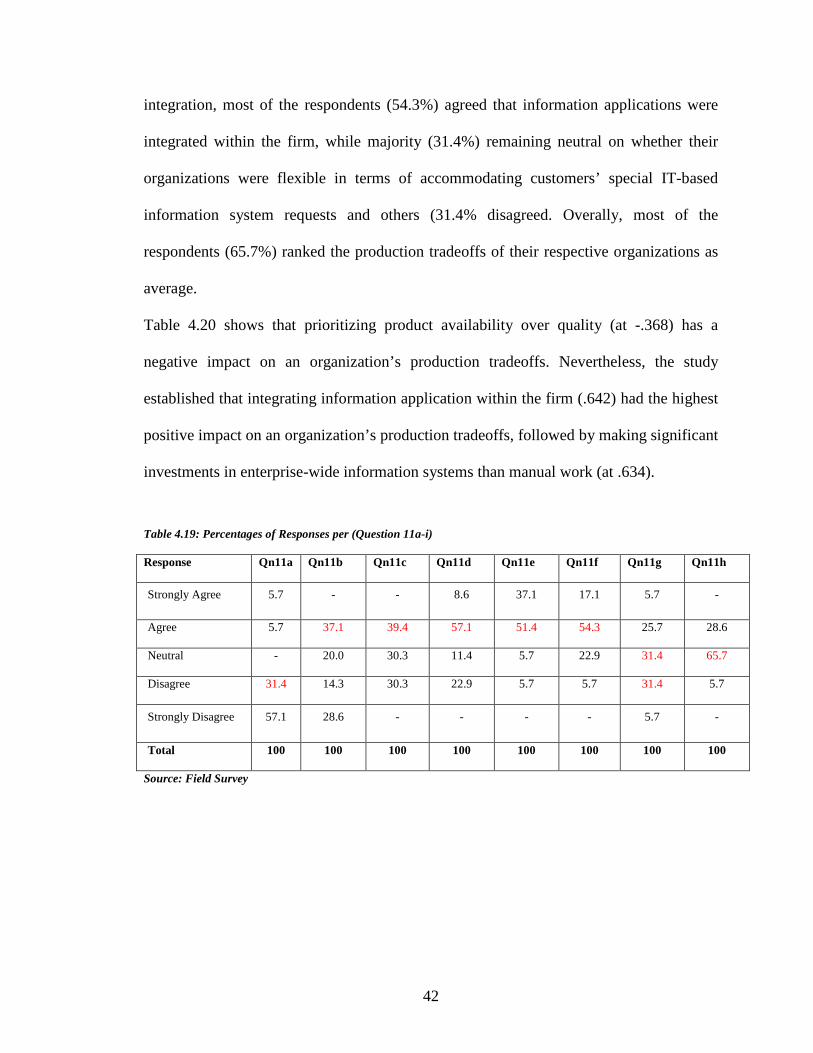
42
integration, most of the respondents (54.3%) agreed that information applications were
integrated within the firm, while majority (31.4%) remaining neutral on whether their
organizations were flexible in terms of accommodating customers’ special IT-based
information system requests and others (31.4% disagreed. Overally, most of the
respondents (65.7%) ranked the production tradeoffs of their respective organizations as
average.
Table 4.20 shows that prioritizing product availability over quality (at -.368) has a
negative impact on an organization’s production tradeoffs. Nevertheless, the study
established that integrating information application within the firm (.642) had the highest
positive impact on an organization’s production tradeoffs, followed by making significant
investments in enterprise-wide information systems than manual work (at .634).
Table 4.19: Percentages of Responses per (Question 11a-i)
Response Qn11a Qn11b Qn11c Qn11d Qn11e Qn11f Qn11g Qn11h
Strongly Agree 5.7 - - 8.6 37.1 17.1 5.7 -
Agree 5.7 37.1 39.4 57.1 51.4 54.3 25.7 28.6
Neutral - 20.0 30.3 11.4 5.7 22.9 31.4 65.7
Disagree 31.4 14.3 30.3 22.9 5.7 5.7 31.4 5.7
Strongly Disagree 57.1 28.6 - - - - 5.7 -
Total 100 100 100 100 100 100 100 100
Source: Field Survey

43
Table 4.20: Correlation on production tradeoffs
Correlations
Qn11h Qn11a Qn11b Qn11c Qn11d Qn11e
Qn11h 1.000 -.368 .416 .227 .559
Qn11a -.368 1.000 .095 -.296 -.463
Qn11b .416 .095 1.000 -.083 .029
Qn11c .227 -.296 -.083 1.000 .550
Qn11d .559 -.463 .029 .550 1.000
Qn11e .634 -.655 .217 -.074 .287
Qn11f .642 -.456 .415 -.250 .358
Pearson Correlation
Qn11g .495 -.319 .189 -.261 -.059
a. Dependent Variable: Qn11h
b. Predictors: (Constant), Qn11g, Qn11d, Qn11b, Qn11e, Qn11c, Qn11a, Qn11f
44
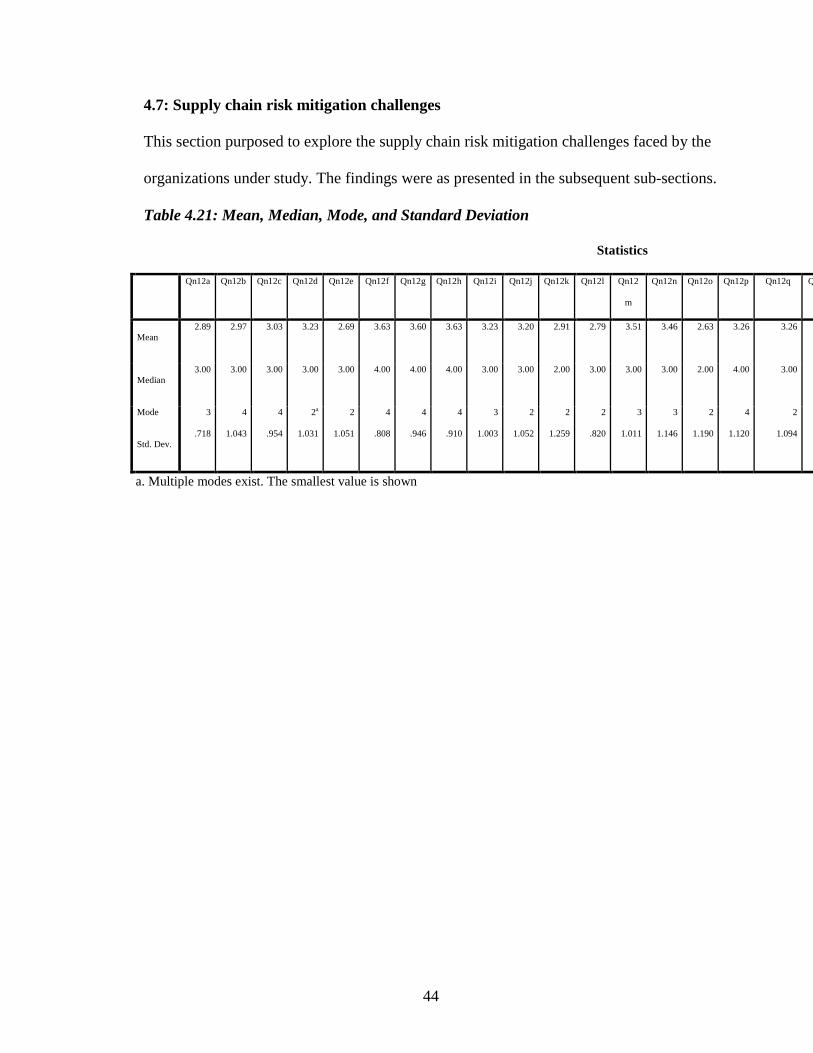
4.7: Supply chain risk mitigation challenges
This section purposed to explore the supply chain risk mitigation challenges faced by the
organizations under study. The findings were as presented in the subsequent sub-sections.
Table 4.21: Mean, Median, Mode, and Standard Deviation
Statistics
Qn12a Qn12b Qn12c Qn12d Qn12e Qn12f Qn12g Qn12h Qn12i Qn12j Qn12k Qn12l Qn12
m
Qn12n Qn12o Qn12p Qn12q Qn12r
Mean 2.89 2.97 3.03 3.23 2.69 3.63 3.60 3.63 3.23 3.20 2.91 2.79 3.51 3.46 2.63 3.26 3.26
Median 3.00 3.00 3.00 3.00 3.00 4.00 4.00 4.00 3.00 3.00 2.00 3.00 3.00 3.00 2.00 4.00 3.00
Mode 3 4 4 2a 2 4 4 4 3 2 2 2 3 3 2 4 2
Std. Dev. .718 1.043 .954 1.031 1.051 .808 .946 .910 1.003 1.052 1.259 .820 1.011 1.146 1.190 1.120 1.094 1.010
a. Multiple modes exist. The smallest value is shown
45
Majority of the respondents responded to different questions under this section as
follows: 48.6% were neutral on whether their organizations lacked supply chain
management knowledge; 40.0% disagreed that their organizations lacked adequate
resources to implement supply chain initiatives sufficiently; with 45.7% disagreeing that
their organizations were experiencing poor sales and operations planning process. On
ethics, 31.4% of respondents agreed that there were ethical responsibility problems in the
supply chain within their organizations, with a similar percentage disagreeing; 31.4%
agreed that their organizations had inadequate supply chain performance measures; with
48.6% of the respondents disagreeing that there was lack of trust among supply chain
members in their organizations.
40.0% of the respondents disagreed that there was lack of corporation among supply
chain members their organizations, while 57.1% disagreeing that there was always stock
availability to meet all customer full demand, on time, and 48.6% remaining neutral on
whether their organizations lacked motivation among supply chain members. 34.3% of
the respondents agreed that customers’ geographical distance were high in their
organizations, with 45.5% agreeing that suppliers’ geographical distance was equally
high, and 45.5% agreeing that there were inadequate information systems linkages within
the supply chain of their organizations.
42.9% of the respondents were neutral on whether there was conflict among supply chain
members in their organizations, with 37.1% remaining neutral on whether there was lack
of top management support in their organizations, and 48.6% agreeing that government
customs regulations were impacting on their organization’s supply chain. 42.9%
disagreed that there was poor visibility of demand in their organizations, with 31.4%
46
agreeing that terrorism was a key factor in supply chain buying and supply decision, and
31.4% disagreeing that there were complexities in the supply chain in their organizations.
With regard to quality, 42.9% of the respondents disagreed that there were inconsistent
quality supplies in their organizations, while 45.7% remaining neutral on whether there
was lack of leverage within their organization’s supply chain, and 45.5% disagreeing that
their organizations experienced short product life cycles. 42.2% of the respondents were
neutral on whether dealing with counterfeit goods was fully aligned in their organization,
with 39.4% agreeing that their organizations experienced supply chain disruptions, and
57.5% disagreeing that product recall incidences were more often in their organizations.
With regard to order delivery, most of the respondent (24.2%) strongly agreed that poor
road infrastructure resulted in delay in order delivery. However, 24.4% of the
respondents strongly disagreed that poor road infrastructure resulted in delay in order
deliver in their organizations. Overally, most of the respondents (60.0%) rated the
mechanisms put in place by their organizations to mitigate supply chain challenges as
average (see table 4.22 on these findings).
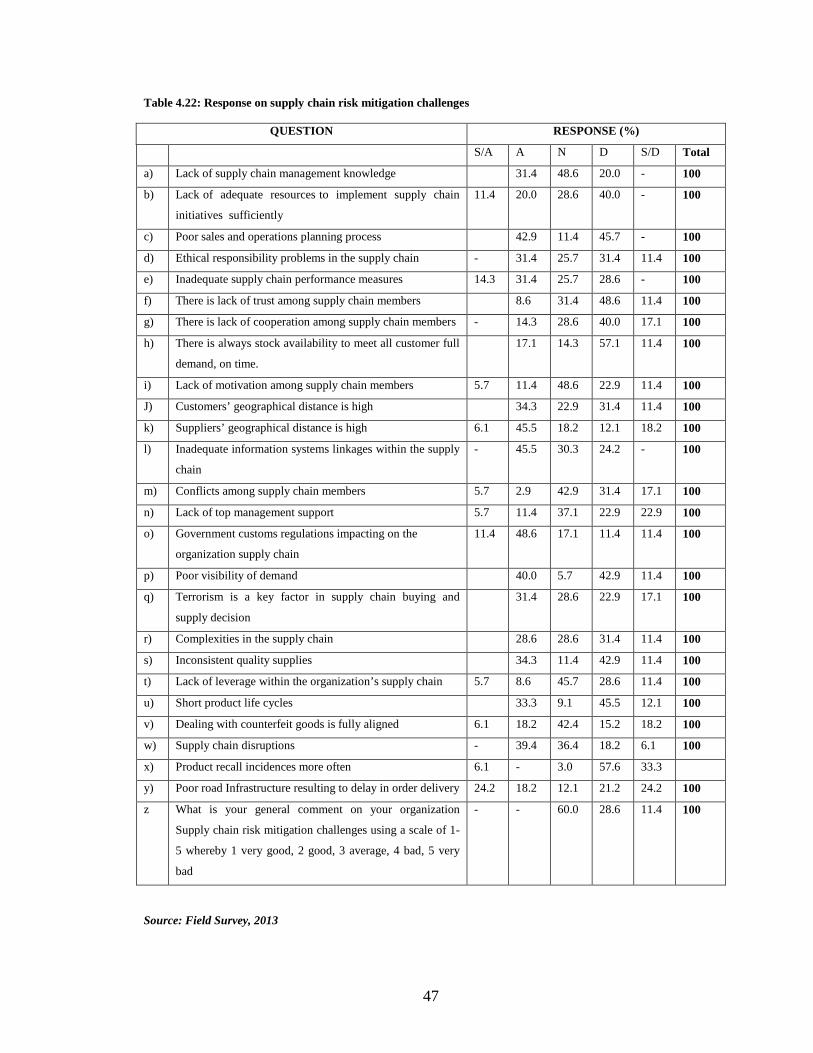
47
Table 4.22: Response on supply chain risk mitigation challenges
QUESTION RESPONSE (%)
S/A A N D S/D Total
a) Lack of supply chain management knowledge 31.4 48.6 20.0 - 100
b) Lack of adequate resources to implement supply chain
initiatives sufficiently
11.4 20.0 28.6 40.0 - 100
c) Poor sales and operations planning process 42.9 11.4 45.7 - 100
d) Ethical responsibility problems in the supply chain - 31.4 25.7 31.4 11.4 100
e) Inadequate supply chain performance measures 14.3 31.4 25.7 28.6 - 100
f) There is lack of trust among supply chain members 8.6 31.4 48.6 11.4 100
g) There is lack of cooperation among supply chain members - 14.3 28.6 40.0 17.1 100
h) There is always stock availability to meet all customer full
demand, on time.
17.1 14.3 57.1 11.4 100
i) Lack of motivation among supply chain members 5.7 11.4 48.6 22.9 11.4 100
J) Customers’ geographical distance is high 34.3 22.9 31.4 11.4 100
k) Suppliers’ geographical distance is high 6.1 45.5 18.2 12.1 18.2 100
l) Inadequate information systems linkages within the supply
chain
- 45.5 30.3 24.2 - 100
m) Conflicts among supply chain members 5.7 2.9 42.9 31.4 17.1 100
n) Lack of top management support 5.7 11.4 37.1 22.9 22.9 100
o) Government customs regulations impacting on the
organization supply chain
11.4 48.6 17.1 11.4 11.4 100
p) Poor visibility of demand 40.0 5.7 42.9 11.4 100
q) Terrorism is a key factor in supply chain buying and
supply decision
31.4 28.6 22.9 17.1 100
r) Complexities in the supply chain 28.6 28.6 31.4 11.4 100
s) Inconsistent quality supplies 34.3 11.4 42.9 11.4 100
t) Lack of leverage within the organization’s supply chain 5.7 8.6 45.7 28.6 11.4 100
u) Short product life cycles 33.3 9.1 45.5 12.1 100
v) Dealing with counterfeit goods is fully aligned 6.1 18.2 42.4 15.2 18.2 100
w) Supply chain disruptions - 39.4 36.4 18.2 6.1 100
x) Product recall incidences more often 6.1 - 3.0 57.6 33.3
y) Poor road Infrastructure resulting to delay in order delivery 24.2 18.2 12.1 21.2 24.2 100
z What is your general comment on your organization
Supply chain risk mitigation challenges using a scale of 1-
5 whereby 1 very good, 2 good, 3 average, 4 bad, 5 very
bad
- - 60.0 28.6 11.4 100
Source: Field Survey, 2013
48
CHAPTER FIVE
SUMMARY, CONCLUSION AND RECOMMENDATIONS
5.1 Introduction
This chapter provides a summary of the findings; the conclusion and the
recommendations of the study which sought to determine the supply chain risk mitigation
by pharmaceutical firms in Kenya and further establish the challenges faced in adopting
the Supply chain risk mitigations and how to overcome them.
5.2 Summary of Findings
This section presents a summary of the findings of the study in relation to its objectives.
The general objective of the study was to determine the supply chain risk mitigation in
pharmaceutical firms in Kenya. In so doing, the study sought to specifically determine
the supply chain risk mitigation by the pharmaceutical firms in Kenya, identify
challenges faced in adoption of this Supply chain risk mitigations, and determine how
pharmaceutical companies in Kenya overcome challenges in implementing supply chain
risk mitigation.
On supply chain risk management process, majority of the respondents disagreed that
their respective organizations had a supply chain risk management leadership team in
place; majority agreed that their organizations had risk management processes in place,
while most of them strongly agreed that emerging risks formed part of the risk agenda
item in the monthly risk management meetings of their organizations. Majority of the
49
respondents disagreed that there was a computerized risk management system updated on
regular basis within their organizations, with most of them strongly agreeing that their
organizations proactively reviewed old risks and mitigated the same. However, majority
strongly disagreed that their organizations’ risk log were updated, with most of them
disagreeing that there were key performance indicators (KPIs) on supply chain risk
mitigation in their organizations. Generally, most of the respondents rated the supply
chain risk management processes in their organizations as bad.
On safety management, majority of the respondents strongly agreed that their respective
organizations had defined and documented their Occupational Health and Safety (OHS)
policy, with most of them agreeing that there was evidence that safety management
policy had been communicated and implemented throughout their organizations. Most
respondents agreed that their organizations had a procedure to identify the appropriate
OHS hazards and risks resulting from its activities, while majority agreeing that supply
chain safety risk assessments in their organizations addressed: processes, facilities,
contractors, and off-site working. Overally, most respondents rated the safety
management in their respective organizations as good.
With regard to people capability, most of the respondents were neutral as to whether all
supply chain employees in their organizations were trained on supply chain risk, with
majority agreed that trading partners kept the organization fully informed about issues
that affected the organization business. Most respondents agreed that trading partners
were informed of changing needs in advance, with majority disagreeing that current skill

50
level of supply chain employees in their jobs in the organization was adequate. Overall
most of the respondents rated the people capability of their respective organizations as
average
On production tradeoffs, the study found that most respondents strongly disagreed that
product availability was always a consideration than quality in their organizations, with
majority agreeing that economy of scale was a main consideration in production.
Majority agreeing further that tradeoff was key consideration in making or buying
decision within production. Majority agreed that information applications were
integrated within the firm, while most of them remaining neutral on whether their
organizations were flexible in terms of accommodating customers’ special IT-based
information system requests. Overally, majority ranked the production tradeoffs of their
respective organizations as average.
As for supply chain risk mitigation challenges, most respondents were neutral on whether
their organizations lacked supply chain management knowledge; many disagreed that
their organizations lacked adequate resources to implement supply chain initiatives
sufficiently; with majority disagreeing that their organizations were experiencing poor
sales and operations planning process, while majority agreeing that there were ethical
responsibility problems in the supply chain within their organizations. Most of them
agreed that their organizations had inadequate supply chain performance measures, with
majority disagreeing that there was lack of trust among supply chain members in their
organizations. Majority remained neutral on whether their organizations lacked

51
motivation among supply chain members, while most respondents agreeing that
customers’ geographical distance were high in their organizations. Majority agreed that
suppliers’ geographical distance was equally high, with most of the respondents agreeing
that there were inadequate information systems linkages within the supply chain of their
organizations. Most of them agreed that government customs regulations were impacting
on their organization’s supply chain, while majority disagreeing that there was poor
visibility of demand in their organizations. Majority agreed that terrorism was a key
factor in supply chain buying and supply decision, with most of them disagreeing that
there were complexities in the supply chain in their organizations. Most of them strongly
agreed that poor road infrastructure resulted in delay in order delivery, while majority
strongly disagreeing that poor road infrastructure resulted in delay in order deliver in
their organizations. Overall, majority rated the mechanisms put in place by their
organizations to mitigate supply chain challenges as average.
5.3 Conclusion
In view of the findings of this study, this study concludes that the supply chain
management processes in most pharmaceutical firms in Kenya are bad because of lack of
supply chain risk management leadership teams in place, lack of computerized risk
management system, which updated on a regular basis, and lack of an updated
organization risk log. The bad state of supply chain risk management process in most
pharmaceutical companies in Kenya is also attributed to lack of KPIs on supply chain risk
mitigation, lack of presentation of STPs by risk owners, and supply chain risk-based
audits. Even though this is the case in most companies in the pharmaceutical industry in

52
Kenya, most firms incorporate emerging risks in their monthly meetings, proactively
reviews old risks, and mitigate the same, while also mitigating supply chain risks when
they fall due.
The safety management processes in most pharmaceutical companies in Kenya is good
according to the findings of the study. This is attributed to a number of factors, including
inter alia: availability of defined and documented OHS policies, implementation of the
same, availability of mechanisms for communicating safety information on legal and
regulatory requirements to employees and other stakeholders, as well as well-defined
responsibilities for the OHS personnel. Most companies also have systems to
communicate relevant procedures /requirements on OHS hazards vis-à-vis purchased
products, equipment, and services. The internal safety audit procedures in most of the
companies have also been developed, with periodic management reviews on safety
management being undertaken.
Even though most pharmaceutical organizations in Kenya get informed about issues that
affect their businesses, inform their trading partners on changing needs in advance, and
include supply chain risk management in their personnel job descriptions; the people
capability in most pharmaceutical companies in Kenya is average. This is mainly
attributed to inadequate supply chain management skills among employees of most
organizations in the industry.

53
Even though most pharmaceutical organizations in Kenya consider tradeoff as key in
making production-related decisions, have an automated production/service process, and
have integrated information application systems; the production tradeoffs in most of these
organizations remain average. This is due to lack of flexibility on the part of most
organizations to accommodate the special IT-based information requests of their
customers.
Finally, the mitigation mechanisms developed by most pharmaceutical organizations in
Kenya to address supply chain risks are average according to the findings of the study.
Most organizations face ethical responsibility problems in their supply chains, high
customer/supplier-geographical distances, and inadequate information systems linkages
within the supply chain. Furthermore, the government customs regulations impact on the
supply chain of most organizations, with acts of terrorism being major concerns in
making supply chain decisions. Most organizations also suffer supply chain disruptions.
5.4 Recommendations
Based on the findings of the study, this study makes the following recommendations:
there is need for pharmaceutical organizations in Kenya assemble and have in place a
supply chain risk management leadership team, pharmaceutical organizations also need
to computerize their risk management systems and update them on a regular basis,
organizations should also develop their risk logs and update them regularly, key
performance indicators (KPIs) should also form part of supply chain mitigation systems
of pharmaceutical organizations in the industry, organizations should carry out supply

54
chain risk-based audits on a regular basis, pharmaceutical organizations should provide
their supply chain employees with adequate skills and knowledge to be able to perform
their jobs in a more effective and efficient manner, all supply chain employees need to be
trained on modern approaches to managing supply chain risks, pharmaceutical
organizations need to be flexible in terms of accommodating special IT-based
information system requests of their customers, there is need for organizations to provide
adequate resources for implementing supply chain initiatives efficiently, organizations
should address ethical responsibility problems in their supply chains effectively,
pharmaceutical companies should also provide adequate supply chain performance
measures.
There is need to adopt processes/approaches that will help in reducing the geographical
distances between the customers and suppliers of pharmaceutical organizations within the
industry i.e. sourcing closer to the market. Adequate information systems linkages within
the supply chains of pharmaceutical companies in Kenya also need to be provided. On
Government customs regulations that impact on the organizations within the
pharmaceutical industry in Kenya, there is need to be reviewed with a view to eliminating
those that impact negatively on the organizations’ supply chains or have a strategy on
managing this risk. Finally, causes of supply chain disruptions among pharmaceutical
organizations in Kenya need to be identified and effective mechanism developed to
address/eliminate/prevent them.
55
5.5 Limitation of the study
The research work was mainly focused on managers handling supply chain roles.
Pharmaceutical companies have several other functional departments hence the response
obtained from only supply chain related managers may not be representative of an entire
organization. Moreover, staffs that are involved in the day to day supply chain activities
and are not managers were not considered for the study, and hence the findings can only
be used as a guide and can also provide a basis for future research. The research work
was also accomplished with a lot of time constraints.
5.6 Areas for Further Study
Future researchers should investigate the following pertinent areas: The impact of supply
chain risks on the financial performance of pharmaceutical organizations in Kenya, The
impact of supply chain risks on product quality among pharmaceutical organizations in
Kenya and Supply chain risk mitigation on other fast moving consumer industry in
Kenya
56
REFERENCES
Barry, J. (2004). Supply chain risk in an uncertain global supply chain environment.
Internation Journal of Physical Distribution & Logistics Management, 34(9),
695-697.
Cachon, G. P., & Fisher, M. (2000). Supply chain inventory management and the value
of shared information. Management Science, 46(8), 1032-1048.
Chakravarty, V. (2013). Strategy and leadership. Managing a supply chain’s web of risk,
41(2), 39-45.
Choi, T., & Krause, D. (2006). The supply base and its complexity: implications for
transaction costs, risks, responsiveness, and innovation. Journal of Operations
Management, Vol. 24 No. 5, pp. 637-52.
Chopra, S., & Sodhi, M. (2004). Managing risk to avoid supply chain breakdown. Sloan
Management Review, Fall, 53-61.
Christopher, M., & Lee, H. (2004). Mitigating supply chain risk through improved
confidence. International Journal of Physical Distribution & Logistics
Management, 34(5), 388-396.
Christopher, M., & Peck, H. (2004). Building the resilient supply chain. The
International Journal of Logistics Management, 15(2), 1-13.
57
Craighead, C. W., Blackhurst, J., Rungtusanatham, M. J., & Handfield, R. B. (2007). The
Severity of Supply Chain Disruptions: Design Characteristics and Mitigation
Capabilities. Decision Sciences, 38(1), 131-156.
Finch, P. (2004). Supply chain risk management. Suppl Chain Management: An
International Journal, 9(2), 183-196.
Guyo, W. W., Gakure, R., & Mwangi, B. (2011). Factors contributing to the employee
turnover in pharmaceutical companies in Kenya: a case study of Ranbaxy
laboratories limited. Kabarak University First International Conference, 1-11.
Hahn, C. D. (2000). Supply chain synchronization: lessons from Hyundai Motor
Company. Interfaces, 30(4), 32-45.
Hau, L. L., Padmanabhan, V., & Seungjin, W. (1997). The Bullwhip Effect In Supply
Chains. Sloan Management Review, Spring, 38(3), 93-102.
Hendricks, K. B., & Singhal, V. R. (2005). An empirical analysis of the effect of supply
chain disruptions on long-run stock price performance and equity risk of the firm.
Production and Operations Management, 14(1), 35-52.
Hendricks, K., & Singhal, V. (2003). The effect of supply chain glitches on shareholder
wealth. Journal of Operations Management, 21(5), 501-522.
58
Henriott, L. (1999). Transforming supply chains into e-chains. Supply Chain
Management Review, Global Supplement, Spring, 15-8.
Kalunda, E., Nduku, B., & Kabiru, J. (2012). Pharmaceutical Manufacturing Companies
in Kenya and Their Credit Risk Management Practices. Research Journal of
Finance and Accounting, 3(5), 162.
Kleindorfer, P., & Saad, G. (2005). Managing disruption risks in supply chains.
Production and Operations Management, 14(1), 53-68.
Lee, H.L., Padmanabham, V. & Whang, S. (1997). The bullwhip effect in supply chains.
Sloan Management Review, Vol. 38 No. 3, pp. 93-102.
Lee, H.L. and Whang, S. (2000). Information sharing in a supply chain. International
Journal of Technology Management, Vol. 20 Nos 3/4, pp. 373-83.
Lysons, K., & Farrington, B. (2006). Purchasing and supply chain management. London:
Pearson education limited.
Manuj, I., & J.T.Mentzer. (2008a). Global supply chain risk management. Journal of
Business Logistics, 29(1), 133-155.
Momanyi, S. (2011). Strategies adopted in GlaxoSmithKline in managing outsourced
services. Unpublished MBA Research Project, University of Nairobi.
59
Norrman, A., & Jansson, U. (2004). Ericsson's proactive supply chain risk management
approach after a serious sub-supplier accident. International Journal of Physical
Distribution & Logistics Management, 34(5), 434-456.
Organization, U. N. (2010). Pharmaceutical Sector Profile: Kenya. Austria: Vienna
International Centre.
Pankaj, R. S., Larry, E. W., & Don, M. (2004). Methodology to mitigate supplier risk in
an aerospace supply chain. International Journal of supply chain management,
9(2), 154-168.
Prater, E., Biehl, M. and Smith, M.A. (2001). International supply chain agility: tradeoffs
between flexibility and uncertainty. International Journal of Operations &
Production Management, Vol. 21 Nos 5/6, pp. 823-39.
Schary, P., & Skjøtt-Larsen, T. (2001). Managing the Global Supply Chain.
Handelshøjskolens Forlag, Copenhagen.
Simchi-Levi, D., Kaminsky, P., Simchi-Levi, E., & Shankar, R. (2008). Designing and
managing the supply chain (Third ed.). New Delhi: Tata McGraw-Hill.
Skipper, J., & Hanna, J. (2009). Minimizing supply chain disruption risk through
enhanced flexibility. International Journal of Physical Distribution & Logistics
Management, 39(5), 404-427.
60
Sodhi, M. S., Son, B. G., & Tang, C. S. (2012). Researchers' perspectives on supply chain
risk management. Production and Operations Management, 21(1), 1-13.
Stefanovic, D., Stefanovic, N., & Radenkovic, B. (2009). Supply network modelling and
simulation methodology. Simulation Modelling Practice and Theory, 17(4), 743-
766.
Tomlin, B. (2006). On the value of mitigation and contingency strategies for managing
supply chain disruption risks. Management Science, 52(5), 639-657.
Vorst, J. G., & Beulens, A. J. (2002). Identifying sources of uncertainty to generate
supply chain redesign strategies. International Journal of Physical Distribution
and Logistics Management, 32(6), 409-430.
Wafukho, F. (2011). Effectiveness of lean sigma strategy on continues improvement at
GlaxoSmithKline. Unpublished MBA Research Project, University of Nairobi.
Wagner, S., & Bode, C. (2008). An empirical examination of supply chain performance
along several dimensions of risk. Journal of Business Logistics, 29(1), 307-325.
WHO, W. H. (2010). Kenya Pharmaceutical Country Profile. Geneva: WHO Press.
Retrieved June 16, 2013, from
http://apps.who.int/medicinedocs/documents/s17737en/s17737en.pdf
61
Wing, Y. H., Nouri, J. S., & Nilay, S. (2006). Objective-Oriented Dynamic Supply Chain
Modeling Incorporated with Production Scheduling. European Journal of
Operational Research, 169, 1064-1076.
Zhenxin, Y., Yan, H., & Cheng, T. (2001). Benefits of information sharing with supply
chain partnerships. Industrial Management & Data Systems, 101(3/4), 114-20.
Zsidisin, G. A., Panelli, A., & Upton, R. (2000). Purchasing organization involvement in
risk assessments, contingency plans, and risk management: an exploratory study.
Supply Chain Management: An International Journal, 5(4), 187-197.
62
APPENDIX 1
COMPLIMENTARY LETTER TO THE RESPONDENTS
Dear Sir/Madam,
To Whom It May Concern
The bearer of this letter……………………………………………………….
Registration Number………………………..Telephone……………………...
Is a Master of Business Administration (MBA) student at the University of Nairobi.
The student is required to submit, as part of the course work assessment, a research
project report on a given management problem. We would like the students to do their
projects on real life problems affecting firms in Kenya today. We would therefore
appreciate if you assist the student collect data in your organization to this end. The
results of the report will be used solely for purpose of the research and in no way will
your organization be implicated in the research findings. A copy of the report can be
availed to the interviewed organizations on request.
Yours respectfully,
The Coordinator,
MBA Programme
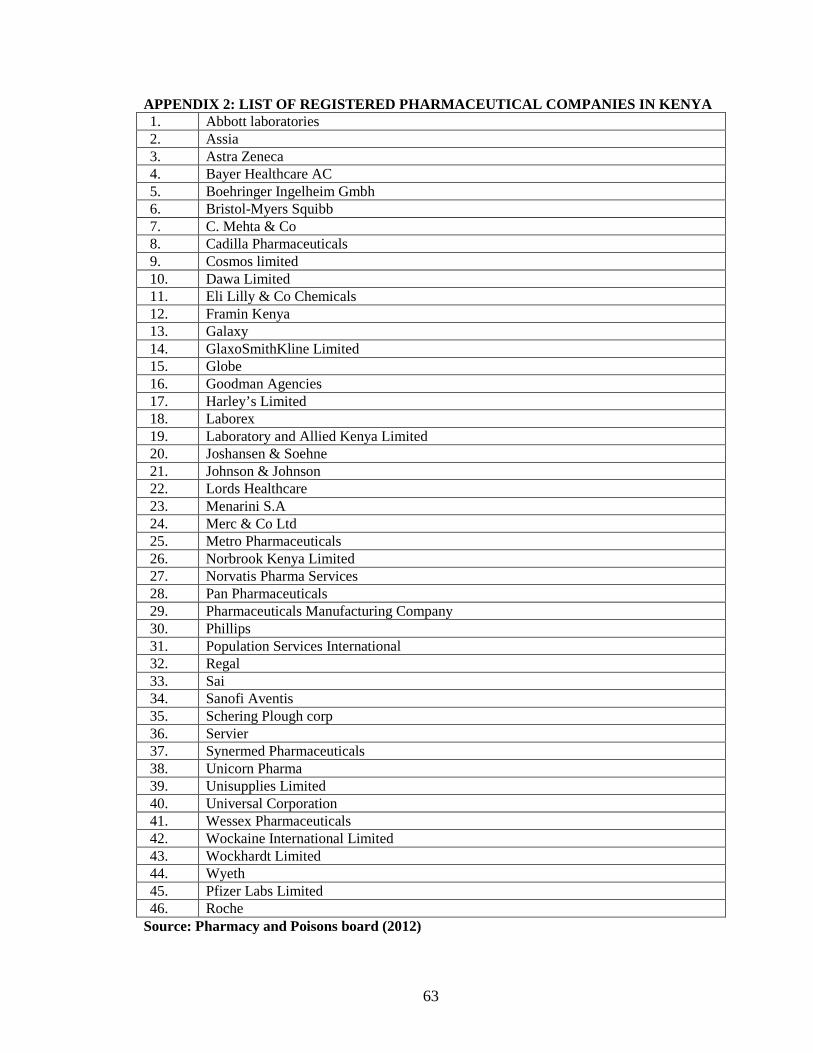
63
APPENDIX 2: LIST OF REGISTERED PHARMACEUTICAL COMPA NIES IN KENYA 1. Abbott laboratories 2. Assia 3. Astra Zeneca 4. Bayer Healthcare AC 5. Boehringer Ingelheim Gmbh 6. Bristol-Myers Squibb 7. C. Mehta & Co 8. Cadilla Pharmaceuticals 9. Cosmos limited 10. Dawa Limited 11. Eli Lilly & Co Chemicals 12. Framin Kenya 13. Galaxy 14. GlaxoSmithKline Limited 15. Globe 16. Goodman Agencies 17. Harley’s Limited 18. Laborex 19. Laboratory and Allied Kenya Limited 20. Joshansen & Soehne 21. Johnson & Johnson 22. Lords Healthcare 23. Menarini S.A 24. Merc & Co Ltd 25. Metro Pharmaceuticals 26. Norbrook Kenya Limited 27. Norvatis Pharma Services 28. Pan Pharmaceuticals 29. Pharmaceuticals Manufacturing Company 30. Phillips 31. Population Services International 32. Regal 33. Sai 34. Sanofi Aventis 35. Schering Plough corp 36. Servier 37. Synermed Pharmaceuticals 38. Unicorn Pharma 39. Unisupplies Limited 40. Universal Corporation 41. Wessex Pharmaceuticals 42. Wockaine International Limited 43. Wockhardt Limited 44. Wyeth 45. Pfizer Labs Limited 46. Roche
Source: Pharmacy and Poisons board (2012)
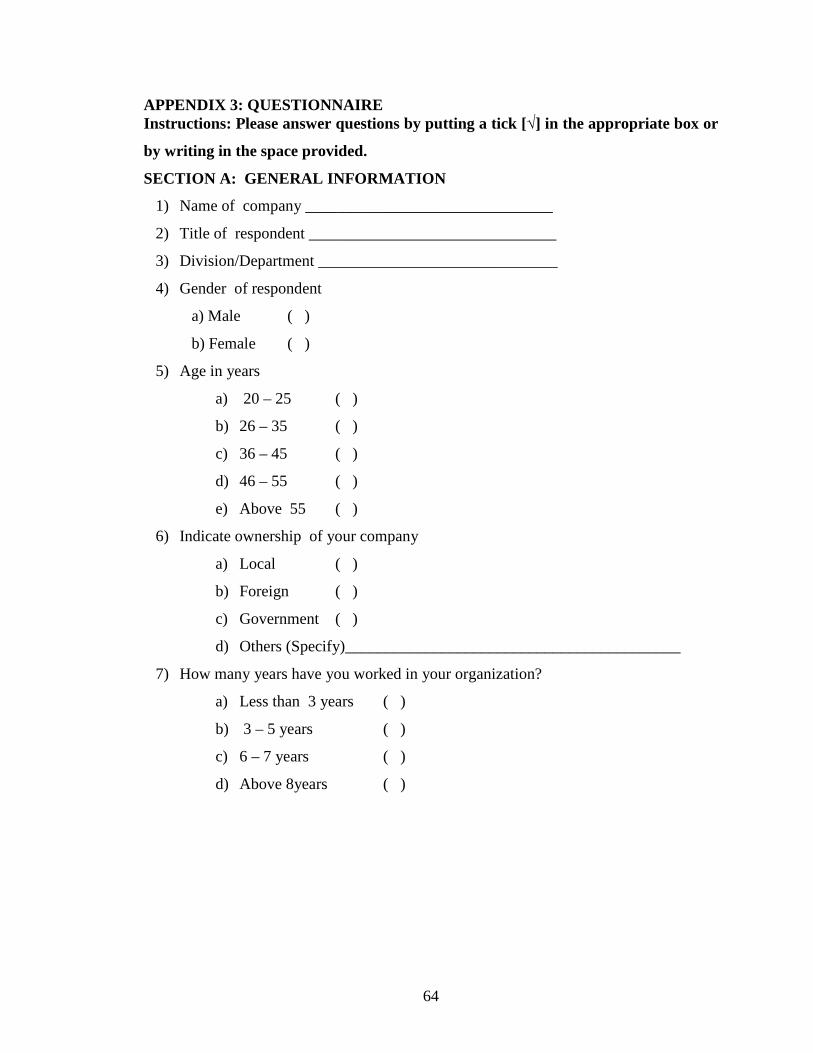
64
APPENDIX 3: QUESTIONNAIRE Instructions: Please answer questions by putting a tick [√] in the appropriate box or
by writing in the space provided.
SECTION A: GENERAL INFORMATION
1) Name of company _______________________________
2) Title of respondent _______________________________
3) Division/Department ______________________________
4) Gender of respondent
a) Male ( )
b) Female ( )
5) Age in years
a) 20 – 25 ( )
b) 26 – 35 ( )
c) 36 – 45 ( )
d) 46 – 55 ( )
e) Above 55 ( )
6) Indicate ownership of your company
a) Local ( )
b) Foreign ( )
c) Government ( )
d) Others (Specify)__________________________________________
7) How many years have you worked in your organization?
a) Less than 3 years ( )
b) 3 – 5 years ( )
c) 6 – 7 years ( )
d) Above 8years ( )

65
SECTION B: SUPPLY CHAIN RISK MANAGEMENT PROCESS
8) Using a scale of 1 – 5 where 1 is strongly agree, 2 – agree, 3 – Neutral, 4-
Disagree and 5 – strongly disagree, respond to the following statements that
describe supply chain risk management process in your organization.
1 2 3 4 5
a) The organization has a supply chain risk management leadership
team in place
b) There is risk management process in the organization.
c) Emerging risks form part of the risk agenda item in the monthly
risk management meeting
d) Organization has computerized risk management system
updated on regular basis.
e) There is proactive review of old risks and mitigation of the
same
f) Organization risk log is updated.
g) There are key performance indicators (KPIs) on supply chain
risk mitigation.
h) Each departmental manager in supply chain is accountable for
all risks (risk owners)
i) Risk owners present their own situation target proposal (STPs)
on how they will mitigate supply chain risk
j) Supply chain risks are mitigated when they fall due.
k) There is risk escalation process in place
l) Supply chain risk based audits are carried in organization.
m) Please rate the overall Supply chain risk management process of your company using
a scale of 1-5 whereby 1 very good, 2 good, 3 average, 4 bad, 5 very bad

66
SECTION C: SAFETY MANAGEMENT
9) To what extent do you agree with the following statements on Safety
Management in your organization? Use a scale of 1-5 where 1 – Strongly
agree, 2 – Agree, 3 – Neutral, 4 – Disagree, 5 – Strongly disagree
1 2 3 4 5
a) The organisation has defined and documented its Occupational
Health and Safety (OHS) policy.
b) There is evidence that safety management policy has been
communicated and implemented throughout the organisation.
c) The organisation has a procedure to identify the appropriate
OHS hazards and risks resulting from its activities.
d) Supply chain safety risk assessments in the organization
address: processes, facilities, contractors and off-site working.
e) All risks having legal and/or regulatory operational
requirements have been identified.
f) There is a mechanism for communicating relevant safety
information on legal and regulatory requirements to employees
and interested parties
g) OHS objectives have been established at each relevant function and
level in the organization
h)
Responsibilities and levels of authority for all personnel
managing OHS management system have been defined and
documented
i) Core elements of the safety management system and their
interaction, have been described in electronic form
j) Systems are in place to communicate relevant procedures and/or
requirements, regarding OHS hazards associated with
purchased: products, equipment and services.
k) Procedures have been implemented to identify the potential for
and response to incidents, accidents and emergencies
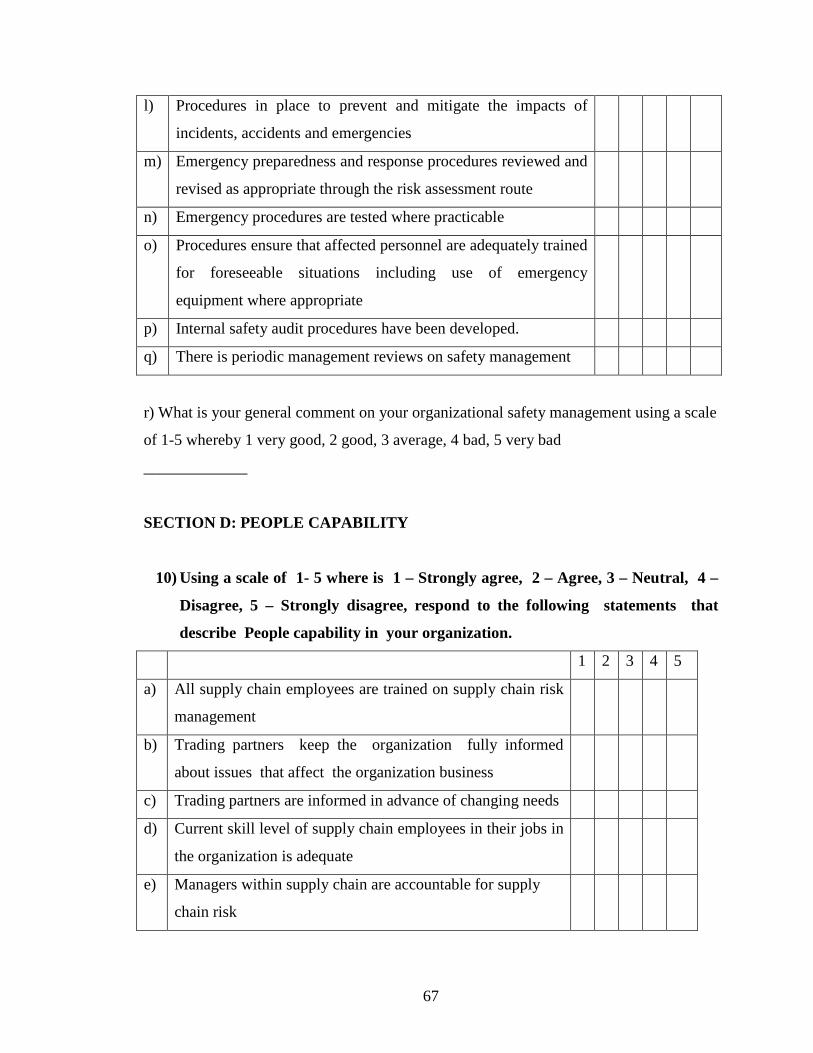
67
l) Procedures in place to prevent and mitigate the impacts of
incidents, accidents and emergencies
m) Emergency preparedness and response procedures reviewed and
revised as appropriate through the risk assessment route
n) Emergency procedures are tested where practicable
o) Procedures ensure that affected personnel are adequately trained
for foreseeable situations including use of emergency
equipment where appropriate
p) Internal safety audit procedures have been developed.
q) There is periodic management reviews on safety management
r) What is your general comment on your organizational safety management using a scale
of 1-5 whereby 1 very good, 2 good, 3 average, 4 bad, 5 very bad
_____________
SECTION D: PEOPLE CAPABILITY
10) Using a scale of 1- 5 where is 1 – Strongly agree, 2 – Agree, 3 – Neutral, 4 –
Disagree, 5 – Strongly disagree, respond to the following statements that
describe People capability in your organization.
1 2 3 4 5
a) All supply chain employees are trained on supply chain risk
management
b) Trading partners keep the organization fully informed
about issues that affect the organization business
c) Trading partners are informed in advance of changing needs
d) Current skill level of supply chain employees in their jobs in
the organization is adequate
e) Managers within supply chain are accountable for supply
chain risk
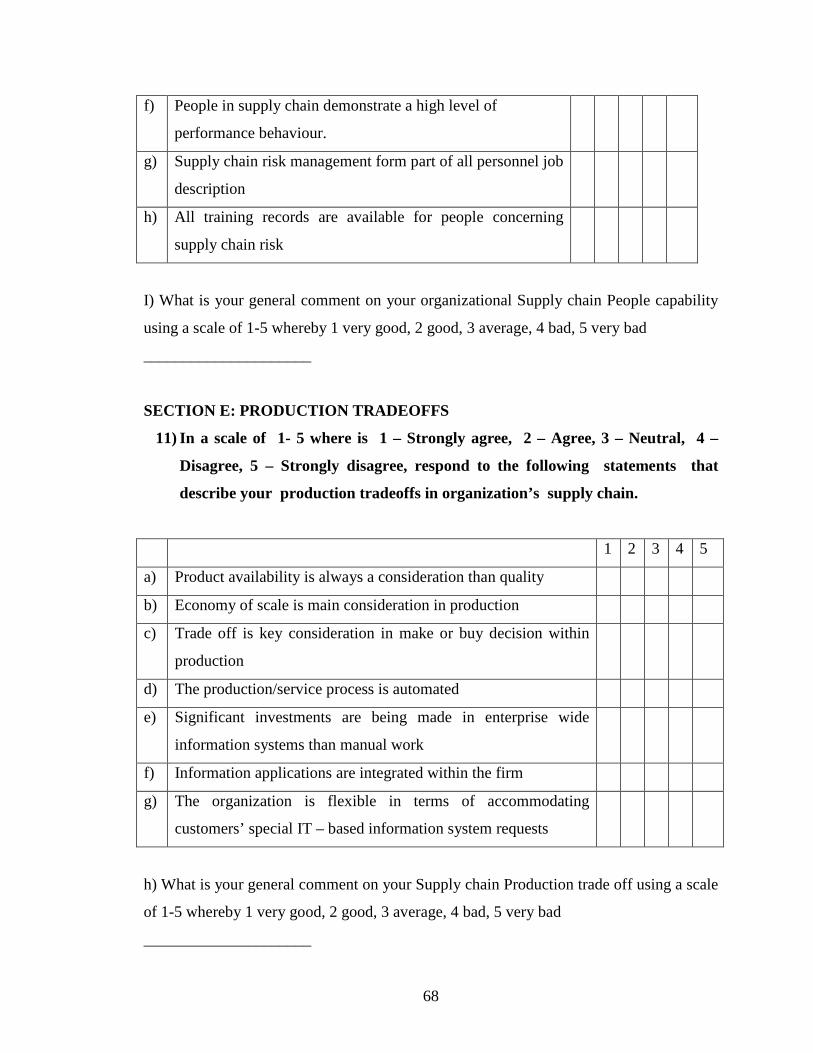
68
f) People in supply chain demonstrate a high level of
performance behaviour.
g) Supply chain risk management form part of all personnel job
description
h) All training records are available for people concerning
supply chain risk
I) What is your general comment on your organizational Supply chain People capability
using a scale of 1-5 whereby 1 very good, 2 good, 3 average, 4 bad, 5 very bad
_____________________
SECTION E: PRODUCTION TRADEOFFS
11) In a scale of 1- 5 where is 1 – Strongly agree, 2 – Agree, 3 – Neutral, 4 –
Disagree, 5 – Strongly disagree, respond to the following statements that
describe your production tradeoffs in organization’s supply chain.
1 2 3 4 5
a) Product availability is always a consideration than quality
b) Economy of scale is main consideration in production
c) Trade off is key consideration in make or buy decision within
production
d) The production/service process is automated
e) Significant investments are being made in enterprise wide
information systems than manual work
f) Information applications are integrated within the firm
g) The organization is flexible in terms of accommodating
customers’ special IT – based information system requests
h) What is your general comment on your Supply chain Production trade off using a scale
of 1-5 whereby 1 very good, 2 good, 3 average, 4 bad, 5 very bad
_____________________
69
SECTION F: SUPPLY CHAIN RISK MITIGATION CHALLENGES
12) Using a scale of 1- 5 where is 1 – Strongly agree, 2 – Agree, 3 – Neutral, 4 –
Disagree, 5 – Strongly disagree, respond to the following statements on the
challenges facing your organization in adoption of effective supply chain risk
mitigation
1 2 3 4 5
a) Lack of supply chain management knowledge
b) Lack of adequate resources to implement supply chain initiatives
sufficiently
c) Poor sales and operations planning process
d) Ethical responsibility problems in the supply chain
e) Inadequate supply chain performance measures
f) There is lack of trust among supply chain members
g) There is lack of cooperation among supply chain members
h) There is always stock availability to meet all customer full demand,
on time.
i) Lack of motivation among supply chain members
J) Customers’ geographical distance is high
k) Suppliers’ geographical distance is high
l) Inadequate information systems linkages within the supply chain
m) Conflicts among supply chain members
n) Lack of top management support
o) Government customs regulations impacting on the organization
supply chain
p) Poor visibility of demand
q) Terrorism is a key factor in supply chain buying and supply decision
r) Complexities in the supply chain
s) Inconsistent quality supplies
t) Lack of leverage within the organization’s supply chain
70
u) Short product life cycles
v) Dealing with counterfeit goods is fully aligned
w) Supply chain disruptions
x) Product recall incidences more often
y) Poor road Infrastructure resulting to delay in order delivery
z) What is your general comment on your organization Supply chain risk mitigation
challenges using a scale of 1-5 whereby 1 very good, 2 good, 3 average, 4 bad, 5 very bad
_____________________
13) Has your organization faced other challenges in trying to enhance effective supply
chain risk mitigation other than the ones mentioned above in question 12?
Yes ( )
No ( )
If yes, what are these challenges?
1.
2.
3.
4.
How does your company overcome supply chain risk mitigation challenges in one
above?
1.
2.
3.
4.
THANK YOU FOR YOUR PARTICIPATION