supply & demand analysis ms. stack fall 2008 economics
TRANSCRIPT
Supply & Demand AnalysisSupply & Demand Analysis
Ms. StackMs. StackFall 2008Fall 2008
Economics Economics

DEMANDDEMANDAssignment #1Assignment #1

Warm-upWarm-up
List 5 things that you have List 5 things that you have “demanded” in the past month – “demanded” in the past month – what do I mean by what do I mean by demanddemand??
Why do you demand (choose) Why do you demand (choose) one good over another – what one good over another – what are the factors/determinants in are the factors/determinants in why you buy something?why you buy something?
List 5 things you would demand List 5 things you would demand if scarcity did not exist.if scarcity did not exist.
What is “Demand?”What is “Demand?”
A willingness to buy a A willingness to buy a product at a certain priceproduct at a certain price
Demand is from the perspective Demand is from the perspective of theof the buyerbuyer
What are some examples of What are some examples of goods you demand as a goods you demand as a consumer? consumer?
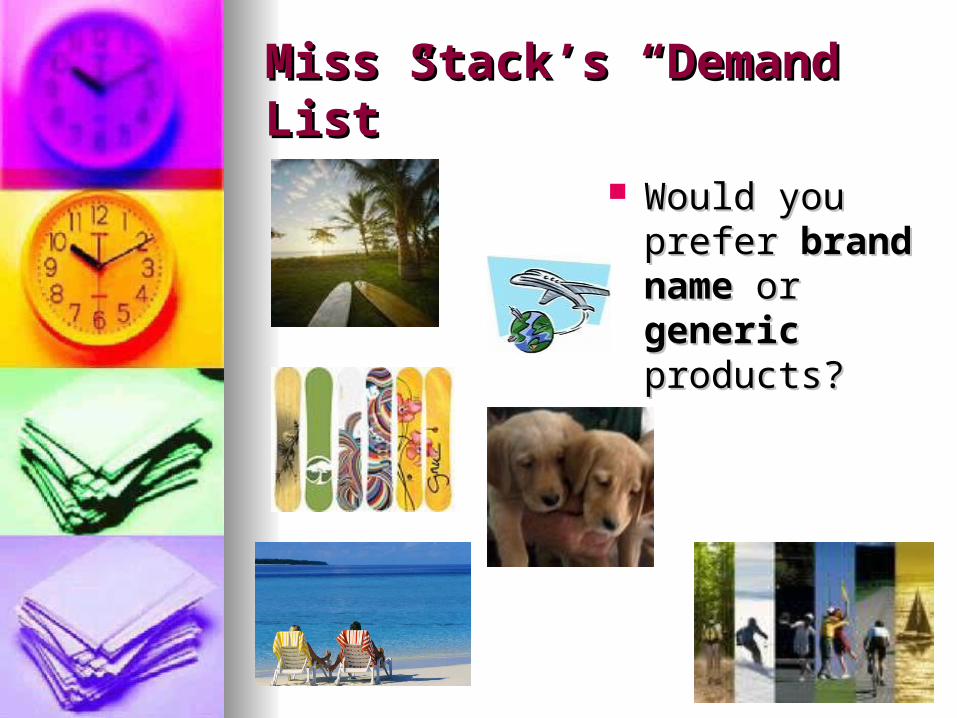
Miss Stack’s “Demand List”Miss Stack’s “Demand List”
Would you Would you prefer prefer brand brand name name or or generic generic products? products?
Law of DemandLaw of Demand
People will buy People will buy more of a more of a product at a product at a lower price than lower price than a higher pricea higher price
Why do you Why do you think this holds think this holds true? true?

Demand ScheduleDemand Schedule
Demand ScheduleDemand Schedule
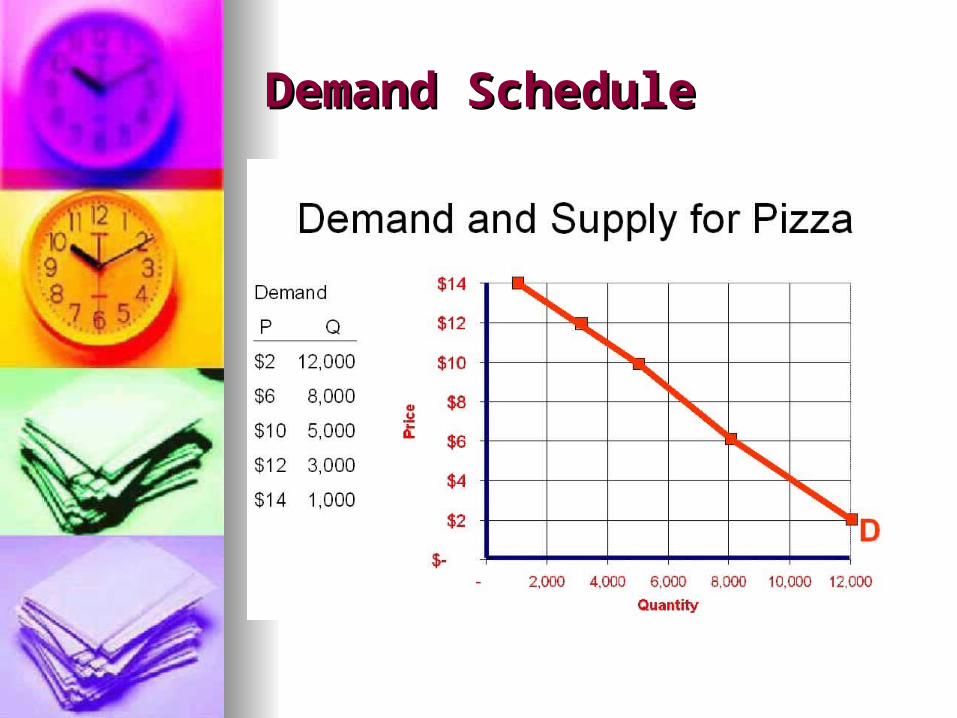
A list of quantity of a product A list of quantity of a product that people are wiling to buy at that people are wiling to buy at each priceeach price
At which price are consumers At which price are consumers willing to buy the LEAST willing to buy the LEAST pizzas? The MOST?pizzas? The MOST?
ONLY ONLY PRICESPRICES WILL CHANGE WILL CHANGE “QUANTITY DEMANDED”“QUANTITY DEMANDED”
Quantity DemandedQuantity Demanded
A movement along the Demand A movement along the Demand Curve that DOES NOT result in a Curve that DOES NOT result in a shift – a shift results ONLY when shift – a shift results ONLY when one of the one of the Determinants of Determinants of DemandDemand is affected is affected
A price change simply moves you A price change simply moves you to a new point on the SAME curveto a new point on the SAME curve
Demand Schedule ExampleDemand Schedule Example
Demand ScheduleDemand Schedule
A Shift/Change in DemandA Shift/Change in Demand
A A change in demand is change in demand is determined by a factor determined by a factor in the in the “Determinants of Demand”“Determinants of Demand”
The curve will either shift to the The curve will either shift to the left (decrease) left (decrease) or or right right (increase)(increase)
Determinants of DemandDeterminants of Demand
Consumer Tastes and Consumer Tastes and PreferencesPreferences
Potential CustomersPotential Customers Money Income of ConsumersMoney Income of Consumers Substitute GoodsSubstitute Goods Complementary GoodsComplementary Goods Price ExpectationsPrice Expectations
Tastes & PreferencesTastes & Preferences
People have different tastes & People have different tastes & preferencespreferences
Food, Music, Clothes, etcFood, Music, Clothes, etc Advertising, Fashion, & Fads Advertising, Fashion, & Fads
also influence your also influence your tastes and tastes and preferences preferences for a goodfor a good
Potential CustomersPotential Customers
A large number A large number of consumers of consumers can produce a can produce a greater demand greater demand for the goodfor the good
$ Income of Consumers$ Income of Consumers
If income increases, consumers If income increases, consumers will demand “normal goods” will demand “normal goods” instead of “inferior goods.”instead of “inferior goods.”
Normal goods=luxury goods– Normal goods=luxury goods– brand names (i.e. Guess?, brand names (i.e. Guess?, Levi’s, The Gap, Nordstrom’s) Levi’s, The Gap, Nordstrom’s)
Inferior goods=“non-brand Inferior goods=“non-brand name” goods (i.e. 99 cent store, name” goods (i.e. 99 cent store, Target, Outdoor Flea Markets) Target, Outdoor Flea Markets)
Substitute GoodsSubstitute Goods
If the price of one good increases, If the price of one good increases, the consumer will buy the alternative the consumer will buy the alternative (or “substitute”) good, instead.(or “substitute”) good, instead.
This usually happens with similar This usually happens with similar products.products.
If the price of a can of Coca-Cola If the price of a can of Coca-Cola increases to $2.00 while a can of increases to $2.00 while a can of Pepsi is $1.00 (and if you are Pepsi is $1.00 (and if you are indifferent between both), which one indifferent between both), which one would you choose? would you choose?
Complementary GoodsComplementary Goods
Some goods “go together.” They Some goods “go together.” They will “complement” one another.will “complement” one another.
If the price one complement If the price one complement good increases, the other good good increases, the other good will also increase (vice versa).will also increase (vice versa).
Examples:Examples:
--Cereal & Milk--Cereal & Milk --Cookies & Milk --Cookies & Milk
--Peanut Butter & Jelly--Peanut Butter & Jelly
Price ExpectationsPrice Expectations
If people expect that prices of a If people expect that prices of a good will increase, it will (and good will increase, it will (and vice versa).vice versa).
This will result in a change in This will result in a change in demand and shift the demand demand and shift the demand curve.curve.
Demand CurveDemand Curve
A downward sloping lineA downward sloping line As one variable goes up, the As one variable goes up, the
other variable goes downother variable goes down It slopes downward because
consumers buy less at higher prices, more at lower prices
The demand curve illustrates an The demand curve illustrates an inverse relationship between inverse relationship between price & quantityprice & quantity
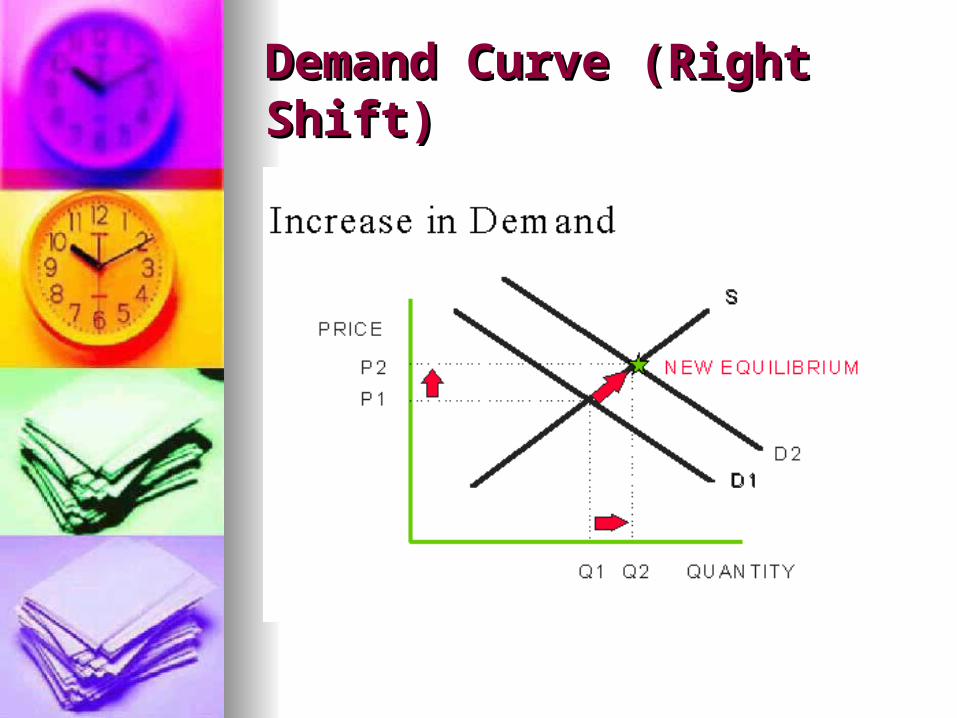
Demand Curve (Right Shift)Demand Curve (Right Shift)
Increases Increases in in Demand Curve Demand Curve will shift to the will shift to the rightright
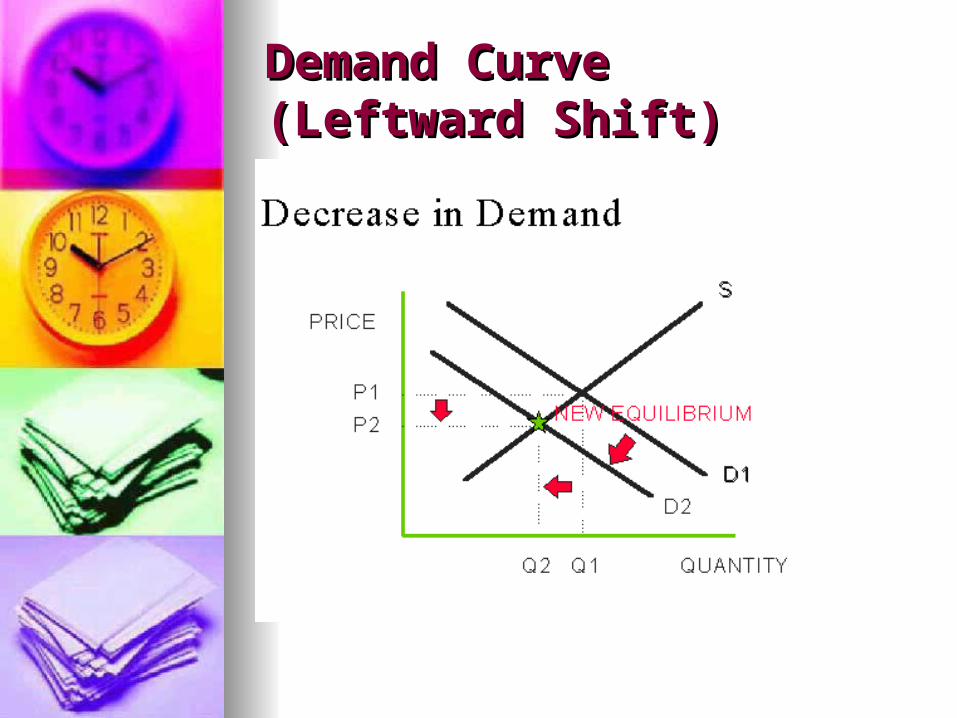
Demand CurveDemand Curve(Leftward Shift)(Leftward Shift)
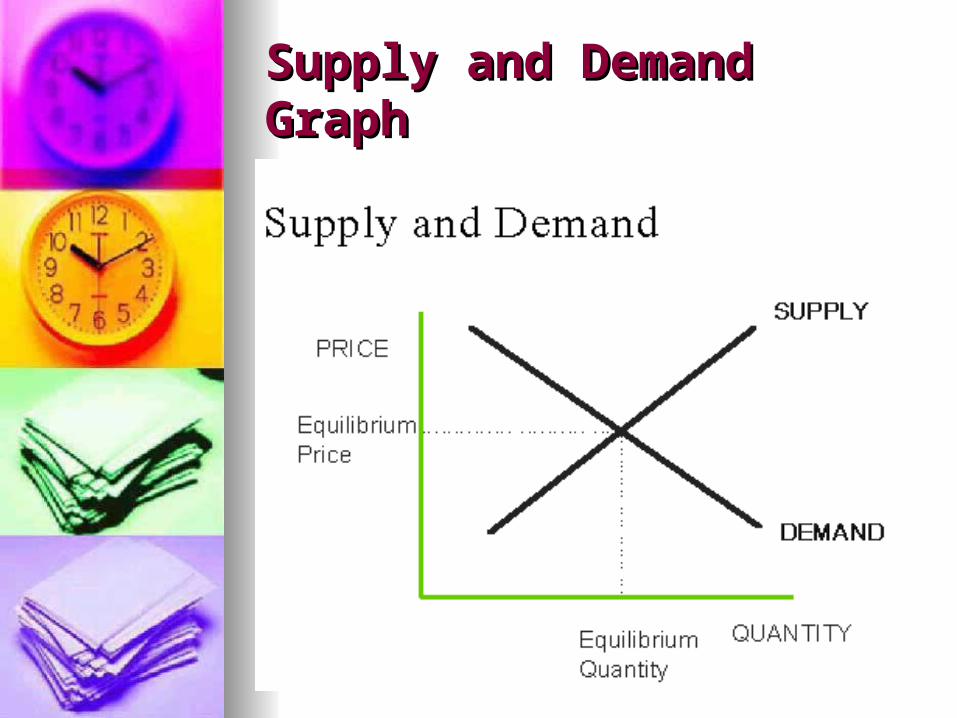
Supply and Demand GraphSupply and Demand Graph
Wrap-UpWrap-Up
When we study Demand we are looking at When we study Demand we are looking at whose perspective?whose perspective?
What is the difference between “Quantity What is the difference between “Quantity Demanded” and “Change in Demand?” Demanded” and “Change in Demand?”
What are the “Determinants of Demand?” What are the “Determinants of Demand?” Define “substitute goods” and give an Define “substitute goods” and give an
example.example. Define “complementary goods” and give an Define “complementary goods” and give an
example.example. Draw a Demand & Supply Graph-show Draw a Demand & Supply Graph-show
Prices, Quantity, & EquilibriumPrices, Quantity, & Equilibrium