supply of specialist subject teachers in secondary schools
TRANSCRIPT

Supply of specialist subject
teachers in secondary schools
Report to Parliament 2 : 2013–14

Queensland Audit Office
Location Level 14, 53 Albert Street, Brisbane Qld 4000
PO Box 15396, City East Qld 4002
Telephone (07) 3149 6000
Email [email protected]
Online www.qao.qld.gov.au
© The State of Queensland. Queensland Audit Office (2013)
Copyright protects this publication except for purposes permitted by the Copyright Act 1968.
Reproduction by whatever means is prohibited without the prior written permission of the
Auditor-General of Queensland. Reference to this document is permitted only with
appropriate acknowledgement.
Front cover image is an edited photograph of Queensland Parliament, taken by QAO.
ISSN 1834-1128


Contents
Summary .................................................................................................................................. 1
Conclusions ....................................................................................................................... 1
Key findings ....................................................................................................................... 2
Recommendations ............................................................................................................ 5
Reference to agency comments (Appendix A) ................................................................ 6
1. Context ............................................................................................................................. 7
1.1 Background ........................................................................................................... 7
1.2 Pre-service courses for secondary teachers ........................................................ 7
1.3 Audit objective, scope and approach .................................................................... 8
1.4 Structure of the report ........................................................................................... 8
2. Student performance ...................................................................................................... 9
2.1 Background ......................................................................................................... 10
2.2 Conclusions ........................................................................................................ 11
2.3 Achievement and participation ............................................................................ 11
3. Teacher capability and capacity .................................................................................. 15
3.1 Background ......................................................................................................... 16
3.2 Conclusions ........................................................................................................ 16
3.3 Data integrity and systems integration ................................................................ 17
3.4 Capability ............................................................................................................ 18
3.5 Capacity .............................................................................................................. 22
3.6 Recommendations .............................................................................................. 24
4. Future workforce supply and demand ........................................................................ 25
4.1 Background ......................................................................................................... 26
4.2 Conclusions ........................................................................................................ 26
4.3 Workforce planning ............................................................................................. 26
4.4 Recommendations .............................................................................................. 32
Appendices ............................................................................................................................ 33
Appendix A—Agency comments..................................................................................... 34
Appendix B—Audit details ............................................................................................... 44


Report 2 : 2013–14 | Queensland Audit Office 1
Summary
Employment in Science, Technology, Engineering and Mathematics (STEM) related industries has
grown more than twice as fast as the general labour market in the last decade. However, industry
groups report that the relative decline of STEM skills is causing frustration for employers. The
Department of Education, Training and Employment (DETE) also has identified shortages of
specialist subject teachers, including teachers of STEM subjects, in specific geographic locations.
Concurrently, Queensland students' achievement on international tests has not improved and
enrolments in senior mathematics and science subjects have declined.
All teachers train at university in general teaching skills, but secondary school teachers also
specialise in specific subjects. Generally, Queensland secondary teachers train in two
complementary subjects so they are able to teach more than one area; for example, English and
history, or mathematics and chemistry.
This approach to tertiary education means teachers acquire the ability to impart knowledge and
manage classrooms effectively as well as the specialist content knowledge and techniques needed
for their chosen subjects.
The objective of this audit was to examine how effectively DETE attracts and places specialist
subject teachers in secondary schools to maximise the academic outcomes of students. The audit
looked at the issue of supply and demand across specialist subject areas in secondary schools
generally, but focused on science and mathematics.
Conclusions Overall, the supply of secondary school teachers matches demand. However, when considered by
specialisation, there is a shortage of secondary mathematics, science and industrial design and
technology teachers and an oversupply of primary school teachers and of secondary physical
education and music, drama and dance teachers.
In practical terms, this means that not all schools are able to offer the full range of subjects they and
their students would like and teachers are teaching subjects outside their areas of expertise. While
this is more common in regional and remote schools, it also affects metropolitan schools.
The impact of the imbalance in the supply of specialist subject teachers is compounded by the way
that teachers are allocated to schools, which is in turn producing unsustainable outcomes. It leads to
too much reliance on a core of experienced and qualified teachers to provide informal mentoring and
retraining of teachers who have to teach subjects outside their field of expertise.
Reliable data on teachers' qualifications and competencies are also missing, exacerbating the
problem by hindering the department's ability to place the right teachers in the right schools and to
plan for future demand. This is also an issue of equity, as it ultimately means that the department is
unable to fully realise its strategic goal of providing universal access to high quality state education
in all secondary schools.
If Queensland is to remain competitive and provide students with opportunities to participate in a
broad based, strong economy, a new strategy for the delivery of STEM subjects in secondary
schools is needed.

2 Report 2 : 2013–14 | Queensland Audit Office
Key findings
Achievement and participation
The Trends in Mathematics and Science Study (TIMSS) is a project of the International Association
for the Evaluation of Educational Achievement. It is directed by the TIMSS International Study
Center at Boston College, and is administered in Australia by the Australian Council for Educational
Research (ACER). The study investigated a nationally representative sample of Year 4 and Year 8
students in relation to their mathematics and science achievement.
In 2012, ACER reported the achievement of Australian Year 4 and Year 8 students in mathematics
and science for 2011 compared to other countries. With an average mathematics score of 505,
Australian students performed at a significantly lower level than students in six countries: Korea,
Singapore, Chinese Taipei, Hong Kong, Japan and the Russian Federation. This is relatively better
than in 2007, when the United States, England and Hungary also outperformed Australia—in 2011,
their scores were not significantly different to that of Australia.
In Queensland, 41 per cent of all Year 8 students, at both state and independent schools, failed to
achieve the intermediate standard of the international benchmark. At the intermediate standard,
students can apply basic mathematical knowledge in a variety of situations. This ranks Queensland
behind New South Wales and the Australian Capital Territory where, respectively, 34 per cent and
26 per cent of Year 8 students failed to reach the intermediate standard. The average performance
of Australian Year 8 students has not changed since 1995.
Participation in senior mathematics and science subjects in Queensland has declined in the last ten
years. This is also a trend nationally and internationally. In 2002, 6 214 Queensland secondary state
school students completed mathematics B; in 2012, completions have declined by 11.3 per cent to
5 513 despite the overall number of Year 12 students in Queensland state secondary school
increasing by 15 per cent over this period.
Data integrity and integration
The data on teacher capability and competence are fragmented across four systems and, as a
result, cannot be integrated. The data held across these disparate systems are used to assess
teachers' capabilities when they:
apply for employment with DETE (TSS payroll system)
apply for transfers (MyHR Recruit)
nominate subjects for timetabling (OneSchool)
register for casual or contract work (TRACER).
The lack of integrated data on teacher capabilities and competencies creates inefficiencies for
regional human resource staff when helping principals to get the teachers with the qualifications and
experience they need to offer the subjects students want to take. It also increases the risk of
teachers being placed in schools without the capabilities and competencies requested.

Report 2 : 2013–14 | Queensland Audit Office 3
The data on teacher qualifications in these systems are also unreliable and incomplete. The key
data integrity issues we found were:
there were no records of their qualifications for 233 of the 30 218 secondary teachers in the
department's database
seven per cent of the qualifications of secondary teachers were recorded in TSS without sighting
evidence to confirm the qualification
the qualifications for 19 per cent of secondary teachers, teaching senior biology, senior
chemistry, mathematics B, junior mathematics and science in semester one 2013, did not show
whether they had specialised in mathematics or science in their degrees
of the teachers in the seven schools we visited, teacher qualifications were not entered for five
per cent and were out of date for 23 per cent.
Unreliable data on teacher capability and competence reduce the value of the information for
forecasting future secondary teacher demand as DETE cannot accurately profile its secondary
teaching workforce. Without accurate and detailed assessments of teacher capability and
competence, where they are placed and when they are likely to retire, DETE cannot develop
appropriate and proportionate strategies to ensure the future supply will be able to meet demand.
Teaching out of field
Teaching out of field occurs when a qualified and / or experienced teacher is not available, requiring
a teacher who has not formally demonstrated that he or she has the specific content knowledge and
teaching techniques to teach the subject.
Teaching out of field is relatively common in Australia compared with Northern European and East
Asian countries. In the 2011 cycle of TIMSS, 34 per cent of Year 8 Australian students who
participated in the test had an out of field mathematics teacher, while internationally the average was
12 per cent.
While all teachers in Queensland must meet the requirements for teacher registration, each school's
principal determines the subjects and year levels teachers at that school will teach. In 2010,
24 per cent of permanent secondary teachers reported they were teaching at least one subject out
of field. At the secondary schools visited, 49 per cent of the teachers taking mathematics were
teaching out of field.
The data indicate that teaching out of field is more common in junior secondary subjects. In 2010,
12.5 per cent of mathematics B teachers reported they were teaching out of field, while 36.5 per cent
of junior mathematics teachers reported they were teaching out of field. The analysis of 2013 data
from the department's school database OneSchool found that:
at least 18 per cent of mathematics B teachers were teaching out of field (the data for 12 per cent
were incomplete)
at least 46 per cent of junior mathematics teachers were teaching out of field (the data for 16 per
cent were incomplete).
4 Report 2 : 2013–14 | Queensland Audit Office
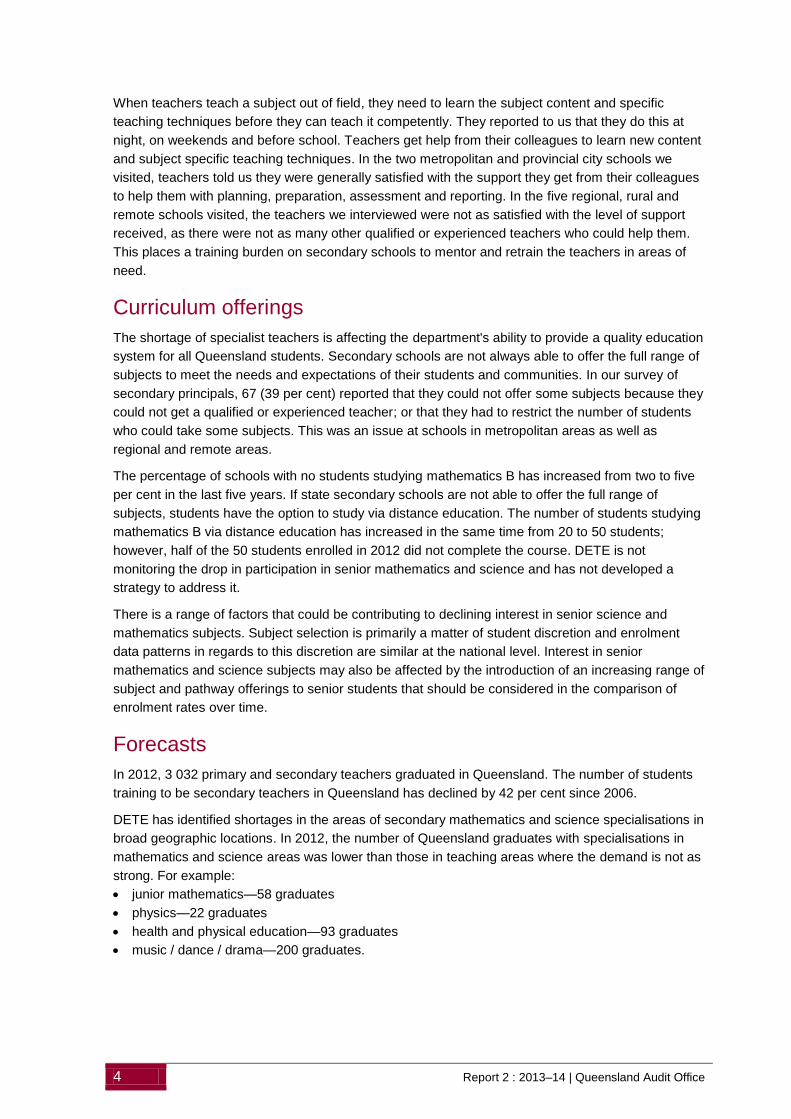
When teachers teach a subject out of field, they need to learn the subject content and specific
teaching techniques before they can teach it competently. They reported to us that they do this at
night, on weekends and before school. Teachers get help from their colleagues to learn new content
and subject specific teaching techniques. In the two metropolitan and provincial city schools we
visited, teachers told us they were generally satisfied with the support they get from their colleagues
to help them with planning, preparation, assessment and reporting. In the five regional, rural and
remote schools visited, the teachers we interviewed were not as satisfied with the level of support
received, as there were not as many other qualified or experienced teachers who could help them.
This places a training burden on secondary schools to mentor and retrain the teachers in areas of
need.
Curriculum offerings
The shortage of specialist teachers is affecting the department's ability to provide a quality education
system for all Queensland students. Secondary schools are not always able to offer the full range of
subjects to meet the needs and expectations of their students and communities. In our survey of
secondary principals, 67 (39 per cent) reported that they could not offer some subjects because they
could not get a qualified or experienced teacher; or that they had to restrict the number of students
who could take some subjects. This was an issue at schools in metropolitan areas as well as
regional and remote areas.
The percentage of schools with no students studying mathematics B has increased from two to five
per cent in the last five years. If state secondary schools are not able to offer the full range of
subjects, students have the option to study via distance education. The number of students studying
mathematics B via distance education has increased in the same time from 20 to 50 students;
however, half of the 50 students enrolled in 2012 did not complete the course. DETE is not
monitoring the drop in participation in senior mathematics and science and has not developed a
strategy to address it.
There is a range of factors that could be contributing to declining interest in senior science and
mathematics subjects. Subject selection is primarily a matter of student discretion and enrolment
data patterns in regards to this discretion are similar at the national level. Interest in senior
mathematics and science subjects may also be affected by the introduction of an increasing range of
subject and pathway offerings to senior students that should be considered in the comparison of
enrolment rates over time.
Forecasts
In 2012, 3 032 primary and secondary teachers graduated in Queensland. The number of students
training to be secondary teachers in Queensland has declined by 42 per cent since 2006.
DETE has identified shortages in the areas of secondary mathematics and science specialisations in
broad geographic locations. In 2012, the number of Queensland graduates with specialisations in
mathematics and science areas was lower than those in teaching areas where the demand is not as
strong. For example:
junior mathematics—58 graduates
physics—22 graduates
health and physical education—93 graduates
music / dance / drama—200 graduates.
Report 2 : 2013–14 | Queensland Audit Office 5
DETE forecasts supply and demand at a state level for all sectors of school education: primary,
secondary and special schools. The forecasts consider supply from Queensland universities and
demand arising from student enrolment growth, historical teacher separation rates and teacher
qualifications from a survey of teachers conducted most recently in 2010. The forecasts anticipate
statewide demand for teachers in specialist subject areas where shortages have been reported by
regional staffing officers and schools.
Without detailed and current forecasts of teacher demand by subject, the department is unable to
develop integrated workforce plans at the state, regional and school levels. Strategies to attract the
right teachers to the right schools at the right time could be designed better if forecasts included a
greater level of detail. Scholarship programs for new teachers and retraining for teachers wanting to
develop their expertise in new subject areas could be targeted better if reliable forecasts identified
where they will be needed.
DETE has identified the need to improve teacher supply. It offers scholarships to increase supply in
in broad locations and subject areas of identified demand and promotes teaching at career days
through the Make a difference. Teach strategy. The scholarship programs have resulted in 196
successful completions.
DETE established The Teacher Education Centres of Excellence in 2010. The centres across the
state focus on quality teaching behaviour management and a mentored induction into teaching. In
2012 and 2013, 174 graduates participated in the program.
On 22 July 2013, A Fresh Start Strategy was released. It includes eight initiatives on teacher supply,
initial teacher education and effective mentoring and induction. The effect of the new strategy has
not been included in the scope of this audit as it is too early to assess its effectiveness on teacher
supply.
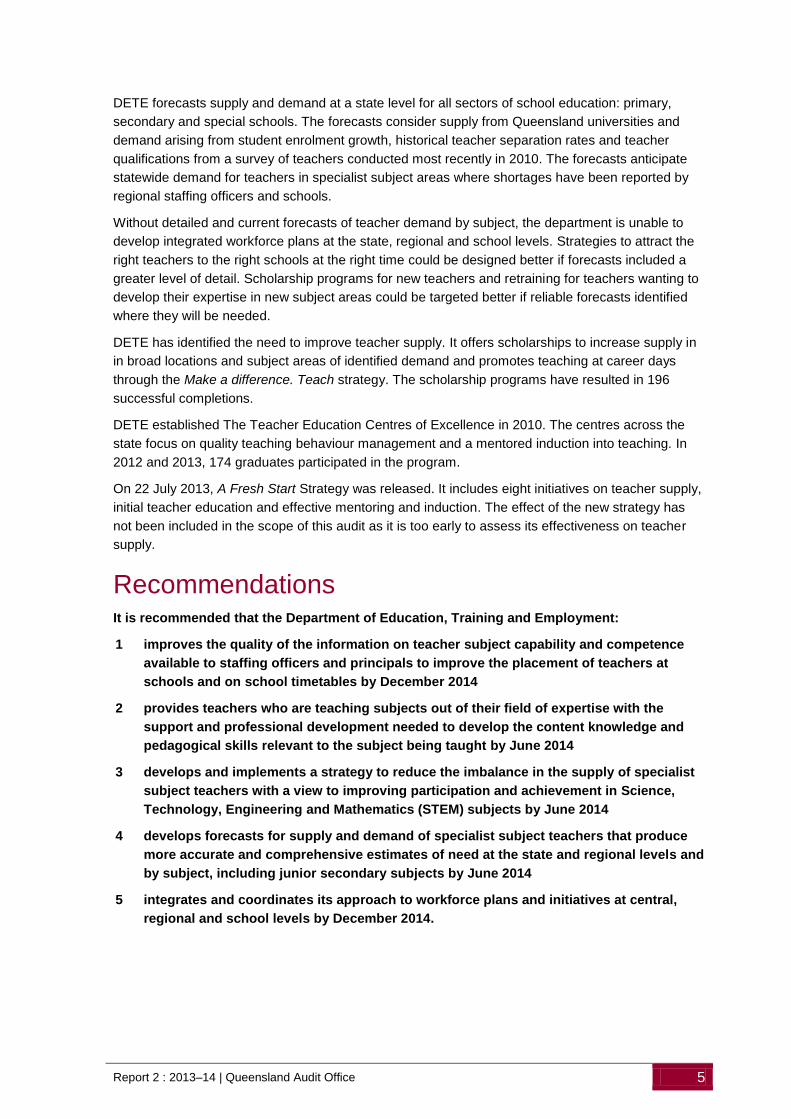
Recommendations It is recommended that the Department of Education, Training and Employment:
1 improves the quality of the information on teacher subject capability and competence
available to staffing officers and principals to improve the placement of teachers at
schools and on school timetables by December 2014
2 provides teachers who are teaching subjects out of their field of expertise with the
support and professional development needed to develop the content knowledge and
pedagogical skills relevant to the subject being taught by June 2014
3 develops and implements a strategy to reduce the imbalance in the supply of specialist
subject teachers with a view to improving participation and achievement in Science,
Technology, Engineering and Mathematics (STEM) subjects by June 2014
4 develops forecasts for supply and demand of specialist subject teachers that produce
more accurate and comprehensive estimates of need at the state and regional levels and
by subject, including junior secondary subjects by June 2014
5 integrates and coordinates its approach to workforce plans and initiatives at central,
regional and school levels by December 2014.
6 Report 2 : 2013–14 | Queensland Audit Office
Reference to agency comments (Appendix A) In accordance with section 64 of the Auditor-General Act 2009, a copy of this report was provided to
the Department of Education, Training and Employment with a request for comments.
Its views have been considered in reaching our audit conclusions and are represented to the extent
relevant and warranted in preparing this report.
The full comments received are included in Appendix A of this report.

Report 2 : 2013–14 | Queensland Audit Office 7
1 Context
1.1 Background The Department of Education, Training and Employment Strategic Plan 2012–16 objective for
school education is that every young Queenslander will be prepared with the educational
foundations for successful transitions to further education, training and work.
The department intends to achieve this through a range of strategies, including the attraction,
retention and development of high quality teachers, supporting high quality teaching practices and
fostering a culture of high expectations and enhanced school performance.
The Queensland College of Teachers (QCT) sets minimum qualification requirements for the
registration of teachers. QCT does not set or recommend specific qualifications for specialist subject
areas. A registered teacher can be employed to teach any subject at any year level in a school. The
school / employer ultimately decides the specific subjects, grades or classes assigned to a
registered teacher. Queensland state schools recruit from the pool of teacher applicants coordinated
by regional human resources teams at DETE and must consider applicants from the transfer pool.
1.2 Pre-service courses for secondary teachers Universities are autonomous institutions with distinctive missions. They determine the number of
available enrolments for primary and secondary pre-service teaching courses. There are many
different teacher education programs offered by Queensland and interstate universities. All of these
programs incorporate learning how to teach and practical experience in schools. There are a
number of possible pathways to become a qualified secondary teacher in Queensland:
students complete a four year undergraduate pre-service teacher education degree; for example,
a Bachelor of Education
students study two degrees at the same time (dual degree); for example, a Bachelor of Arts with
a Bachelor of Education
students complete an academic degree in a non-education area (for example, a Bachelor of
Science) and then complete a postgraduate, pre-service teacher education degree program; for
example, a one year Graduate Diploma in Education.
The undergraduate program of study enables students to develop the skills and knowledge for a
career in two subjects at secondary level. Students receive off campus professional experience and
learning in secondary schools to develop their practical teaching skills and ensure that they become
competent and confident in classroom teaching.
Universities have provision for both majors and minors to be taken as part of a study program. A
major indicates a series of units in which a student specialises during his or her university degree.
Completing a major usually involves successfully completing approximately six to eight units in a
particular study area. A minor indicates a subject area of secondary specialisation within a university
degree. It requires fewer units of study than a major, but enables an additional study area to be
included in a degree. A minor normally consists of between two and four units.
The postgraduate program provides professional preparation for teaching in secondary school
settings and is designed for graduates from a non-education background wishing to teach in
secondary contexts. The program includes education studies, curriculum studies in two nominated
teaching areas and professional experience in secondary school settings.
8 Report 2 : 2013–14 | Queensland Audit Office
Teaching secondary specialist subjects such as mathematics and science can be highly technical
and challenging. The content knowledge and teaching skills developed during pre-service education
and training are very important; for example, the description of the teacher pre-service course at
Griffith University identifies that a mathematics teacher requires a strong tertiary foundation in skills,
knowledge and teaching methods specific to mathematics. The pre-service course will allow
teachers to help their students develop their mathematical skills by exploring, calculating,
representing and measuring the world around them.
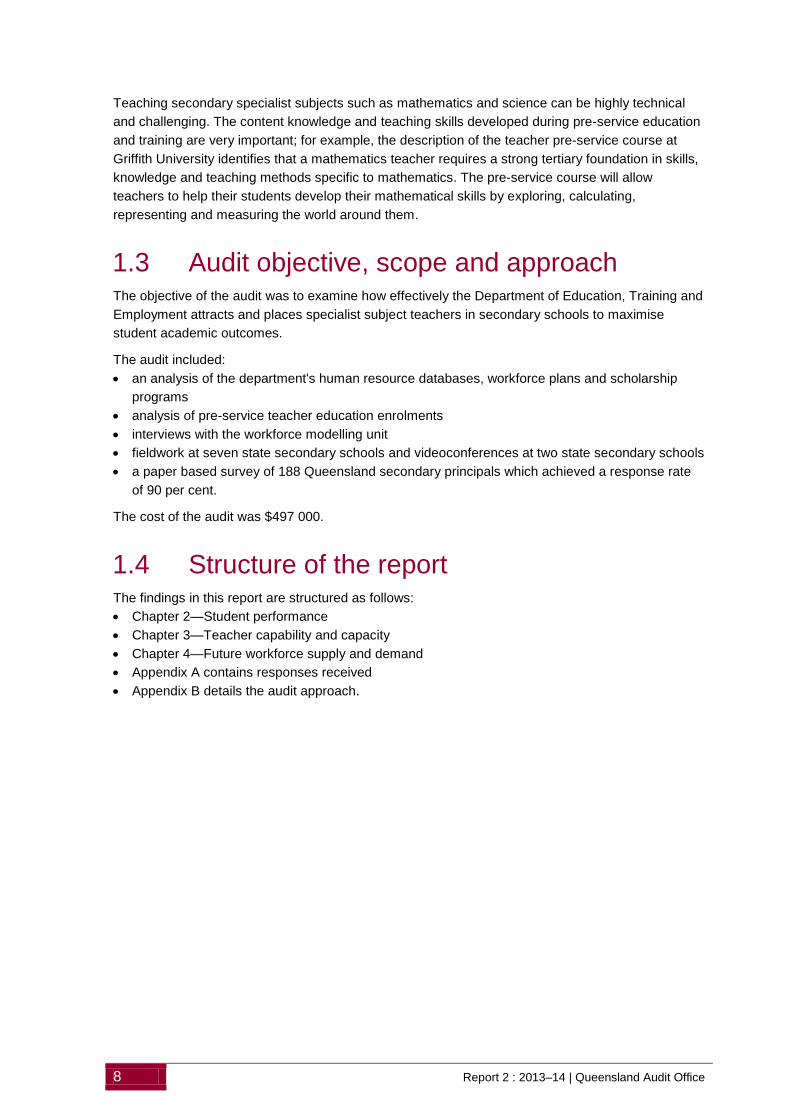
1.3 Audit objective, scope and approach The objective of the audit was to examine how effectively the Department of Education, Training and
Employment attracts and places specialist subject teachers in secondary schools to maximise
student academic outcomes.
The audit included:
an analysis of the department's human resource databases, workforce plans and scholarship
programs
analysis of pre-service teacher education enrolments
interviews with the workforce modelling unit
fieldwork at seven state secondary schools and videoconferences at two state secondary schools
a paper based survey of 188 Queensland secondary principals which achieved a response rate
of 90 per cent.
The cost of the audit was $497 000.
1.4 Structure of the report The findings in this report are structured as follows:
Chapter 2—Student performance
Chapter 3—Teacher capability and capacity
Chapter 4—Future workforce supply and demand
Appendix A contains responses received
Appendix B details the audit approach.

Report 2 : 2013–14 | Queensland Audit Office 9
2 Student performance
In brief
Background
In 2001–02, 8.1 per cent of the Queensland workforce was employed in occupations using
Science, Technology, Engineering and Mathematics (STEM) skills. This has grown to 10.5
per cent in 2011–12.
The growth in demand for STEM skills in economically important industries places added
significance on student participation rates and academic achievement in this area.
Conclusions
Demand for a workforce with STEM skills is increasing but the supply is reducing. This is
restricting Queensland's ability to compete in a global economy. The absence of a whole-of-
government plan or strategy to improve participation or achievement in STEM subjects in
Queensland is likely to worsen the gap between demand and supply.
Key findings
In 2011, 41 per cent of Queensland Year 8 students who participated in the Trends in
Mathematics and Science Study (TIMSS) failed to achieve the intermediate standard in
mathematics and only six per cent achieved the advanced standard on international
assessments.
Participation in senior mathematics and science subjects has declined in terms of
participation rates and actual completions.
Industry groups are reporting shortages of workers with STEM skills.

10 Report 2 : 2013–14 | Queensland Audit Office
2.1 Background Science, Technology, Engineering and Mathematics (STEM) skills are developed in the following
fields: science – general; mathematical sciences; physical sciences; chemical sciences; earth
sciences; biological sciences; information, computing and communication sciences; engineering and
technology; and agricultural, veterinary and environmental sciences. These subjects are considered
necessary for the development of knowledge economies, essential in promoting innovation and
increasing productivity.
The Queensland Chief Scientist, in his annual report for 2011, made the following comments about
the value of STEM skills at the school level:
‘STEM - which 80 per cent of Australians believe to be “very important, or critical to our
economy” - we are challenged. Only a mere 3 per cent of Queensland Year 8 maths
students positioned themselves over the advanced benchmark on the last TIMSS
international test. Compare this, for example, to neighbouring Singapore where 30 per cent
of Year 8 maths students make the advanced cut. But this sobering statistic is probably not
surprising, considering that only 27 per cent of Queensland maths students are taught by
teachers who hold post-secondary qualifications in mathematics, where the international
OECD average is 70 per cent.’
2.1.1 STEM skills for the Queensland economy
In its report, Lifting our Science, Technology, Engineering and Maths (STEM) Skills released 21
March 2013, the Australian Industry Group estimated that 75 per cent of the fastest growing
occupations require STEM skills and knowledge. The report identified that young people in schools
and students at universities are not acquiring the STEM skills needed for Australia’s future
prosperity.
Figure 2A provides a breakdown of the areas of shortages reported by business type.
Figure 2A Shortages of STEM skills by business type, 2012
Source: Australian Industry Group
The importance of STEM skills for students undertaking tertiary studies is well acknowledged by
employer and industry groups. STEM skills are also essential for a range of other occupations.
Figure 2B lists occupations where STEM skills are becoming increasingly necessary.
05
1015202530354045
Professionals Managers Machineryoperators and
drivers
Sales workers Labourers
Pe
rce
nta
ge
of
res
po
nd
en
ts
NSW VIC QLD SA WA TAS Weighted national

Report 2 : 2013–14 | Queensland Audit Office 11
Figure 2B Occupations requiring STEM skills
Occupations
electrical engineering technicians mining engineers
agricultural and forestry scientists chemists and food and wine scientists
environmental scientists ICT business and systems analysts
software and applications programmers database and systems administrators
architectural, building and surveying
technicians
mechanical engineering draftspersons and
technicians
metal casting, forging and finishing trades
workers
toolmakers and engineering
patternmakers
electricians telecommunications trades workers
Source: South Australian Department of Further Education, Employment, Skills and Training
2.2 Conclusions Mathematics and science achievement levels in Queensland have not improved since 1995 and
remain below the achievement of the other mainland eastern seaboard states and territories and
also below that of comparable countries. Over this period, student participation rates in senior
mathematics and science also substantially declined. The correlation between these two metrics
indicates they have a common underlying cause; the most likely cause is the shortage of adequately
qualified teachers, especially in mathematics and science.
2.3 Achievement and participation In Queensland, the proportion of students studying mathematics and science subjects in Year 12 is
declining. This is a trend nationally and internationally.
There also has been no discernible improvement in overall academic attainment in mathematics and
science for the past decade.
2.3.1 Achievement in mathematics and science
The Trends in International Mathematics and Science Study (TIMSS) is an international study
directed by the International Association for the Evaluation of Educational Achievement, an
independent cooperative of national research institutions and government agencies. The association
has been conducting studies of cross national achievement in a wide range of subjects since 1959.
TIMSS has been conducted at Year 4 and Year 8 on a four year cycle since 1995.
In 2011, 45 countries including Australia participated in the Year 8 TIMSS assessment. Australia has
participated in TIMSS since its inception, providing rich data about trends in mathematics and
science achievement over 16 years. To inform educational policy in the participating countries, these
worldwide assessment and research projects also routinely collect extensive background information
that addresses concerns about the quantity, quality and content of the subjects they teach.

12 Report 2 : 2013–14 | Queensland Audit Office
The Australian Council for Educational Research (ACER) report shows that Australia’s scores in
mathematics and science have largely remained unchanged over the past 16 years. The report
states that:
‘It is clear that in both mathematics and science, Australia has a substantial ‘tail’ of
underperformance. For such a highly developed country, this level of underperformance is
not acceptable and its minimisation should become a priority.’
The report states that around one third of Australian Year 8 students are being taught by teachers
who have no content or pedagogical training in mathematics. It goes on to conclude that, without
strong pedagogical and content knowledge, teachers will be more likely to teach to the middle,
failing to provide adequate extension for high achieving students and unable to provide alternative
structures for students who are having difficulties.
In the TIMSS Report 2011, Australia’s achievement in Year 8 mathematics was ranked 12 of the
42 participating countries, ahead of New Zealand, Sweden and Romania, but significantly behind
Korea, Singapore, Chinese Taipei, Hong Kong, Japan and the Russian Federation.
Figure 2C illustrates Year 8 mathematics achievement at each benchmark. In 2011, 41 per cent of
Year 8 Queensland students fell below the intermediate standard for this international benchmark.
This result has not changed markedly since 1995. The Australian Capital Territory significantly
exceeded this benchmark, outperforming all other jurisdictions. Queensland’s results were slightly
below New South Wales, Victoria and Western Australia. Students from Tasmania and the Northern
Territory were significantly behind the other states and territories.
In New South Wales and the Australian Capital Territory, 34 per cent and 26 per cent of students did
not reach the intermediate standard. The only significant changes over time were declines in South
Australia and Western Australia from the TIMSS 1995 score to the TIMSS 2011 score.
Figure 2C Proportion of students meeting international benchmarks for Year 8 mathematics, 2011
Source: ACER 2012
25
1
11
8
12
21
18
13
12
12
10
10
8
29
6
26
24
23
35
33
29
29
27
26
24
18
29
16
34
38
33
31
31
37
32
37
38
32
31
14
30
20
23
24
12
15
18
20
19
19
21
29
3
47
9
7
8
1
3
3
6
5
8
13
14
International Median
Korea
Australia
United States
England
NT
TAS
SA
QLD
WA
VIC
NSW
ACT
Below Low Low Intermediate High Advanced

Report 2 : 2013–14 | Queensland Audit Office 13
2.3.2 Participation in mathematics and science
Research, internationally and in Australia, has not identified conclusively why science and
mathematics disciplines are not attracting graduates.
In 2006, the Queensland Government introduced changes to the Education Act (General Provisions)
2006, making it compulsory for students to participate in 'learning or earning'. This means that after
students stop being of compulsory school age (16 years or completing year 10), they still must
participate in education and training for another two years which could be an educational program
provided by a state, non-state school or university, a vocational course, apprenticeship, traineeship
or employment skills development program.
This phase ends when students:
gain a Senior Certificate
gain a particular vocational qualification (such as a Certificate III or higher level)
attend for two years after students stopped being of compulsory school age or
turn 17 years.
Figure 2D shows enrolments in Year 12 have increased by 15.7 per cent in the last decade and the
numbers of students completing mathematics B and physics have decreased. The proportion of
students completing senior mathematics B in state secondary schools fell by 11.2 per cent; and in
physics by five per cent.
Figure 2D Completions in senior mathematics and science at state secondary schools, 2002–2012
Total students Mathematics B % of total Physics % of total
2012 27 334 5 513 20.1 2 712 9.9
2002 23 612 6 214 26.3 2 855 12.0
Change (Number)
3 722 (701) (143)
Change (%) 15.7 (11.2) (5.0)
Source: QAO based on Queensland Studies Authority data
Figure 2E shows that there has been a persistent downward trend in the proportion of students
studying mathematics in Year 12 for more than a decade. It is unclear why there was an increase in
mathematics B between 2011 and 2012. Figure 2F shows this trend also holds for students studying
science subjects. Figure 2G shows that the decline in remote and rural areas has occurred at a
faster rate; but these numbers need to be treated with care as the small number of students,
particularly in very remote schools, makes the trends volatile and they may also be affected by
student enrolments in distance education courses.

14 Report 2 : 2013–14 | Queensland Audit Office
Figure 2E Student participation in Year 12 mathematics, state secondary schools 1999–2012
Source: Queensland Studies Authority
Figure 2F Students participation in Year 12 science subjects, state secondary schools 1999–2012
Source: Queensland Studies Authority
Figure 2G Student participation in mathematics B, state secondary schools, 1999–2012
Source: Queensland Studies Authority
0%
10%
20%
30%
40%
1999 2000 2001 2002 2003 2004 2005 2006 2007 2008 2009 2010 2011 2012
Mathematics B Mathematics C
0%
10%
20%
30%
40%
1999 2000 2001 2002 2003 2004 2005 2006 2007 2008 2009 2010 2011 2012
Biology Chemistry Physics
0%
5%
10%
15%
20%
25%
30%
35%
1999 2000 2001 2002 2003 2004 2005 2006 2007 2008 2009 2010 2011 2012
Metropolitan Provincial Remote Very remote

Report 2 : 2013–14 | Queensland Audit Office 15
3 Teacher capability and capacity
In brief
Background
The Department of Education, Training and Employment (DETE) provides education to over
178 000 secondary students at 270 schools across the state. Students study a range of
subjects from mathematics and science to arts and drama.
Conclusions
The department needs the right teachers with the right qualifications and experience in the
right schools to provide universal access to a quality education. The current model of staffing
secondary schools is not ensuring that teachers have the specific subject content knowledge
or the teaching techniques for all the subjects they teach.
Students in some schools are disadvantaged by not having access to a qualified and
experienced specialist subject teacher or the full range of subjects. This issue of lack of
access is more prevalent in rural and remote areas but also affects metropolitan schools.
Inequality of access is restricting students' ability to gain the skills and knowledge needed to
participate in workplaces that are increasingly demanding scientific and technological
competencies. This could reduce public confidence in the quality of education provided by
state secondary schools.
Key findings
There are not enough specialist mathematics and science teachers for all Queensland
schools; 12.5 per cent of Queensland mathematics B teachers and 36.5 per cent of junior
mathematics teachers in 2010 had no tertiary qualification in mathematics.
In 2013, 39 per cent of state secondary principals responded that they could not offer
some subjects due to a shortage of suitably qualified teachers.
Schools are responsible for supporting teachers who are teaching out of field. This places
a training burden on school budgets and other teachers, particularly in regional and
remote areas.
DETE data to inform the placement of teachers are incomplete and unreliable.
Recommendations
It is recommended that the Department of Education, Training and Employment:
1 improves the quality of the information on teacher subject capability and
competence available to staffing officers and principals to improve the placement
of teachers at schools and on school timetables by December 2014
2 provides teachers who are teaching subjects out of their field of expertise with the
support and professional development needed to develop the content knowledge
and pedagogical skills relevant to the subject being taught by June 2014.
16 Report 2 : 2013–14 | Queensland Audit Office
3.1 Background Secondary teachers specialise in subject areas as part of their undergraduate and postgraduate
degrees, covering the content knowledge of the subject as well as the specific teaching skills
required to teach that subject.
Research indicates, as common sense would dictate, that all other things being equal, it is highly
desirable for teachers to teach the subjects in which they have gained their degree. The less
desirable alternative is that they teach 'out of field' in subjects for which they have not been trained,
albeit they are qualified and registered teachers.
This was recently reinforced by The Grattan Institute, in its 2012 report Catching Up: Learning from
the best school systems in East Asia, which identifies key aspects of teaching that have been shown
to improve learning. They include:
teachers’ content knowledge
teachers’ pedagogical knowledge (teaching skills and techniques), both of general principles and
those specific to their subject areas
teaching practices that focus on clear and well structured lessons supported by effective
classroom management
teaching practices that emphasise individualised instruction
a commitment to higher order problem solving, deep analysis of content, and activities requiring
advanced thinking skills and deductive reasoning
active professional collaboration that has a direct impact on learning and teaching. Key elements
include classroom observations, team teaching and constructive feedback.
The Australian Council of Learned Academies in its report International comparisons of science,
technology, engineering and mathematics (STEM) education 2012, identified some key features in
approaches to teaching STEM subjects internationally and compared the approaches with those in
Australia.
Countries (with strong STEM skills):
have an unbreakable commitment to disciplinary contents—they do not equate teaching with
class management and credentialing alone (and) they focus on knowledge
expect STEM subject teachers to be fully qualified in their discipline and to teach in that field and
not others; this contrasts sharply with Australia
focus professional development primarily on the discipline rather than generic programs, which
again contrasts with Australia.
These approaches and features depend on an adequate supply of qualified teachers and equitable
distribution of qualified teachers across all locations where student demand warrants such courses.
It also presupposes that information on teacher skills and qualifications is accurate and up to date.
3.2 Conclusions Not all students in Queensland have the opportunity to learn from qualified and experienced
teachers in specialist subject areas; research indicates this has an adverse impact on academic
achievement.
Lack of access to teachers expert in the subject matter and to curriculum offerings raises issues of
relative inequity and disadvantage for those locations where there are teacher shortages—issues
which are greater in regional and rural areas.

Report 2 : 2013–14 | Queensland Audit Office 17
The ability of schools and regions to make the best use of the short supply numbers of specialist
subject teachers, and to place them where they are most needed, is hampered by lack of
information about the specialist subject areas its teachers are qualified in or capable of teaching.
3.3 Data integrity and systems integration The Department of Education, Training and Employment (DETE) information on teacher
competence and capability is fragmented into four different systems that do not integrate and are
inconsistent. There is no single point of truth on secondary teacher capability and competency. This
reduces the ability of principals and regional human resource consultants to ensure that teachers
are placed in schools and subjects that best fit with their capabilities and competencies.
DETE collects different data on teacher competence and capability when teachers:
apply for employment with the department (TSS—payroll system)
apply for transfers from one school to another (MyHR Recruit—human resources system)
nominate the subjects they want to teach for the timetable (OneSchool—student and school
management)
register for work for casual or contract work (TRACER—casual teacher database).
The qualifications for secondary teachers are recorded in the department's payroll system, TSS.
Regional human resource consultants use the information in TSS and MyHR to place teachers for
permanent and casual jobs and for transfers. Schools use the information in OneSchool to timetable
teachers with the subjects and classes for the year.
Information about teacher competence and capability is not accurate. At the schools we visited, the
data on teacher qualifications in TSS were, on average, incomplete for five per cent of teachers and
out of date for 23 per cent of teachers. Of all the qualifications in TSS for secondary teachers, seven
per cent were not sighted.
DETE established the Teacher Application Centre (TAC) in 2006 to input and assess data centrally
from teacher applications. The quality assurance processes in place ensure the information entered
in TSS is reliable and accurate; however, the controls around teacher applications do not restrict
regional office staff from reactivating applications that had become inactive. This bypasses the
quality assurance processes.
The department has not refreshed and corrected the errors, omissions and obsolete information on
pre-existing employees because it requires information about whether a teacher is registered or not,
rather than information on their current qualifications and competencies. Information on the
qualifications of mathematics and science teachers is incomplete for 19 per cent of existing
employees, both permanent and temporary. The lack of reliable data on the teaching workforce
reduces the department’s ability to maximise student learning outcomes through an efficient
placement of qualified and capable teachers.
From 2006, the TAC has undertaken the department's process to assess the capability and
competence of secondary specialist teacher applicants; previously, it was done by individual
regions. The current process is not providing regional staffing officers or principals with reliable and
accurate information. Figure 3A shows the data integrity issues identified on a sample of secondary
applicants in 2012.

18 Report 2 : 2013–14 | Queensland Audit Office
Figure 3A Testing secondary applicants processed in 2012
Processed by
Number of applications
tested
TSS qualifications supported by
employee records
TSS subject preferences
supported by employee records
TAC 24 16 8
Regions / pre-TAC
5 5 1
Total 29 21 9
Source: QAO
We tested a random sample of 29 secondary teacher applicants who were active in 2012. Of the 29
applicants tested:
there was no supporting documentation on their employee file to support their qualifications
recorded in the payroll system (TSS) for eight (28 per cent) applicants
subject preferences were not supported by qualifications for 20 (69 per cent) applicants.
The lack of appropriate documentation means that principals cannot be as confident as they need to
be that the information about applicants is correct when they are assessing their capability and
competency to teach a specific subject.
3.4 Capability DETE does not have current and reliable information about the extent of teaching out of field. DETE,
therefore, cannot develop targeted strategies to reduce the impact of out of field teaching on student
learning outcomes.
Out of field teachers are required to teach a subject area where they are not familiar with the subject
content knowledge and specific teaching techniques. Teachers’ responsibilities may include:
preparing and marking exams, assessments and tasks
developing the subject’s detailed school program.
In 2010, DETE's survey of permanent teachers found that a third of secondary teachers teaching
any mathematics subject reported they had no qualifications in that subject area, as illustrated in
Figure 3B. These proportions are consistent with those in the Trends in Mathematics and Science
Study Report 2011. The survey also showed the extent of underuse of qualified teachers.
The survey data reflects that school principals and leadership teams consider teacher qualifications,
background, experience and personal attributes when allocating teachers to subjects. The 2010
qualification survey data identify that:
33 per cent of the teachers teaching mathematics in 2010 did not hold a formal mathematics
qualification
28 per cent of the teachers who had a mathematics qualification in 2010, were not teaching any
mathematics
41 per cent of the teachers who had a science qualification in 2010 were not teaching any
science.

Report 2 : 2013–14 | Queensland Audit Office 19
Figure 3B Out of field teachers teaching mathematics and science subjects in 2010
Subject and level Teachers with no specialist subject area qualification and
teaching %
Teachers with specialist subject area qualification and
not teaching (underuse) %
Maths All maths subjects 33.3 28.6
Years 8–10 36.5 33.0
Mathematics A 32.5 46.3
Mathematics B 12.5 53.7
Mathematics C 8.8 72.6
Science All science subjects 14.5 41.5
Years 8–10 20.3 43.8
Chemistry 9.80 58.4
Physics 17.0 51.5
Biology 7.8 62.7
Source: Department of Education, Training and Employment Workforce Situation Report
DETE is exploring this matter and is working with schools and the peak association for secondary
principals to investigate the best ways to deploy teacher capability and capacity across secondary
schools to meet student demand and need in both the current and future contexts.
In our 2013 survey, 107 of the 170 principals who responded (63 per cent) stated that there were
mathematics classes at their school being taught by out of field teachers and 83 (49 per cent) stated
that they had science classes being taught out of field.
It is unclear whether or not teaching out of field has worsened since 2010. For mathematics, Figures
3C and 3D show it is more prevalent in regional, rural and remote schools. This pattern was
confirmed in the results of the schools we visited, as shown in figure 3E.
Figure 3C Proportion of mathematics B teachers by qualification and location, 2013
Zone Mathematics major
Science major
No major recorded
Others
Metropolitan / provincial city
71% 11% 12% 6%
Regional / rural / remote
67% 13% 12% 8%
Source: QAO

20 Report 2 : 2013–14 | Queensland Audit Office
Figure 3D Proportion of junior mathematics teachers by qualification and location, 2013
Zone Mathematics major
Science major
No major recorded
Others
Metropolitan / provincial city
40% 23% 16% 21%
Regional / rural / remote
31% 23% 17% 29%
Source: QAO
Figure 3E shows that, at the seven schools we visited, teaching out of field was more prevalent in
regional, rural and remote areas. Five of the seven schools we visited were in rural or regional areas
and these results therefore, while not representative of the entire state, point to this being more of an
issue in these locations.
Figure 3E Out of field mathematics
Summary of schools visited
Teachers teaching mathematics 'out of
field'
Students being taught mathematics by
teachers out of field
Metropolitan / provincial city 14% 16%
Regional / rural / remote 35% 26%
Source: QAO
3.4.1 Support for teachers teaching out of field
Each school determines its support for out of field teachers, which can include formal and informal
mentoring from other teachers, support from the head of department and attendance at workshops.
Providing this support is a drain on school resources and increases teacher workloads.
All of the schools visited provided some level of support for teachers teaching subjects out of field.
The types of support for teachers included:
staff meetings
faculty meetings
lesson observations and feedback
support from regional subject experts
opportunities to visit other schools.
At the schools visited, the satisfaction with access to this support varied. Access to support
depended on the school budget to release teachers, whether or not there were other teachers at the
school or nearby schools with subject expertise, and how far the teachers would have to travel.
Teachers in rural and remote schools reported higher levels of dissatisfaction with the level of
access to support.

Report 2 : 2013–14 | Queensland Audit Office 21
Focus groups were held with 67 teachers across the seven schools visited. Common themes
emerged from teachers at all the schools visited who were teaching subjects out of their field of
expertise. However, there were some differences between the metropolitan / provincial city and the
regional / rural schools. The two large metropolitan and provincial city schools visited had significant
numbers of qualified and experienced teachers who were able to mentor and support out of field
teachers. At the five smaller regional / rural schools, the comments about stress and workload by the
teachers were more pronounced as these schools had fewer qualified and experienced teachers to
provide the mentoring and support.
In general, the teachers considered that:
teaching a subject out of field required significant time to prepare the lessons and they had
insufficient time to do all the tasks expected of them to provide quality teaching
teachers had to spend more time on student behaviour when teaching a subject out of their field
of expertise
qualified and experienced teachers volunteered a lot of their time after school and on weekends
helping out of field teachers
teachers teaching out of field were not given lighter teaching loads to allow for more preparation
time
teachers teaching out of field often lacked confidence with the content of the subject and often
'learned it' the night before
there was not enough time to support out of field teachers to develop content knowledge or the
pedagogical skills to stay ahead of the students
out of field teachers needed a lot of support with planning, assessment and moderation
processes; and marking assignments took a lot of their time
professional development opportunities for certain subject areas were limited and difficult to
access, especially in rural and remote areas.
In addition, 28 per cent of the 170 principals who responded to our survey believed that the shortage
of specialist subject teachers was having a serious effect on teacher stress (workload) while
43 per cent responded it was having a moderate effect.
The A Fresh Start strategy released on 22 July 2013 contains ten initiatives addressing specific
issues related to teacher supply, initial teacher education and effective mentoring and induction. The
initiatives are:
finding new pathways into the teaching profession
professional experience partnership agreements
explicit graduate expectations
a professional experience reporting framework
strengthening the governance of initial teacher education programs
an annual review of initial teacher education programs
professional development for mentors
supervision, mentoring and induction resources
Talent Identification Framework, state schooling only
teach rural campaign, state schooling only.
The new strategy has not been included in the scope of this audit as it is too early to assess its
impact.
At one of the schools visited, teachers who were teaching mathematics out of field were participating
in a professional development program to improve their knowledge of mathematical content and
teaching techniques. The following case study describes the program.

22 Report 2 : 2013–14 | Queensland Audit Office
A model of professional learning
YuMi Deadly Maths Program
This case study features a formal structured approach to professional learning that gave out of field teachers confidence in the content knowledge and the specific teaching techniques that work for the targeted students. It was followed up in the school by site visits that supported the teachers to apply what they had learned in practice.
The YuMi Deadly Mathematics program has been designed to provide support and training to teachers of students from Indigenous and lower socio economic backgrounds. It uses hands on activities and links to real life to help teachers teach mathematics in ways that make sense to children. The program was developed by Queensland University of Technology’s YuMi Deadly Centre (YDC).
One of its projects includes the Accelerate Indigenous Mathematics (AIM). It aims to assist teachers of Indigenous Year 8, 9 and 10 students who have Year 2 / 3 mathematics level, to develop Years 8–10 mathematics programs that will accelerate the students’ learning to where they can access mathematics subjects in Years 11–12.
In 2012, the participants involved in the AIM project included eight YDC staff, nine schools, 39 teachers, nine teacher aides and their classes. Of these, only three teachers were qualified maths specialists. Each teacher and aide was offered four, two‐day professional learning conferences across the year. These sessions covered mathematical content and pedagogy, as well as related issues like research, classroom management and planning.
The professional learning conferences were followed up with a school visit each term that involved working with the teachers on planning, discussions, observations, interviews and model teaching. The research evaluation of the program identified improvements in teacher confidence and competence and improvements in student mathematics skills. The AIM project is researching the benefits of the out of field teachers in Indigenous classrooms and results indicate that Indigenous students are making progress and the Indigenous and non-indigenous achievement gap is being reduced.
3.5 Capacity An imbalance between the demand for and supply of specialist subject teachers means also that
schools have had to reduce the range of subjects they can offer. Principals report that they are
reducing the range of subjects available and relying on teachers to teach subjects out of field.
Persistent shortages of teachers qualified and capable in specific specialist subjects have resulted in
schools limiting curriculum offerings. Of the 170 principals who responded to our survey, 67
(39 per cent) reported that there were subjects that they could not offer due to a shortage of
specialist subject teaching staff.
The shortage can result in subjects not being offered at all, combining year 11 and 12 classes
together or limiting the number of places offered. Figure 3F illustrates this effect in metropolitan,
regional and rural contexts.
Figure 3F Percentage of principals reporting that the teacher shortages are affecting subject offerings
Source: Queensland Audit Office – Schools survey, 2013
0%
20%
40%
60%
80%
100%
Metropolitan Regional Rural

Report 2 : 2013–14 | Queensland Audit Office 23
Principals make decisions about teacher placements based on their own assessment of each
teacher’s capabilities and competencies, using data in OneSchool and TSS reports from regional
HR consultants.
The Queensland College of Teachers sets the standards for teacher registration based on their
qualifications. In Queensland, as in all Australian jurisdictions, teachers are not registered as an
early years teacher, primary teacher or specialist secondary teacher. A registered teacher can be
employed legally to teach any year level or subject in a school. The specific subjects, grades or
classes assigned to a registered teacher are decided ultimately by the school / employer. The
Australian Professional Standards for Teachers apply to all primary and secondary teachers, not to
the schools. Full registration as a teacher is dependent on meeting the standards:
1. know students and how they learn
2. know the content and how to teach it
3. plan for and implement effective teaching and learning
4. create and maintain supportive and safe learning environments
5. assess, provide feedback and report on student learning
6. engage in professional learning
7. engage professionally with colleagues, parents / carers and the community.
There are no subject specific standards to support standard 2.
The Commonwealth Australian Quality Training Framework sets specific standards for registered
training organisations. The standards include specific qualification requirements for teachers
employed to teach Vocational Education and Training (VET) subjects. The following case study
outlines the requirements and standards for VET teachers.
Quality frameworks for Vocational Education and Training (VET)
Vocational Education and Training quality standards
VET teachers
Applicants must meet the standards of the Australian Quality Training Framework (AQTF) to become registered training organisations (RTOs) that can deliver and assess nationally recognised training and issue nationally recognised qualifications. The AQTF applies to providers delivering VET courses.
Standard 1: The applicant has strategies in place to provide quality training and assessment across all of its operations.
The applicant has a defined strategy, procedures and measures to ensure training and assessment services are conducted by trainers and assessors who:
a) have the necessary training and assessment competencies as determined by the National Quality Council or its successors, and
b) have the relevant vocational competencies at least to the level being delivered or assessed, and
c) can demonstrate current industry skills directly relevant to the training or assessment being undertaken, and
d) continue to develop their VET knowledge and skills as well as their industry currency and trainer or assessor competence.
The RTOs report on compliance with the standards and are subject to audits to ensure compliance. Failure to comply puts the provider's re-registration at risk.
The department does not set standards or provide guidance for principals to assess consistently if
teachers have the content knowledge, pedagogical skills and qualifications appropriate to the grade
level or subject area they teach. This means that decisions about teacher capability or competence
for specific subjects are inconsistent and not transparent.
24 Report 2 : 2013–14 | Queensland Audit Office
One example is that of a teacher in a small remote high school assessed as competent by the
principal to teach junior manual arts (woodwork and metalwork) for a year or two. This creates
difficulties when the same teacher is transferred (based on the principal's assessment) to a larger
metropolitan school where manual arts includes VET subjects (welding and computer aided design)
which the teacher is not qualified to teach as the teacher has no certificate for these subjects. The
school ends up with an extra teacher but no one capable and competent to teach the expanded
range of manual arts.
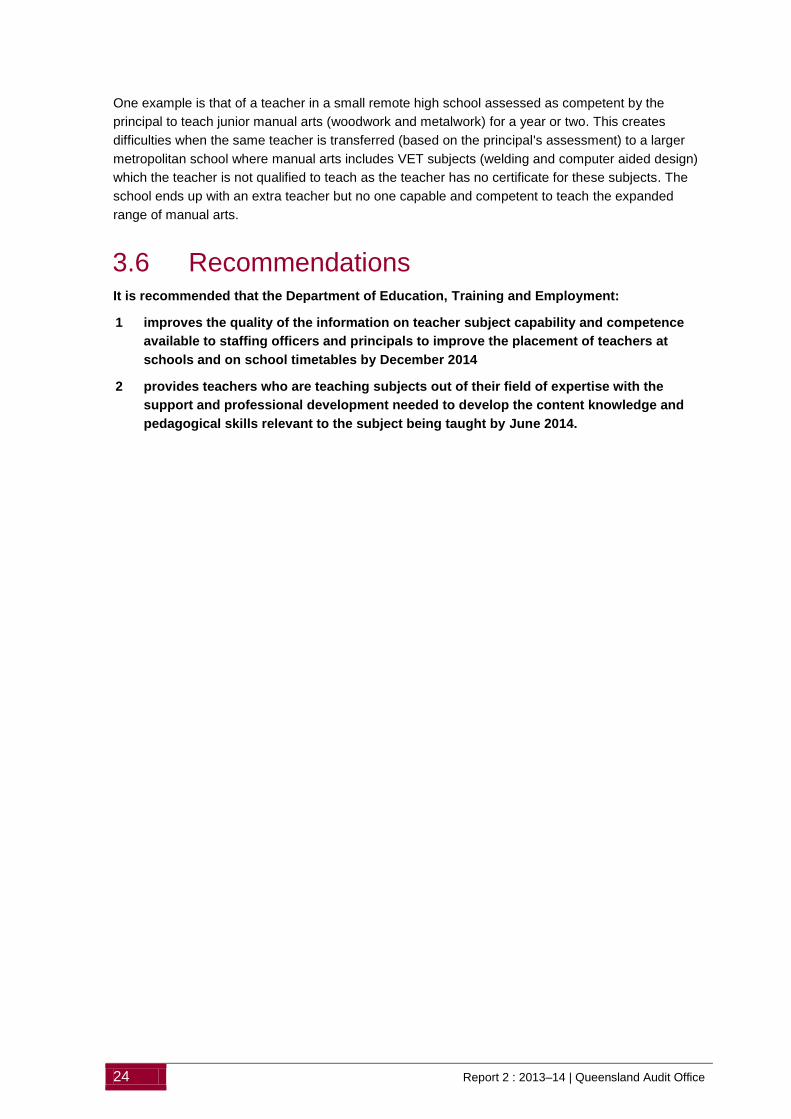
3.6 Recommendations It is recommended that the Department of Education, Training and Employment:
1 improves the quality of the information on teacher subject capability and competence
available to staffing officers and principals to improve the placement of teachers at
schools and on school timetables by December 2014
2 provides teachers who are teaching subjects out of their field of expertise with the
support and professional development needed to develop the content knowledge and
pedagogical skills relevant to the subject being taught by June 2014.

Report 2 : 2013–14 | Queensland Audit Office 25
4 Future workforce supply and demand
In brief
Background
Forecasting future workforce demand and supply is necessary to identify and address
emerging imbalances.
Conclusions
The workforce plans of the Department of Education, Training and Employment broadly
identify workforce supply and demand issues and inform the development of its workforce
attraction strategies.
The level of detail in the plans on future demand is hindered by unreliable and out of date
data on the capabilities and competencies of the secondary school teaching workforce. This
reduces the department's ability to ensure the right teachers are available to the right school
at the right time.
Key findings
The department's workforce plans are undertaken centrally and provide information about
workforce supply and demand.
Statewide workforce planning is not integrated with teacher demand at the regional,
cluster or school level.
Forecasts of future needs are made on the assumption that generalist teachers can be
expected to provide suitable instruction in junior mathematics and science subjects.
The data to inform the placement of teachers are incomplete and unreliable.
Recommendations
It is recommended that the Department of Education, Training and Employment:
3 develops and implements a strategy to reduce the imbalance in the supply of
specialist subject teachers with a view to improving participation and
achievement in Science, Technology, Engineering and Mathematics (STEM)
subjects by June 2014
4 develops forecasts for supply and demand of specialist subject teachers that
produce more accurate and comprehensive estimates of need at the state and
regional levels and by subject, including junior secondary subjects by June 2014
5 integrates and coordinates its approach to workforce plans and initiatives at
central, regional and school levels by December 2014.
26 Report 2 : 2013–14 | Queensland Audit Office
4.1 Background Forecasts of future workforce demand and supply allow organisations to develop appropriate
strategies so an imbalance between supply and demand does not affect the quality of the services
delivered to clients.
Demand forecasts start with an understanding of the current workforce profile and demand for
services. This includes information about:
the age and gender of the workforce to inform forecasts about potential retirements
the capabilities of the current workforce to inform services about the types of workers that need to
be replaced
forecasts on future growth or reduction in services by geographic area to plan workforce
placements and movements.
Schools work within a staffing formula based on the number of students enrolled at the school. The
principal has the flexibility to determine the subjects offered in response to local community needs
and student interest.
4.2 Conclusions The workforce plan of the Department of Education, Training and Employment (DETE) complies with
the requirements of government guidelines at the overall organisation level. It also has some
elements of best practice. There is, however, no operational workforce plan for its teaching
workforce to demonstrate, in detail, how the plan’s objectives will be achieved.
DETE’s workforce planning is subject also to significant limitations:
current, reliable supply and demand data for specialist subject teachers are not available
forecasts do not include junior secondary teaching workforce, counter to international research,
which credits highly qualified specialist subject teachers for the strong performance in the
countries outperforming Queensland and Australia in science, technology, engineering and
mathematics.
Established workforce planning initiatives include scholarship and grants programs to supplement
the supply of teachers. As no evaluation is undertaken on the long term impacts of scholarship and
grants programs, DETE does not know whether its key workforce initiatives have achieved their
desired outcomes and whether it has succeeded in addressing identified workforce gaps.
4.3 Workforce planning DETE conducts workforce planning centrally. DETE's workforce initiatives unit provides workforce
information on primary and secondary state school teachers. The 2013 workforce report outlines
projected information on teacher demand and supply.
The regional offices and schools are responsible for key human resource decision making such as
teacher placement and workforce management. However, the department does not require the
regional offices or schools to develop workforce plans. The regional offices and schools visited did
not develop workforce plans, although two of the schools visited had forecasts about retirements
and upcoming leave. This limits the ability of regional and school staff to plan for the workforce
needed to meet the educational needs of the students at individual schools or across the region.

Report 2 : 2013–14 | Queensland Audit Office 27
DETE undertakes periodic data collection, through its teacher qualification survey to identify core
skills and knowledge, to develop strategies that improve the supply of qualified specialist subject
teachers. The department does not have complete, accurate and reliable data on its workforce.
Therefore, it collects information from permanent teachers via a survey asking them to nominate:
any further study they are undertaking
their current qualifications
subject specific capabilities and experience
the subjects they are currently teaching.
The data are self reported and not validated. The last teacher qualification survey was in 2010. This
reduces DETE's ability to identify areas of shortage and to support schools by allocating teachers
effectively to meet the needs of the schools.
The department’s current workforce strategic plan includes a performance measure that workforce
supply meets demand. However, there is no evidence of targets, governance mechanisms or
information on how DETE will achieve its goals and objectives in a specified time frame. Lack of
monitoring and evaluation limits DETE's ability to identify workforce issues effectively and to develop
new strategies or modifications to current programs.
4.3.1 Forecasts
DETE’s demand forecasts consider teacher retirements and changes in student enrolments.
Forecast for supply is based on the data from Queensland universities on expected graduate
numbers.
DETE’s statewide modelling assumes that 100 per cent of graduates from secondary pre-service
courses are available to meet its demand for replacements and growth. However, non-state schools
in Queensland employ around 20 per cent of graduates.
Figure 4A shows the supply of graduate teachers and the supply available to DETE. Overall, on
current numbers, there are adequate graduates to meet demand. However, shortages are affecting
schools in some locations and in some specialist subjects.
Figure 4A Supply and demand for secondary teachers 2007–2017
Source: DETE
0
500
1000
1500
2000
2500
2007 2008 2009 2010 2011 2012 2013 2014 2015 2016 2017
Num
be
r o
f te
ach
ers
DETE teacher demand Number of secondary teacher graduates
Less 20 per cent to non-state schools
Actual Projected
Yr 7 transition

28 Report 2 : 2013–14 | Queensland Audit Office
In 2015, the effect of the transition of Year 7 students from primary to secondary school will create a
general spike in demand to fill secondary teacher positions. DETE predicts it will need additional
secondary school teachers in 2015 and is implementing a suite of initiatives to support current state
school teachers who wish to work with students in the junior secondary settings. These include:
up to 500 junior secondary scholarships for primary schools teachers who are successful in their
application to transition to junior secondary settings
a range of professional development opportunities to build capabilities, knowledge and
understanding of adolescent development and pedagogical practices.
The department's Junior Secondary Attraction and Recruitment Strategy commits to reporting to
program boards about attraction and recruitment activities across the regions worth $5 410 000. The
effects of these activities have not been included in the scope of this audit as it is too early to assess
their impact on demand for secondary teachers.
Subject shortages
There is an imbalance in the types of specialist teachers graduating from Queensland universities.
DETE has identified shortages in teachers of mathematics, science and industrial design and
technology. Figure 4B shows the imbalance between the numbers of specialists in the areas of
shortage (mathematics and science teachers) and an oversupply (physical education, music / dance
/ drama teachers and primary teachers).
Figure 4B Numbers of graduates from Queensland universities
by selected specialist area and sector, 2010–2012
Specialist area 2010 2011 2012
Physics 70 56 54
Junior mathematics 68 60 78
Mathematics B 135 131 134
Chemistry 114 94 94
Health and physical education 301 378 421
Music / dance / drama 315 292 341
Primary teachers 1 306 1 280 1 287
Source: DETE
Location shortages
A significant proportion of applicants are unwilling to accept placements in non-preferred locations,
such as regional and rural schools or those in some low socio economic areas. This creates
shortages in these areas. DETE's forecasting does not consider regional demand or supply. This
reduces the ability of recruitment strategies and scholarships to target the right teachers for the right
schools.
Other sources of teachers, such as those returning to the workforce from leave, may assist DETE to
address the shortfall. However, it is difficult for DETE to forecast the number of teachers returning to
the workforce and the specific skills and experience they have.

Report 2 : 2013–14 | Queensland Audit Office 29
More detailed forecasts of demand at the regional and school levels, along with supply forecasts that
consider the competition for graduates from other education providers, will give the department a
more accurate forecast of the teacher shortage. This will allow the department to develop
appropriate strategies to address any imbalances in supply and demand.
In its research report Schools Workforce Report 2012, the Productivity Commission identified that,
like other developed countries, Australia is facing nationwide challenges in attracting qualified
teachers for a number of specialist subject areas, with persistent shortages reported in some
jurisdictions of specialist subject teachers in secondary mathematics and science. DETE’s latest
forecasts identify growing supply shortages of specialist subject teachers in the following areas:
secondary mathematics
secondary science
industrial design and technology.
The DETE forecasting model assumes that:
junior secondary mathematics and science do not need specialist qualifications in mathematics or
science
100 per cent of graduates from Queensland universities are available for DETE to recruit.
On these assumptions, the numbers of future graduates would more than meet DETE's demand;
however, Figure 4C shows how the supply for all mathematics teachers is not adequate to meet
demand if mathematics B, C and junior mathematics teachers are included in the model and the
20 per cent of graduates going to non-state schools is considered.
DETE's analysis of the teacher qualification data in its 2010 Draft Workforce Situation Report is that
where the percentage of unqualified teachers is high, it is often in a field where a generalist teacher
can be expected to provide suitable instruction. While DETE's assumption is that generalist teachers
may be expected to provide suitable instruction in junior mathematics and science, the Trends in
International Mathematics and Science Study (TIMSS) report shows clearly that Year 8 students
whose teacher specialised in mathematics achieve better results.
Figure 4C Supply and demand mathematics 2013–2022
Source: QAO
0
500
1000
1500
2000
2500
3000
2013 2013-17 2013-2022
Num
be
r o
f te
ach
ers
Junior mathematics demand
Mathematics C demand
Mathematics B demand
Supply total 100 per cent
Less 20 per cent to non-state schools

30 Report 2 : 2013–14 | Queensland Audit Office
4.3.2 Liaison with universities
DETE has formed a working group with the deans of education of Queensland universities. This
group provides an opportunity for the Minister for Education, Training and Employment and DETE
senior executives to have a direct dialogue with the deans on key issues of common interest, such
as workforce supply and demand, the National Assessment Program—Literacy and Numeracy
(NAPLAN) and other relevant issues. This group generally meets twice a year.
The Australian Government is responsible for setting university funding and, generally, the
universities themselves set course numbers. Universities are autonomous institutions with a
distinctive mission, operating within a state or territory and in the national and international higher
education environment. Universities are in the business of meeting needs of students, not providing
a training service for employers. This limits the ability of the department to influence universities to
increase course numbers in areas of greater demand, such as mathematics, science, manual arts
and home economics.
The Australian Government provides universities with a payment through the effective full time
student load per course. In 2012, 3 032 teachers graduated in Queensland. This includes both
primary and secondary teachers. The cost of this graduate load was approximately $97 million;
however, only two thirds of these graduates are likely to be employed within 12 months of
graduating. In Queensland, six times more primary school teachers are being trained than are
needed. While it is clear that students are being given choices about which courses to study, the
continuing imbalance reduces DETE’s ability to meet its future workforce needs.
The Productivity Commission, in its Schools Workforce Report in April 2012, identified that a key
influence of the state education departments on universities is in making available places for
students to undertake practicum teaching in schools. Students need to practise their teaching skills
to meet the requirements of the course and therefore graduate. Reducing the availability of
practicum places in areas of oversupply such as primary school teaching may lead more students to
study in areas of greater demand, such as secondary science and mathematics. To date, the
department has not used this option to increase the supply of secondary specialist subject teachers
in areas where they are most in demand and to reduce the oversupply of primary teachers.
The Fresh Start Strategy responds to elements of the 2012 Productivity Commission report on the
schools workforce. The strategy includes the introduction of professional experience agreements, for
all higher education institutions and all three schooling systems. These agreements are intended to
better support alignment of teacher supply and demand through:
revision of programs to provide opportunities for pre-service teachers to change mid-program in
teaching disciplines with high demand or restrictions on access to professional experience
placements where the imbalance is profound
further engagement with industry partners is continuing to determine the best strategy through
the recently formed Teacher Quality Working Group.
Figure 4D shows the disparity between the supply and demand for primary and secondary teachers
in Queensland. DETE is not the only employer of graduates, as previous employment trends show,
as around 20 per cent of graduates gain employment with non-state schools.
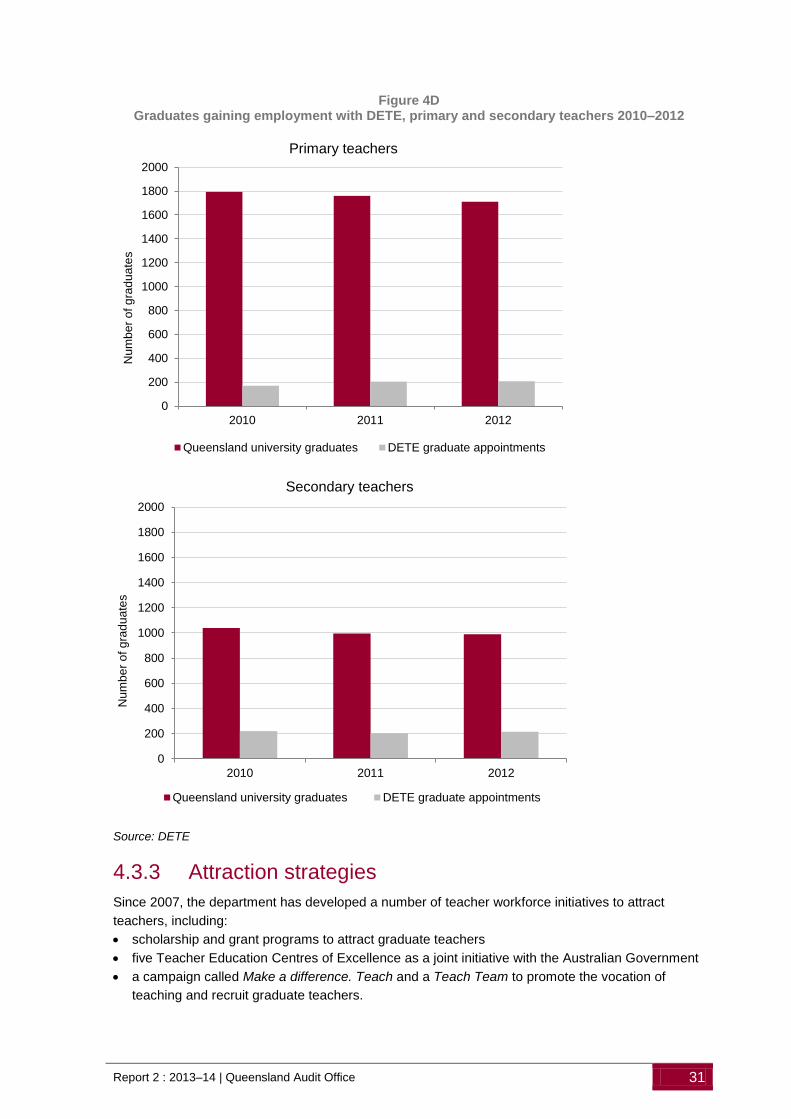
Report 2 : 2013–14 | Queensland Audit Office 31
Figure 4D Graduates gaining employment with DETE, primary and secondary teachers 2010–2012
Source: DETE
4.3.3 Attraction strategies
Since 2007, the department has developed a number of teacher workforce initiatives to attract
teachers, including:
scholarship and grant programs to attract graduate teachers
five Teacher Education Centres of Excellence as a joint initiative with the Australian Government
a campaign called Make a difference. Teach and a Teach Team to promote the vocation of
teaching and recruit graduate teachers.
0
200
400
600
800
1000
1200
1400
1600
1800
2000
2010 2011 2012
Nu
mb
er
of g
rad
ua
tes
Primary teachers
Queensland university graduates DETE graduate appointments
0
200
400
600
800
1000
1200
1400
1600
1800
2000
2010 2011 2012
Num
be
r o
f g
rad
ua
tes
Secondary teachers
Queensland university graduates DETE graduate appointments
32 Report 2 : 2013–14 | Queensland Audit Office
The scholarship and grant programs have variable success rates from 100 per cent to zero
completion. DETE has not evaluated the success of these programs. The data indicates that, if the
students complete their scholarships successfully, they are likely to stay with DETE even after their
scholarship commitments are over.
Recipients did not complete the scholarship program for a variety of reasons including:
non-completion of their qualification within time frames of the scholarship
not meeting the employment suitability requirements of the department
interstate relocation
changed career choice (funds were repaid to DETE).
The department’s 2012 Teacher Supply and Demand Snapshot report states that the scholarship
programs are intended to ‘supplement supply, rather than fully meet supply’. The department states
that this reflects the difficulties in quantifying demand in schools and budget constraints when
determining the number of scholarships and grants to offer annually.
No evaluation is undertaken on the long term impacts of scholarship and grants programs. The lack
of evaluation means DETE has missed opportunities to adjust the focus of the initiatives to reflect
necessary changes identified in the monitoring and evaluation process. It does not know whether its
workforce initiatives have achieved the desired outcomes, nor whether it has succeeded in
addressing identified workforce gaps.
4.4 Recommendations It is recommended that the Department of Education, Training and Employment:
3 develops and implements a strategy to reduce the imbalance in the supply of specialist
subject teachers with a view to improving participation and achievement in Science,
Technology, Engineering and Mathematics (STEM) subjects by June 2014
4 develops forecasts for supply and demand of specialist subject teachers that produce
more accurate and comprehensive estimates of need at the state and regional levels and
by subject, including junior secondary subjects by June 2014
5 integrates and coordinates its approach to workforce plans and initiatives at central,
regional and school levels by December 2014.

Report 2 : 2013–14 | Queensland Audit Office 33
Appendices
Appendix A—Comments ...................................................................................................... 34
Auditor-General Act 2009 (Section 64)—Comments received ....................................... 34
Comments received and responses to recommendations .............................................. 35
Appendix B—Audit details ................................................................................................... 44
Audit objective ................................................................................................................. 44
Reasons for the audit ...................................................................................................... 44
Performance audit approach ........................................................................................... 44

34 Report 2 : 2013–14 | Queensland Audit Office
Appendix A—Comments
Auditor-General Act 2009 (Section 64)—Comments received
Introduction
In accordance with section 64 of the Auditor-General Act 2009, a copy of this report was provided to
the Department of Education, Training and Employment with a request for comment.
Responsibility for the accuracy, fairness and balance of the comments rests with the head of the
agency.

Report 2 : 2013–14 | Queensland Audit Office 35
Comments received
Response provided by the Director-General, Department of Education, Training and Employment on
1 October 2013.

36 Report 2 : 2013–14 | Queensland Audit Office
Comments received
Response provided by the Director-General, Department of Education, Training and Employment on
1 October 2013.

Report 2 : 2013–14 | Queensland Audit Office 37
Comments received
Response provided by the Director-General, Department of Education, Training and Employment on
1 October 2013.

38 Report 2 : 2013–14 | Queensland Audit Office
Comments received
Response provided by the Director-General, Department of Education, Training and Employment on
1 October 2013.
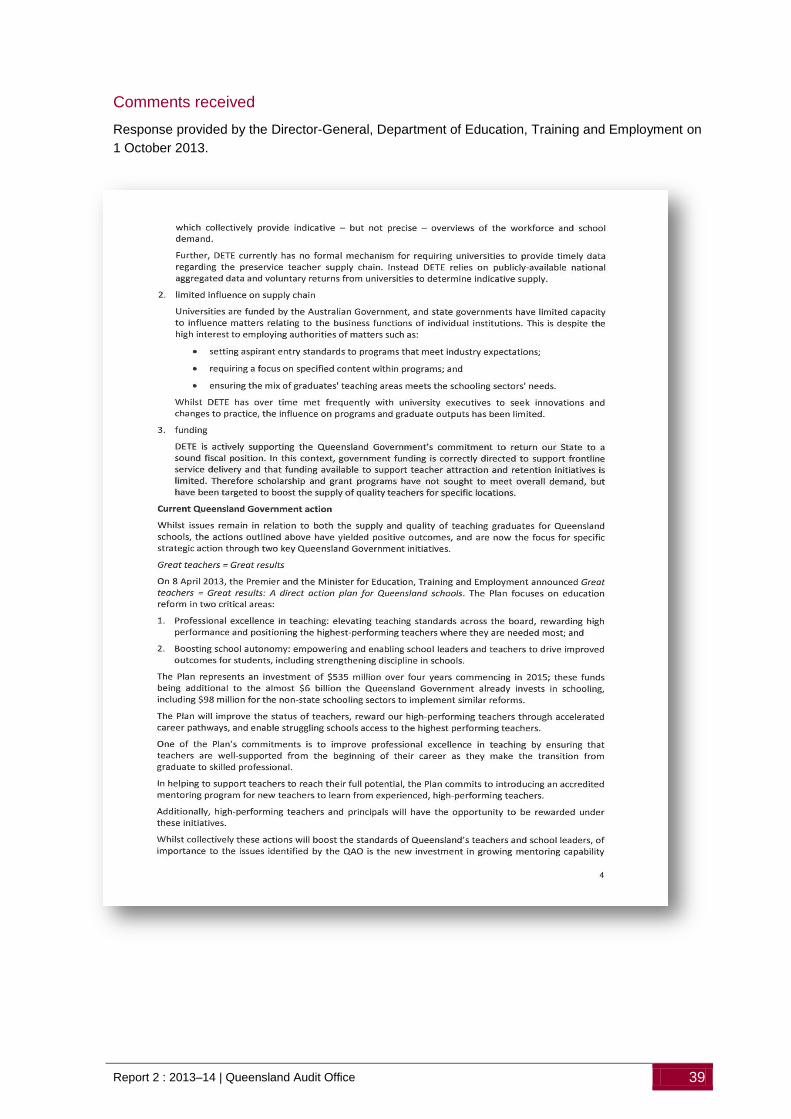
Report 2 : 2013–14 | Queensland Audit Office 39
Comments received
Response provided by the Director-General, Department of Education, Training and Employment on
1 October 2013.
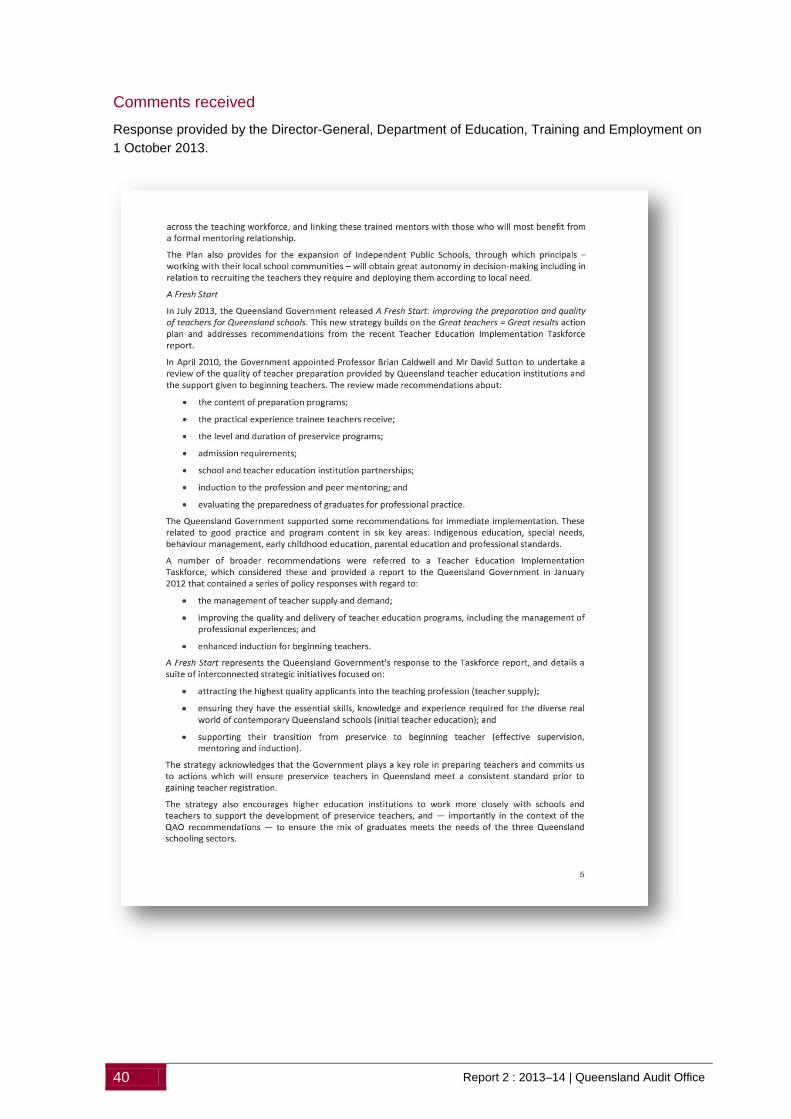
40 Report 2 : 2013–14 | Queensland Audit Office
Comments received
Response provided by the Director-General, Department of Education, Training and Employment on
1 October 2013.

Report 2 : 2013–14 | Queensland Audit Office 41
Comments received
Response provided by the Director-General, Department of Education, Training and Employment on
1 October 2013.

42 Report 2 : 2013–14 | Queensland Audit Office
Comments received
Response provided by the Director-General, Department of Education, Training and Employment on
1 October 2013.

Report 2 : 2013–14 | Queensland Audit Office 43
Responses to recommendations
Responses to recommendations provided by the Director-General, Department of Education,
Training and Employment on 1 October 2013.

44 Report 2 : 2013–14 | Queensland Audit Office
Appendix B—Audit details
Audit objective
The objective of the audit was to examine how effectively the Department of Education, Training and
Employment (DETE) attracts and places specialist subject teachers in secondary schools to
maximise student academic outcomes.
Reasons for the audit
DETE is committed to improving academic outcomes including literacy, numeracy and science for
every child in every classroom. It intends to achieve this through the attraction, retention and
development of high quality teachers, supporting high quality teaching practices and fostering a
culture of high expectations and enhanced school performance.
The Queensland College of Teachers (QCT) sets minimum qualification requirements for the
registration of teachers. QCT does not set or recommend specific qualifications for specialist subject
areas. A registered teacher can be employed to teach any subject at any year level in a school. The
school / employer ultimately decides the specific subjects, grades or classes assigned to a
registered teacher. Queensland state schools recruit from the pool of teacher applicants coordinated
by regional human resource teams at DETE and must consider applicants from the transfer pool.
DETE has identified shortages of teachers in the following specialist subjects in specific geographic
locations: chemistry; home economics; industrial technology and design; junior secondary; language
studies, especially Japanese; mathematics B and C; physics; senior English; and special education.
DETE predicts that these subject areas will continue to be in demand in the future.
Performance audit approach
The audit was conducted in accordance with the Auditor-General of Queensland Auditing
Standards—September 2012, which incorporate the requirements of standards issued by the
Australian Auditing and Assurance Standards Board.
The audit was conducted between January and September 2013 and examined the supply and
demand for secondary specialist subject teachers statewide.
DETE is responsible for engaging Queenslanders in lifelong learning across the entire continuum,
from early childhood education and care, through school education, and into training, tertiary
education, and employment.
The areas within DETE subject to audit included:
central office
regional offices in south east Queensland, north Queensland, far north Queensland, Darling
Downs and Brisbane
state secondary schools (schools that are geographically dispersed) — Gympie State High
School, Spinifex College, Tully State High School, Ravenshoe State School, Western Cape
College (videoconference), Northern Area Peninsula State College (videoconference), Roma
State College, Centenary Heights State High School and Brisbane State High School.

Report 2 : 2013–14 | Queensland Audit Office 45
The audit included:
an analysis of the department's human resource databases, workforce plans and scholarship
programs
analysis of pre-service teacher education enrolments
interviews with the workforce modelling unit
fieldwork at seven and videoconferences at two state secondary schools
a paper based survey of 188 Queensland secondary principals which achieved a response rate
of 90 per cent.

46 Report 2 : 2013–14 | Queensland Audit Office

Report 2 : 2013–14 | Queensland Audit Office 47
Auditor-General Reports to Parliament
Tabled in 2013–14 Report number Title of report Date tabled in
Legislative
Assembly
1 Right of private practice in Queensland public hospitals July 2013
2 Supply of specialist subject teachers in secondary schools October 2013
Reports to Parliament are available at www.qao.qld.gov.au