supporting healthy lifestyles in the mining industry: a
TRANSCRIPT

University of Wollongong University of Wollongong
Research Online Research Online
University of Wollongong Thesis Collection 1954-2016 University of Wollongong Thesis Collections
2016
Supporting healthy lifestyles in the mining industry: a focus on nutrition, Supporting healthy lifestyles in the mining industry: a focus on nutrition,
physical activity, hydration and heat stress physical activity, hydration and heat stress
Vinodkumar Gopaldasani University of Wollongong
Follow this and additional works at: https://ro.uow.edu.au/theses
University of Wollongong University of Wollongong
Copyright Warning Copyright Warning
You may print or download ONE copy of this document for the purpose of your own research or study. The University
does not authorise you to copy, communicate or otherwise make available electronically to any other person any
copyright material contained on this site.
You are reminded of the following: This work is copyright. Apart from any use permitted under the Copyright Act
1968, no part of this work may be reproduced by any process, nor may any other exclusive right be exercised,
without the permission of the author. Copyright owners are entitled to take legal action against persons who infringe
their copyright. A reproduction of material that is protected by copyright may be a copyright infringement. A court
may impose penalties and award damages in relation to offences and infringements relating to copyright material.
Higher penalties may apply, and higher damages may be awarded, for offences and infringements involving the
conversion of material into digital or electronic form.
Unless otherwise indicated, the views expressed in this thesis are those of the author and do not necessarily Unless otherwise indicated, the views expressed in this thesis are those of the author and do not necessarily
represent the views of the University of Wollongong. represent the views of the University of Wollongong.
Recommended Citation Recommended Citation Gopaldasani, Vinodkumar, Supporting healthy lifestyles in the mining industry: a focus on nutrition, physical activity, hydration and heat stress, Doctor of Philosophy thesis, School of Health and Society, University of Wollongong, 2016. https://ro.uow.edu.au/theses/4796
Research Online is the open access institutional repository for the University of Wollongong. For further information contact the UOW Library: [email protected]

SUPPORTING HEALTHY LIFESTYLES IN THE MINING INDUSTRY: A FOCUS ON NUTRITION, PHYSICAL
ACTIVITY, HYDRATION AND HEAT STRESS
A thesis submitted in fulfilment of the requirements for the award of the degree
Doctor of Philosophy
From
University of Wollongong
By
Dr Vinodkumar Gopaldasani Master of Science (MSc)
Bachelor of Medicine, Bachelor of Surgery (MBBS)
School of Health and Society 2016

©Copyright 2016
by
Dr Vinodkumar Gopaldasani
All Rights Reserved

iii
CERTIFICATION
I, Vinodkumar Gopaldasani declare that this thesis, submitted in fulfilment of the
requirements of the award of Doctor of Philosophy in the School of Health and Society,
University of Wollongong, is my own work unless otherwise referenced or acknowledged.
This document has not been submitted in whole, or in part, for qualifications at any other
academic institution.
Dr Vinodkumar Gopaldasani
On the 29th of July, 2016

iv
DEDICATION
To my wonderful father, Kishinchand, whose patience, persistence and dedication
to his children and their education inspired me to pursue my PhD. Your steadfast
belief in me, and your support and love, allowed me to complete this journey.
To my fabulous mother, Thakuri, who supported my father and their children
through all the tough times, making sure we had a good life. Your love was the
secret ingredient that kept us all together.
To my beautiful wife, Prashansa and our gorgeous daughter, Pragya – thank you for
your years of patience and support in my pursuit for further knowledge. To my son
Vishal, who came to this world just as this thesis was being completed – I look
forward to sharing this wonderful life with you.
To my brothers Yogesh, Prem and Gopal – thank you for all your support during
different stages of this endeavour. Your kindness and understanding were
instrumental in pushing me along towards completing this PhD.

v
ACKNOWLEDGEMENTS
I thank my wonderful supervisors, Professors Vicki Flood and Brian Davies, and Dr
Bridget Kelly for their immense support, time, knowledge and experience
throughout my PhD research and writing. The opportunity to work with you,
combining the fields of public health and work health and safety in a workplace
setting has been a privilege and an insightful learning experience, one that I will
continue to apply in my future research.
I also thank Barrick Cowal Gold Mine for providing access to the mine site and for
providing part of the funding for my travel and accommodation. I especially thank
all the employees of Barrick Cowal Gold Mine who participated in the research. I
hope the constant feedback during the study period was useful to you and helped
improve your lifestyle and general wellbeing.
I also thank the work health and safety team at Barrick Cowal Gold Mine, including
Ken Bermingham, Kylie Spence, Colleen Moore, Steve Pressler and Wendy Hodgetts
for caring about the workers and providing all the support possible to enable this
study to succeed.
To Laura Turner and Sidonie Vermont – thank you so much for the important part
you both played in the data management and analysis. I hope you both gained
some valuable skills, knowledge and experience in the process.

vi
Lastly, I acknowledge the financial assistance I received to support my PhD research.
Thank you to the University of Wollongong for providing me with a University
Postgraduate Award (UPA) and an International Postgraduate Research Scholarship
(IPRS).

vii
BOOK CHAPTERS, PRESENTATIONS AND REPORTS
ARISING FROM THIS RESEARCH
Book Chapter
Gopaldasani V. 2017, “Water: energy free”, In: Tapsell L. ed. Food, Nutrition and
Health, Second Edition (In progress). Oxford University Press.
Flood, V. and Gopaldasani V. 2013, "Extending knowledge of food components", In:
Tapsell L. ed. Food, Nutrition and Health, First Edition. Oxford University Press.
Presentations
Gopaldasani V., Flood, V. Davies, B., Whitelaw, J, “Hydration that works”, accepted
for presentation at the Australian Institute of Occupational Hygienists 34th Annual
Conference, Melbourne, Dec 2016.
Gopaldasani V., Flood, V., Davies, B., Whitelaw, J. and Kelly, B., "Putting "Health"
back into Occupational "Health" and Safety", Australian Institute of Occupational
Hygienists 32nd Annual Conference, Melbourne, Nov-Dec 2014.
Gopaldasani V. and Hodgetts, W. "Overview of Healthy Miner Research",
presentation to the NSW Metalliferous Industry Safety Advisory Committee
(MISAC), May 2014.

viii
Unpublished report
Gopaldasani V., Davies, B., Kelly, B., Whitelaw, J. and Flood, V. "Heat Stress at
Barrick Cowal Gold Mine", a preliminary report, 2014.

ix
TABLE OF CONTENTS
CERTIFICATION ............................................................................................................ iii
DEDICATION ................................................................................................................ iv
ACKNOWLEDGEMENTS ................................................................................................ v
BOOK CHAPTERS, PRESENTATIONS AND REPORTS ARISING FROM THIS RESEARCH .vii
TABLE OF CONTENTS ....................................................................................................ix
LIST OF TABLES .......................................................................................................... xvii
LIST OF FIGURES .......................................................................................................... xx
LIST OF ABBREVIATIONS........................................................................................... xxiii
ABSTRACT .................................................................................................................. xxv
CHAPTER 1 – INTRODUCTION AND THESIS CONTEXT .................................................. 1
1.1 Introduction ................................................................................................. 1
1.2 Health problems of workers in the mining industry .................................... 3
1.2.1 Overweight and obesity ........................................................................... 3
1.2.2 Dehydration ............................................................................................. 4
1.2.3 Heat stress and heat strain ...................................................................... 5
1.3 Research hypotheses ................................................................................... 6
1.4 Research aims and objectives ...................................................................... 7
1.5 Conceptual framework for the study ........................................................... 8
1.6 Theoretical framework for health promotion intervention ........................ 9
1.6.1 The Health Belief Model (HBM) ............................................................. 11
1.6.2 The Social Cognitive Theory (SCT) .......................................................... 12
1.7 References .................................................................................................. 17

x
CHAPTER 2 – THE MINING INDUSTRY – A UNIQUE WORKPLACE .............................. 27
2.1 Introduction ................................................................................................ 27
2.2 A brief history of mining: pre-modern to modern era ............................... 28
2.3 Mining sites and towns .............................................................................. 30
2.3.1 Fly-in fly-out (FIFO) mine sites ............................................................... 30
2.3.2 Drive-in drive-out (DIDO) mine sites ...................................................... 30
2.3.3 Surface mining sites ............................................................................... 31
2.3.4 Underground mining sites ...................................................................... 31
2.4 Lifestyles of workers in the mining industry .............................................. 31
2.5 Historic legacy of health issues among miners .......................................... 32
2.6 Emerging health issues in the mining industry .......................................... 34
2.6.1 Overweight and obesity ......................................................................... 36
2.6.2 Dehydration ............................................................................................ 36
2.6.3 Heat related illness from heat stress ..................................................... 37
2.6.4 Musculoskeletal disorders ..................................................................... 38
2.7 Summary .................................................................................................... 39
2.8 References .................................................................................................. 40
CHAPTER 3 – GENERAL OVERVIEW OF LITERATURE AND METHODS ........................ 45
3.1 Introduction ................................................................................................ 45
3.2 Literature review ........................................................................................ 45
3.2.1 Effectiveness of individual targeted nutrition intervention strategies .. 56
3.2.2 Effectiveness of individual targeted physical activity intervention strategies ............................................................................................................ 59
3.2.3 Effectiveness of environmental intervention strategies ........................ 61
3.3 Methodology .............................................................................................. 64

xi
3.3.1 Study context ......................................................................................... 64
3.3.2 Research design ..................................................................................... 65
3.3.3 Participants ............................................................................................ 67
3.3.4 Eligibility criteria ..................................................................................... 67
3.3.5 Sample size calculation .......................................................................... 67
3.3.6 Recruitment ........................................................................................... 69
3.3.7 Consent, privacy and confidentiality...................................................... 69
3.4 Initial preparation ...................................................................................... 70
3.4.1 Meeting with stakeholders .................................................................... 70
3.4.2 Mine site induction and team training .................................................. 71
3.4.3 Implementation of the study ................................................................. 71
3.5 Limitations .................................................................................................. 74
3.6 Summary .................................................................................................... 74
3.7 References .................................................................................................. 76
CHAPTER 4 – FEASIBILITY AND EFFECTIVENESS OF THE INTERVENTION ON THE OUTCOME OF OVERWEIGHT AND OBESITY AMONG SURFACE MINE WORKERS ...... 82
4.1 Introduction ............................................................................................... 82
4.2 Literature review ........................................................................................ 82
4.2.1 Diet and nutrition ................................................................................... 83
4.2.2 Physical activity ...................................................................................... 84
4.2.3 Summary ................................................................................................ 86
4.3 Methodology .............................................................................................. 87
4.3.1 Design ..................................................................................................... 87
4.3.2 Participants ............................................................................................ 87
4.3.3 Measures – instruments and procedures .............................................. 88

xii
4.3.4 Measures – Intervention ........................................................................ 95
4.3.5 Data processing and analysis ............................................................... 103
4.4 Results ...................................................................................................... 103
4.4.1 Anthropometric measures ................................................................... 104
4.4.2 Diet and nutrition measures ................................................................ 108
4.4.3 Physical activity measures .................................................................... 117
4.4.4 Health promoting environmental measures ........................................ 119
4.4.5 Other measures .................................................................................... 124
4.5 Discussion ................................................................................................. 124
4.6 Limitations ................................................................................................ 134
4.7 Conclusion ................................................................................................ 136
4.8 References ................................................................................................ 138
CHAPTER 5 – FEASIBILITY AND EFFECTIVENESS OF THE INTERVENTION ON HYDRATION STATUS AMONG SURFACE MINE WORKERS ........................................ 150
5.1 Introduction .............................................................................................. 150
5.2 Literature review ...................................................................................... 150
5.2.1 Body composition of water .................................................................. 151
5.2.2 Physiological regulation of body water ................................................ 152
5.2.3 Health effects of dehydration .............................................................. 155
5.2.4 Assessing hydration status ................................................................... 157
5.2.5 Promoting hydration at work ............................................................... 160
5.2.6 Summary .............................................................................................. 161
5.3 Methodology ............................................................................................ 162
5.3.1 Design ................................................................................................... 162
5.3.2 Participants ........................................................................................... 162

xiii
5.3.3 Measures – instruments and procedures ............................................ 162
5.3.4 Measures – intervention ...................................................................... 164
5.3.5 Data processing and analysis ............................................................... 166
5.4 Results ...................................................................................................... 167
5.5 Discussion ................................................................................................. 176
5.6 Limitations ................................................................................................ 179
5.7 Conclusion ................................................................................................ 179
5.8 References ................................................................................................ 181
CHAPTER 6 – HEAT STRESS AND HEAT STRAIN AMONG SURFACE MINE WORKERS .................................................................................................................................. 192
6.1 Introduction ............................................................................................. 192
6.2 Literature review ...................................................................................... 192
6.2.1 Heat balance equation ......................................................................... 193
6.2.2 Thermoregulation ................................................................................ 195
6.2.3 Heat-related illnesses ........................................................................... 196
6.2.4 Pre-existing medical conditions ........................................................... 198
6.2.5 Acclimatisation ..................................................................................... 199
6.2.6 Hydration status ................................................................................... 200
6.2.7 Heat stress and heat strain .................................................................. 202
6.2.8 Summary .............................................................................................. 212
6.3 Methodology ............................................................................................ 213
6.3.1 Design ................................................................................................... 213
6.3.2 Participants .......................................................................................... 213
6.3.3 Measures – instruments and procedures ............................................ 214
6.3.4 Measures – intervention ...................................................................... 218

xiv
6.3.5 Data processing and analysis ............................................................... 218
6.4 Results ...................................................................................................... 219
6.5 Discussion ................................................................................................. 229
6.6 Limitations ................................................................................................ 233
6.7 Conclusion ................................................................................................ 234
6.8 References ................................................................................................ 235
CHAPTER 7 – RELATIVE VALIDITY OF THE FOOD AND FLUID FREQUENCY QUESTIONNAIRES ..................................................................................................... 245
7.1 Introduction .............................................................................................. 245
7.2 Literature review ...................................................................................... 245
7.3 Methodology ............................................................................................ 249
7.3.1 Design ................................................................................................... 249
7.3.2 Participants ........................................................................................... 250
7.3.3 Food and Fluid Frequency Questionnaire ............................................ 251
7.3.4 3-day Food Records .............................................................................. 251
7.3.5 Statistical analysis ................................................................................. 252
7.4 Results ...................................................................................................... 256
7.4.1 Validity of the short Fruit and Vegetable questions of the FFQ .......... 256
7.4.2 Validity of the Fluid Frequency Questionnaire .................................... 259
7.5 Discussion ................................................................................................. 266
7.6 Limitations ................................................................................................ 269
7.7 Conclusion ................................................................................................ 271
7.8 References ................................................................................................ 272
CHAPTER 8 – CONCLUSIONS AND RECOMMENDATIONS ........................................ 277
8.1 Introduction .............................................................................................. 277

xv
8.2 Conclusion ................................................................................................ 278
8.3 Limitations ................................................................................................ 279
8.4 Recommendations ................................................................................... 280
8.4.1 Nutrition ............................................................................................... 280
8.4.2 Physical activity .................................................................................... 280
8.4.3 Dehydration and heat stress ................................................................ 281
8.4.4 Policy .................................................................................................... 283
8.4.5 Department of Health – Healthy Workers Initiative ............................ 284
8.5 Contributions to the scientific community .............................................. 284
8.6 References ................................................................................................ 287
Appendix 1 – Ethics approval ................................................................................... 288
Appendix 2 – Participant information sheet ............................................................ 290
Appendix 3 – Participant consent form ................................................................... 293
Appendix 4 – Proposed intervention list.................................................................. 294
Appendix 5 – Questionnaire for participants ........................................................... 299
Appendix 6 – 3-day food record............................................................................... 305
Appendix 7 – Diet, nutrition, physical activity and chronic diseases information .. 313
Appendix 8 – Physical activity information .............................................................. 317
Appendix 9 – Heart disease information ................................................................. 318
Appendix 10 – Diabetes information ....................................................................... 320
Appendix 11 – Fluid frequency questionnaire ......................................................... 323
Appendix 12 – Hydration feedback .......................................................................... 324
Appendix 13 – Hydration status charts .................................................................... 325
Appendix 14 – Hydration and its importance .......................................................... 326

xvi
Appendix 15 – Hydration and heat stress information ............................................ 329
Appendix 16 – Hydration & fluid guidelines information ........................................ 331
Appendix 17 – Heat stress questionnaire ................................................................ 334
Appendix 18 – QuestTemp 36 calibration certificate .............................................. 336
Appendix 19 – CALOR calibration certificate ........................................................... 337
Appendix 20 – Food Diary decisions spreadsheet ................................................... 338
Appendix 21 – Characteristics and activities performed by each Similar Exposure Group (SEG) .............................................................................................................. 360

xvii
LIST OF TABLES
Table 1-1: Mapping of HBM and SCT constructs for the workplace intervention program .............................................................................................................. 15
Table 3-1: Summary of literature review on workplace health promotion programs on nutrition, body weight and physical activity ................................................. 48
Table 4-1: Classification of body mass index (BMI) ................................................... 93
Table 4-2: Categorisation of blood pressure .............................................................. 94
Table 4-3: Categorisation of blood glucose ............................................................... 94
Table 4-4: Calculation and categorisation of physical activity levels ......................... 98
Table 4-5: Baseline measures of participants .......................................................... 104
Table 4-6: Changes in anthropometric measures from baseline at 6-month and 12-month follow-up .............................................................................................. 107
Table 4-7: Changes in self-reported fruits and vegetables over the study period using data from the short FFQ ......................................................................... 108
Table 4-8: Mean daily macronutrient and micronutrient intake (95% CI) at baseline using data from the 3-day FR ........................................................................... 109
Table 4-9: Mean intake of food groups (grams, 95% CI) per consumer per day using data from the 3-day FR .................................................................................... 116
Table 4-10: Changes in self-reported physical activity over the study period ........ 117
Table 4-11A: Pedometer challenge results: categorised by ranking and average daily step count ........................................................................................................ 118
Table 4-11B: Pedometer challenge results, categorised by sedentary, low and physically active lifestyle (based on SDSLI, Tudor-Locke et al 2013) ............... 118
Table 4-12: Statistics on the observed environment characteristics of the worksite at the start of the study (Baseline) and at the end of the study (Final) based on the CHEW tool .................................................................................................. 121
Table 4-13: Food and drink items in each of the six vending machines and refrigerators at the start (baseline) and end (final) of the study..................... 123

xviii
Table 5-1: Water content of body tissues/organs for the average 75kg man (Adapted from Parsons (Parsons 2014)) .......................................................... 152
Table 5-2: Index of hydration status (adapted from (Armstrong et al. 1994, Casa et al. 2000, Oppliger et al. 2005, Armstrong et al. 2010)).................................... 159
Table 5-3: Demography of participants in the hydration testing at all three test points (n = 83). ................................................................................................. 168
Table 5-4: Pre-shift Urine Specific Gravity (USG) and hydration status of all participants at the three test points (n = 83). .................................................. 169
Table 5-5: Hydration status of participants by job location over the three test points (n = 83) ............................................................................................................. 171
Table 5-6: Prevalence of hydration practices and perceptions at work .................. 173
Table 5-7: Correlation of hydration status with potential risk factors .................... 174
Table 6-1: TWL working zones and recommended management interventions (Source: www.pointhealth.com.au) ................................................................. 206
Table 6-2: Demography of participants in the heat stress study (n = 13). .............. 220
Table 6-3: Pre- and post-shift Urine Specific Gravity (USG) and hydration status of participants (n = 13). ........................................................................................ 221
Table 6-4A: Heat strain symptoms among participants. .......................................... 222
Table 6-4B: Heat strain symptoms by age group. .................................................... 223
Table 6-5: Environmental monitoring data and heat stress indices for the first (baseline) monitoring period ........................................................................... 224
Table 6-6: Environmental monitoring data and heat stress indices for the second (midpoint) monitoring period .......................................................................... 225
Table 6-7: Environmental monitoring data and heat stress indices for the third (final) monitoring period ............................................................................................ 226
Table 6-8: Participants’ measures of USG, fluids consumed, heat strain symptoms and physiological monitoring parameters ....................................................... 228
Table 6-9: Correlation of maximum tympanic temperature with potential risk factors .......................................................................................................................... 228

xix
Table 6-10: Correlation of maximum pulse rate with potential risk factors ........... 229
Table 7-1: Comparison of mean and median fruit and vegetables intakes, mean difference and Spearman’s rank correlation between the FFQ and the FR (N = 37) .................................................................................................................... 257
Table 7-2: Comparison of mean and median fluid intakes between the Fluid Frequency Questionnaire and the 3-day Food Record (N = 37) ...................... 261

xx
LIST OF FIGURES
Figure 1-1: Conceptual framework for the study ......................................................... 9
Figure 1-2: Health Belief Model (Nutbeam et al. 2010) ............................................. 11
Figure 3-1: Map showing location of Cowal Gold Mine, NSW, Australia (Source: Google maps) ..................................................................................................... 64
Figure 3-2: Study protocol .......................................................................................... 66
Figure 4-1: The 5-star healthy rating labelling system for selected vending machine products ........................................................................................................... 101
Figure 4-2: Beverage and Snack vending machine before (left) and after (right) the 5-star healthy rating labelling system .............................................................. 102
Figure 4-3: Change in BMI Category (%) from baseline to midpoint (6-month) and final (12-month) (n = 83, P = 0.113 (Chi squared analysis for BMI category)) . 106
Figure 4-4: Comparison of average daily serves of Vegetable with Australian National Health Survey and Australian Dietary Guidelines/Australian Guide to Healthy Eating .................................................................................................. 110
Figure 4-5: Comparison of average daily serves of Fruit with Australian National Health Survey and Australian Dietary Guidelines/Australian Guide to Healthy Eating ................................................................................................................ 111
Figure 4-6: Comparison of average daily serves of Breads and Cereals with Australian National Health Survey and Australian Dietary Guidelines/Australian Guide to Healthy Eating ................................................................................... 112
Figure 4-7: Comparison of average daily serves of Meat and alternatives with Australian National Health Survey and Australian Dietary Guidelines/Australian Guide to Healthy Eating ................................................................................... 113
Figure 4-8: Comparison of average daily serves of Milk and dairy products with Australian National Health Survey and Australian Dietary Guidelines/Australian Guide to Healthy Eating ................................................................................... 114
Figure 4-9: (A) Comparison of average daily consumption of Discretionary foods in grams with Australian National Health Survey. (B) Comparison of average daily

xxi
serves of Discretionary foods with the Australian Dietary Guidelines/Australian Guide to Healthy Eating ................................................................................... 115
Figure 5-1: Schematic representation of the physiological mechanisms involved in regulation of water balance in the body. Red arrows – inhibitory pathways, Green arrows – excitatory pathway (adapted from (Parsons 2014)). ............. 155
Figure 5-2: Average pre-shift Urine Specific Gravity trend over the entire study period (n = 83). ................................................................................................. 170
Figure 5-3: Hydration (A) and Dehydration (B) trends across categories of workers (n=83). .............................................................................................................. 172
Figure 5-4: Average daily fluid consumption recorded using the Fluid Frequency Questionnaire for Total fluids (A), Total water (B), Total non-alcoholic beverages (C) and Total alcoholic beverages (D). ............................................ 175
Figure 6-1: Core temperature changes during exercise-heat stress in heat acclimatised (HA), unacclimatised (UA), normal hydrated (euhydrated (Eu)) and hypohydrated (Hypo) persons (Sawka et al. 2001). ......................................... 201
Figure 6-2: Hydration status pre- and post-shift (n = 13). ....................................... 221
Figure 7-1: Bland Altman plot assessing the validity of the Food Frequency Questionnaire (FFQ) and the 3-day FR. (A) Fruit intake (N = 37). Plot shows the Mean of difference 0.4 serves (CI: 0.0, 0.8), Upper level of agreement (LoA) 3.1 serves (CI: 2.4, 3.9), Lower level of agreement (LoA) -2.3 serves (CI: -3.0, -1.5) and the Regression line (equation: y = -0.233 + 0.417x). (B) Vegetables intake (N = 37). Plot shows the Mean of difference -2.6 serves (CI: -1.9, -3.4), Upper level of agreement (LoA) 1.8 serves (CI: 0.5, 3.1), Lower level of agreement (LoA) -7.0 serves (CI: -8.3, -6.0) and the Regression line (equation: y = 0.378 - 0.965x). ............................................................................................................. 258
Figure 7-2: Bland Altman plot assessing the validity of the Fluid Frequency Questionnaire (FluFQ) and the 3-day FR for Water intake (N = 37). Plot shows the Mean of difference -190.70 mL (CI: -490.22, 108.82), Upper level of agreement (LoA) 1612.25 mL (CI: 1100.44, 2124.06), Lower level of agreement (LoA) -1993.65 mL (CI: -2505.46, -1481.84) and the Regression line (equation: y = 525.4 – 0.418x (CI for regression line -0.940, -0.137)). ................................. 262
Figure 7-3: Bland Altman plot assessing the validity of the Fluid Frequency Questionnaire (FluFQ) and the 3-day FR for Non-alcoholic beverage intake (N =

xxii
37). Plot shows the Mean of difference 152.43 mL (CI: -190, 494.87), Upper level of agreement (LoA) 2213.74 mL (CI: 1628.59, 2798.89), Lower level of agreement (LoA) -1908.87 mL (CI: -2494.02, -1323.72) and the Regression line (equation: y = 457.31 – 0.101x (CI for regression line -0.645, 0.350)). ........... 263
Figure 7-4: Bland Altman plot assessing the validity of the Fluid Frequency Questionnaire (FluFQ) and the 3-day FR for Alcoholic beverage intake (N = 37) using raw data (A) and log transformed data (B). Plot (A) shows the Mean of difference 105.94 mL (CI: -49.54, 261.42), Upper level of agreement (LoA) 1041.86 mL (CI: 776.17, 1307.54), Lower level of agreement (LoA) -829.98 mL (CI: -1095.66, -564.30) and the Regression line (equation: y = 143.60 – 0.114x). Plot (B) shows the plots for log transformed data to show any relationship in the data more clearly. ...................................................................................... 264
Figure 7-5: Bland Altman plot assessing the validity of the Fluid Frequency Questionnaire (FluFQ) and the 3-day FR for Total fluid intake (N = 37). Plot shows the Mean of difference 258.38 mL (CI: -127.57, 644.33), Upper level of agreement (LoA) 2581.62 mL (CI: 1922.11, 3241.13), Lower level of agreement (LoA) -2064.87 mL (CI: -2724.38, -1405.36) and the Regression line (equation: y = 211.876 + 0.012x (CI for regression line -0.520, 0.559)). .............................. 265

xxiii
LIST OF ABBREVIATIONS
ACGIH – American Conference of Governmental Industrial Hygienists
BEVQ – Beverage intake questionnaire
BMI – Body mass index
bpm – beats per minute
°C – degrees Centigrade
CHEW – Checklist for health promotion environments at worksites
CI – Confidence interval
DB – dry bulb temperature
ET – Effective temperature
FFQ – Food frequency questionnaire
FIFO – Fly-in Fly-out
FR – Food record
g – Gram
GT – Globe temperature
HBM – Health belief model
ISO – International Standards Organisation
Kg – Kilogram
KJ – Kilojoule
LOA – Limits of agreement
m – Metre
MET – Metabolic equivalent of tasks

xxiv
µg – microgram
mg – milligram
mL – millilitres
mmHg – millimetres of mercury
mmol/L – millimoles per litre
PHS – Predicted heat strain
RH – Relative Humidity
SCT – Social cognitive theory
SD – Standard deviation
TBW – Total body water
TWL – Thermal work limit
USG – Urine specific gravity
W/m2 – Watts per metre square
WB – wet bulb temperature
WBGT – Wet bulb globe temperature

xxv
ABSTRACT
The high prevalence of overweight and obesity among workers in the mining
industry in Australia poses a significant public health risk. There is a high burden
associated with overweight and obesity among this cohort of workers to both the
employer and the worker in terms of productivity loss, absenteeism, presenteeism
(attending work while sick) and increasing risk of chronic diseases such as diabetes,
hypertension and cancer. Therefore, a workplace health promotion program was
identified as important and worthy of further investigation. The aim of this thesis
was to determine the feasibility and effectiveness of a one year workplace health
promotion program that aimed to reduce the overweight and obesity rates, and to
improve the hydration status of a cohort of workers in the mining industry.
A pre-experimental study was conducted to investigate the feasibility and
effectiveness of a one-year workplace health promotion program to reduce the
body mass index (BMI) and improve hydration status among participants. The
results of this study showed that among study completers (n=83), 83.2% of
participants were either overweight or obese (42.2% overweight and 41% obese) at
baseline. After one year of the workplace health promotion program, 80.7% of
participants were either overweight or obese (38.6% overweight and 42.1% obese)
resulting in a 2.5% decrease in the overall overweight and obesity rates. There was
an increase in the consumption of core foods, especially fruit intake, from a mean of
1.1 serves per day to a mean of 1.9 serves per day (P=0.0249), nearly meeting the

xxvi
Australian Dietary Guidelines and the Australian Guide to Healthy Eating of 2.0
serves per day. Reported physical activity improved in females from 303 MET
minutes / day to 331 MET minutes / day (P=0.738) but decreased in males from 391
to 367 MET minutes / day (P=0.751). There was an improvement to the work
environment at the mine site in terms of being a ‘health promoting worksite’.
Specifically, the number of posters and signage about healthy nutrition, physical
activity, smoking and alcohol increased throughout the year. Contents of the
vending machines and refrigerators at the site were reviewed and an increased
number of healthier options was included.
With regards to dehydration and heat stress, 73% of participants started their shift
dehydrated. By the end of the one-year health promotion program, only 31% of
participants started their shift dehydrated, an improvement of 58% from baseline.
Correlation of hydration status of workers with potential risk factors such as age,
gender, BMI, educational level, physical activity level and smoking status showed no
significant correlation with any of these risk factors. There was no change in the
reported average daily fluid consumption from baseline, suggesting underreporting
as hydration status of participants improved. Among participants who were at risk
of heat related illness (n=13), identified through a Basic Thermal Risk Assessment,
the mean urine specific gravity (USG) was 1.021 (Range 1.010 to 1.027) pre-shift
and 1.024 (Range 1.019 – 1.032) post-shift. Eight were dehydrated pre-shift and 12
were dehydrated post-shift. All 13 participants had at least two heat strain
symptoms, namely headache and fatigue. Environmental temperatures during

xxvii
summer with no cloud cover indicated that these workers were at a high risk of
heat related illness with the predicted heat strain (PHS) index predicting a core
temperature of 38 degrees being reached within the first two hours of work
following lunch break. Considering that workers still have to work for five hours
after the lunch break, this finding is significant for these workers. Under these
working conditions, hydration status plays a very crucial role in heat dissipation
from the core of the body. This was clearly demonstrated as correlation of core
body temperature with potential risk factors such as BMI, pre- and post-shift
hydration status, fluids consumed during the shift and heat strain symptoms
showed significant correlation for pre-shift hydration status only (P<0.05).
The findings presented in this thesis provide evidence that a long term workplace
health promotion program at an open cut mine site is feasible and improved the
control of overweight and obesity rates, hydration status and some aspects of
lifestyle choices. The results suggest that tailored programs can be effective, when
the nature of the workplace and workers are taken into consideration. In addition,
this thesis also provides evidence that pre-shift hydration status is the key factor
determining a worker’s susceptibility to heat stress, and should be addressed as a
priority for any hydration management guideline for working in hot environments.


1
CHAPTER 1 – INTRODUCTION AND THESIS CONTEXT
1.1 Introduction
The mining industry is one of the largest industries in Australia, employing a cohort
of workforce with the highest weekly wages of any industry (ABS 2012). Preliminary
work done at two underground mines in regional New South Wales prior to
commencement of this research showed that up to 91% of workers in this industry
were overweight or obese (Polkinghorne et al. 2013). This was higher than the
national average of 62.8% at that time (ABS 2013). Furthermore, workers in this
industry had a higher rate of inadequate fruit and vegetable intake and higher
alcohol consumption than the national averages at that time (Department of Health
2012). It was therefore important to trial a health promotion intervention in this
workplace, targeting this unique cohort of workers who are at a higher risk of the
chronic health effects of overweight and obesity, such as heart disease, diabetes
and cancer, than any other cohort of workers. This was the genesis of this PhD
research.
Workplace health promotion has been established by the World Health
Organization as one of a number of priority settings for health promotion in the 21st
century (WHO 2015). The workplace is where over half the global population
spends anywhere from a third to half of their day. Thus the workplace has become
the primary hub that influences the physical, mental, economic and social well-
being of workers, their families, their communities and the society. The workplace

2
therefore provides the setting and foundation to support the promotion of health
of a large captive audience. Based on this context, this research examined the
mining industry as a setting in which workplace health promotion interventions to
support healthy lifestyles can be implemented. This is presented in chapter two of
this thesis. Chapter three presents the general overview of the literature on
workplace health promotion programs and their effects on health status, especially
overweight, obesity and physical activity.
Many workplace health promotion programs have identified nutrition and physical
activity as key components that can be targeted for improving overweight and
obesity within the workforce (Oberlinner et al. 2007, Ni Mhurchu et al. 2010,
Quintiliani et al. 2010, Christensen et al. 2011, Verweij et al. 2011, Robroek et al.
2012). However, within the mining industry, another important component that
deserves attention as a target for health promotion programs is hydration status.
Studies have shown that workers in the mining industry tend to start their shift in a
dehydrated state (Carter and Muller 2007, Peiffer and Abbiss 2013, Polkinghorne et
al. 2013, Hunt et al. 2014). This has potential health effects with regard to heat
stress and heat strain, and should be included in health promotion programs for the
mining industry, along with nutrition and physical activity.
This thesis therefore examines nutrition, physical activity and hydration status in a
context of overweight and obesity among the mining workforce. In addition, heat
stress and heat strain are also included as a context, given that work in the mining

3
industry is often in hot humid environments, which may be a risk factor for heat
related illness in overweight and obese workers (Savastano et al. 2009).
1.2 Health problems of workers in the mining industry
1.2.1 Overweight and obesity
Overweight and obesity is a global problem. The prevalence of overweight or obese
men and women in America is 74% and 64% respectively; the prevalence of
overweight men and women in Europe is 50% while the prevalence of obese men is
20% and obese women is 23%; the prevalence of overweight or obesity in Middle
East and North African men is between 69% and 77% while in women it is between
74% and 86%; in Southeast Asia the prevalence of overweight men is between 8%
and 30% while in women it is between 8% and 52% (WHO 2016). A meta-analysis of
body mass index and all-cause mortality among people who never smoked and
without any chronic diseases across four continents – Asia, Australia and New
Zealand, Europe and North America showed a high hazard ratio for all-cause
mortality among overweight (HR = 1.07 – 1.22) and obese (HR = 1.45 – 2.76)
people compared to normal weight people (Global BMI Mortality Collaboration
2016). According to the 2011-2012 Australian Health Survey, 62.8% of Australian
adults (69.7% men and 55.7% women) were either overweight or obese (ABS 2013).
The rate of overweight and obesity by occupation shows that the highest
proportion of overweight or obese workers are machinery operators and drivers
(74%) followed by managers (66%) and technicians and trade workers (63%) (ABS
2011). All three of these occupations are prevalent in the mining industry. Other

4
workplaces are not exempt from this global pandemic. The construction, electricity,
gas and water, government administration and defence, education and health and
community services industries have also recorded high proportions of overweight
and obese workers (ABS 2008). Furthermore, there is a high association between
overweight and obesity and the development of chronic diseases such as heart
disease, type 2 diabetes and some cancers (Willcox 2014). It is important to note
that differences in age and sex of workers across industries and occupations impact
on these data. Nonetheless, it does reflect the growing problem of overweight and
obesity in the workplace setting, and in particular in the mining industry in
Australia. Chapter four of this thesis looks at the nutrition and physical activity
aspects of the workplace health promotion intervention.
1.2.2 Dehydration
Dehydration is a persistent health problem of workers in the mining industry and in
other workplaces as well. The rate at which miners start work in a dehydrated state
ranges from 60% to 91% (Hunt et al. 2013, Montazer et al. 2013, Peiffer and Abbiss
2013, Polkinghorne et al. 2013, Mears and Shirreffs 2015). This is a cause for
concern as dehydration has been shown to be associated also with cognitive
impairment, which may lead to increased risk of adverse workplace incidents
(Lieberman 2007, Ganio et al. 2011, Adan 2012). In addition, dehydration also
increases the risk of developing heat stress and heat related illness (Brake and Bates
2003, Bates et al. 2010, Montazer et al. 2013), which is a significant health concern
for workers in the mining industry, who often work in hot and humid conditions.

5
While different workers have different levels of physiological coping mechanisms to
work in hot humid conditions, it is still important to identify dehydrated workers in
such environments and monitor them closely for signs and symptoms of heat strain.
Therefore, a quick reliable tool to collect fluid consumption data is useful along with
checking workers’ hydration status. Chapters five and seven present the study on
dehydration, and the validity of a short FFQ and a fluid frequency questionnaire
used to collect fruit and vegetables, and fluid consumption data respectively.
1.2.3 Heat stress and heat strain
Overweight, obesity and dehydration may invariably contribute to the development
of potentially fatal heat related illness through heat stress and heat strain
(Armstrong et al. 2007, Arbury et al. 2014). Possible mechanisms for this include
heat storage in fatty tissue and lack of enough body water to sweat effectively and
efficiently (Nadel 1979, Cheung et al. 2000, Savastano et al. 2009). Furthermore, the
time taken to reach exhaustion and fatigue is considerably faster for workers whose
core body temperature is between 38 and 40 degrees celsius (Sawka et al. 1992,
Montain et al. 1994, Latzka et al. 1998). Hence a mining specific workplace health
promotion intervention should target overweight and obesity, hydration status and
heat stress/strain so as to maximise the positive health outcomes for workers, both
in terms of heat related illness and chronic disease prevention. Chapter six presents
the study on heat stress and heat strain.

6
1.3 Research hypotheses
Workplaces provide an excellent means by which to reach a wide adult audience
through targeted health promotion programs. The mining industry is a unique
workplace that, in Australia, mostly operates on a 12-hour shift roster such that
workers have little time to engage in any health promoting activity, either during
work or outside of work. This thesis aims to demonstrate that simple health
promotion interventions can be implemented in a mining worksite despite the
many structural and administrative limitations inherent in such a workplace. This
view is based on an initial hydration intervention in an underground mine site,
which resulted in improvement in hydration status while also highlighting the
problem of overweight and obesity among workers in the mining industry
(Gopaldasani et al. 2012). The main research hypotheses are as follows:
1. Workplace intervention program that targets the mining workers’ lifestyle
and their work environment is feasible in the mine site as a workplace.
2. Workplace intervention program that targets the mining workers’ lifestyle
and their work environment will increase water consumption thus improving
the hydration status of the workers and decreasing heat related illness.
3. Workplace intervention program that targets the mining workers’ lifestyle
and their work environment will decrease consumption of discretionary foods
while increasing consumption of core foods and promoting household and
leisure time physical activity thus reducing body mass index.

7
1.4 Research aims and objectives
The overall aim of this research was to develop, implement and evaluate the
feasibility and effectiveness of a workplace health promotion intervention program
among employees of an open cut mining site. The specific aims of the study were
to:
• Reduce overweight and obesity rates in the mining workers by 5% after a
one-year follow-up period.
• Improve the hydration status of the mining workers by 15% from the
baseline after a one-year follow-up period.
The research objectives were to:
• Improve diet of workers by increasing consumption of core food and
decreasing consumption of discretionary foods to meet the Australian
Dietary Guidelines of 2.0 serves of fruit per day, 5.0 serves of vegetables per
day, 5.5 serves of breads and cereals per day, 2.5 serves of meats and
alternatives per day, and 3.0 serves of milk and dairy products per day.
• Improve physical activity of workers to meet the Australian Physical Activity
and Sedentary Behaviour Guidelines for Adults of 150 to 300 minutes of
moderate intensity physical activity per week or 75 to 150 minutes of
vigorous intensity physical activity per week.
• Increase water intake and decreasing unhealthy drinks to a level that results
in a urine specific gravity of below 1.020.

8
• Investigate the association of overweight, obesity and dehydration on
employee risk of heat related illness.
1.5 Conceptual framework for the study
Poor diet quality (excess consumption of energy dense nutrient poor foods and
limited consumption of core foods), lack of physical activity (including sedentary
work conditions) and dehydration can collectively contribute to overweight and
obesity, and dehydration and heat stress among workers in the mining industry.
These health problems can then predispose to the development of chronic diseases,
which will add to the burden of disease for the workers, the employer, the
community and the country. The conceptual framework outlined in Figure 1-1
draws on the literature review and the risk factors that contribute to the potential
health problems of workers in a workplace. Healthy nutrition, physical activity and
staying hydrated appear to be the key to maintaining a healthy workforce in any
workplace (Anderson et al. 2009, Groeneveld et al. 2010, Morgan et al. 2011).
Monitoring on its own, where this is communicated back to employees, can
potentially become an indirect intervention as the act of monitoring itself may
increase workers’ mindfulness of their nutrition, physical activity levels and
hydration status, thus encouraging them to continuously improve their overall
health.

9
Figure 1-1: Conceptual framework for the study
1.6 Theoretical framework for health promotion intervention
Health promotion is the process of enabling individuals to increase control over
their health and its determinants, thereby improving their health (WHO 2005). In
the context of this definition, workplace health promotion can be defined as the
concerted efforts of employers, employees and the society to improve and maintain
the health and wellbeing of people at work (European Network for Workplace
Health Promotion 2007). The responsibility of workers’ health therefore falls on the
employers and the employees and, by extension, on society. The European Network
for Workplace Health Promotion (European Network for Workplace Health

10
Promotion 2007) through the Luxembourg Declaration highlights three key ways
through which workplace health promotion can be achieved. These are:
1. Encouraging personal development of workers,
2. Improving the work environment; and
3. Improving the work organisation.
Dodson et al (2008) also highlights the importance of complementing workplace
health promotion interventions with environmental interventions and
organisational policy to ensure viability and long-term sustainability. Clearly three
domains can be identified and targeted for workplace health promotion programs
to maximise the outcome from such programs. These include: the worker, the work
environment and the organisation. However, it must be noted that organisational
policy changes usually happen after demonstration of effectiveness of the health
promotion intervention on the worker and the work environment. Thus the
workplace health promotion intervention in this study mainly focused on the
worker and the work environment.
Several theories and models have been used in health promotion at the individual
level and interpersonal level (Health Belief Model, Social Cognitive Theory and
Social Support Theory), environmental level (Social Cognitive Theory), and at the
community/organisational level (Organisational Change Theory). For this research,
the Health Belief Model (HBM) and the Social Cognitive Theory were used at the
individual level, and the Social Cognitive Theory (SCT) at the environmental level.

11
1.6.1 The Health Belief Model (HBM)
The HBM is one of the oldest and most widely recognised health promotion models
used to target individual behavioural change. The model predicts that for
individuals to adopt recommended behaviours, their perceived threats of diseases
and its severity, as well as the benefits of actions, must outweigh their perceived
barriers to action (Rosenstock 1974, Green and Murphy 2014). Figure 1-2
summarises the HBM.
Figure 1-2: Health Belief Model (Nutbeam et al. 2010)
In the HBM, an individual’s perceived susceptibility to disease or illness, as well as
perceived severity of the disease or illness, are governed by many modifying factors
(Egger et al. 1999). These modifying factors include the age of the individual, the
gender, ethnicity and personality, the socioeconomic status and the knowledge
Perceived susceptibility to disease/illness
Perceived seriousness/severity
of disease/illness
Perceived benefits of actions
Perceived barriers to taking action
Perceived threat
Outcome expectations
Self-efficacy (perceived ability to
carry out change)

12
base. Egger (1999) goes on to state that of all these modifying factors, the
knowledge base is one that can be significantly influenced externally through
education and information. Hence if the perceived threat, which is guided by
perceived susceptibility and seriousness of a disease or illness, is high but the
benefits or outcome expectations outweigh the perceived threat, there will be a
shift towards adoption of a behavioural change. It is important to note that the
HBM has been found to be more useful when applied to traditional preventative
health behaviours such as screening and immunisation, but less useful in
interventions for complex, long term behaviours such as alcohol and tobacco use
(Janz and Becker 1984). Research has shown that the HBM has been used to
improve the usefulness of nutrition intervention research (Glanz et al. 1994,
Trudeau et al. 1998, Tanagra et al. 2013). In this study, the nutrition and physical
activity intervention components were based on the HBM constructs outlined in
Table 1-1. Specific intervention components were mapped with the HBM constructs
as shown in Table 1-1.
1.6.2 The Social Cognitive Theory (SCT)
The SCT states that behaviour and learning occur within a social context, with a
dynamic and reciprocal interaction between the individual, their behaviour and the
environment (Bandura 1986). Like the HBM, the interaction between the individual,
the behaviour and the environment is demonstrated by constructs. These include:
• Outcome expectations – a belief about the value of the consequences of
behavioural change.

13
• Self-efficacy – confidence or belief in the individual’s ability to perform a
given behaviour.
• Collective efficacy – confidence or belief in the group’s ability to perform
behaviours that bring about a desired change.
• Self-regulation – controlling oneself through self-monitoring, goal-setting,
feedback, self-reward, self-instruction and social support.
• Behavioural/facilitation capability – providing the tools, resources and/or
environmental changes that make new behaviours easier to perform.
• Observational learning – belief based on observing similar individuals or role
models perform a new behaviour.
• Incentive motivation – the use and misuse of rewards and punishment to
achieve the desired behaviour.
• Reinforcement – which can be external, internal, positive or negative.
Of the various constructs of the SCT, this thesis focused on outcome expectations,
self-efficacy, self-regulation, behavioural capability, incentive motivation and
reinforcement. Studies have demonstrated the usefulness of SCT in facilitating the
adoption of new healthy behaviours towards healthy eating and physical activity
(Amaya and Petosa 2012, Dennis et al. 2012, Lubans et al. 2012, Morgan et al. 2014,
Moyer 2014, Hamilton et al. 2015). The SCT constructs used in this thesis have been
mapped with the intervention components used as shown in Table 1-1. It is
important to note the overlap between constructs in the HBM and the SCT.

14
In summary both the HBM and the SCT models were used to inform the
intervention components in this study, which were comprised of individual
behavioural and environmental interventions.

15
Table 1-1: Mapping of HBM and SCT constructs for the workplace intervention program
Intervention component HBM construct SCT construct Description of component Information and education sessions
• Perceived susceptibility • Perceived severity
• Self-efficacy • Behavioural capability
Information and education sessions on various health topics related directly and indirectly to the work and the workplace
Handouts • Perceived susceptibility • Perceived severity
• Self-efficacy • Self-regulation • Behavioural capability • Reinforcement
Printed materials in the form of handouts and booklets on the various health topics
Individualised participant feedback
• Perceived benefits of action • Perceived barrier
• Outcome expectations • Self-efficacy • Self-regulation • Incentive motivation • Reinforcement
Feedback on weight, BMI, blood pressure, blood glucose, hydration status, nutrition, and physical activity
Referral to NSW Get Health information and coaching service
• Perceived benefits of action • Outcome expectation • Self-efficacy • Self-regulation • Reinforcement
A six month free weight management coaching service
Pedometer challenge • Perceived barriers • Perceived benefits of action
• Self-efficacy • Collective-efficacy • Behavioural capability • Incentive motivation
Pedometers were provided to all participants and a challenge was set up between individuals and between crews with prizes for best performances
Provision of drink machines • Perceived barriers • Self-efficacy Drink machines were provided at various

16
• Perceived benefits of action • Behavioural capability parts of the site to facilitate hydration
Review of vending machines and refrigerated beverages
• Perceived barriers • Perceived benefits of action
• Outcome expectation • Self-efficacy • Self-regulation • Behavioural capability
Vending machine contents were reviewed and healthy food options included, to provide an alternative to the unhealthy contents across the site. Skim and light milk were provided in addition to full cream milk in refrigerators across the site
5-star healthy rating labelling system
• Perceived severity • Perceived benefits of action
• Outcome expectations • Self-efficacy • Self-regulation • Behavioural capability • Reinforcement
All beverages and food items across the site were labelled with a 5-star healthy rating labelling system, in which the highest number of stars denotes the healthiest option

17
1.7 References
ABS 2013, “Overweight and obesity”, accessed 12/01/2015,
http://www.abs.gov.au/ausstats/[email protected]/lookup/33C64022ABB5ECD5CA257B820
0179437?opendocument
ABS 2012, “Employment in Australian industry”, accessed 12/01/2015,
http://www.abs.gov.au/ausstats/[email protected]/Lookup/by%20Subject/1301.0~2012~M
ain%20Features~Employment%20in%20Australian%20Industry~241
ABS 2011, “Overweight and obesity in adults in Australia: A snapshot”, accessed
12/01/2015,
http://www.ausstats.abs.gov.au/Ausstats/subscriber.nsf/0/7DC7186F4A9950DECA2
5789C0023DCEF/$File/4842055001_200708.pdf
ABS 2008. "Overweight and obesity in adults", accessed 12/01/2015,
http://www.ausstats.abs.gov.au/ausstats/subscriber.nsf/0/A54D036CCD28533ACA
2573DA001C9166/$File/47190_2004-05.pdf
Adan, A. (2012). “Cognitive performance and dehydration”, J Am Coll Nutr 31(2): 71-
78.
Amaya, M. and Petosa, R. (2012). "An evaluation of a worksite exercise intervention
using the social cognitive theory A pilot study." Health Education Journal 71(2): 133-
143.

18
Anderson, L. M., Quinn, T. A., Glanz, K., Ramirez, G., Kahwati, L. C., Johnson, D. B.,
Buchanan, L. R., Archer, W. R., Chattopadhyay, S., Kalra, G. P. and Katz, D. L. (2009).
"The Effectiveness of Worksite Nutrition and Physical Activity Interventions for
Controlling Employee Overweight and Obesity. A Systematic Review." American
Journal of Preventive Medicine 37(4): 340-357.
Arbury, S., Jacklitsch, B., Farquah, O., Hodgson, M., Lamson, G., Martin, H. and
Profitt, A. (2014). "Heat illness and death among workers – United States, 2012-
2013." MMWR Morb Mortal Wkly Rep 63(31): 661-665.
Armstrong, L. E., Casa, D. J., Millard-Stafford, M., Moran, D. S., Pyne, S. W. and
Roberts, W. O. (2007). "Exertional heat illness during training and competition."
Medicine and Science in Sports and Exercise 39(3): 556-572.
Bandura, A. (1986). Social foundations of thought and action: A social cognitive
theory, Prentice-Hall, Inc.
Bates, G. P., Miller, V. S. and Joubert, D. M. (2010). "Hydration status of expatriate
manual workers during summer in the middle East." Ann Occup Hyg 54(2): 137-143.
Brake, D. J. and Bates, G. P. (2003). "Fluid losses and hydration status of industrial
workers under thermal stress working extended shifts." Occup Environ Med 60(2):
90-96.

19
Carter, A. and Muller, R. (2007). "Hydration knowledge, behaviours and status of
staff at the residential camp of a fly-in/fly-out minerals extraction and processing
operation in tropical North-Eastern Australia." Ind Health 45(4): 579-589.
Cheung, S. S., McLellan, T. M. and Tenaglia, S. (2000). "The thermophysiology of
uncompensable heat stress. Physiological manipulations and individual
characteristics." Sports Med 29(5): 329-359.
Christensen, J. R., Faber, A., Ekner, D., Overgaard, K., Holtermann, A. and Søgaard,
K. (2011). "Diet, physical exercise and cognitive behavioral training as a combined
workplace based intervention to reduce body weight and increase physical capacity
in health care workers – A randomized controlled trial." BMC Public Health 11: 671.
Dennis, E. A., Potter, K. L., Estabrooks, P. A. and Davy, B. M. (2012). "Weight gain
prevention for college freshmen: comparing two social cognitive theory-based
interventions with and without explicit self-regulation training." Journal of obesity
2012. Article ID 803769, 10 pages, 2012. doi:10.1155/2012/803769
Department of Health 2012, “Healthy workers initiative – Mining industry”,
accessed 12/01/2015,
http://www.healthyworkers.gov.au/internet/hwi/publishing.nsf/Content/industry-
mining

20
Dodson, E. A., Lovegreen, S. L., Elliott, M. B., Haire-Joshu, D. and Brownson, R. C.
(2008). "Worksite policies and environments supporting physical activity in
midwestern communities." Am J Health Promot 23(1): 51-55.
Egger, G., Spark, R. and Donovan, R. J. (1999). Health promotion strategies and
methods, McGraw-Hill Sydney.
European Network for Workplace Health Promotion 2007, “Luxembourg
Declaration on Workplace Health Promotion in the European Union”, accessed
12/01/2015,http://www.enwhp.org/fileadmin/rs-
okumente/dateien/Luxembourg_Declaration.pdf
Ganio, M. S., Armstrong, L. E., Casa, D. J., McDermott, B. P., Lee, E. C., Yamamoto, L.
M., Marzano, S., Lopez, R. M., Jimenez, L., Le Bellego, L., Chevillotte, E. and
Lieberman, H. R. (2011). "Mild dehydration impairs cognitive performance and
mood of men." British Journal of Nutrition 106(10): 1535-1543.
Glanz, K., Patterson, R. E., Kristal, A. R., DiClemente, C. C., Heimendinger, J., Linnan,
L. and McLerran, D. F. (1994). "Stages of change in adopting healthy diets: fat, fiber,
and correlates of nutrient intake." Health Education & Behavior 21(4): 499-519.
Global BMI Mortality Collaboration (2016). “Body-mass index and all-cause
mortality: individual-participant-data meta-analysis of 239 prospective studies in
four continents.” Lancet 388(10046): 776-786.

21
Gopaldasani, V., Polkinghorne, B. G., Furber, S., Davies, B. and Flood, V. M. (2012).
Study of Hydration in Illawarra Miners, BHP Billiton Illawarra Coal.
Green, E. C. and Murphy, E. (2014). Health Belief Model. The Wiley Blackwell
Encyclopedia of Health, Illness, Behavior, and Society, John Wiley & Sons, Ltd.
Groeneveld, I. F., Proper, K. I., van der Beek, A. J., Hildebrandt, V. H. and van
Mechelen, W. (2010). "Lifestyle-focused interventions at the workplace to reduce
the risk of cardiovascular disease – a systematic review." Scandinavian Journal of
Work Environment & Health 36(3): 202-215.
Hamilton, K., Vayro, C. and Schwarzer, R. (2015). "Social Cognitive Antecedents of
Fruit and Vegetable Consumption in Truck Drivers: A Sequential Mediation
Analysis." Journal of nutrition education and behavior 47(4): 379-384. e371.
Hunt, A. P., Parker, A. W. and Stewart, I. B. (2013). "Symptoms of heat illness in
surface mine workers." International Archives of Occupational and Environmental
Health 86(5): 519-527.
Hunt, A. P., Parker, A. W. and Stewart, I. B. (2014). "Heat Strain and Hydration
Status of Surface Mine Blast Crew Workers." Journal of Occupational and
Environmental Medicine 56(4): 409-414.
Janz, N. K. and Becker, M. H. (1984). "The health belief model: A decade later."
Health Education & Behavior 11(1): 1-47.

22
Latzka, W. A., Sawka, M. N., Montain, S. J., Skrinar, G. S., Fielding, R. A., Matott, R. P.
and Pandolf, K. B. (1998). "Hyperhydration: tolerance and cardiovascular effects
during uncompensable exercise-heat stress." J Appl Physiol (1985) 84(6): 1858-
1864.
Lieberman, H. R. (2007). "Hydration and cognition: a critical review and
recommendations for future research." J Am Coll Nutr 26(5 Suppl): 555S-561S.
Lubans, D. R., Plotnikoff, R. C., Morgan, P. J., Dewar, D., Costigan, S. and Collins, C. E.
(2012). "Explaining dietary intake in adolescent girls from disadvantaged secondary
schools. A test of Social Cognitive Theory." Appetite 58(2): 517-524.
Mears, S. A. and Shirreffs, S. M. (2015). "Assessing Hydration Status and Reported
Beverage Intake in the Workplace." American Journal of Lifestyle Medicine 9(2):
157-168.
Montain, S. J., Sawka, M. N., Cadarette, B. S., Quigley, M. D. and McKay, J. M.
(1994). "Physiological tolerance to uncompensable heat stress: effects of exercise
intensity, protective clothing, and climate." J Appl Physiol (1985) 77(1): 216-222.
Montazer, S., Farshad, A., Monazzam, M. R., Eyvazlou, M., Yaraghi, A. A. S. and
Mirkazemi, R. (2013). "Assessment of construction workers' hydration status using
urine specific gravity." International Journal of Occupational Medicine and
Environmental Health 26(5): 762-769.

23
Morgan, P. J., Collins, C. E., Plotnikoff, R. C., Cook, A. T., Berthon, B., Mitchell, S. and
Callister, R. (2011). "Efficacy of a workplace-based weight loss program for
overweight male shift workers: The Workplace POWER (Preventing Obesity Without
Eating like a Rabbit) randomized controlled trial." Preventive Medicine 52(5): 317-
325.
Morgan, P. J., Scott, H. A., Young, M. D., Plotnikoff, R. C., Collins, C. E. and Callister,
R. (2014). "Associations between program outcomes and adherence to Social
Cognitive Theory tasks: process evaluation of the SHED-IT community weight loss
trial for men." Int J Behav Nutr Phys Act 11(1): 89.
Moyer, M. T. (2014). "Use of an Interactive Web-based Platform, Founded on
Constructs from the Social Cognitive Theory, to Benefit Eating Competence."
Nadel, E. R. (1979). "Control of sweating rate while exercising in the heat." Med Sci
Sports 11(1): 31-35.
Ni Mhurchu, C., Aston, L. M. and Jebb, S. A. (2010). "Effects of worksite health
promotion interventions on employee diets: a systematic review." BMC public
health 10: 62.
Nutbeam, D., Harris, E. and Wise, W. (2010). Theory in a nutshell: a practical guide
to health promotion theories, McGraw-Hill.

24
Oberlinner, C., Lang, S., Germann, C., Trauth, B., Eberle, F., Pluto, R., Neumann, S.
and Zober, A. (2007). "Prevention of overweight and obesity in the workplace."
Gesundheitswesen 69(7): 385-392.
Peiffer, J. J. and Abbiss, C. R. (2013). "Thermal Stress in North Western Australian
Iron Ore Mining Staff." Annals of Occupational Hygiene 57(4): 519-527.
Polkinghorne, B. G., Gopaldasani, V., Furber, S., Davies, B. and Flood, V. M. (2013).
"Hydration status of underground miners in a temperate Australian region." BMC
Public Health 13: 426.
Quintiliani, L., Poulsen, S. and Sorensen, G. (2010). "Healthy eating strategies in the
workplace." International Journal of Workplace Health Management 3(3): 182-196.
Robroek, S. J., Polinder, S., Bredt, F. J. and Burdorf, A. (2012). "Cost-effectiveness of
a long-term Internet-delivered worksite health promotion programme on physical
activity and nutrition: a cluster randomized controlled trial." Health Educ Res 27(3):
399-410.
Rosenstock, L. (1974). "Historical origins of the health belief model." Health Educ
Behav 2: 328-335.
Savastano, D. M., Gorbach, A. M., Eden, H. S., Brady, S. M., Reynolds, J. C. and
Yanovski, J. A. (2009). "Adiposity and human regional body temperature." Am J Clin
Nutr 90(5): 1124-1131.

25
Sawka, M. N., Young, A. J., Latzka, W. A., Neufer, P. D., Quigley, M. D. and Pandolf,
K. B. (1992). "Human tolerance to heat strain during exercise: influence of
hydration." J Appl Physiol (1985) 73(1): 368-375.
Tanagra, D., Panidis, D., Tountas, Y., Remoudaki, E. and Alexopoulos, E. C. (2013).
"Implementation of a worksite educational program focused on promoting healthy
eating habits." F1000Research 2: 201
Trudeau, E., Kristal, A. R., Li, S. and Patterson, R. E. (1998). "Demographic and
psychosocial predictors of fruit and vegetable intakes differ: implications for dietary
interventions." Journal of the American Dietetic Association 98(12): 1412-1417.
Verweij, L. M., Proper, K. I., Hulshof, C. T. J. and van Mechelen, W. (2011). "Process
Evaluation of an Occupational Health Guideline Aimed at Preventing Weight Gain
Among Employees." Journal of Occupational and Environmental Medicine 53(7):
722-729.
Willcox, S. (2014). "Chronic diseases in Australia: the case for changing course."
accessed 20/01/2015,
https://www.vu.edu.au/sites/default/files/AHPC/pdfs/Chronic-diseases-in-
Australia-the-case-for-changing-course-sharon-willcox.pdf
WHO 2016, “Obesity in WHO regions”, Geneva, Switzerland, accessed 08/11/2016,
http://www.who.int/topics/obesity/en/

26
WHO 2015, “Workplace health promotion”, Geneva, Switzerland, accessed
12/01/2015, http://www.who.int/occupational_health/topics/workplace/en/
WHO 2005, “The Bangkok Charter for health promotion in a globalized world”,
Geneva, Switzerland, accessed 12/01/2015,
http://www.who.int/healthpromotion/conferences/6gchp/hpr_050829_%20BCHP.
WHO 2003, "Global Strategy on Diet, Physical Activity and Health", Geneva,
Switzerland, accessed 12/01/2015,
http://www.who.int/dietphysicalactivity/strategy/eb11344/strategy_english_web.p
df
27
CHAPTER 2 – THE MINING INDUSTRY – A UNIQUE
WORKPLACE
2.1 Introduction
Understanding the workplace of miners is important in defining the scope of the
potential health problems of workers in the mining industry. Such problems can
include overweight and obesity, dehydration and thermal stress and strain as they
relate to heat illness. Tracing the history of the development of the mining industry
from its historic to its present day operations provided an insight into the various
barriers that today’s workers in the mining industry face, that potentially prevent
them from adopting healthy dietary habits, engaging in physical activity and staying
hydrated at all times.
In order to provide a clear context of the mining industry as a unique workplace, a
literature review was undertaken. Information from peer reviewed and non-peer
reviewed sources were included to provide a general overview of the work
environment in the mining industry. This review also highlighted the lifestyle of
workers in the mining industry, past and emerging health issues and the mining
industry’s response to these emerging health issues. This chapter presents the
results of the review.

28
2.2 A brief history of mining: pre-modern to modern era
Mining has played an important role in the evolution of civilisation since its
inception. Humans have used stones, ceramics and metals that have been mined
close to the surface of the earth (Hartman 1992). Examples of such mining include
flint (a type of quartz) used to create tools, ceramics used to make a variety of
objects ranging from bricks to pottery products and metals such as hematite. The
oldest documented mining site is the “Lion Cavern” found on the Ngwenya
mountain range in Swaziland dating back 43,000 years (Dart and Beaumont 1967,
Swaziland_National_Trust_Commission 2014). Red ochre and hematite were the
minerals of interest having been found at this site. Red ochre was a pigment used as
body paint for rituals. Hematite is being mined in the region around the Lion Cavern
today, thus making it the oldest continuously mined region in the world. The
primitive mining tools used were made of a particular type of stone called dolerite
and tools consisted of choppers, picks and hammer stones. Up until the industrial
revolution, these tools persisted in the mining industry. Miners were often required
to work hard manually digging, shovelling and transporting to the surface ores and
minerals using wheelbarrows and carts. Young boys at the surface would then sort
out rocks from solid minerals such as coal.
The industrial revolution, which began in the 18th century in Britain and later spread
to the world changed the mining industry radically, with rapid growth and
technological advances over the ensuing 100 years. Early technological advances in
the mining industry included the fabrication of better hand held tools from more

29
durable metals. This enhanced the manual mining process, resulting in small
increments in productivity. It also increased the exposure of workers to more dust
and diseases. Due to the nature of mining during this era, workers had a
considerably shorter life span than workers in other industries (Burke and
Richardson 1978, Brundage and Shanks 2008).
Further technological advances in the 20th century included advances in machinery
and related equipment for the mining industry, which converted the mostly manual
job to a semi-automated one. This meant that miners no longer had to work with
manual tools but could use machinery that was manually operated by a miner to
assist in improving efficiency and productivity. Examples of such machinery included
drills and power tools. This again increased the amount of dust exposure and
subsequent lung diseases such as chronic obstructive pulmonary diseases (COPD)
and lung cancers.
The most recent technological advances of the late 20th and early 21st centuries
have made most of the mining work fully automated, with miners now relegated to
the job of overseeing the smooth running of the machines by sitting in the cabin of
a machine and pushing buttons that allow the machine to do the work. More recent
advances in technology have successfully eliminated the human factor entirely by
introducing a fully autonomous mining system, that is, without the need for
operator intervention (Bellamy and Pravica 2011). It is important to note that
humans are, however, required to carry out maintenance activities on the
automated machines to ensure smooth operation.

30
2.3 Mining sites and towns
Mining sites can be categorised either according to their location or according to
the mining technique employed at the mine site. Categorising by location, mining
sites can be either fly-in fly-out (FIFO) or drive-in drive-out (DIDO). Categorising by
the mining technique employed, mining sites can be either surface or underground.
2.3.1 Fly-in fly-out (FIFO) mine sites
FIFO mine sites are sites located in remote areas of the world where employees are
flown in to work temporarily, often on a roster basis (Moore 1999). This is now the
preferred method of getting workers to remote areas where the cost of establishing
a permanent community exceeds the cost of airfares, temporary housing and
feeding at the work site. FIFO jobs involve working 8-12 hour shifts each day for a
number of days followed by days off from work, when workers are flown back to
their homes.
2.3.2 Drive-in drive-out (DIDO) mine sites
DIDO mine sites are sites located within 1-2 hours’ drive from a local town. The job
pattern is similar to FIFO mine sites, involving working 8-12 hour shifts each day for
a number of days followed by days off from work. DIDO mine sites do not incur the
costs of airfares, temporary housing or feeding at the work site. Employers may
however provide bus shuttle services to transport workers to and from the mine
site and nearby towns.

31
2.3.3 Surface mining sites
Surface mining sites include open cut (open pit) mining sites, strip mining sites and
mountaintop removal mining sites. Surface mining involves removal of the soil and
rocks that overlie a mineral deposit using heavy machinery such as excavators,
bulldozers and loaders.
2.3.4 Underground mining sites
Underground mining sites can be either hard rock or soft rock mining sites. Hard
rock mining refers to mining metal ores such as iron, copper, tin, lead, gold and
silver, while soft rock mining refers to mining coal, salt or oil sands. Access to
underground mining sites can be either through steady declines via tunnels, vertical
declines via shafts, or via horizontal excavation into a mountain or hill side. Minerals
are then extracted using machinery and transported to the surface (Hoek et al.
2000).
2.4 Lifestyles of workers in the mining industry
The nature of the work in the mining industry in the pre-industrial era was that of
hard labour using tools such as picks, shovels, wheelbarrows and carts to mine and
transport minerals. This activity involved significant physical strain on the body and
as such miners were mostly physically fit to be able to carry out the job. In those
times miners had control over their working hours. Senior miners could choose
when they wanted to go into the mine and when they wanted to come out
(Metcalfe et al. 1992). Miners generally had no regimented shift hours to work and
thus the workday and hours were flexible. With the industrial revolution and the

32
increased demand for mineral resources, especially coal, employers were in favour
of fixed working hours and thus miners no longer had control over their work hours.
This has persisted, and miners typically now work a 12 hour shift roster with days
off for a combined total of 41 hours or more per week (Heiler et al. 2000). Common
working rosters include 2 weeks on and 1 week off, 3 weeks on and 1 week off and
6 weeks on and 1 week off (Watts 2004). With only enough time to eat and sleep
after a shift, this work lifestyle has created a host of new health issues for the
modern miner, compared to the health issues of the pre-industrial miner.
2.5 Historic legacy of health issues among miners
Physicians and employers of ancient civilisation were not concerned with the health
of their workers, as there were no laws that mandated this. As a result, no records
of workers’ illnesses were kept. Nonetheless, the Greek philosopher Nikander of
Colophon in 250 BC described his observation of an occupational disease (colic) that
may have been attributed to exposure to lead (Needleman 1999). Mercury
poisoning as a disease of slaves was described by Pliny the Elder, in the 1st century
CE when slaves worked the mines that were contaminated with mercury vapour
(Emsley 2005). During the middle ages, Georgius Agricola described the primitive
methods of ventilation and personal protective equipment (PPE) that were in use by
miners working in metalliferous mines (Weber 2002). Bernardino Ramazzini, who is
regarded as the father of occupational medicine, described over 54 different
occupations that were associated with disease (Felton 1997). With the industrial
revolution, technological advances and industrial growth had a deep impact on

33
occupational related diseases. The most common of these diseases were those
associated with dust. For example, Percivall Pott, a London surgeon, described the
association between soot and scrotal cancer among chimney sweeps while Charles
Thackrah, a physician, described the association between dust and several lung
diseases (Brown and Thornton 1957, Cleeland and Burt 1995). These various health
issues were not confined to adult men, but included both women and children.
In early mines in the United Kingdom, whole families often worked at the mines for
12 hours or more at a time to earn better wages by the hour. The father and the
boys would cut the coal from the seams using picks while the mother and daughters
would transport the coal to the surface by carrying them in baskets on their backs.
These baskets were held in place by straps that wound around the front of their
foreheads causing these areas to become bald. The sheer weight of the baskets
caused severe disfigurements of the back and pelvis of young girls, most of whom
died during childbirth later in life (Coal Mine History Resource Center n.d.). Physical
abuse was also quite common, as miners would beat the children if they fell asleep
at the job. Death of miners was also common as miners were taken underground
and brought to the surface using wooden buckets lowered and raised using a rope.
Rope breaks and windlass mistakes often led to miners falling to their deaths. As
news of mining accidents became known, a commission was set up to investigate
the working conditions in the mines. After confirming the shocking working
conditions of miners, the Mines Act of 1842 was implemented, which saw the
prohibition of all females and boys under ten years of age from working in coal

34
mines (Scottish Mining 2015). Several industrialised countries followed suit and
Mining Acts now help to protect vulnerable members of the community.
2.6 Emerging health issues in the mining industry
By the 20th century, classic occupational diseases such as coal workers
pneumoconiosis, anthrax and mercury and lead poisoning had declined in incidence
in industrialised countries, although had not been eradicated. In addition, new
technology and new materials introduced several new diseases such as asbestosis,
silicosis, occupational asthma, noise induced hearing loss and chronic obstructive
pulmonary disease (COPD) all of which are still in existence today although their
incidence has declined. In most industrialised countries the responsibility for health
and safety at work is placed on the employer and reinforced by legislation and
safety standards. This has led to the overall reduction of workplace contaminants
such as coal dust among others, and thus the overall reduction of the classic
occupational diseases. In addition, increasing mechanisation and automation of the
mining industry has led to reduced exposure of workers to possible contaminants
further reducing the risk of developing an occupational disease. However, with
improved technology, mechanisation and automation, other health issues are
increasingly being seen among workers in the mining industry, namely overweight
and obesity, and musculoskeletal disorders.
Over the last half-century, the nature of work and the workplace have changed
significantly. The introduction of computer technology into the workplace in the
1960s and 1970s, followed by globalization in the 1980s, resulted in increased

35
economic competitiveness (Cooper and Jackson 1997), putting more pressure on
workers to deliver more profits for industries. This has resulted in mental and
physical health problems at the workplace, which continue to occur to this day
(Kahn and Langlieb 2003). Increasing mechanization of many industries has
dramatically changed the workforce from one that previously had active work
habits to a passive or even sedentary work lifestyle. Furthermore, new patterns of
working have emerged, such as 8-hour and 12-hour shift working (with irregular
work hours and disturbed sleep patterns), which have been associated with
biological and social problems such as fatigue, insomnia, mood disorders, increased
cardiovascular disease risk, proneness to accidents and overweight and obesity
(Harrington 2001, Choobineh et al. 2012).
Considerable research has been undertaken on the mental and physical health
problems of workers across multiple workplaces today (Kahn 2003, Choobineh et al
2012, Harrington 2001, Pollack et al 2007). With modern lifestyles having become
very busy with family, work, sports/physical activity, leisure and social
commitments to fit into a limited time, there is a need to be healthy to cope with
the demands of daily life. An unhealthy worker is likely to be less productive thus
increasing the cost of presenteeism (the practice of coming to work despite illness
often resulting in reduced productivity) for the employer and increasing the cost of
lost productivity from absenteeism (Scuffham et al. 2013). In considering this,
workplace health promotion has become very relevant to both employers and
workers. For employers, a workplace health promotion program may decrease costs
36
associated with presenteeism and absenteeism while for the workers, the same
health promotion program may improve their general health and wellbeing.
Apart from the health problems associated with shift working mentioned above,
overweight and obesity, dehydration and heat related illnesses from heat stress are
specific health problems among workers in the mining industry in Australia
(Polkinghorne et al. 2013). Another significant health problem among workers in
the mining industry is musculoskeletal disorders (Aickin et al. 2010, Vearrier and
Greenberg 2011, Kunda et al. 2013, Saha and Sadhu 2013).
2.6.1 Overweight and obesity
Data from a 2004-2005 survey showed that in the Australian mining industry, 76%
of workers were either overweight or obese (ABS 2008). This is higher than the 53%
national overweight and obesity rates of adult Australian males for that year.
Overweight and obesity can potentially lead to the development of chronic diseases
such as type 2 diabetes, hypertension, hypercholesterolemia, diseases of the
musculoskeletal system, cardiovascular disease and some cancers (WHO 2003). The
estimated cost of overweight and obesity to the Australian economy in 2008 was
$58.2 billion in both direct and indirect healthcare costs, and over $35.6 billion in
government subsidies (Colagiuri et al. 2010).
2.6.2 Dehydration
A pilot study conducted in underground mines in temperate regions of Australia
showed that up to 61% of workers come to work in a dehydrated state

37
(Polkinghorne et al. 2013). Studies conducted in tropical regions of Australia also
showed that the majority of underground miners are dehydrated prior to
commencing work (Brake and Bates 2003). Both of these studies showed that
workers start their shift dehydrated and tend to remain dehydrated by the end of
their shift. Dehydration worsens the effects of heat stress on the body and also
limits effective physiological response to heat stress (Shahid et al. 1999, Donoghue
et al. 2000). The physiological responses to heat stress by the human body is
termed heat strain and the main responses include increased skin blood flow
(vasodilatation) and sweating; the evaporation of which results in a cooling effect.
However, these responses do have a limit and as core body temperature increases
due to environmental effects these physiological responses cease to be effective.
2.6.3 Heat related illness from heat stress
A number of studies have been undertaken in tropical regions of Australia to assess
the association between heat strain and heat stress of underground miners, to
determine the extent and the limits of the human body's ability to cope with the
demands of thermoregulation in hot working conditions. Heart rate and core body
temperature monitoring have indicated that short bursts of moderate to intense
work in hot working environments provide more challenge to thermoregulation
than self-pacing of work (Brake and Bates 2001, Brake and Bates 2002). An increase
in heat stress predisposes a worker to the development of heat related illness
(Mirabelli et al. 2010). Heat related illness includes heat rash, heat cramps, heat
syncope (fainting), heat exhaustion and heat stroke, which could be potentially fatal

38
(Donoghue et al. 2000, Rae et al. 2008). The first recorded mining-related fatality
from heat stroke occurred in 1924 in a South African underground gold mine and by
1930 the recorded mortality rate from heat stroke was 1.5 per 1000 workers per
year (Wyndham 1974). Between 1930 and 1935 heat stroke had become a major
health hazard in the underground mining industry. By 1935 artificial ventilation of
underground mines was introduced, which decreased the incidence of heat stroke
(Pogue 2006). Nonetheless, heat stroke is still a valid concern in the mining industry
and more so in overweight and obese workers who have impaired physiologic heat
dissipation mechanisms due to the subcutaneous layer of fat which acts as a
thermal insulator (Savastano et al. 2009). Little research has been done to
determine the association between heat strain and dehydration, and also between
heat strain and body mass.
2.6.4 Musculoskeletal disorders
Diseases of the musculoskeletal system were the highest reported chronic condition
among overweight and obese Australians, followed by respiratory and
cardiovascular diseases in 2008 (ABS 2008). In the mining industry, 56% of workers'
compensation claims are for musculoskeletal injuries (SafeWork Australia 2013).
Musculoskeletal system injuries have been reported to be more common among
overweight and obese workers (Pollack et al. 2007), predisposing to absenteeism
from work and leading to increased utilization of workers' compensation, decreased
productivity for the employer and increased costs of managing such workers
(Cawley et al. 2007, Ostbye et al. 2007).

39
2.7 Summary
The mining industry has undergone significant change over the last century. It has
continued to evolve from a workplace that relied on hard manual work to one that
now consists predominantly of heavy industrial machines that do the actual mining
work, to a future that promises to have fully automated mines (though this is
nearing reality now). Analogous to this evolution of the mining industry is the
changing health status of workers from fit and healthy workers, who were at risk of
occupational diseases from dust and toxic substances exposure, such as
pneumoconiosis, to overweight and obese workers who are at risk of chronic
diseases such as Type 2 diabetes, heart disease and musculoskeletal disorders.

40
2.8 References
ABS (2008). "Overweight and obesity in adults." accessed 18/11/2012,
http://www.ausstats.abs.gov.au/ausstats/subscriber.nsf/0/A54D036CCD28533ACA
2573DA001C9166/$File/47190_2004-05.pdf
Aickin, C., Lusted, M., Mitchell, R. and Whitby, L. (2010). Musculoskeletal disorders
(MSD) in NSW mines: Overview of a mail survey. 46th Annual Human Factors and
Ergonomics Society of Australia Conference 2010, HFESA 2010.
Bellamy, D. and Pravica, L. (2011). "Assessing the impact of driverless haul trucks in
Australian surface mining." Resources Policy 36(2): 149-158.
Brake, D. J. and Bates, G. P. (2001). "Fatigue in industrial workers under thermal
stress on extended shift lengths." Occup Med (Lond) 51(7): 456-463.
Brake, D. J. and Bates, G. P. (2002). "Deep body core temperatures in industrial
workers under thermal stress." J Occup Environ Med 44(2): 125-135.
Brake, D. J. and Bates, G. P. (2003). "Fluid losses and hydration status of industrial
workers under thermal stress working extended shifts." Occup Environ Med 60(2):
90-96.
Brundage, J. F. and Shanks, G. D. (2008). "Deaths from bacterial pneumonia during
1918–19 influenza pandemic." Emerging infectious diseases 14(8): 1193.

41
Burke, G. and Richardson, P. (1978). "The profits of death: a comparative study of
miners’ phthisis in Cornwall and the Transvaal, 1876–1918." Journal of southern
African studies 4(2): 147-171.
Cawley, J., Rizzo, J. A. and Haas, K. (2007). "Occupation-specific absenteeism costs
associated with obesity and morbid obesity." J Occup Environ Med 49(12): 1317-
1324.
Choobineh, A., Soltanzadeh, A., Tabatabaee, H., Jahangiri, M. and Khavaji, S. (2012).
"Health effects associated with shift work in 12-hour shift schedule among Iranian
petrochemical employees." Int J Occup Saf Ergon 18(3): 419-427.
Colagiuri, S., Lee, C. M., Colagiuri, R., Magliano, D., Shaw, J. E., Zimmet, P. Z. and
Caterson, I. D. (2010). "The cost of overweight and obesity in Australia." Med J Aust
192(5): 260-264.
Cooper, C. L. and Jackson, S. (1997). "Creating tomorrow's organization: A handbook
for future research in organizational behaviour." Chichester, UK: Wiley.
Dart, R. A. and Beaumont, P. (1967). "Amazing Antiquity of Mining in Southern
Africa." Nature 216(5113): 407-408.
Donoghue, A. M., Sinclair, M. J. and Bates, G. P. (2000). "Heat exhaustion in a deep
underground metalliferous mine." Occup Environ Med 57(3): 165-174.
Harrington, J. (2001). "Health effects of shift work and extended hours of work."
Occup Environ Med 58: 68-72.

42
Heiler, K., Pickersgill, R. and Briggs, C. (2000). Working time arrangements in the
Australian mining industry : trends and implications with particular reference to
occupational health and safety, International Labour Organization.
Hoek, E., Kaiser, P. K. and Bawden, W. F. (2000). Support of underground
excavations in hard rock, CRC Press.
Kahn, J. P. and Langlieb, A. M. (2003). "Mental Health and Productivity in the
Workplace: A Handbook for Organizationas and Clinicians." John Wiley & Sons.
Kunda, R., Frantz, J. and Karachi, F. (2013). "Prevalence and ergonomic risk factors
of work-related musculoskeletal injuries amongst underground mine workers in
Zambia." Journal of Occupational Health 55(3): 211-217.
Metcalfe, A., Williams, T., Almond, L. and Sparkes, A. (1992). The role of history in
the conceptualization of leisure: a case study of the miners of east Northumberland,
1800 to 1914. Sport and physical activity: moving towards excellence: the
proceedings of the AIESEP World Convention, July 20-25, 1990, Loughborough
University, UK., E & FN Spon Ltd.
Mirabelli, M. C., Quandt, S. A., Crain, R., Grzywacz, J. G., Robinson, E. N., Vallejos, Q.
M. and Arcury, T. A. (2010). "Symptoms of heat illness among Latino farm workers
in North Carolina." Am J Prev Med 39(5): 468-471.

43
Ostbye, T., Dement, J. M. and Krause, K. M. (2007). "Obesity and workers'
compensation: results from the Duke Health and Safety Surveillance System." Arch
Intern Med 167(8): 766-773.
Pogue, T. E. (2006). "The Evolution of Research Collaboration in South African Gold
Mining: 1886-1933." PhD Thesis, Maastricht University, Netherlands.
Polkinghorne, B. G., Gopaldasani, V., Furber, S., Davies, B. and Flood, V. M. (2013).
"Hydration status of underground miners in a temperate Australian region." BMC
Public Health 13: 426.
Pollack, K. M., Sorock, G. S., Slade, M. D., Cantley, L., Sircar, K., Taiwo, O. and Cullen,
M. R. (2007). "Association between body mass index and acute traumatic workplace
injury in hourly manufacturing employees." Am J Epidemiol 166(2): 204-211.
Rae, D. E., Knobel, G. J., Mann, T., Swart, J., Tucker, R. and Noakes, T. D. (2008).
"Heatstroke during endurance exercise: is there evidence for excessive
endothermy?" Med Sci Sports Exerc 40(7): 1193-1204.
SafeWorkAustralia (2013). “Mining”, accessed 16/12/2013,
http://www.safeworkaustralia.gov.au/sites/SWA/about/Publications/Documents/4
32/Mining-Fact-Sheet-2011-12.pdf.
Saha, A. and Sadhu, H. G. (2013). "Occupational injury proneness in young workers:
A survey in stone quarries." Journal of Occupational Health 55(5): 333-339.

44
Savastano, D. M., Gorbach, A. M., Eden, H. S., Brady, S. M., Reynolds, J. C. and
Yanovski, J. A. (2009). "Adiposity and human regional body temperature." Am J Clin
Nutr 90(5): 1124-1131.
Scuffham, P. A., Vecchio, N. and Whiteford, H. A. (2013). "Exploring the Validity of
HPQ-Based Presenteeism Measures to Estimate Productivity Losses in the Health
and Education Sectors." Med Decis Making.
Shahid, M. S., Hatle, L., Mansour, H. and Mimish, L. (1999). "Echocardiographic and
Doppler study of patients with heatstroke and heat exhaustion." Int J Card Imaging
15(4): 279-285.
Swaziland_National_Trust_Commission. (2014). "Iron mines." Retrieved
15/10/2014, 2014, from http://www.sntc.org.sz/cultural/ironmine.html.
Vearrier, D. and Greenberg, M. I. (2011). "Occupational health of miners at altitude:
Adverse health effects, toxic exposures, pre-placement screening, acclimatization,
and worker surveillance." Clinical Toxicology 49(7): 629-640.
WHO (2003). "Global Strategy on Diet, Physical Activity and Health." World Health
Organization, Geneva, accessed 15/10/2014,
http://www.who.int/dietphysicalactivity/strategy/eb11344/strategy_english_web.p
df
Wyndham, C. H. (1974). "1973 Yant Memorial Lecture: research in the human
sciences in the gold mining industry." Am Ind Hyg Assoc J 35(3): 113-136.

45
CHAPTER 3 – GENERAL OVERVIEW OF LITERATURE
AND METHODS
3.1 Introduction
This chapter describes the literature review and methodology of a pre-experimental
study, with a treatment group only, that assessed a multi-faceted workplace-based
health promotion program targeting nutrition, physical activity, hydration and heat
stress. The study was conducted between April 2013 and April 2014 in an open cut
metalliferous mine. The University of Wollongong's Human Research Ethics
Committee (HE13/014) approved the study (Appendix 1). A synthesis of the
literature behind workplace intervention programs guided the study context,
including intervention components applicable to a mine site as a workplace,
research design, recruitment of study participants and the initial preparation work
required for the study to commence. Subsequent chapters include sections that
describe reviews of the literature and methodological approach for specific
components of the intervention study related to nutrition, physical activity and
hydration.
3.2 Literature review
A full review of the literature on workplace health promotion interventions was
undertaken and the results are summarised in Table 3-1. There has been very little
published research on health promotion intervention programs specific to the

46
mining industry. With emerging health issues in the mining industry becoming more
prominent (discussed in section 2.6) and studies showing that overweight and
obese workers were more likely to have increased morbidity and use of health
services leading to increased workers compensation claims (Cawley et al. 2007;
Ostbye et al. 2007), it is important to look at the mining industry as a workplace for
health promotion programs, as these are likely to benefit both the employer and
the employees. There are numerous published studies on workplace health
promotion intervention programs across many other workplaces that could
potentially be applied to the mining industry. A review of the effectiveness of such
workplace health promotion programs (WHPP) has been reported in three
systematic reviews by Rongen et al (2013), Geaney et al (2013) and Gudzune et al
(2013). Upon appraising these reviews and the associated studies in them, it was
evident that the programs in other workplace settings would be relevant and
applicable to the mining industry. A detailed review is now provided.
Rongen et al (2013) investigated the effectiveness of WHPP, looking at the influence
of study population, study intervention characteristics and study quality on the
overall effectiveness of WHPP. A total of 18 studies describing 21 interventions
were included in the review (Rongen et al. 2013). Included studies were those that
described a primary prevention WHPP aimed at healthy nutrition, physical activity,
and weight loss or smoking cessation. Only those studies that applied in a
randomised controlled trial design were included.

47
Geaney et al (2013) reviewed the effectiveness of workplace dietary modification
interventions alone (for example food provisioning) or in combination with nutrition
education on employees' dietary behaviour, health status and nutrition knowledge,
among other outcomes. A total of six studies was eligible for the review (Geaney et
al. 2013). To be eligible for the review, the studies had to describe changes in
dietary content of available food, changes in portion size or changes in food choices
available by increasing availability of healthy options in the workplace or workplace
canteens or workplace vending machines. Studies also had to be either a
randomised controlled trial or a quasi-experimental study.
Gudzune et al (2013) reviewed the effectiveness of dietary, physical activity and
environmental strategies for the prevention of weight gain among adults in the
workplace. A total of seven WHPP studies was reviewed (Gudzune et al. 2013). To
be included in the review, the studies had to evaluate dietary, physical activity and
environmental interventions on the outcome of body mass index, weight or waist
circumference change at 12 months or greater. Studies that specifically focused on
weight loss interventions as opposed to prevention of weight gain were excluded
from the review.
All three reviews included findings for nutritional/dietary interventions. Two of the
reviews included findings for physical activity interventions (Gudzune et al. 2013;
Rongen et al. 2013) and two of the reviews included findings for environmental
interventions (Geaney et al. 2013; Gudzune et al. 2013).

48
Table 3-1: Summary of literature review on workplace health promotion programs on nutrition, body weight and physical activity
Authors Study Settings Types of intervention Duration Impact on health status/behaviour
Atlantis et al. (2004) An effective exercise-based intervention for improving mental health and quality of life measure.
A randomized controlled trial.
73 participants from the Gaming industry (Casino) in Australia.
Group physical activity, health education and counselling sessions.
24 weeks. 9.9% (P<0.009) overall improvement in general health.
Bandoni et al. (2011) Impact of an intervention on the availability and consumption of fruits and vegetables in the workplace.
A randomized controlled trial.
2,510 workers from 29 workplaces in Brazil.
Individual – educational materials e.g. posters, flipcharts etc.
Environment – workplace cafeteria food program and culinary workshops.
6 months. 15% (P<0.05) increase in fruit and vegetables consumption in the intervention group between baseline and follow-up.

49
Beresford et al. (2001)
Seattle 5 a Day Worksite Program to Increase Fruit and Vegetable Consumption.
A cluster randomized controlled trial.
2,732 workers from various workplaces including healthcare and education in Seattle, USA.
Individual – information and education of workers using posters, brochures and other media.
Environmental – training cafeteria staff, vending machine modification to include fruit and vegetables choices and nutrition resource kiosk.
2 years. 0.5 serves/day (P=0.06) increase in fruit and vegetables consumption between baseline and follow-up.
Block et al. (2008) Development of Alive! (A Lifestyle Intervention Via Email), and Its effect on health-related quality of life, presenteeism, and other behavioural outcomes.
A randomized controlled trial.
787 workers from a health insurance company in USA.
Individual – electronic media (internet and email).
4 months. OR = 1.57 (P<0.01) for improvement in perceived health status between intervention and control group.
OR = 1.47 (P=0.02) for decrease in presenteeism between intervention and control group.

50
Braeckman et al. (1999)
Effects of a low-intensity worksite-based nutrition intervention.
A quasi-experimental study.
638 male blue-collar workforce in Belgium.
Individual – education program using various mass media, health check including weight, height, BMI, lipid profile.
3 months. 51% increase (P<0.001) in nutrition knowledge but no change in lipid profile.
Dekkers et al. (2011) Comparative effectiveness of lifestyle interventions on cardiovascular risk factors among a Dutch overweight working population
A randomized controlled trial
276 overweight workers from seven workplaces including IT companies, hospitals, an insurance company, a bank and a police station in Netherlands.
Individual – Self-help materials. Phone and Internet based lifestyle intervention on physical activity and nutrition
2 years with 6 months intervention
At 6 months – non-significant average of 700g decrease in body weight.
At 2 years – no difference from baseline.

51
Goetzel et al. (2009) First-year results of an obesity prevention program at The Dow Chemical Company.
A quasi-experimental study.
8,013 workers from nine chemical factories in USA.
Individual – information and education on physical activity and weight management using various media
Environmental – Environmental prompts and point-of-choice messaging in vending machines and cafeteria
1 year No observed effect on prevalence of overweight and obesity.
Goetzel et al. (2010) Second-year results of an obesity prevention program at The Dow Chemical Company.
A quasi-experimental study.
8,013 workers from nine chemical factories in USA.
Individual – information and education on physical activity and weight management using various media
Environmental – Environmental prompts and point-of-choice messaging in vending machines and cafeteria
2 years Intervention group able to maintain weight i.e. prevent weight gain.
Control group gained weight with a non-significant increase in BMI of 0.2.

52
Jeffrey et al. (1993) Effects of work-site health promotion on illness-related absenteeism.
A randomized controlled trial.
1,242 workers from 32 workplaces in USA.
Individual – professional behaviour change classes and voluntary negative incentive via pay deduction for not meeting set goals
2 years 3.7% (P=0.04) reduction in sick days.
Kwak et al. (2010) Changes in skinfold thickness and waist circumference after 12 and 24 months resulting from NHF-NRG In Balance project.
A randomized controlled trial.
553 workers from six workplaces in Netherlands.
Individual – pedometer, tailored advice on nutrition and physical activity.
Environmental – changes in food products at cafeteria, environmental prompts.
2 years Reduction in skin fold thickness and waist circumference (Cohen’s d of 0.26 at 12 months (P<0.001) and 0.44 at 24 months (P=0.005) but no changes in weight or BMI.

53
Lemon et al. (2010) Step ahead a worksite obesity prevention trial among hospital employees.
A cluster randomized controlled trial.
806 workers in six hospitals in USA.
Individual – information via newsletter, website and other printed materials.
Environmental – environmental prompts at stairwells and cafeteria, changes to cafeteria food.
2 years No changes in BMI.
Linde et al. (2012) HealthWorks: results of a multicomponent group-randomized worksite environmental intervention trial.
A randomized controlled trial.
1,747 workers across six workplaces in USA.
Individual – information on healthy eating via newsletters, pedometers.
Environmental – increase availability of healthy food at reduced prices in cafeteria and vending machines, point-of-purchase promotional materials, environmental prompts.
2 years No changes in BMI or weight.

54
McEachen et al. (2011)
Testing a workplace physical activity intervention.
A cluster randomized trial.
1,260 workers from 44 worksites in the UK.
Individual – information and education on physical activity, reminders and fridge magnets to track physical activity, team challenges.
12 months with a 3 month intervention component
No changes in physical activity compared to baseline. Non-significant increase in BMI of 0.22 from baseline.
Nurminen et al. (2002)
Effectiveness of a worksite exercise program with respect to perceived work ability and sick leaves among women with physical work.
A randomized controlled trial.
260 female workers in dry-cleaning services industry in Finland.
Individual – Physical activity counselling sessions by physiotherapist.
15 months with 8 month intervention component
11% improved perceived work ability but no difference in sick days.
Puig-Ribera et al. (2008)
Change in workday step counts, wellbeing and job performance in Catalan university employees.
A randomized controlled trial.
70 university workers in Spain.
Individual – information and education on physical activity and walking routes. Provision of pedometer.
9 weeks Increased step count (+659 steps, P<0.01) for sedentary participants.

55
Robroek et al. (2012) Cost-effectiveness of a long-term Internet-delivered worksite health promotion programme on physical activity and nutrition.
A cluster randomized controlled trial.
924 workers from six workplaces in Netherland.
Individual – internet program tailored to individual including self-monitoring, action oriented feedback and contact with health professionals.
2 years Increase in vegetables intake only (OR of 1.43). No increase in fruit intake or physical activity.

56
3.2.1 Effectiveness of individual targeted nutrition intervention
strategies
Nutritional/dietary interventions included a focus on increasing fruits and
vegetables consumption and decreasing fat, sugar and alcohol intake. To achieve
these outcomes, interventions used strategies such as food labelling, nutrition
education and counselling. Rongen et al (2013) included two studies that had
nutritional/dietary intervention as a focus of the WHPP (Robroek et al. 2012, Block
et al. 2008). Both studies were randomised controlled trials that utilised electronic
media (Internet and email) as tools to administer the interventions. Both studies
showed a small effect on outcomes following the intervention, with the Internet
based intervention study having a non-significant increase in vegetables
consumption after two years of the study (effect size of 0.15 (CI -0.28, 0.57)) and
the email based study having a significant increase in behavioural change towards
increased fruit and vegetables consumption (effect size of 0.25 (CI 0.11, 0.39)). This
could be explained by the study period as the Internet based intervention was
conducted over a two-year period while the email based intervention study was
conducted over a three-month period. Research has demonstrated that short-term
interventions tend to have relatively more success than long-term interventions but
are not sustainable over a long period (Jeffery et al. 2000). It is therefore important
to cautiously interpret results of short-term intervention studies when comparing
against the outcomes of long-term intervention studies. Intervention studies of
greater than 6 months highlight the importance of long-term sustainability of
behavioural and dietary changes.

57
Geaney et al (2013) included six studies all of which had dietary intervention as a
focus of the WHPP. Two studies increased availability and accessibility of fruit and
vegetables at vending machines (Beresford et al., 2001; Sorensen et al., 1999), two
studies used food labelling for fruit and vegetables at canteens (Bandoni et al.,
2010; Steenhuis et al., 2004), one study increased the availability of low-fat
products, and fruit and vegetables (Steenhuis et al., 2004) while one study offered
taste tests for healthy foods (Sorensen et al., 1999). Five of the six studies
introduced nutrition education programmes with menu planning, educational
materials in the form of posters, presentations and newsletters, individual nutrition
counselling and personal advice (Beresford et al., 2001; Sorensen et al., 1999;
Steenhuis et al., 2004; Braeckman et al., 1999; Bandoni et al., 2010). The primary
outcome for all six studies was changes in dietary behaviour. Dietary intakes were
assessed using food frequency questionnaires in four studies (Backman et al., 2011;
Beresford et al., 2001; Sorensen et al., 1999; Steenhuis et al., 2004), one-day food
records in one study (Braeckman et al., 1999) and a survey to calculate portions of
fruit and vegetables consumed in one study (Bandoni et al., 2010). No pooled effect
size analysis was done due to heterogeneity of the studies. However, five of the
studies investigated fruit and vegetables consumption as part of the primary
outcome, with four of the studies reporting a significant increase in fruit and
vegetables consumption. The four studies with a significant increase in fruit and
vegetables consumption had different intervention durations ranging from three
months to 24 months, with higher effect sizes observed in short duration

58
interventions and lower effect sizes with longer term follow-up (Backman et al.,
2011; Beresford et al., 2001; Sorensen et al., 1999; Steenhuis et al., 2004). This
provides evidence that short duration interventions are relatively more successful
than long duration interventions but the sustainability of the program is
questionable.
Gudzune et al (2013) included five studies with dietary intervention components.
Two studies utilised diet and nutritional counselling (Dekkers et al. 2011, Goetzel et
al. 2010), one study changed the food content of vending machines and cafeteria to
healthy options (Linde et al. 2012), and two studies utilized nutrition education
delivered through nutrition education displays and newsletters (Lemon et al. 2010,
McEachen et al. 2011). All five studies had a primary outcome of preventing weight
gain. There were no active weight loss programs in any of the five studies. Primary
outcome measures in all five studies were changes in BMI at 12 and 24 months,
weight change at 12 and 24 months and waist circumference change at 12 and 24
months. Gudzune et al. (2013) defined the meaningful difference between groups
as 0.5kg of weight change or 0.2 kg/m2 BMI or 1.0 cm of waist circumference
change per year based on Williamson’s epidemiologic description of weight change
(Williamson 1993). Using the criteria, only one of the five studies was able to show a
meaningful change from baseline (Goetzel et al. 2009). This same study succeeded
at preventing increased BMI and weight gain at 24 months. This study utilized an
individualized dietary intervention component comprising mostly of dietary
counselling (Goetzel et al. 2010). Using the criteria of waist circumference change of

59
1.0 cm over 12 months, only one of the five studies was able to show this change
from baseline (Kwak et al. 2010). This study succeeded at preventing waist
circumference increase at 24 months. In addition, this study utilized personalized
food diaries, calorie advice and education on maintaining energy balance, dietary
behaviours and self-monitoring. It is clear from this review that dietary intervention
programs that are specifically tailored to individuals are more effective than a
generalized group level intervention. However, it is also well known that individually
tailored dietary interventions are very expensive and time consuming to run,
especially in workplaces that employ a large workforce. Generalized group level
dietary interventions may be effective if combined with other elements of a WHPP,
such as physical activity and environmental strategies.
3.2.2 Effectiveness of individual targeted physical activity intervention
strategies
Physical activity interventions included a focus on increasing leisure time physical
activity in addition to increasing workplace physical activity. Components of the
interventions included walking, active commuting, exercise education and
counselling, use of pedometers, periodic campaigns and challenges targeting
physical activity and use of on-site gymnasiums. Rongen et al (2013) included 14
studies with physical activity as a focus of the WHPP. Four studies used group
physical exercise programs, six studies used education and counselling sessions on
physical activity and four studies used individualized exercise programs with or
without a pedometer. The duration of the physical activity intervention programs

60
ranged from four months to two years. Eight of the 14 studies had health status
(subjectively determined through short questions) as an outcome measure. Five of
the eight studies had statistically significant changes in perceived health status with
the highest change in the short-term studies of up to six-month duration (Nurminen
et al. 2002, Atlantis et al. 2004, Block et al. 2008, von Thiele Schwarz et al. 2008,
Robroek et al. 2012). Ten of the 14 studies had sickness absence/productivity as an
outcome measure. Four of those 10 studies had significant decreases in sickness
absence translating to increased productivity (Jeffery et al. 1993, Block et al. 2008,
Puig-Ribera et al. 2008, Zavanela et al. 2012). In summary, the effect size for health
status as an outcome ranged from 0.0 to 0.58 while the effect size for sickness
absence/productivity ranged from 0.03 to 1.33. The duration of the intervention of
the studies with statistically significant effect sizes ranged from nine weeks (effect
size 1.33) to 24 months (effect size 0.69). This demonstrates that short duration
physical activity interventions may have a larger effect size but may not be more
sustainable than long duration physical activity interventions. However, it is still
important to note that there is an effect size with long-term physical activity
interventions that, if sustainable, could lead to cumulative health benefits for
workers.
Gudzune et al. (2013) included seven studies with diet and physical activity as a
focus of the WHPP. These studies combined physical activity and a dietary
intervention component to further strengthen the primary outcome measure of
changes in BMI, weight and waist circumference changes at 12 and 24 months. Six

61
studies used exercise education and counselling sessions (Dekkers et al. 2011,
Goetzel et al. 2010, Lemon et al. 2010, Linde et al. 2010, Hivert et al, 2007 and
Matvienko et al. 2001) and four studies used periodic physical activity challenges
with or without a pedometer (Kwak et al. 2010, Lemon et al. 2010, Linde et al. 2012
and McEachen et al. 2011). The duration of these intervention programs ranged
from three months to 24 months. Of the seven studies, two studies were able to
demonstrate a statistically significant change in BMI, one after 12 months of
intervention (McEachen et al. 2011) and the other after 24 months of intervention
(Goetzel et al. 2009). Only one study had statistically significant change in weight
gain prevention at both 12 and 24 months after the intervention (Goetzel et al.
2009). Lastly, only one study had statistically significant change in prevention of
waist circumference increase at 24 months after the intervention (Kwak et al. 2010).
With regard to physical activity interventions, it would appear that while short
duration intervention programs have a large effect size, a long duration intervention
program is likely to be more effective, if sustainable, and have a better health
outcome than a short duration program.
3.2.3 Effectiveness of environmental intervention strategies
Environmental interventions included training cafeteria workers, new company
catering policies, modified selections in vending machines, point-of-choice labelling,
environmental prompts to increase awareness of healthy eating, walking groups,
indoor and outdoor walking routes and increasing availability and decreasing price
of healthy food options in cafeteria and vending machines. Geaney et al (2013)

62
included four studies that utilized environmental changes in addition to dietary
components of the WHPP (Braeckman et al. 1999, Sorensen et al. 1999, Beresford
et al. 2001, Bandoni et al. 2011). All four studies used a number of environmental
interventions, as mentioned above. Three of these studies measured fruit and
vegetables consumption as an outcome of the intervention program (Sorensen et
al. 1999, Beresford et al. 2001, Bandoni et al. 2011) and one study measured BMI,
blood lipids and dietary changes as outcomes (Braeckman et al. 1999). Fruit and
vegetable consumption increased significantly in all three studies that measured
this as an outcome. It is important to note here that dietary interventions
supported by environmental changes in a WHPP may be more effective than dietary
interventions alone as highlighted by the three studies that utilised both
environmental changes as well as individual behavioural changes (Sorensen et al.
1999, Beresford et al. 2001, Bandoni et al. 2011).
Gudzune et al (2013) included five studies in their review that had an environmental
component of the WHPP. These studies had a duration ranging from three months
to 24 months. Two studies showed improvements in BMI and weight status of
participants, but these improvements were not significant. One study showed a
significant improvement in BMI and weight of participants (Goetzel et al. 2009). This
study utilized an individualized diet and physical activity intervention component
comprised mainly of diet and physical exercise counselling and an environmental
intervention comprising point-of-choice messaging in cafeteria and vending
machines, environmental prompts to encourage employees to make healthy food

63
choices, setting health objectives as a component of the sites' management goals,
providing training on health-related topics and compiling and sharing feedback to
worksite. Another study showed significant improvement in waist circumference
with no changes in weight or BMI (Kwak et al. 2010). This study utilized
environmental interventions comprising changing food options to healthy options
at cafeteria, workshops and signs promoting healthy eating and instructions on
keeping a food diary.
From these reviews, there is a moderate level of evidence that individually targeted
dietary and/or physical activity interventions combined with environmental
interventions can prevent weight gain and help make the WHPP sustainable over a
long period. However, preventing weight gain and getting workers to reduce their
weight are two very different outcomes. It would seem that preventing weight gain
is easier than getting workers to reduce their weight. Nonetheless, this should be
seen as a first step in getting workers back to their healthy weight.
Following the review of literature, successful workplace interventions were
identified and shortlisted as possible interventions in this study to be trialled in a
mine site (Appendix 4). Details of the general methodology for this study will now
be discussed.

64
3.3 Methodology
3.3.1 Study context
This study was carried out at Cowal Gold Mine (CGM), a drive-in drive-out (DIDO)
open cut metalliferous mine site. The mine is operated by Barrick (Australia Pacific)
Limited. It is located approximately 40 kilometres northeast of West Wyalong and
approximately 350 kilometres west of Sydney, New South Wales (Figure 3-1). The
process for the extraction of Gold at CGM involves drilling, blasting, leaching,
extraction, and smelting. Workers in outdoor processing areas are therefore
exposed to very hot environmental temperatures during the summer months, while
workers in the smelting room are exposed to bursts of very high environmental
temperatures during the smelting process.
Figure 3-1: Map showing location of Cowal Gold Mine, NSW, Australia (Source: Google maps)

65
3.3.2 Research design
A pre-experimental study design was utilised. The choice of a pre-experimental
study was determined by a lack of a control site that was willing to participate in the
study, due to the fact that the mining industry was moving into a period of cost
cutting and consolidation at the time of the project planning. Another factor that
informed the choice of the study design was that it was impossible to accurately
match two mines due to their individual design, size of the mines, the workforce
and the management structure. For example, the test mine selected for this study
was a non-unionised open cut mine whereas most other mines in NSW are
unionised. It was considered that this study design would provide information
about the feasibility and effectiveness for a specific type of mining worksite (open
cut mine) and the model may then be able to be used to build future research for
other mine sites. The main criterion for selection of the study site was a willingness
to participate in the study and an interest in the health of workers at the site. Pre-
and post-intervention measures were conducted at the study site. The primary
outcomes or dependent variables for this study were: changes in BMI; and
hydration status. Secondary outcomes included: dietary habits, specifically fruit,
vegetable, core foods, discretionary foods and fluids consumption; changes in
physical activity patterns; and heat stress assessments. All participants passed
through the same study protocol (Figure 3-2). All measures were taken for each
participant at baseline and at six and 12-month follow-up to evaluate short and
mid-term effects of the health promotion program.

66
Figure 3-2: Study protocol
6-month assessment N = 98
(Fluid frequency questionnaire, weight, blood pressure, blood glucose and urine specific gravity measurements)
Environmental intervention
Behavioural intervention
Recruitment drive N = 450
Baseline assessment N = 141
(Questionnaires (n=105), food record (n=43), weight, height, blood pressure, blood glucose and urine specific gravity measurements)
12-month assessment N = 89 (n=83 for participation at all three time points)
(Questionnaires (n=33), food record (n=25), weight, blood pressure, blood glucose and urine specific gravity measurements)
Consented to participate N = 157

67
3.3.3 Participants
CGM has about 450 workers, including contractors. Workers were required to drive
to the mine site as this was a DIDO site. Majority of the workers commuted to the
mine site on shuttle buses with transit times of 1-2 hour one-way with a total transit
time of 2-4hrs in a day. Workers worked either an 8-hr shift or a 12-hr shift. A cross-
section of the workforce showed that workers could be categorised into indoor
workers (administrative /office staff) and outdoor workers (truck drivers, drillers,
other heavy machinery operators, surveyors and field workers). Outdoor workers
are further divided into four crews – A, B, C and D – with each crew working a four
days-on and four days-off (one cycle) roster throughout the year, with alternating
cycles of day and night shifts.
3.3.4 Eligibility criteria
Workers were considered eligible for the study if they worked at the mine site either
as a primary employee of CGM or as a contractor. All workers were invited to
participate in the study and no one was excluded from the study unless they
voluntarily opted not to partake. Severe disability and other health conditions that
may exclude participants were not anticipated in the workforce, as workers at the
mine were required to be in a reasonably healthy condition to work at the mine.
3.3.5 Sample size calculation
The sample size determination for this study was based on a previous study of
health promotion intervention in the mining industry (Polkinghorne et al. 2013)
where 13% of workers adopted the health promotion intervention at the study site.

68
Using data from the study of Polkinghorne et al (2013), for an infinite population,
the sample size (n) was calculated as follows:
𝑛𝑛 =𝑍𝑍2𝑝𝑝𝑝𝑝𝑒𝑒2
Where Z = 1.96 (95% confidence level), p = 0.13, q = 0.87 and e = 0.05 (precision of
5%)
n = 174
Correcting for the finite population from which available to sample, the following
corrected sample size has been calculated as follows:
𝑁𝑁 =𝑛𝑛
1 + 𝑛𝑛 − 1𝑆𝑆
Where N = corrected sample size, n = sample size for infinite population, S =
population size available (450 workers)
N = 125
To account for a 10% attrition rate during the study, a sample size of 137 was
anticipated. This represented about one-third of the number of workers at the mine
site.

69
3.3.6 Recruitment
All potential participants were informed about the study three months prior to the
study commencing. Strategies to maximise participant recruitment included:
• Information bulletins being circulated during weekly safety meetings and
monthly training sessions;
• Shift supervisors on each crew also informing potential participants of the
study during the pre-shift meetings; and
• A participant information sheet detailing the study objectives, procedures
and what would be required of participants being made available to all
potential participants and posted on all notice boards.
Participation in the study was completely voluntary.
3.3.7 Consent, privacy and confidentiality
All workers who agreed to participate in the study were given a participant
information sheet (Appendix 2) along with an informed consent form (Appendix 3).
Upon reading the participant information sheet, workers signed the attached
informed consent form, thus completing their recruitment into the study. The
participant information sheet contained a paragraph on confidentiality, stating how
information collected from participants would be secured and de-identified. In
addition, the informed consent form explicitly stated that participants were free to
withdraw from the study at any time, taking any data with them, thus covering
consent, privacy and confidentiality of data.

70
3.4 Initial preparation
3.4.1 Meeting with stakeholders
Prior to commencing the research study, meetings were held with the work, health
and safety team at the mine site. The members of the team included the health and
safety manager, the health and safety advisor and two health and safety officers. At
this initial meeting, the broad aims of the research were discussed, including the
pool of employees from which the participants of the study would be drawn, the
feasibility of the different components of the study, the onsite facilities available
and the onsite support that would be provided. A key point from the discussion was
that the daily running of mine operations would not be compromised in any way.
That meant that all aspects of the research would have to be worked around the
daily routine activities of the mine.
Another series of meetings was held with each of the four crews on their respective
training days. During these training days, each one week apart, a presentation was
made to the crews introducing the research study and explaining the aims of the
study, what would be required by participants and the benefits of the study to
employees. Opportunity to ask questions from the researcher was also provided to
clarify any aspect of the research study. Once all questions had been answered,
employees were given a participant information sheet and an informed consent to
participate in the study. This process was repeated for all crews, and participants
were thus recruited from within each crew.

71
3.4.2 Mine site induction and team training
A compulsory two-day mine site induction for the researcher was funded by the
management, to enable the researcher to have access to all areas of the mine site.
For any sensitive areas of the mine, the researcher was accompanied by a
representative of the mine. In addition, support was provided to the researcher by
two members of the health and safety team, each with certified first aid training, to
enable collection of some health data under supervision by the researcher. The
researcher ensured that the two members of the health and safety team were
adequately trained to use the same protocol as the researcher, to collect data.
3.4.3 Implementation of the study
The thesis consisted of two studies. The first study consisted of two separate
processes. The first process was the participants’ measures, which included
completion of a questionnaire, a food record, measurement of the weight, height,
blood pressure, blood glucose and hydration status. Specific details of these
measurements are provided in chapters four and five. The second process was the
implementation of the intervention component, which consisted of: information
and education sessions based on diet and nutrition, hydration, heat stress,
fluid/water consumption, physical activity and chronic diseases such as diabetes,
heart disease and cancer; detailed individual feedback on hydration status, dietary
habits and physical activity levels; presentations and information booklets and
posters on healthy nutrition, physical activity, hydration and heat stress; use of e-
bulletin boards and notice boards to disseminate health promotion information as

72
well as referring participants to the free NSW Get Healthy information and coaching
service for weight management; review of vending machines and refrigerated
beverages on site to provide healthier food options; using the 5-star healthy rating
labelling system to encourage healthy choices; and a pedometer challenge between
the crews to facilitate physical activity on and off site.
The second study was the assessment and measurement of heat stress and heat
strain among high-risk workers such as the shot firers and the processing workers.
Heat stress and heat strain measurements were conducted during the summer
months when the pre-shift and post-shift hydration status, the fluids consumed
during the shift, the tympanic temperature (surrogate for core body temperature),
and the heart rate and assessment of heat strain symptoms were measured. Details
are provided in chapter six.
3.4.3.1 Implementation of participants’ measures
During the meeting with the work, health and safety team, it was determined that
all participants’ measures would be collected prior to the start of the shift, as
participants reported to the front gate. A first aid room was located at the front
gate prior to entering the mine site. This first aid room consisted of three separate
areas, a reception area, an examination/treatment area and a toilet. The reception
area was used by participants to complete the questionnaires while waiting to
measure their weight, height, blood pressure, blood glucose and hydration status.
Upon their completing the questionnaires, instructions on completing the food

73
record were given to participants, who were then ushered to the
examination/treatment room to complete all other measures.
3.4.3.2 Implementation of intervention components
At the meeting with the work, health and safety team, it was determined that some
of the proposed intervention components of the study were feasible, while others
were not. Appendix four provides the full list of proposed interventions.
Presentations on health themes/topics would be included in all department safety
meetings, which occurred on a fortnightly basis. In addition, the mine site e-bulletin
board and the various notice boards around the mine site would be used to
promote the health theme of the month. Contents of vending machines would
remain the same, with respect to the removal of unhealthy food and drink choices
but allowance would be made to include healthy options, commensurate with
labelling of contents using the 5-star healthy rating labelling system. Details of the
rating system are provided in chapter four. The onsite gymnasium facilities would
not be made available for promoting physical activity as this was reserved for
training of emergency rescue personnel, and no time would be given to workers to
make use of the onsite gym during their shift. The use of pedometers during work
was considered inherently safe for use by participants while working at the mine.
Provision of more water drinking stations around the mine site was also feasible as
this was already being planned by management though yet to be implemented.

74
3.4.3.3 Implementation of heat stress and heat strain measurements
At the meeting with the work, health and safety team, it was determined that
access and transportation to any area of the mine where workers were at risk of
heat stress and heat strain would be granted for the purpose of monitoring and
evaluation. During this part of the study, the researcher was accompanied at all
times by a representative of the mine, for health and safety reasons.
3.5 Limitations
Several proposed intervention components were not implemented (Appendix 4):
due to the sensitive nature of the mining operation at this mine site; due to the
limited resources that could be provided by the mine site during a time of cost
cutting and industry consolidation; and due to lack of available time for the
participants during their shift to engage in some of the active intervention
components such as use of the onsite gym to increase physical activity. While these
limitations did not allow for the full suite of proposed interventions to be
implemented, a good number of health promotion interventions were able to be
implemented, centred on the individual participant and the work environment. In
addition, as a result of cost cutting and consolidation, a number of participants
were lost, leading to a reduced number of participants at the end of the study.
3.6 Summary
The reviews of the literature highlight the effectiveness of workplace health
promotion programs (such as construction, health care, transportation and
manufacturing industry) across different worksites, using different strategies. The

75
main strategies used were dietary, physical activity and environmental
interventions. To achieve health status outcomes, notably BMI and weight changes,
dietary interventions alone were less effective than a combination of dietary and
physical activity interventions (Gudzune et al. 2013, Rongen et al. 2013). In previous
research, the introduction of a supportive environment through incorporation of
changes in the workplace proved more effective when combined with dietary
and/or physical activity interventions targeted at individuals (Geaney et al. 2013,
Gudzune et al. 2013). There is also evidence to suggest that while short duration
interventions may have an apparently initial success, gradually they tend to
attenuate, thus questioning long-term sustainability and effectiveness. Long
duration interventions may not appear to be as effective as short duration
interventions but the cumulative effect of long duration interventions, especially
with frequent contact to ensure engagement in the program, the overall health
status of workers would make this more sustainable in terms of improving health of
workers as well as improving productivity (Rongen, Robroek et al. 2013).
For the current study, 35% (n = 157) of the available workers from the mine site
were successfully recruited into the study. This number exceeded the required
sample size of 137. While the full suite of proposed health promotion interventions
could not be implemented, a good number of interventions was implemented
within the confines of the operations of the mine, with as much support as possible
from the work, health and safety team at the mine site.

76
3.7 References
Atlantis, E., Chow, C. M., Kirby, A. and Fiatarone Singh, M. (2004). "An effective
exercise-based intervention for improving mental health and quality of life
measures: A randomized controlled trial." Preventive Medicine 39(2): 424-434.
Backman, D., Gonzaga, G., Sugerman, S., Francis, D. and Cook, S., (2011). “Effect of
fresh fruit availability at worksites on the fruit and vegetable consumption of low-
wage employees.” J. Nutr. Educ. Behav. 43, 113–121.
Bandoni, D. H., Sarno, F. and Jaime, P. C. (2011). "Impact of an intervention on the
availability and consumption of fruits and vegetables in the workplace." Public
health nutrition 14(06): 975-981.
Beresford, S. A. A., Thompson, B., Feng, Z., Christianson, A., McLerran, D. and
Patrick, D. L. (2001). "Seattle 5 a Day Worksite Program to Increase Fruit and
Vegetable Consumption." Preventive Medicine 32(3): 230-238.
Block, G., Sternfeld, B., Block, C. H., Block, T. J., Norris, J., Hopkins, D., Quesenberry,
C. P., Jr., Husson, G. and Clancy, H. A. (2008). "Development of Alive! (A Lifestyle
Intervention Via Email), and its effect on health-related quality of life, presenteeism,
and other behavioral outcomes: randomized controlled trial." J Med Internet Res
10(4): e43.
Braeckman, L., De Bacquer, D., Maes, L. and De Backer, G. (1999). "Effects of a low-
intensity worksite-based nutrition intervention." Occup Med (Lond) 49(8): 549-555.

77
Dekkers, J. C., van Wier, M. F., Ariens, G. A., Hendriksen, I. J., Pronk, N. P., Smid, T.
and van Mechelen, W. (2011). "Comparative effectiveness of lifestyle interventions
on cardiovascular risk factors among a Dutch overweight working population: a
randomized controlled trial." BMC Public Health 11(1): 49.
Cawley, J., Rizzo, J. A. and Haas, K. (2007). "Occupation-specific absenteeism costs
associated with obesity and morbid obesity." J Occup Environ Med 49(12): 1317-
1324.
Geaney, F., Kelly, C., Greiner, B. A., Harrington, J. M., Perry, I. J. and Beirne, P.
(2013). "The effectiveness of workplace dietary modification interventions: a
systematic review." Prev Med 57(5): 438-447.
Goetzel, R. Z., Baker, K. M., Short, M. E., Pei, X., Ozminkowski, R. J., Wang, S. and
Bowen, J. D. (2009). "First-year results of an obesity prevention program at The Dow
Chemical Company." Journal of occupational and environmental
medicine/American College of Occupational and Environmental Medicine 51(2):
125.
Goetzel, R. Z., Roemer, E. C., Pei, X., Short, M. E., Tabrizi, M. J., Wilson, M. G., DeJoy,
D. M., Craun, B. A., Tully, K. J. and White, J. M. (2010). "Second-year results of an
obesity prevention program at the Dow Chemical Company." Journal of
occupational and environmental medicine/American College of Occupational and
Environmental Medicine 52(3): 291.

78
Gudzune, K., Hutfless, S., Maruthur, N., Wilson, R. and Segal, J. (2013). "Strategies to
prevent weight gain in workplace and college settings: a systematic review." Prev
Med 57(4): 268-277.
Hivert, M.F., Langlois, M.F., Berard, P., Cuerrier, J.P. and Carpentier, A.C. (2007).
“Prevention of weight gain in young adults through a seminar-based intervention
program.” Int. J. Obes. (Lond.) 31, 1262–1269.
Jeffery, R. W., Epstein, L. H., Wilson, G. T., Drewnowski, A., Stunkard, A. J. and Wing,
R. R. (2000). "Long-term maintenance of weight loss: current status." Health
psychology 19(1S): 5.
Jeffery, R. W., Forster, J. L., Dunn, B. V., French, S. A., McGovern, P. G. and Lando, H.
A. (1993). "Effects of work-site health promotion on illness-related absenteeism."
Journal of Occupational Medicine 35(11): 1142-1146.
Kwak, L., Kremers, S., Candel, M., Visscher, T., Brug, J. and van Baak, M. A. (2010).
"Changes in skinfold thickness and waist circumference after 12 and 24 months
resulting from the NHF-NRG In Balance-project." Int J Behav Nutr Phys Act 7(1): 26.
Lemon, S. C., Zapka, J., Li, W., Estabrook, B., Rosal, M., Magner, R., Andersen, V.,
Borg, A. and Hale, J. (2010). "Step ahead a worksite obesity prevention trial among
hospital employees." Am J Prev Med 38(1): 27-38.
Linde, J. A., Nygaard, K. E., MacLehose, R. F., Mitchell, N. R., Harnack, L. J., Cousins,
J. M., Graham, D. J. and Jeffery, R. W. (2012). "HealthWorks: results of a multi-

79
component group-randomized worksite environmental intervention trial for weight
gain prevention." Int J Behav Nutr Phys Act 9: 14.
Matvienko, O., Lewis, D.S. and Schafer, E. (2001). “A college nutrition course as an
interventin to prevent weight gain in female college freshman.” J. Nutr. Educ. 33,
95–101.
McEachen, R., Lawton, R. J., Jackson, C., Conner, M., Meads, D. M. and West, R. M.
(2011). "Testing a workplace physical activity intervention: a cluster randomized
controlled trial." Int J Behav Nutr Phys Act 8(29): 1-12.
Nurminen, E., Malmivaara, A., Ilmarinen, J., Ylöstalo, P., Mutanen, P., Ahonen, G.
and Aro, T. (2002). "Effectiveness of a worksite exercise program with respect to
perceived work ability and sick leaves among women with physical work."
Scandinavian Journal of Work, Environment and Health 28(2): 85-93.
Ostbye, T., Dement, J. M. and Krause, K. M. (2007). "Obesity and workers'
compensation: results from the Duke Health and Safety Surveillance System." Arch
Intern Med 167(8): 766-773.
Polkinghorne, B. G., Gopaldasani, V., Furber, S., Davies, B. and Flood, V. M. (2013).
"Hydration status of underground miners in a temperate Australian region." BMC
Public Health 13: 426.

80
Puig-Ribera, A., McKenna, J., Gilson, N. and Brown, W. J. (2008). "Change in work
day step counts, wellbeing and job performance in Catalan university employees: a
randomised controlled trial." Promotion & education 15(4): 11-16.
Robroek, S. J., Polinder, S., Bredt, F. J. and Burdorf, A. (2012). "Cost-effectiveness of
a long-term Internet-delivered worksite health promotion programme on physical
activity and nutrition: a cluster randomized controlled trial." Health Educ Res 27(3):
399-410.
Rongen, A., Robroek, S. J., van Lenthe, F. J. and Burdorf, A. (2013). "Workplace
health promotion: a meta-analysis of effectiveness." Am J Prev Med 44(4): 406-415.
Sorensen, G., Stoddard, A., Peterson, K., Cohen, N., Hunt, M. K., Stein, E., Palombo,
R. and Lederman, R. (1999). "Increasing fruit and vegetable consumption through
worksites and families in the treatwell 5-a-day study." American Journal of Public
Health 89(1): 54-60.
Steenhuis, I., Van Assema, P., Van Breukelen, G., Glanz, K., Kok, G. and De Vries, H.
(2004). “The impact of educational and environmental interventions in Dutch
worksite cafeterias.” Health Promot. Int. 19 (3), 335–343.
von Thiele Schwarz, U., Lindfors, P. and Lundberg, U. (2008). "Health-related effects
of worksite interventions involving physical exercise and reduced workhours."
Scandinavian Journal of Work, Environment and Health 34(3): 179-188.

81
Williamson, D. F. (1993). "Descriptive epidemiology of body weight and weight
change in US adults." Annals of internal medicine 119(7_Part_2): 646-649.
Zavanela, P. M., Crewther, B. T., Lodo, L., Florindo, A. A., Miyabara, E. H. and Aoki,
M. S. (2012). "Health and fitness benefits of a resistance training intervention
performed in the workplace." Journal of Strength and Conditioning Research 26(3):
811-817.

82
CHAPTER 4 – FEASIBILITY AND EFFECTIVENESS OF THE
INTERVENTION ON THE OUTCOME OF OVERWEIGHT
AND OBESITY AMONG SURFACE MINE WORKERS
4.1 Introduction
Overweight and obesity are directly dependent on nutrition and energy intake, as
well as energy expended through physical activity. Healthy nutrition depends on a
number of personal and environmental factors such as nutrition, knowledge and
literacy and the types of foods and beverages available, including through worksite
canteens and vending machines. Lack of physical activity and increased
sedentariness through sedentary leisure-time behaviour or sedentary work roles
have been associated with overweight and obesity (Choi et al. 2010; Stewart-Knox
et al. 2012). This chapter presents the findings of the workplace health promotion
intervention program and the impact of the program on selected health measures
including weight, BMI and physical activity.
4.2 Literature review
According to the World Health Organization (WHO) and the Australian
Commonwealth Government, the workplace has been recognised as a priority
setting for health promotion programs, including workplace nutrition and physical
activity programs (WHO 2007, National Preventative Health Taskforce 2008). The
workplace has been identified as an ideal health promotion setting in which to
target adults. This is because adults spend more than half of their waking life at

83
work (Malik et al. 2014, Reed et al. 2014). Workers in the mining industry spend
considerably more hours at work if they work a 12-hour shift, thus making their
workplace the main avenue for any health promotion intervention programs for this
cohort of workers. These workers are a particularly difficult cohort of workers to
gain access to (George et al. 2012), and they generally tend to be overweight or
obese and physically inactive (Joyce et al. 2013, Polkinghorne et al. 2013) thus
increasing their risk of chronic diseases. This makes the mine site an ideal workplace
setting for health promotion, especially for nutrition and physical activity programs.
A detailed literature review on workplace health promotion programs and their
effects on health outcomes and behaviours was presented in section 3.2. The rest of
this literature review will highlight individual components of workplace health
promotion programs and their importance in influencing workers’ behaviours and
practices as well as their relevance to the employer.
4.2.1 Diet and nutrition
Worksites that have canteens and that provide food to workers can directly
influence their food and nutrient intake (Previdelli et al. 2010). Provision of energy-
dense nutrient-poor foods could potentially contribute to overweight and obesity at
the workplace, particularly where other options are limited. Vending machines are
often stocked with energy-dense nutrient-poor food choices that could potentially
contribute excess dietary energy among workers (Lawrence et al. 2009, Kelly et al.
2012). Workers' knowledge, perceptions of, and barriers to, healthy nutrition are
also crucial in promoting health of workers (Sabinsky et al. 2007, Escoto and French

84
2012, Escoto et al. 2012). This knowledge may influence what workers eat at home,
what foods they bring to work and their choices from food outlets (French et al.
2007 and Devine et al. 2003).
4.2.2 Physical activity
Physical activity is defined as “any activity that gets your body moving, makes your
breathing become quicker and your heart beat faster.” (Department of Health
2014). In essence physical activity involves movements produced by skeletal
muscles that result in energy expenditure (Caspersen et al. 1985). The domains of
physical activity include – occupational (at the workplace), household and leisure
time (for example, recreational activities, exercise and sports) (Samitz et al. 2011).
Sedentary behaviour on the other hand is defined as prolonged time spent sitting or
lying down (except for sleeping) (Department of Health 2014). Physical activity and
sedentary behaviour can be considered polar opposites and Ekelund et al. (2016)
have shown that the detrimental effects of daily sedentary behaviour can be
eliminated by engaging in moderate intensity physical activity for 60-75 minutes per
day. Owen et al. (2000) have shown that environmental determinants of lifestyles,
especially in a workplace setting, can influence both habitual physical activity
through active use of workplace environment (for example, staircases) and facilities
(for example, workplace gym) and even habitual sedentary activity through the
workplace environment (for example, use of elevators) and facilities (for example,
use of emails and telephones rather than walking to colleagues’ offices).

85
The mining industry as a workplace poses a considerable challenge with regards to
engaging workers in physical activity. Many occupations in the mining industry have
become sedentary in nature and this has been elaborated on in Chapter 2. As such
many workers now lack the daily-recommended physical activity in their everyday
work, predisposing them to chronic diseases such as hypertension and diabetes,
thereby increasing their morbidity and mortality (McEachan et al. 2008). Lack of
physical activity and increased sedentariness through sedentary behaviour or
sedentary work roles have been associated with overweight and obesity (Choi et al.
2010; Stewart-Knox et al. 2012). Occupational physical activity that meets the
national guidelines for physical activity may be protective against overweight and
obesity in the absence of leisure time physical activity (LTPA). On the other hand,
low LTPA coupled with a sedentary work role will contribute to overweight and
obesity (Steeves et al. 2012). It could be argued that workers in the mining industry
are exposed to high job loads that are physically demanding in nature, but this is
not necessarily applicable to all workers as many processes in the mining industry
are automated. For example, workers in an open cut mine are usually sitting inside
an air-conditioned cabin of the heavy machine they are operating. This could be
contributing to the very high rates of overweight and obesity in the mining industry.
Furthermore, the mining industry utilises shift working, which may limit
opportunities to engage in sufficient physical activity both at work and at home. In
addition, the lack of physical activity can lead to work-related illnesses and
prolonged recovery, which increases the financial burden of the employer from
absenteeism, sick days, lost productivity and cost of hiring and training new

86
employees (Medibank 2005). Workplace physical activity programs are thus a sound
investment for employers: to reduce the financial burden of poor employee health;
to be seen as being more socially responsible towards their employees; and to
improve corporate image and be a workplace of choice for highly qualified and
experienced employees.
Such a workplace physical activity program can reduce sick leave and absenteeism
by 25%, decrease workers compensation costs by 40%, decrease disability
management costs by 24% and improve productivity of both the employer and the
employee (HAPIA 2010). Research has also demonstrated that for every $1 spent on
workers’ health, a return on investment of up to $4 is seen (Henke et al. 2011 and
Baicker et al 2010). As such, planning and implementation of a workplace health
promotion program focusing on nutrition and physical activity are beneficial to both
the employer and the employee.
4.2.3 Summary
Individual behavioural (knowledge, attitudes and practices) as well as
environmental (worksite canteens and vending machines) components of a
workplace health promotion program may be synergistic in improving the health
status of miners with respect to overweight and obesity. Such a synergy may be
instrumental in the long-term sustainability of a workplace health promotion
program. In addition, it would appear that the benefits to the employer far
outweigh the costs of running such a program. The detailed methodology of such a
program is outlined below.

87
4.3 Methodology
4.3.1 Design
Two formal measurement periods were selected for diet, nutrition and physical
activity measures, while three formal measurement periods were selected for
weight, height, body mass index, blood pressure and blood glucose measurements.
The baseline measure for diet, nutrition and physical activity was conducted in April
2013, with one-year follow-up in May 2014. The baseline measure for weight,
height, body mass index, blood pressure and blood glucose level was conducted
between January and March 2013. The second measure for weight, height, body
mass index, blood pressure and blood glucose measurements was conducted in
August 2013. The third and final measure for weight, height, body mass index,
blood pressure and blood glucose measurements occurred after one year, between
January and March 2014. Further details are provided in figure 3.2, above.
4.3.2 Participants
A total of 157 participants consented to participate in the study, of which 141
provided baseline data. Of these 141 participants, 105 completed the diet, nutrition
and physical activity questionnaire and 69 of these also completed the 3-day food
record. At the one-year follow-up, 89 participants took part in the study measures
(36.9% attrition rate). Of these 89 participants, 33 completed the diet, nutrition and
physical activity questionnaire and 25 also completed the 3-day food record.
Further details are provided in figure 3.2, above.

88
With regard to measures of weight, height, body mass index, blood pressure and
blood glucose measurements, 141 participants completed these measures at
baseline, 98 participants completed these measures at the mid-point of the study
and 89 participants completed these measures at the one-year follow-up. Further
details are provided in figure 3.2, above.
4.3.3 Measures – instruments and procedures
4.3.3.1 Questionnaires
A) General questionnaire
A general questionnaire was developed comprising seven sections using validated
questions from the 2011 New South Wales Population Health Survey which were
originally based on the Active Australia Survey developed and validated by the
Australian Institute of Health and Welfare (Appendix 5 footnotes).
• Section 1 collected demographic information from participants, including
age, gender, suburb of home address and educational qualifications, as well
as non-demographic information, including clothing worn at work, number
of hours worked, part of body used most during work and any work-related
injuries.
• Section 2 collected information on smoking status. The already validated
questions in this section were adapted from the 2011 New South Wales
Population Health Survey.

89
• Section 3 collected information on hydration perception, practices and
barriers to hydration at work. The already validated questions in this section
were adapted from the 2011 New South Wales Population Health Survey.
• Section 4 collected information on health status, focusing on diabetes and
hypertension. The already validated questions in this section were adapted
from the 2011 New South Wales Population Health Survey.
• Section 5 collected information on physical activity. The already validated
questions in this section were adapted from the 2011 New South Wales
Population Health Survey.
• Section 6 collected information on fruit and vegetable consumption. A
validation of this part of the questionnaire was undertaken comparing the
responses from the 3-day food record. Details of this validation study are
presented in chapter seven.
• Section 7 collected information on fluid consumption using a Fluid
Frequency Questionnaire. A validation of this part of the questionnaire was
undertaken comparing the responses from the 3-day food record. Details of
this validation study are presented in chapter seven.
B) 3-day food record
In addition to the general questionnaire, participants were also given a 3-day food
record to complete (Appendix 6). This food record consisted of instructions, an
example of how and what to fill in the record, and three days (two weekdays and
one weekend day) of record sheets to be used to record food and drinks consumed.

90
A Microsoft Excel 2010 database was created and used to document all nutrition
decisions regarding the food record if food items in the FoodWorks software did not
directly correlate with an item recorded by participants. This decision was then used
throughout the data entry process for all similar food record entries into the
FoodWorks software (Appendix 20). Of the 69 participants who completed the 3-
day food record at baseline, 26 were unusable as their average energy intake was
lower than their basal metabolic rate, leaving 43 useable food records.
C) Type 2 Diabetes risk assessment questionnaire
The Australian Type 2 diabetes risk assessment questionnaire was also given to
participants to take home and return upon completion (Department of Health
2013).
D) Administration of questionnaires
The general questionnaire was administered to all participants by the primary
researcher. Upon completing this questionnaire, participants were given the 3-day
food record and instructed on how to complete it using the example provided in the
food record as a guide. The general questionnaire was administered prior to shift
commencement. The 3-day food record and the diabetes risk assessment
questionnaires were given to the participants to take home and return upon
completion.

91
4.3.3.2 Physical measures
The weight, height, body mass index, blood pressure and blood glucose
measurements were undertaken by the primary researcher with assistance from
two members of the mine site’s health and safety team who had certified first aid
training. These measures were collected prior to shift commencement after
completion of the general questionnaire. All physical measures were undertaken in
accordance with the World Health Organisation’s stepwise approach to chronic
disease risk factor surveillance guidelines (WHO 2013). Measures taken included:
height and weight from which the body mass index was calculated (weight in
kilograms (kg) divided by height in metres squared); and blood pressure and blood
glucose.
A) Height
The height was measured using a portable stadiometer (Wedderburn Portable
Stadiometer). The stadiometer was setup against a wall to provide support during
measurement. Participants were asked to remove their footwear and headgear
before standing on the stadiometer board. However, none of the participants
agreed to remove their footwear as the standard issued steel capped boots were
too cumbersome to remove and put on again. The primary researcher reviewed the
time required to remove and put on the steel capped boots and concluded that the
time taken to remove and put on the boots would increase the transit time for each
participant. This would not be favourable to mine operations, as it would delay the
start of shift work. Participants were therefore allowed to stand on the stadiometer

92
with their boots on and subtractive corrections were made with regard to the
additional height contribution from the boots for both males and females. This was
considered reasonable, as all boots were standard issue and had the same height
contribution from the soles of the boots for both males and females. The procedure
followed to measure the height was in accordance with the Guide to Physical
Measurements of the WHO steps manual (WHO 2013).
B) Weight
The weight was measured using a digital precision weighing scale with 50 gram
increments (A & D Precision Scale UC-321). The scale was placed on an even, firm,
flat surface. Participants were asked to remove any accessories they carried that
would contribute to their weight. These included utility belts, helmets and radios.
Participants weighed in with boots. This was necessary in order to keep to the time
constraints of starting the shift on time, as discussed above. As the boots were
standard issue, a representative sample of the boots was taken and each pair was
weighed and the average weight calculated for the boots. The weight of the boots
was then subtracted from the recorded weight to get the actual weight without the
boots. No correction factor was applied for the standard issue clothing worn (shirt
and trouser) for two reasons. First, the weight of the clothing was negligible and
secondly, participants were always weighed in their standard issue clothing before
starting their shift and would thus nullify the weight contribution of the clothing in
relation to change of weight between the measures. Otherwise, participants’

93
weight was measured in accordance with the Guide to Physical Measurements of
the WHO steps manual (WHO 2013).
C) Body Mass Index
The body mass index was calculated from the weight and the height using the
following formula:
Body Mass Index = W / H2
Where W = Weight in kilograms and H = Height in metres
The body mass index was then used to classify participants’ weight and the risk of
associated health problems, as shown in table 4.1
Table 4-1: Classification of body mass index (BMI)
CLASSIFICATION BMI RISK OF OTHER RELATED HEALTH PROBLEMS
Underweight < 18.50 Low (but risk of other clinical problems increased)
Normal range 18.50 - 24.99 Average
Overweight 25.00 – 29.99 Increased
Obese 30.00 + Moderate to Severe
D) Blood pressure
Both the systolic and diastolic blood pressures were measured using a vital signs
monitor (WelchAllyn Spot Vital Signs Device). Four cuff sizes were used ranging
from small to extra-large depending on the circumference of the participant’s upper
arm. The blood pressure was measured in accordance with the Guide to Physical

94
Measurements of the WHO steps manual (WHO 2013). The systolic and diastolic
blood pressures were used to categorise participants into a blood pressure
category, as shown in table 4-2.
Table 4-2: Categorisation of blood pressure
CATEGORY SYSTOLIC BLOOD PRESSURE (mmHg)
DIASTOLIC BLOOD PRESSURE (mmHg)
Low Blood Pressure (Hypotension)
< 90 < 60
Desired 90 - 119 60 - 79
Pre-hypertension 120 - 139 80 - 89
Hypertension > or = 140 > or = 90
E) Blood glucose
The blood glucose was measured using a glucometer (Accu-Chek Advantage).
Participants were asked to state how long prior to testing they had eaten any food,
or drunk any fluid other than water, prior to testing. This information was used to
categorise the blood glucose into fasting blood glucose (FBG), two-hour post
prandial (2HPP) and random blood glucose (RBG) as shown in table 4-3.
Table 4-3: Categorisation of blood glucose
CATEGORY Blood Glucose Range (mmol/L)
Random blood sugar 3.9 - 7.8
Fasting blood sugar 5.0 - 7.2
2-hr post prandial < 10

95
4.3.4 Measures – Intervention
The health promotion intervention program was implemented from two
perspectives: the individual participants and the work environment. The
components of the health promotion intervention program that targeted individual
participants were information and education, focused with reinforcement of
positive dietary and physical activity behaviours through individualised participant
feedback of their nutrient consumption, physical activity levels, physical measures
(weight, body mass index, blood pressure and blood glucose levels), and through
the Type 2 diabetes risk assessment tool. Participants also were referred to the free
NSW Get Healthy Information and Coaching Services if they were identified as being
overweight. A pedometer challenge was established, involving healthy competition
between groups as well as individuals, using a pedometer to record the step count
at the end of the day just before retiring to bed. The components of the health
promotion intervention program that targeted the work environment, included
provision of drink machines around the site, a review of the vending machines and
refrigerated beverages on site and use of a 5-star healthy rating labelling system for
food and beverages.

96
4.3.4.1 Intervention strategies focusing on individuals
A) Information and education
Specific information and education sessions were delivered to the participants over
the study duration. Handouts of education sessions were also provided to
participants. Topics of the focus included:
• Diet, nutrition and chronic diseases risk (Appendix 7) – This topic discussed
food intake goals for adult Australians, recommendations for preventing
diet-related chronic disease risk, tips to add variety to meals, tips to limit
added sugar consumption, tips to limit excess salt consumption and tips to
eat less-saturated fats.
• Physical activity and its importance (Appendix 8) – This topic discussed the
health benefits of physical activity, the national physical activity guidelines
and how to stay physically active.
• Physical activity and chronic disease risk (Appendix 7) – This topic discussed
the four steps for better health for Australian adults with regard to physical
activity. Information on types of physical activity was also provided and
categorised into sedentary, light, moderate and vigorous activities.
• Heart disease (Appendix 9) – This was one of two chronic diseases topics
that were covered in the information and education interventions. This topic
discussed the risk factors for development of heart disease, including high
blood pressure, high cholesterol level, overweight and obesity and physical
inactivity. The topic showcased heart attack as the most common

97
manifestation of heart disease and how to recognise an imminent heart
attack.
• Diabetes (Appendix 10) – This was the second chronic diseases topic that
was covered in the information and education interventions. This topic
discussed what diabetes is, the types of diabetes, recognising symptoms of
diabetes, knowing the risk of diabetes by using the Type 2 Diabetes Risk
Assessment Tool and management of diabetes.
B) Individualised participant feedback
• Nutrition – Each participant was given nutritional feedback based on both
the questionnaire and the 3-day food record. Feedback included number of
serves of fruits and vegetables consumed per day compared with the
Australian Dietary Guidelines and the Australian Guide to Healthy Eating
(NHMRC 2013a and 2013b); percentage of total and saturated fats and
carbohydrates consumed, compared with the Macronutrient guidelines of
the Nutrient Reference Values for Australia and New Zealand, to reduce the
risk of chronic disease (NHMRC 2015); grams of dietary fibre consumed
compared with the Macronutrient guidelines of the Nutrient Reference
Values for Australia and New Zealand (NHMRC 2015); amount of sodium
consumed compared with minerals and trace elements guidelines of the
Nutrient Reference Values for Australia and New Zealand (NHMRC 2015)
and finally, the amount of alcohol consumed compared with the Australian
guidelines to reduce health risks from drinking alcohol (NHMRC 2009). The
feedback also contained general recommendations and guides to serve sizes

98
for core food groups such as vegetables, fruits, breads and cereals, meat and
alternatives, and milk and dairy products.
• Physical activity – Each participant was given feedback on their physical
activity levels based on the answers provided in the questionnaire. The
questions used to assess and categorise physical activity were based on the
National Australian Health Survey Users’ Guide 2011-2013 (ABS 2013). Table
4-4 outlines the calculation and categorisation of physical activity levels used
to provide feedback to participants.
Table 4-4: Calculation and categorisation of physical activity levels
EXERCISE LEVEL Scoring criteria
Sedentary Score less than 50
Low Score 50 to <800
Moderate Score 800–1600, or >1600 but with less than 2-hrs of vigorous exercise
High Score >1600 and with 2-hrs or more of vigorous exercise
Formula for calculating score:
No. of times activity undertaken in last week x average time per activity (minutes x intensity) Intensity value was estimated based on the three categories of exercise as follows (Ainsworth et al 2000): • 2.5 for walking • 5.0 for moderate exercise • 7.5 for vigorous exercise

99
• Physical measures – Each participant was given feedback on their BMI, blood
pressure and blood glucose levels using the categories outlined in tables 4-1
to 4-3.
C) Other interventions
• Referral to NSW Get Healthy Information and Coaching Services – Each
participant whose BMI was in the overweight and obese category were
given an optional referral to the NSW Get Healthy Information and Coaching
Service delivered by NSW Health, a six month free coaching service aimed at
helping individuals reduce weight.
• Pedometer challenge – To encourage physical activity, a pedometer
challenge was organised as part of the intervention program. The challenge
was to do at least 10,000 steps per day. It is recognised that walking 10,000
steps per day is likely to meet the current physical activity guideline of 30
minutes of moderate intensity physical activity per day for at least 5 days of
the week (Le-Masurier et al. 2003). The cohort of workers in this workplace
were mostly sedentary hence during the analysis 5,000 steps was used as
the cut-off instead of 10,000 steps as research has shown that this is a good
benchmark for Step-defined sedentary lifestyle index in adult population
(Tudor-Locke et al. 2010). The challenge was organised between each of the
four crews A, B, C and D as a group challenge to facilitate peer support of
participants within each of the crews. Prizes such as t-shirts and caps were
awarded for the most physically active crew and a $50 sports shop voucher
was awarded for the most physically active person overall.

100
4.3.4.2 Intervention strategies focusing on the work environment
The work environment was assessed using the Checklist for Health Promotion
Environments at Worksites (CHEW) (Oldenburg et al 2002). Based on the baseline
information obtained from the CHEW, the following interventions were
implemented:
• Provision of drink machines around the site – water bubblers were provided
and strategically placed across the entire site to ensure ready availability for
workers without having to go to the break room to replenish water supplies.
• Review of the vending machines and refrigerated beverages – a review of
the contents of the vending machine and refrigerated beverages was
conducted using the Checklist of Health Promotion Environments at
Worksites (CHEW) and healthier snack (popcorn, weight watchers bars and
tuna lunch) and drink options (water, reduced fat and skim milk) were
introduced in all vending machines and in all refrigerators across the work
site.
• Use of a 5-star healthy rating labelling system for food and beverages – A 5-
star healthy rating labelling system for foods and beverages was used to
inform participants about their choices of healthy food and drinks. This
labelling system was developed by the Australian government in
collaboration with industry partners and public health and consumer groups.
The labelling system rated the overall nutritional profile of packaged foods.
At the time of the study, this labelling system was being proposed by the

101
Australian government and was thus trialled in this study with permission.
Healthier food and beverages were defined as having 3.5 stars and above.
Figures 4-1 and 4-2 illustrate the 5-star healthy rating labelling system for
selected vending machine and refrigerated products.
•
Figure 4-1: The 5-star healthy rating labelling system for selected vending machine
products

102
Figure 4-2: Beverage and Snack vending machine before (left) and after (right) the
5-star healthy rating labelling system

103
4.3.5 Data processing and analysis
All data were entered into the statistical software IBM SPSS version 21 with the
exception of the 3-day food record data, which was entered into the software
FoodWorks version 7 (Xyris Software) using the Ausnut 2007 food database to
analyse the food record entries. Mean, median and standard deviations are
provided as summary indices for all data. Independent and paired sample t-test, chi
square test and ANOVA were used to compare means across different time points
of data collection with respect to weight, body mass index, blood pressure and
blood glucose levels. Correlation analysis was used to assess the magnitude and
direction of relationships between dependent and independent variables including
age, gender, body mass index, crews and work location. Post-hoc statistical power
was calculated for student t-Test using the observed effect size. The last
observation data for participants who dropped out of the study were retained and
used as their final data point where possible, making this an intention-to-treat
analysis. A One-sample t-test was used for comparison of serves to the Australian
Dietary Guidelines and the Australian Guide to Healthy Eating. Statistical
significance was set at a P-value of <0.05.
4.4 Results
A total of 157 participants was recruited through a recruitment drive, as previously
outlined in figure 3.2. At the baseline assessment, 141 participants (109 males and
32 females) out of the 157 recruited into the study participated. However, during
each data collection phase not all participants completed all sections of the

104
questionnaire. Hence data are presented for the number of participants who were
able to provide complete data sets.
4.4.1 Anthropometric measures
The average age of all participants was 39 years with a range of 20 to 64 years.
Males constituted 77% of this population (n=109) while females constituted 23%
(n=32). The average weight of the participants was 95.8kg (95% CI 92.8, 98.7) and
78.8kg (95%CI 72.7, 84.8) respectively in males and females. The average body mass
index was 30 kg/m2 (95% CI 29.1, 30.8) in males and 28 kg/m2 (95% CI 26.2, 30.2) in
females. Table 4-5 outlines the baseline measures of anthropometric variables.
Table 4-5: Baseline measures of participants
Males (n = 109) Females (n = 32)
Mean SD Mean SD
Age (years)a 39 11 40 11
Weight (kg) 95.8 15.4 78.8 16.9
Height (cm) 178.8 6.2 167.0 5.8
BMI (kg/m2) 29.9 4.4 28.2 5.5
Systolic blood pressure (mmHg) 130.7 12.6 126.5 19.7
Diastolic blood pressure (mmHg) 82.1 8.4 79.3 11.6
Blood glucose (mmol/L) 6.4 1.4 5.7 1.5
SD – standard deviation, BMI – body mass index a n = 78 males and 26 females

105
At the start of the study, 83% of the participants who completed anthropometric
measures at all study times were overweight or obese. This is not surprising given
that 90% of workers in an underground mine in a similar geographic region were
overweight and obese (Polkinghorne et al. 2013). As overweight and obesity are risk
factors for chronic diseases, including diabetes and hypertension, blood pressure
and blood glucose measurements were also relevant. The average blood glucose,
systolic and diastolic blood pressures were within the normal range for participants’
ages. Over the study period, for male participants, there were minimal changes in
weight, body mass index, systolic blood pressure and blood glucose levels as
indicated by the negligible effect size ranging from 0.04 to 0.12. Among female
participants, there were changes in weight and body mass index, with small to
moderate effect size across the group. In addition, there were no differences
between those workers who predominantly worked in an office (mainly
administrative staff) and those who worked in the field (truck drivers, drillers and
maintenance personnel). Shift timing did not appear to influence any measured
parameters. Figure 4-3 presents the trend in changes in body mass index of the
study population at baseline, the midpoint of the study and at the end of the study,
while table 4-6 presents the changes in the anthropometric measures over the
study period.

106
Figure 4-3: Change in BMI Category (%) from baseline to midpoint (6-month) and
final (12-month) (n = 83, P = 0.113 (Chi squared analysis for BMI category))
16.819.3 19.3
42.2
37.3 38.641
43.4 42.1
0
5
10
15
20
25
30
35
40
45
50
Baseline Midpoint Final
Perc
enta
ge
Normal Overweight Obese

107
Table 4-6: Changes in anthropometric measures from baseline at 6-month and 12-month follow-up
Baseline Midpoint (6-month follow-up)
Final (12-month follow-up)
Mean (SD) Mean (SD) Mean (SD) F (df) P-valueb Effect size (Cohen’s d)
Weight (kg) Males (n = 65) Females (n = 18)
95.9 (15.5) 79.2 (17.2)
95.8 (15.2) 79.2 (17.5)
96.5 (15.5)a
80.3 (17.8)
3.578 (2, 63) 4.519 (2, 16)
0.034 0.028
0.10 0.36
BMI (kg/m2) Males (n = 65) Females (n = 18)
29.6 (4.3) 28.5 (5.6)
29.6 (4.3) 28.5 (5.8)
29.8 (4.4)a
28.8 (5.8)
3.485 (2, 63) 4.774 (2, 16)
0.037 0.024
0.10 0.37
Systolic blood pressure (mmHg) Males (n = 65) Females (n = 18)
130 (12) 127 (21)
130 (10) 123 (16)
133 (11)a
123 (18)
3.944 (2, 63) 1.217 (2, 16)
0.024 0.322
0.11 0.13
Diastolic blood pressure (mmHg) Males (n = 65) Females (n = 18)
81 (8) 81 (14)
82 (7) 80 (11)
82 (7) 80 (11)
1.388 (2, 63) 0.226 (2, 16)
0.257 0.800
0.04 0.03
Blood glucose (mmol/L) Males (n = 65) Females (n = 18)
6.7 (1.5) 5.5 (1.1)
6.6 (1.6) 5.9 (0.7)
7.3 (2.0)a
5.7 (1.1)
1.110 (2, 63) 0.883 (2, 16)
0.021 0.433
0.12 0.10
a Significantly different from midpoint (6-month follow-up) after adjusting for age and socioeconomic status, b ANOVA

108
4.4.2 Diet and nutrition measures
At baseline, the reported average daily serves of fruits were the same in males
(n=109) as in females (n=32) (Mean – 1.5 serves/day for both, SD – 1.3 and 1.0
respectively) while the reported average daily serve of vegetables was higher in
females (1.9 serves/day, SD – 1.3) than in males (1.6 serves/day, SD – 1.0).
Over the study period, there was a trend towards a reported increase in
consumption of fruits and vegetables serves, though this was not statistically
significant (Table 4-7).
Table 4-7: Changes in self-reported fruits and vegetables over the study period
using data from the short FFQ
Baseline Final (12-month follow-up)
Mean (SD) Mean (SD) P-valueb
Fruits (serves / day)
Males (n = 20) Females (n = 10)
1.8 (2.0) 1.5 (1.0)
2.0 (1.5) 1.2 (0.5)
0.428 0.306
Vegetables (serves / day)
Males (n = 20) Females (n = 10)
1.4 (0.9) 1.6 (1.4)
1.9 (1.2) 2.3 (1.4)
0.065 0.054
a based on a 5-day week, b Paired t-test
Table 4-8 presents the baseline intake of macronutrients and micronutrients among
male and female participants. Of the 141 participants in the baseline assessment,
69 completed the 3-day food diary, of which 43 were usable. Among male
participants, carbohydrates contributed 40% of total energy intake, fats contributed
30% of total energy intake, proteins contributed 20% of total energy intake and
alcohol contributed 10% of total energy intake. Among female participants,

109
carbohydrates contributed 43% of total energy intake, fats contributed 32% of total
energy intake, proteins contributed 21% of total energy intake and alcohol
contributed 4% of total energy intake.
Table 4-8: Mean daily macronutrient and micronutrient intake (95% CI) at baseline
using data from the 3-day FR
Male (n = 30) Female (n = 13)
Macronutrients
Energy (KJ) 9915 (8753, 11078) 7235 (5836, 8634)
Carbohydrate (g) 255 (219, 290) 195 (144, 247)
Total Fat (g) 84 (71, 97) 65 (50, 79)
Saturated fat (g) 35 (29, 41) 28 (22, 35)
MUFA (g) 32 (27, 37) 23 (17, 28)
PUFA (g) 11 (9, 13) 9 (6, 12)
LC n-3 PUFA (g) 0.43 (0.26, 0.60) 0.17 (0.08, 0.26)
Protein (g) 126 (112, 140) 90 (74, 106)
Sugars (g) 120 (91, 149) 104 (70, 138)
Fibre (g) 27 (23, 31) 21 (17, 25)
Alcohol (g) 14.0 (5.0, 23.0) 2.0 (-0.1, 3.9)
Micronutrients
Sodium (mg) 2863 (2447, 3278) 2359 (1940, 2779)
Potassium (mg) 3857 (3376, 4339) 3004 (2499, 3509)
Calcium (mg) 872 (746, 997) 827 (676, 978)
Iron (mg) 15 (13, 18) 14 (10, 18)
Zinc (mg) 19 (15, 22) 12 (9, 14)
Folate (DFE) (µg) 502 (380, 623) 453 (310, 596)
Niacin (mg) 68 (61, 76) 48 (38, 58)
Thiamin (mg) 3.0 (2.0, 4.1) 1.7 (1.1, 2.2)

110
Figures 4-4 to 4-9 present comparisons of baseline and final average daily serves of
core foods between the Australian National Health Survey (ABS 2016), and the
Australian Dietary Guidelines/Australian Guide to Healthy Eating (NHMRC 2013a
and 2013b). Recommended guidelines were set for persons by averaging male and
female recommendations.
There was a statistically significant difference in the average per consumer daily
serves of vegetables at baseline and at the end of the study when compared with
the National average (P=0.004 and P=0.005 respectively).
Figure 4-4: Comparison of average daily serves of Vegetable with Australian
National Health Survey and Australian Dietary Guidelines/Australian Guide to
Healthy Eating
4.6*4.9*
3.0
0
1
2
3
4
5
6
Baseline Final National
No.
of s
erve
s
* Statistically significant at P<0.01
ADG/AGHE Recommended

111
Average daily serves of fruits were calculated with and without fruit juice
contributions. With fruit juice contributing to the average daily serve of fruit, there
was a statistically significant increase of 0.8 serves from the baseline (P=0.0249).
Figure 4-5: Comparison of average daily serves of Fruit with Australian National
Health Survey and Australian Dietary Guidelines/Australian Guide to Healthy Eating
1.01.1
1.6
1.9*
1.5 1.5
0.0
1.0
2.0
WITHOUT FRUIT JUICE WITH FRUIT JUICE
No.
of s
erve
s
* Statistically significant at P<0.05
Baseline Final National ADG/AGHE Recommended

112
Average daily serves of breads and cereals increased by 0.5 serves from baseline,
though this was not statistically significant (P=0.471).
Figure 4-6: Comparison of average daily serves of Breads and Cereals with
Australian National Health Survey and Australian Dietary Guidelines/Australian
Guide to Healthy Eating
4.3
4.84.5
0
1
2
3
4
5
6
Baseline Final National
No.
of s
erve
s
ADG/AGHE Recommended

113
Average daily serves of meat and alternatives increase by 0.4 serves from baseline
though this was not statistically significant (P=0.570).
Figure 4-7: Comparison of average daily serves of Meat and alternatives with
Australian National Health Survey and Australian Dietary Guidelines/Australian
Guide to Healthy Eating
3.1
3.5
1.9
0
1
2
3
4
Baseline Final National
No.
of s
erve
s
ADG/AGHE Recommended

114
Average daily serves of milk and dairy products decreased by 0.1 serves from
baseline (P=0.868).
Figure 4-8: Comparison of average daily serves of Milk and dairy products with
Australian National Health Survey and Australian Dietary Guidelines/Australian
Guide to Healthy Eating
1.61.5 1.4
0
1
2
3
Baseline Final National
No.
of s
erve
s
ADG/AGHE Recommended

115
There was a decrease in the average daily consumption of discretionary foods of
355 grams from the baseline, though this was not statistically significant (P=0.0838).
There was also a non-significant decrease in the average daily serves of
discretionary foods (P=0.133).
Figure 4-9: (A) Comparison of average daily consumption of Discretionary foods in
grams with Australian National Health Survey. (B) Comparison of average daily
serves of Discretionary foods with the Australian Dietary Guidelines/Australian
Guide to Healthy Eating
1,107
752703
0
200
400
600
800
1000
1200
Baseline Final National
Wei
ght i
n g
A
7.7
6.2
0
1
2
3
4
5
6
7
8
9
Baseline Final
No.
of s
erve
s
ADG/AGHE Recommended
B

116
Table 4-9 presents the mean intake of core food groups, beverages and
discretionary foods per consumer. While there were increases in consumption of
core foods, only the increase in fruit consumption was statistically significant
(P=0.00839 with fruit juice and P=0.0359 without fruit juice).
Table 4-9: Mean intake of food groups (grams, 95% CI) per consumer per day using
data from the 3-day FR
Baseline Final Gram
difference
P-valueb
Core food groups
Vegetables 345 (264, 425) 369 (277, 461) 24 0.679
Fruit
- With fruit juice
- No fruit juice
144 (108, 180)
129 (93, 164)
275 (187, 363)
230 (141, 319)
131
101
0.00839*
0.0359**
Breads and
cereals 194 (156, 232) 238 (169, 306) 44 0.252
Meats,
alternatives 216 (172, 260) 245 (165, 325) 29 0.516
Milk, dairy
product 272 (216, 327) 284 (206, 362) 12 0.791
Beverages
Water 1086 (688, 1483) 1266 (865, 1667) 180 0.508
Non-alcoholica 859 (654, 1065) 595 (370, 820) -264 0.0772
Alcoholic 695 (262, 1129) 595 (234, 956) -100 0.697
TOTAL 2062 (1600, 2524) 1951 (1607, 2296) -111 0.693
Discretionary
foods 1107 (818, 1395) 752 (452, 1052) -355 0.0838
a includes Tea/Coffee, Cordial, sports/energy drinks, and fruit juice, b Student t-Test
* Statistically significant at P<0.01 ** Statistically significant at P<0.05

117
4.4.3 Physical activity measures
At baseline, the reported average daily physical activity levels were comparable
between males (n=109) and females (n=32) (Mean – 324 and 321 MET minutes/day
respectively, SD – 354 and 395 respectively). Over the study period, the reported
overall daily mean physical activity levels and physical activity levels across the
domains of leisure time and household physical activities did not change
significantly in males and females (Table 4-10). The average number of hours spent
in sedentary behaviour during workdays was 11 hours while the average number of
hours spent in sedentary behaviour during days off was 5 hours.
Table 4-10: Changes in self-reported physical activity over the study period
Baseline Final (1yr follow-up)
Mean (SD) Mean (SD) P-valuec
OVERALL PHYSICAL ACTIVITY Physical activity (MET mins/week)a
Males (n = 20) Females (n = 10)
2737 (3217) 2123 (1155)
2571 (2270) 2315 (2359)
0.751 0.738
PHYSICAL ACTIVITY DOMAINS Leisure time (mins/week)a
Males (n = 20) Females (n = 10)
1524 (2144) 1637 (1115)
1555 (1420) 1249 (1108)
0.920 0.293
Household (mins/week)a,b Males (n = 20) Females (n = 10)
1472 (1891) 975 (1184)
1388 (1510) 1253 (2274)
0.809 0.591
OTHER PHYSICAL ACTIVITY Sedentary activity (mins/week)a
Males (n = 20) Females (n = 10)
1883 (1080) 2233 (795)
1893 (1087) 1889 (887)
0.889 0.426
a Based on a 5-day week, b Includes household chores, c Student t-Test

118
Table 4-11A and 4-11B presents the results of the pedometer challenge as a
physical activity intervention component. Participants in the C crew had the highest
average step count and were the only crew to exceed the 7,500 step a day thus
being classified as leading physically active lifestyles.
Table 4-11A: Pedometer challenge results: categorised by ranking and average daily step count
Rank Crew Average daily step count (Standard deviation)
1st C crew (n = 10) 10,250 (± 660)
2nd A crew (n = 6) 7,728 (± 836)
3rd Office workers (n = 43) 7,529 (± 4173)
4th D crew (n = 14) 7,515 (± 3490)
5th B crew (n = 8) 4,813 (± 746)
Table 4-12B: Pedometer challenge results, categorised by sedentary, low and physically active lifestyle (based on SDSLI, Tudor-Locke et al 2013)
<5,000 steps/day (Sedentary lifestyle)
5,000 – 7499 steps/day (Low active lifestyle)
>7,500 steps per day (Physically active lifestyle)
Field workers (n = 38)
Office workers (n = 43)
18.4% (n = 7)
9.3 % (n = 4)
31.6% (n = 12)
48.8 % (n = 21)
50.0% (n = 19)
41.9 % (n = 18)
Field workers by crew
C crew (n = 10) - - 100.0 % (n = 10)
D crew (n = 14) 14.3 % (n = 2) 28.6 % (n = 4) 57.1 % (n = 8)
A crew (n = 6) - 83.3 % (n = 5) 16.7 % (n = 1)
B crew (n = 8) 66.7 % (n = 5) 33.3 % (n = 3) -

119
4.4.4 Health promoting environmental measures
With regard to the workplace, Table 4-12 presents the different environmental
characteristics across the entire worksite compiled from the Checklist of Health
Promotion Environments at Worksites (CHEW) across the study period. Within the
physical environment domain, there were 16 bulletin boards, 1 electronic bulletin
board, 3 water stations, 3 changing rooms and 8 toilets at the start of the study
across the worksite. By the end of the study, the number of water stations
increased to 10 across the worksite. All other physical environment domain
components such as showers, elevators and bicycle racks were neither present nor
introduced into the worksite. Within the nutrition environment domain, there were
six vending machines located at the worksite. Four of these were cold beverage
vending machines which offered a variety of soft drinks and no water, while two
were snack vending machines which offered a variety of sweet and savoury snacks.
In addition to the vending machines, there were three refrigerators across the site
that offered full fat milk. At the start of the study, there were no observed posters
or signs of any kind about healthy food. By the end of the study, there were 38
observed posters or signs about healthy food including encouraging more fruit and
vegetables consumption, encouraging dietary fat reduction, notices about dietary
information of vending machine contents and notices about the relationship
between diet and chronic diseases such as diabetes and heart disease. Within the
physical activity domain, there were one fitness centre, four stairways and two

120
posters about onsite physical activities at the start of the study. By the end of the
study, there were 18 different posters and signs about physical activity including fun
runs, community sporting events, gym membership subscriptions and increasing
daily step count, among others. Within the alcohol environment domain, there
were no posters or signs about responsible drinking. This increased to six by the end
of the study and included information about standard drinks, recommended
standard drinks per day and the association of alcohol with chronic diseases, among
others.

121
Table 4-13: Statistics on the observed environment characteristics of the worksite at
the start of the study (Baseline) and at the end of the study (Final) based on the
CHEW tool
Characteristic Count (n)
Baseline Final
Physical environment
Bulletin boards 16 16
eBulletin boards 1 1
Water stations 3 10
Number of changing rooms 3 3
Number of toilets 8 8
Nutrition environment
Snack vending machines 6 6
Beverage vending machines 4 4
Posters/signs about healthy food 0 38
Microwave 2 2
Oven/toaster 2 2
Fridge 6 6
Physical activity environment
Fitness centre 1 1
Stairways 4 4
Posters/signs about physical activity 2 18
Smoking
Posters/signs about smoking restrictions 7 14
Posters/signs about smoking cessation 2 14
Number of designated smoking areas 1 1
Alcohol
Posters/signs about responsible drinking 0 6
Posters/signs about alcohol restrictions 1 1

122
Table 4-13 presents the different beverages and snacks offered in the vending
machines and in refrigerators at the site. At the start of the study, the vending
machines contained predominantly less healthy items, with chips and extruded
snacks occupying the majority of the slots (44 slots overall) followed by chocolates
(37 slots overall) and confectionary (24 slots overall). There were no other healthier
items in the vending machines other than low fat chips (24 slots overall). At the end
of the study, the number of healthier items in the vending machines increased to
include more options and occupy more slots (24 additional slots per vending
machine). With regard to the beverage vending machines, no changes were made
for two reasons: firstly, the beverage vending machines were not owned by the
mine site as they were owned and operated by a charitable organisation; secondly
the vending machines could not accommodate water bottles, only canned
beverages. With regard to refrigerated beverages, only full cream milk was available
at the start of the study. By the end of the study, both reduced fat milk (95% fat
free) and skim milk (99% fat free) were available as healthy alternatives to the full
cream milk.

123
Table 4-14: Food and drink items in each of the six vending machines and
refrigerators at the start (baseline) and end (final) of the study
VENDING MACHINE SNACKS Baseline slots (n) Final slots (n)
Less healthy items
Chips/extruded snacks (>600 KJ/serve) 44 24
Chocolates 37 26
Confectionery 24 20
Healthier items
Chips/extruded snacks (<600 KJ/serve) 24 36
Popcorn (<600 KJ/serve) 0 4
Confectionery (sugar free) 0 4
Muesli bars (<600 KJ/serve) 0 4
VENDING MACHINE BEVERAGES
Less healthy items
Sugary soft drinks 24 24
Healthier items
Diet soft drinks 16 16
REFRIGERATED BEVERAGES Baseline number
of packets per
refrigerator (n)
Final number of
packets per
refrigerator (n)
Less healthy items
Full cream milk (1 Litre) 24 24
Healthier items
Lite (95% fat free) milk (1 Litre) 0 12
Skim (99% fat free) milk (1 Litre) 0 12

124
4.4.5 Other measures
The Get Healthy NSW program referral was utilised by 4% of the overweight and
obese workforce (n=5). Using the Australian Type 2 diabetes risk assessment tool
(Department of Health 2013), 27.6% (n = 39) of participants were at low risk of
developing type 2 diabetes, 48.3% (n = 68) of participants were at an intermediate
risk and 24.1% (n = 34) were at high risk of developing type 2 diabetes. Blood
pressure and blood glucose measurements carried out on the participants showed
that 8% (n = 12) of participants had previously undiagnosed hypertension and 4% (n
= 6) had previously undiagnosed diabetes. In all these cases participants were
advised to seek further input from their General Practitioner. Of note is the
enthusiasm with which these undiagnosed hypertension and diabetic participants
engaged in the healthy lifestyle program with the aim to improve their overall
health. Fifteen of these 18 participants were lost to follow up due to downsizing of
the workforce hence no meaningful comparisons of the effect of the intervention
program on them could be made.
4.5 Discussion
The results indicate that the majority of the workers at the mine site were either
overweight or obese at the start of the study. Among study completers (n=83),
83.2% of participants were either overweight or obese (42.2% overweight and 41%
obese) at baseline. After one year of the workplace health promotion program,
80.7% of participants were either overweight or obese (38.6% overweight and
42.1% obese). The BMI of participants showed a 2.5% increase in the normal BMI

125
category as participants in the lower threshold of overweight shifted down from
overweight to normal BMI. There was a 1.1% increase in the number of obese
participants as participants in the higher threshold of overweight shifted up from
the overweight to the obese category. These shifts resulted in a 2.5% decrease in
the overall combined overweight and obesity rates. Access to workers’ pre-
employment and medical records were not made available to establish a weight
gain pattern since commencement of work at the mine site. However, anecdotal
evidence from 21% of the workers participating in the study (n=30) indicated that
on average, workers tended to gain 5kg of weight each year for the first three years
after starting work at the mine site. Subsequent self-reported weight gain for each
additional year after the first three years was estimated at 500g-1kg per year on
average. The results also indicated that while there was no significant weight loss
over the study period among the participants, the workplace health promotion
intervention was feasible and successful in at least maintaining the weight of the
workers over the one year study period, the first time this had reportedly happened
since the participants had commenced work at the mine site. Longer-term
workplace health promotion programs of one year and above have demonstrated
similar findings, in which successful maintenance of weight has been achieved
(Dekkers et al. 2011, Goetzel et al. 2009, Goetzel et al. 2010, Kwak et al. 2010,
Lemon et al. 2010 and Linde et al. 2012). However, none of these workplaces was as
rigid as the one in this study, in which work tasks were highly prescribed and there
was little time and opportunity for other activities. Hence, being able to maintain
participants’ weight was a significant achievement of the program, given the

126
limitations of what was possible at the mine site (Appendix 4). A possible reason for
the small reduction in overweight and obesity prevalence over the one year
intervention period was the poor morale and stress of the workers in the face of
significant downsizing of the workforce at the mine site. Another reason may be
that obesity is complex and there are multiple related behaviours and determinants
that mean that it is difficult to address this issue; as well as the long latency that can
be expected between implementation of the intervention program and the
behaviour change likely to be required to impact upon the weight status of the
workers in this study as one year was not a long time to change BMI categories.
Further research is required in a stable workforce in the mining industry to verify if
the changes in overweight and obesity proportions could be higher than those
found in this study as this would remove the confounding variables of significant
participant attrition, poor morale and stress. In addition, those workers who were
identified as having previously undiagnosed hypertension and diabetes participated
more in adopting the healthy lifestyle. Such health reasons can be powerful
motivators for workers to adopt healthy lifestyle and intervention programs at
worksites and thus be incorporated into future research.
Increased consumption of core foods and decreased consumption of unhealthy
foods was noted among study completers who had useable food diaries for analysis.
There was a significant increase in fruit consumption by 0.8 serves (P<0.05) with the
study participants approaching the Australian Dietary Guidelines and Australian
Guide to Healthy Eating of two serves of fruit per day at the end of the study. An

127
increase in vegetable consumption by 0.3 serves was also seen, though it must be
noted that the recorded serves of vegetables were significantly higher than the
national average consumption (P<0.05) suggesting over-reporting of consumption
of vegetables. Overall, the consumption of fruit and vegetables increased by 1.1
serves per day. This is higher than the findings of Beresford et al. (2001) and
Robroek et al. (2012) who reported increases of 0.5 serves and 1.0 serves
respectively. A study by Sorensen et al. (1999) reported a higher combined increase
of 2.8 serves per day of fruit and vegetables over an 18-month study period, which
was much higher than this study. This magnitude of increase could possibly be
explained by the addition of a family-based intervention component of their health
promotion program, which was lacking in this study.
Over-reporting of meat and alternatives and discretionary foods were also likely as
the reported intake was higher than the National average intake. However, it is
possible that the intake of discretionary foods may reflect the actual intakes of the
participants, as anecdotal evidence (n=30) suggested that buying fast foods was a
common practice in this cohort of workers on their way home after a shift because
it was quick and convenient. This explains the high contribution of discretionary
foods to total energy intake in this cohort of workers when compared with the
national average. Average daily consumption of bread and cereals, and milk and
dairy products were comparable to the national average and did not change
significantly at the end of the study.

128
Interventions targeting physical activity were very limited in this study and were
restricted to providing education on physical activity and its importance as well as
its relation to chronic diseases and a pedometer challenge. The education messages
were kept short and instructional in nature as research has shown this to be the
recommended approach to physical education messages (Heath et al. 2012). Work
during the 8-hr and 12-hr shifts followed a rigid prescribed set of duties that had to
be completed at every shift leaving no extra time to engage in any physical activity
onsite. In addition, the transit time to and from the mine site, which could be as
much as 4-hrs a day, added to the time unavailable for engaging in physical activity.
Anecdotal evidence from workers indicated that during days off work, time was
spent relaxing and engaging in minimal “extra” physical activity than those due to
routine household duties. Most participants were able to achieve the
recommended physical activity guidelines of 150 to 300 minutes per week of
moderate intensity physical activity at follow up (which translated to 750–1000 Met
minutes/week) or 75 to 150 minutes of vigorous physical activity (which translated
to 562.5–1125 Met minutes/week) (Department of Health 2014). But this result
must be interpreted with caution as the small number of participants who provided
complete physical activity data resulted in significantly reduced power (5.6%) of the
physical activity component of the intervention. In addition, the data were based on
self-reported physical activity, which were likely to be overestimated, a
phenomenon common in self-reported physical activity questionnaires (Brown et al.
2004, Sebastião et al. 2012, Dyrstad et al. 2014). Other possible reasons for the
likely overestimation may be due to:

129
• Social inclusion response bias (Aadahl and Jorgensen 2003) by which the
participants may feel a need to demonstrate some form of physical activity
so as not to be seen as being different from their peers and mates.
• The fact that the work rosters allowed for days off that would end up
spreading over two weeks. There was therefore a likely chance that workers
may have reported more than a week’s physical activity on the
questionnaire.
Leisure time physical activity and physical activity associated with household
activities remained the same over the study period. This may be due to the small
sample size analysed for the physical activity domains but it may also be due to the
lack of time to participate in these activities outside of work as workers on a 12-hr
shift could spend up to 16 hours away from their home leaving 8 hours to eat, sleep
and get ready for the next day. Heath et al. (2012) have shown that workplace
physical activity interventions without a pedometer component has a small effect
size (0.21) as compared to one where a pedometer is used in addition to
information and education.
Some extent of physical activity intervention, apart from education, was achieved
through the pedometer challenge. While this challenge was useful in engaging some
participants, not all were able to take part in the challenge as the pedometers could
not be worn due to performance of duties that were critical to running the mine
site. The pedometer challenge was chosen as it has the highest effect size (0.68) for
engaging participants in physical activity (Heath et al. 2012). It is also one of the

130
physical activity interventions that can effectively utilise workplace social support
systems such as similar working crews to facilitate engagement in physical activity
(Health et al. 2012). The success of such a social support mechanism was clearly
demonstrated among Crew C who seemed to have had a supporting influence on
each other as all of them exceeded the step-count cut-off. On the other hand, the
pedometer challenge used in this study had limited use during days at work due to
the restricted area where participants could walk. It was mostly beneficial during
days off work when participants were able to increase step counts by engaging in
sport and other physical activities. The majority of participants in the pedometer
challenge (n = 37) were able to attain greater than 7,500 steps per day categorising
them as leading physically active lifestyles with 33 participants leading a low active
lifestyle and 11 participants leading sedentary lifestyles. There is thus possibility for
improvement especially among the low active lifestyle participants. This has the
added health benefit of improved glucose tolerance and better weight management
with possible weight loss over an extended period of time (Swartz et al. 2003,
Musto et al. 2010). There was no significant change in the two domains of physical
activity measured namely leisure time and household physical activities over the
study period and no change in sedentary behaviour among male workers during
workdays, as no meaningful active workplace physical activity intervention was
feasible. However, it is important to note the reduced sedentary activity among
female workers even though this was not statistically significant. This could be due
to an increase in household tasks among women even though his too was not

131
statistically significant but may indicate a trend towards this behaviour. This trend
needs further exploration in a larger cohort of participants.
The findings of this study are similar to McEachen et al. (2011) and Robroek et al.
(2012) who both reported no changes in physical activity following a longer term
(>1-yr) intervention program. Shorter-term intervention programs, on the other
hand, have demonstrated significantly increased step count (Puig-Ribera et al.
2008), but whether this translates to long-term sustainable changes in physical
activity is not clear. Workplace physical activity programs that incorporate the use
of pedometers have had mixed outcomes, with some studies showing
demonstrated increases in physical activity (De Cocker et al. 2009, Hess et al. 2011),
and other studies showing that the increase in physical activity is short-lived and
not sustainable (Behrens et al. 2007, Speck et al. 2009). The variation in outcome
from a workplace physical activity program that uses pedometers is further
supported by a meta-analytic review of workplace physical activity interventions
that used a pedometer, which summarised that workplace pedometer interventions
have very low demonstrable effect on increasing physical activity at the workplace
(Freak-Poli et al. 2013). Given that the mine site is a restricted workplace with little
environmental access to fully engage in brisk walking and other forms of physical
activity, it is understandable why the pedometer challenge in this study was most
useful during days off work. Of important note is the prolonged sedentary activity
among this cohort of workers which can predispose to the development of chronic
health diseases such as diabetes and heart disease with a resulting increase in

132
mortality. Ekelund et al (2016) report that at least 60-70 minutes of moderate
intensity physical activity per day is required to counteract the increased risk of
mortality from prolonged sitting times. Engaging in this level of moderate intensity
physical activity requires time which these workers clearly do not have given they
work 12 hour shifts. It is clear that more research in the domains of physical
education and pedometer use with higher participant numbers in a similar cohort of
workers is required to demonstrate the effectiveness of a physical activity
intervention component of a workplace health promotion program.
An audit of the work environment at baseline showed that the mine site was not a
health promoting environment, as there were no posters or information about
healthy diet, only two posters about physical activity, only three water stations to
cater for the entire staff, no healthier alternatives within vending machines and
only full cream milk provided in refrigerators across the site. By the end of the
intervention, the work environment audit was repeated and showed a worksite that
promoted health and wellbeing by displaying a number of posters on healthy food,
chronic diseases and the interplay between diet, physical activity and chronic
diseases, and the introduction of healthier options in the refrigerators and vending
machines. A review of the vending machines onsite led to introduction of healthier
options and a 5-star healthy rating labelling system, both of which have been shown
to increase healthy food choices (French et al. 2010, Lemon and Pratt 2010,
Sutherland et al. 2010). While usage and consumption statistics of the vending
machines were not available to monitor the effect of the vending machine

133
intervention, anecdotal evidence from visual inspection of the vending machines by
the work, health and safety team indicated that consumption of healthy options did
increase during the study period. The vending machines that dispensed beverages
could not be modified to include water bottles as these were run by external charity
organisations. Instead, additional water bubblers were installed in close proximity
to every vending machine that dispensed beverages. This contributed to an
improvement in hydration status, as discussed in chapter five.
It is important to note that 12 participants (8%, 1 female, 11 males) in the study had
high systolic and diastolic blood pressures at three separate instances, making them
a previously undiagnosed hypertensive. This is in keeping with the Australian
national statistics in which hypertension is the most commonly diagnosed and
managed chronic disease condition, accounting for 8% of all general practitioner
visits (AIHW 2014). Nonetheless, it is an important finding in the context of the
mine site as a workplace setting, given that two of the most common causes of
mortality in Australia are coronary heart disease and cerebrovascular accidents,
both of which are precipitated by hypertension (AIHW 2014). Thus any heart attack
or stroke while working heavy equipment may prove disastrous at the mine site. Six
participants (4%, 2 females, 4 males) were previously undiagnosed diabetics. This is
again not uncommon in the Australian population, in which for every four adults
diagnosed with diabetes, there is one adult that remains undiagnosed (AIHW 2014).
While being an undiagnosed diabetic does not have any immediate life-threatening
outcome, it does increase the risk of developing coronary heart disease. In addition,

134
undiagnosed diabetes can be a burden of disease for the employer, due to
increased frequency of sickness absence from work (Dray-Spira et al. 2013).
4.6 Limitations
The major limitation in this part of the study was the large participant attrition
towards the end of the study. This was due mainly to loss of a significant number of
the workforce due to a restructuring of the mining company in the face of a sharp
decline in the global commodities prices. As a result, a large number of participants
was lost, with the secondary effect of poor morale across the entire worksite. This
poor morale also contributed to the lack of enthusiasm in the intervention program
towards the end of the study. This was reflected in the small number of study
completers in the final data collection phase at the end of the study period and the
poor quality of the 3-day food records, resulting in exclusion of a large number of
food records due to implausible data and non-completion of physical activity
questionnaire, resulting in reduced power of the physical activity analysis. As a
result, analysis of key associations between the intervention components and
outcome measures were limited with low power and not statistically significant,
even though a trend towards improvement may have been present.
Another limitation identified was the restricted access to the vending machines’
contents, as these were managed by an external organisation that donated the
proceeds of the vending machine to charity. Hence, removal of unhealthy products
was not allowed, however an understanding was reached, by which addition of
healthier snack options was allowed along with unhealthy products. Tracking this

135
proved to be difficult as data on purchases were restricted and not provided. Hence
visual and verbal accounts of usage were the only options available to assess this
part of the intervention.
A limitation with regards to the physical activity component of the intervention was
the focus on getting physically active while omitting the importance of education to
reduce sedentary behaviour. However while it is anticipated that an improvement
in physical activity will counter the effects of sedentary behaviour, the topic of
sedentary behaviour would have added more value to this part of the intervention
program. The onsite gym facility was also restricted and used only to train
emergency rescue personnel. Furthermore, management did not allow workers
additional break time to engage in some form of onsite physical activity. Hence
encouraging and facilitating physical activity onsite was not an intervention
component that was viable at any time. As a result, the pedometer challenge was
the only physical activity intervention component that was possible onsite and was
thus encouraged. The small number of participants who provided complete physical
activity data resulted in a reduced power (5.6%) of the physical activity component
of the intervention. Hence results of physical activity changes must be interpreted
with caution and more data on the different domains of physical activity with more
participants in the mining industry is required to fully ascertain the effect of a
physical activity intervention among workers in this workplace.
Alternating shift work among the workers by which some workers would have
worked on a day shift during the baseline data collection phase and a night shift

136
during the final data collection phase, may have affected their ability to adequately
quantify and record food and fluid intakes. Thus participants may have had only a
limited time to consume food and drinks and may have postponed recording their
intakes till a later time. This potentially introduces recall bias.
4.7 Conclusion
The workplace health promotion intervention program was demonstrated to be
feasible at this mine site and successful in at least maintaining the weight of the
workers over the one-year study period. Based on participants’ body mass index,
there was a 2.5% decrease in the rates of overweight and obesity over the one-year
study period, mostly due to threshold shifts from participants who were borderline
overweight and obese. Consumption of fruit increased significantly, approaching
recommendations in the Australian Guide to Healthy Eating and the Australian
Dietary Guidelines. Key learning from this study was that simple education
messages and environmental changes are too weak an intervention by themselves
to make significant changes in behaviour. Management support is crucial to any
workplace health promotion intervention and supplementation by a workplace
policy may strengthen the interventions to make significant long-term sustainable
changes in behaviour. Examples of management support in this workplace could
include opening up access to the workplace gym as well as providing time for
workers to utilise the gym. Management could also institute a free annual medical
check for workers and their families. This has the added advantage of engaging the
workers’ families, a powerful motivator in itself. In addition to the annual free

137
medical check, periodic quarterly visits by health professionals to engage workers in
discussing various aspects of their health could reinforce the sustainability of the
intervention program. An incentives program for workers who are able to
participate in the healthy lifestyle program and achieve their stated target weight
loss goals could also be considered by management. A definitive way for
management to demonstrate its commitment to improving the health of its
workforce is by implementing proactive workplace policies around food choices on
site (e.g. including a policy about catering at meetings), physical activity (e.g. a
policy on stand-sit workstations, walking meetings etc.), hydration and water
consumption (e.g. a policy on hydration management plan), and general health and
wellbeing. It is hoped that the learning from this part of the study could be used to
further refine and improve the health promotion intervention program so as to
actually achieve weight reduction in individual participants.

138
4.8 References
Aadahl, M. and Jorgensen, T. (2003). "Validation of a new self-report instrument for
measuring physical activity." Med Sci Sports Exerc 35(7): 1196-1202.
ABS (2016). “Australian Health Survey: Consumption of food groups from the
Australian Dietary Guidelines, 2011-2012 – Australia”, accessed 04/07/2016,
http://www.abs.gov.au/ausstats/subscriber.nsf/log?openagent&43640do002_2011
2012.xls&4364.0.55.012&Data%20Cubes&CF342CAB7A4D7B36CA257FAF001A3A11
&0&2011-12&11.05.2016&Latest
ABS (2013). “Australian Health Survey: Users' Guide”, accessed 12/01/2013,
http://www.abs.gov.au/ausstats/[email protected]/Lookup/EEA2876E067905E2CA257ACC0
011BAF1?opendocument
Ainsworth, B. E., Haskell, W. L., Whitt, M. C., Irwin, M. L., Swartz, A. M., Strath, S. J.,
O'Brien, W. L., Bassett, D. R., Jr., Schmitz, K. H., Emplaincourt, P. O., Jacobs, D. R., Jr.
and Leon, A. S. (2000). "Compendium of physical activities: an update of activity
codes and MET intensities." Med Sci Sports Exerc 32(9 Suppl): S498-504.
Baicker, K., Cutler, D. and Song, Z. (2010). "Workplace wellness programs can
generate savings." Health Aff (Millwood) 29(2): 304-311.
Behrens, T. K., Domina, L. and Fletcher, G. M. (2007). "Evaluation of an employer
sponsored pedometer-based physical activity program." Perceptual and Motor Skills
105(3): 968-976.

139
Beresford, S. A. A., Thompson, B., Feng, Z., Christianson, A., McLerran, D. and
Patrick, D. L. (2001). "Seattle 5 a Day Worksite Program to Increase Fruit and
Vegetable Consumption." Preventive Medicine 32(3): 230-238.
Brown, W., Bauman, A., Chey, T., Trost, S. and Mummery, K. (2004). "Comparison of
surveys used to measure physical activity." Aust N Z J Public Health 28(2): 128-134.
Caspersen, C.J., Powell, K.E. and Christenson, G.M. (1985). “Physical activity,
exercise, and physical fitness: definitions and distinctions for health-related
research.” Public health reports 100(2): 126-131.
CDC. (2013). "Physical activity." Retrieved 31st August, 2015, from
http://www.cdc.gov/workplacehealthpromotion/implementation/topics/physical-
activity.html.
Choi, B., Schnall, P. L., Yang, H., Dobson, M., Landsbergis, P., Israel, L., Karasek, R.
and Baker, D. (2010). "Sedentary work, low physical job demand, and obesity in US
workers." Am J Ind Med 53(11): 1088-1101.
De Cocker, K. A., De Bourdeaudhuij, I. M. and Cardon, G. M. (2009). "The effect of a
multi-strategy workplace physical activity intervention promoting pedometer use
and step count increase." Health Education Research.
Dekkers, J. C., van Wier, M. F., Ariens, G. A., Hendriksen, I. J., Pronk, N. P., Smid, T.
and van Mechelen, W. (2011). "Comparative effectiveness of lifestyle interventions
on cardiovascular risk factors among a Dutch overweight working population: a
randomized controlled trial." BMC Public Health 11(1): 49.

140
Department of Health (2014). “Australia's Physical Activity and Sedentary Behaviour
Guidelines”, accessed 10/05/2016,
http://www.health.gov.au/internet/main/publishing.nsf/content/health-pubhlth-
strateg-phys-act-guidelines
Department of Health (2013), “The Australian Type 2 Diabetes Risk Assessment
Tool”, accessed 15/01/2013,
http://www.health.gov.au/internet/main/publishing.nsf/Content/chronic-diab-
prev-aus/$File/austool5.pdf
Devine, C.M., Connors, M.M., Sobal, J. and Bisogni, C.A. (2003), “Sandwiching it in:
spillover of work onto food choices and family roles in low- and moderate-income
urban households” Social Science & Medicine 56(3): 617-630.
Dray-Spira, R., Herquelot, E., Bonenfant, S., Guéguen, A. and Melchior, M. (2013).
"Impact of diabetes mellitus onset on sickness absence from work – a 15-year
follow-up of the GAZEL Occupational Cohort Study." Diabetic Medicine 30(5): 549-
556.
Dyrstad, S. M., Hansen, B. H., Holme, I. M. and Anderssen, S. A. (2014). "Comparison
of self-reported versus accelerometer-measured physical activity." Med Sci Sports
Exerc 46(1): 99-106.
Ekelund, U., Steene-Johannessen, J., Brown, W.J., Fagerland, M.W., Owen, N.,
Powell, K.E., Bauman, A., Lee, I.M., Series, L.P.A. and Lancet Sedentary Behaviour
Working Group (2016). “Does physical activity attenuate, or even eliminate, the

141
detrimental association of sitting time with mortality? A harmonised meta-analysis
of data from more than 1 million men and women.” The Lancet, 388(10051): 1302-
1310.
Escoto, K. H. and French, S. A. (2012). "Unhealthy and healthy weight control
behaviours among bus operators." Occup Med (Lond) 62(2): 138-140.
Escoto, K. H., Laska, M. N., Larson, N., Neumark-Sztainer, D. and Hannan, P. J.
(2012). "Work hours and perceived time barriers to healthful eating among young
adults." Am J Health Behav 36(6): 786-796.
Freak-Poli, R. L., Cumpston, M., Peeters, A. and Clemes, S. A. (2013). "Workplace
pedometer interventions for increasing physical activity." Cochrane Database Syst
Rev 4: CD009209.
French, S. A., Hannan, P. J., Harnack, L. J., Mitchell, N. R., Toomey, T. L. and Gerlach,
A. (2010). "Pricing and availability intervention in vending machines at four bus
garages." J Occup Environ Med 52 Suppl 1: S29-33.
French, S.A., Harnack, L.J., Toomey, T.L. and Hanna, P.J. (2007). “Association
between body weight, physical activity and food choices among metropolitan
transit workers.” International Journal of Behavioural Nutrition and Physical Activity
4(1): 1.
Goetzel, R. Z., Baker, K. M., Short, M. E., Pei, X., Ozminkowski, R. J., Wang, S. and
Bowen, J. D. (2009). "First-year results of an obesity prevention program at The Dow
Chemical Company." Journal of occupational and environmental

142
medicine/American College of Occupational and Environmental Medicine 51(2):
125.
Goetzel, R. Z., Roemer, E. C., Pei, X., Short, M. E., Tabrizi, M. J., Wilson, M. G., DeJoy,
D. M., Craun, B. A., Tully, K. J. and White, J. M. (2010). "Second-year results of an
obesity prevention program at the Dow Chemical Company." Journal of
occupational and environmental medicine/American College of Occupational and
Environmental Medicine 52(3): 291.
HAPIA (2010). Best-Practice Guidelines Workplace Health in Australia, Health and
Productivity Institute of Australia, accessed 04/05/2015,
http://www.workplacehealth.org.au/_literature_51087/HAPIA_Best_Practice_Guid
elines
Heath, G.W., Parra, D.C., Sarmiento, O.L., Andersen, L.B., Owen, N., Goenka, S.,
Montes, F., Brownson, R.C. and Lancet Physical Activity Series Working Group
(2012). “Evidence-based intervention in physical activity: lessons from around the
world.” The lancet, 380(9838): 272-281.
Henke, R. M., Goetzel, R. Z., McHugh, J. and Isaac, F. (2011). "Recent experience in
health promotion at Johnson & Johnson: lower health spending, strong return on
investment." Health Aff (Millwood) 30(3): 490-499.
Hess, I., Borg, J. and Rissel, C. (2011). "Workplace nutrition and physical activity
promotion at Liverpool Hospital." Health Promotion Journal of Australia 22(1): 44-
50.

143
Joyce, S. J., Tomlin, S. M., Somerford, P. J. and Weeramanthri, T. S. (2013). "Health
behaviours and outcomes associated with fly-in fly-out and shift workers in Western
Australia." Internal Medicine Journal 43(4): 440-444.
Kelly, B., Flood, V. M., Bicego, C. and Yeatman, H. (2012). "Derailing healthy choices:
an audit of vending machines at train stations in NSW." Health Promot J Austr 23(1):
73-75.
Knox, E. C., Musson, H. and Adams, E. J. (2015). "Knowledge of physical activity
recommendations in adults employed in England: associations with individual and
workplace-related predictors." Int J Behav Nutr Phys Act 12: 69.
Kwak, L., Kremers, S., Candel, M., Visscher, T., Brug, J. and van Baak, M. A. (2010).
"Changes in skinfold thickness and waist circumference after 12 and 24 months
resulting from the NHF-NRG In Balance-project." Int J Behav Nutr Phys Act 7(1): 26.
Lawrence, S., Boyle, M., Craypo, L. and Samuels, S. (2009). "The food and beverage
vending environment in health care facilities participating in the healthy eating,
active communities program." Pediatrics 123 Suppl 5: S287-292.
Le-Masurier, G.C., Sidman, C.L. and Corbin, C.B., (2003). “Accumulating 10,000
steps: does this meet current physical activity guidelines?” Research quarterly for
exercise and sport, 74(4): 389-394.
Lemon, S. C., Zapka, J., Li, W., Estabrook, B., Rosal, M., Magner, R., Andersen, V.,
Borg, A. and Hale, J. (2010). "Step ahead a worksite obesity prevention trial among
hospital employees." Am J Prev Med 38(1): 27-38.

144
Lemon, S. C. and Pratt, C. A. (2010). "Worksite environmental interventions for
obesity control: an overview." J Occup Environ Med 52 Suppl 1: S1-3.
Linde, J. A., Nygaard, K. E., MacLehose, R. F., Mitchell, N. R., Harnack, L. J., Cousins,
J. M., Graham, D. J. and Jeffery, R. W. (2012). "HealthWorks: results of a multi-
component group-randomized worksite environmental intervention trial for weight
gain prevention." Int J Behav Nutr Phys Act 9: 14.
Malik, S. H., Blake, H. and Suggs, L. S. (2014). "A systematic review of workplace
health promotion interventions for increasing physical activity." Br J Health Psychol
19(1): 149-180.
McEachan, R. R., Lawton, R. J., Jackson, C., Conner, M. and Lunt, J. (2008).
"Evidence, theory and context: using intervention mapping to develop a worksite
physical activity intervention." BMC Public Health 8: 326.
Medibank (2005). The Health of Australia's Workforce, Medibank Private, accessed
15/01/2014,
https://www.medibank.com.au/Client/Documents/Pdfs/The_health_of_Australia's_
workforce.pdf
Musto, A., Jacobs, K., Nash, M., DelRossi, G. and Perry, A. (2010). “The effects of an
incremental approach to 10,000 steps/day on metabolic syndrome components in
sedentary overweight women.” J Phys Act Health 7(6): 737-45.
NHMRC (2015). Nutrient Reference Values for Australia and New Zealand, accessed
14/01/2015, https://www.nrv.gov.au/nutrients

145
NHMRC (2013a). “Australian Dietary Guidelines”, accessed 20/08/2015,
https://www.nhmrc.gov.au/_files_nhmrc/publications/attachments/n55_australian
_dietary_guidelines_130530.pdf
NHMRC (2013b). “Australian Guide to Healthy Eating”, accessed 20/08/2015,
https://www.eatforhealth.gov.au/sites/default/files/files/public_consultation/n55d
_draft_dietary_guidelines_agthe_111212.pdf
NHMRC (2009). Australian Guidelines to reduce health risk from drinking alcohol,
accessed 15/01/2015,
https://www.nhmrc.gov.au/_files_nhmrc/publications/attachments/ds10-
alcohol.pdf
National.Preventative.Health.Taskforce (2008). Australia – The Healthiest Country
by 2020, National Preventative Health Taskforce, accessed 20/05/2014,
http://www.health.gov.au/internet/preventativehealth/publishing.nsf/content/a06
c2fcf439ecda1ca2574dd0081e40c/$file/discussion-28oct.pdf
Oldenburg, B., Sallis, J. F., Harris, D. and Owen, N. (2002). "Checklist of Health
Promotion Environments at Worksites (CHEW): development and measurement
characteristics." Am J Health Promot 16(5): 288-299.
Owen, N., Leslie, E., Salmon, J. and Fotheringham, M.J. (2000). “Environmental
determinants of physical activity and sedentary behavior.” Exercise and sport
sciences reviews 28(4): 153-158.

146
Polkinghorne, B. G., Gopaldasani, V., Furber, S., Davies, B. and Flood, V. M. (2013).
"Hydration status of underground miners in a temperate Australian region." BMC
Public Health 13: 426.
Previdelli, A. N., Lipi, M., Castro, M. A. and Marchioni, D. M. (2010). "Dietary quality
and associated factors among factory workers in the metropolitan region of Sao
Paulo, Brazil." J Am Diet Assoc 110(5): 786-790.
Puig-Ribera, A., McKenna, J., Gilson, N. and Brown, W. J. (2008). "Change in work
day step counts, wellbeing and job performance in Catalan university employees: a
randomised controlled trial." Promotion & education 15(4): 11-16.
Reed, J. L., Prince, S. A., Cole, C. A., Fodor, J. G., Hiremath, S., Mullen, K. A., Tulloch,
H. E., Wright, E. and Reid, R. D. (2014). "Workplace physical activity interventions
and moderate-to-vigorous intensity physical activity levels among working-age
women: a systematic review protocol." Syst Rev 3: 147.
Robroek, S. J., Polinder, S., Bredt, F. J. and Burdorf, A. (2012). "Cost-effectiveness of
a long-term Internet-delivered worksite health promotion programme on physical
activity and nutrition: a cluster randomized controlled trial." Health Educ Res 27(3):
399-410.
Sabinsky, M. S., Toft, U., Raben, A. and Holm, L. (2007). "Overweight men's
motivations and perceived barriers towards weight loss." Eur J Clin Nutr 61(4): 526-
531.

147
Samitz, G., Egger, M. and Zwahlen, M. (2011). “Domains of physical activity and all-
cause mortality: systematic review and dose–response meta-analysis of cohort
studies.” International journal of epidemiology 40(5): 1382-1400.
Sebastião, E., Gobbi, S., Chodzko-Zajko, W., Schwingel, A., Papini, C. B., Nakamura,
P. M., Netto, A. V. and Kokubun, E. (2012). "The International Physical Activity
Questionnaire-long form overestimates self-reported physical activity of Brazilian
adults." Public Health 126(11): 967-975.
Sorensen, G., Stoddard, A., Peterson, K., Cohen, N., Hunt, M. K., Stein, E., Palombo,
R. and Lederman, R. (1999). "Increasing fruit and vegetable consumption through
worksites and families in the treatwell 5-a-day study." American Journal of Public
Health 89(1): 54-60.
Speck, R. M., Hill, R. K., Pronk, N. P., Becker, M. P. and Schmitz, K. H. (2010).
"Assessment and outcomes of HealthPartners 10,000 Steps program in an academic
work site." Health Promot Pract 11(5): 741-750.
St.George A, L. R., King, L, Hector D, Portors C. (2013). Results of a survey on
workplace health promotion in businesses in Lithgow. . The University of Sydney,
Physical Activity Nutrition & Obesity Research Group (PANORG).
St.George, A., King, L., Newson, R., Wells, V. and Campbell, M. (2012).
"Implementing workplace health promotion initiatives: Who should we target?"
Health Promotion Journal of Australia 23(2): 134-140.

148
Steeves, J. A., Bassett, D. R., Jr., Thompson, D. L. and Fitzhugh, E. C. (2012).
"Relationships of occupational and non-occupational physical activity to abdominal
obesity." Int J Obes (Lond) 36(1): 100-106.
Stewart-Knox, B., M, E. D., Bunting, B., Parr, H., Vas de Almeida, M. D. and Gibney,
M. (2012). "Associations between obesity (BMI and waist circumference) and socio-
demographic factors, physical activity, dietary habits, life events, resilience, mood,
perceived stress and hopelessness in healthy older Europeans." BMC Public Health
12: 424.
Sutherland, L. A., Kaley, L. A. and Fischer, L. (2010). "Guiding stars: the effect of a
nutrition navigation program on consumer purchases at the supermarket." Am J
Clin Nutr 91(4): 1090S-1094S.
Swartz, A.M., Strath, S.J., Bassett, D.R., Moore, J.B., Redwine, B.A., Groër, M. and
Thompson, D.L. (2003). “Increasing daily walking improves glucose tolerance in
overweight women.” Preventive medicine 37(4): 356-362.
Tudor-Locke, C., Craig, C.L., Thyfault, J.P. and Spence, J.C. (2012). “A step-defined
sedentary lifestyle index:< 5000 steps/day.” Applied physiology, nutrition, and
metabolism 38(2): 100-114.
WHO (2013). Chronic diseases and health promotion - STEPS Manual, World Health
Organisation, accessed 10/01/2013,
http://www.who.int/chp/steps/Section%204%20Step%202%20Physical%20Measur
ements.pdf

149
WHO (2007). Workers' health: global plan of action, World Health Organisation,
accessed 10/01/2013,
http://www.who.int/occupational_health/who_workers_health_web.pdf

150
CHAPTER 5 – FEASIBILITY AND EFFECTIVENESS OF THE
INTERVENTION ON HYDRATION STATUS AMONG
SURFACE MINE WORKERS
5.1 Introduction
Miners working in both temperate and tropical regions of Australia present to work
dehydrated (Miller and Bates 2010, Biggs et al. 2011, Polkinghorne et al. 2013).
During a work shift, it has been reported that only 50-60% of the fluid lost in sweat
was able to be replaced, further increasing the risk of dehydration among miners
who present to work hydrated (Sawka et al. 2001, Kalkowsky and Kampmann 2006).
Dehydration has been associated with various health effects on the central nervous
system and the musculoskeletal system, which may impair the worker’s ability to
perform optimally and increase the risk of accidents or injuries at the workplace.
Dehydration is thus a valid concern to workers and their employers in the mining
industry. This chapter looks at the prevailing hydration status of surface mine
workers and explores the effect of the intervention program on hydration status.
5.2 Literature review
Hydration is the body’s ability to manage total body water at different levels, that is,
at the cellular level, tissue level, organ level and system level. Normal body water
content status is termed ‘euhydration’ while a deficit in body water content status
is termed ‘hypohydration’ or ‘dehydration’ (Parsons 2014). When the body is well
hydrated, the body water content is distributed to all the cells. However, when the

151
body is dehydrated, the cells lose water, thus resulting in a water deficit within the
cells. Rehydrating with drinking water will eventually correct the cellular fluid deficit
but this process is slow.
5.2.1 Body composition of water
The human body is composed primarily of water with 60% of the body weight in
adult males and 50-55% of the body weight in adult females being water. This is the
total body water (TBW). The TBW is divided between two compartments, the
intracellular compartment, which makes up two-thirds of the TBW and extracellular
compartment, which makes up the remaining one-third of the TBW. The
extracellular compartment is further subdivided into the intravascular compartment
(8% of extracellular compartment) and the interstitial compartment (25% of
extracellular compartment) (Parsons 2014). The TBW is never static and is in a state
of flux, always being balanced by the needs of the different tissues.
Different tissues and organs in the body have different water content. Apart from
blood, muscle contains the greatest amount of water by volume of tissue. This is
important as continued muscle contraction uses up water and glucose to produce
the energy for contraction, thus predisposing to dehydration. Bone and fatty tissue
contain the least amount of water by volume of tissue. Other tissues and their
associated water content are presented in table 5-1.

152
Table 5-1: Water content of body tissues/organs for the average 75kg man
(Adapted from Parsons (Parsons 2014))
Tissue/organ % of water by volume of tissue
% of Total Body Water
% of body weight
Muscle 76 55 43
Skin 72 22 18
Bone 22 5 15
Fatty tissue 10 2 12
5.2.2 Physiological regulation of body water
The body’s ability to regulate TBW is dependent on the hypothalamus, the posterior
pituitary gland, the heart and the kidneys (Hall and Guyton 2011). There are two
primary stimuli that activate a cascade of physiological processes to maintain TBW
balance. These are blood/plasma volume and plasma solute concentration. When
the plasma volume is high, the plasma solute concentration is low due to a dilution
effect and vice versa. Either or both of these stimuli are sufficient to initiate the
cascade mechanism.
When the plasma volume is low, the baroreceptors located in the arterial walls
detect the drop in blood pressure as a result of the low plasma volume. These
baroreceptors then send signals to the hypothalamus to stimulate the posterior
pituitary gland to release a hormone called antidiuretic hormone (ADH). This
hormone acts on the distal tubules and collecting ducts of the kidneys making them
more permeable to water thus increasing the amount of water that is reabsorbed

153
by the kidney decreasing urine output. The reabsorption of water corrects the low
plasma volume with a resultant normalisation of blood pressure (Hall and Guyton
2011, Parsons 2014).
When the plasma volume is high, the baroreceptors in the heart detect the increase
in blood pressure as a result of the high plasma volume. This stimulates the heart
muscle to produce atrial natriuretic polypeptide (ANP). This hormone is a powerful
vasodilator that has end organ affects primarily on the kidneys. It increases the
blood flow to the kidneys thereby increasing the amount of plasma being filtered by
the kidney. This in turn results in large amounts of water and sodium being excreted
in urine. This excretion of excess water corrects the high plasma volume with a
resultant normalisation of blood pressure (Hall and Guyton 2011).
When plasma solute concentration is low, as can occur if too much water is
consumed, the osmoreceptors in the brain detect this and signals the hypothalamus
to slow or stop ADH release from the posterior pituitary gland. This restricts the
permeability of the tubules in the kidneys and allows excessive water to be excreted
by the kidneys while conserving sodium, resulting in normalisation of the plasma
solute concentration (Hall and Guyton 2011, Parsons 2014).
When plasma solute concentration is high, the osmoreceptors in the brain detect
this and initiate the thirst mechanism. At the same time, ADH is released from the
posterior pituitary. The combined effect is an increase in body water through
consumption and retention by the kidneys. This increases the plasma volume and
dilutes the solutes, thus normalising solute concentration (Hall and Guyton 2011,

154
Parsons 2014). The entire physiological cascade mechanisms are summarised in
figure 5-1.
The total body water has an important influence in thermoregulation and
performance of the body in hot environments. The total body water normally
remains relatively constant as a result of the various buffering mechanisms within
the body as illustrated above, however physical exertion and exposure to heat
affects this water balance as the body water starts to flux in order to support
thermoregulation (Sawka and Coyle 1999). Effective thermoregulation thus relies on
total body water, especially on plasma to transfer heat from the core to the skin for
heat dissipation. In addition, body water is also used in sweating, which cools the
skin by convective and evaporative heat loss resulting in a return of cooled blood
back to the core, thus lowering the core temperature.

155
Figure 5-1: Schematic representation of the physiological mechanisms involved in
regulation of water balance in the body. Red arrows – inhibitory pathways, Green
arrows – excitatory pathway (adapted from (Parsons 2014)).
5.2.3 Health effects of dehydration
Early effects of dehydration include light-headedness, dizziness, tiredness,
irritability and headaches, all of which are a function of decreased blood flow and
decreased oxygenation of the brain (Hall and Guyton 2011). The adverse health
effects of dehydration include central nervous system dysfunction, such as
depressed cognitive function, which may further predispose workers to lapses in
concentration and judgement resulting in potentially disastrous events (Suhr et al.
2004, Austin et al. 2008, Suhr et al. 2010, Ganio et al. 2011). Studies have shown
Arterial
baroreceptor Osmoreceptor
Hypothalamus
Posterior
ADH
Kidneys
Heart
baroreceptor
ANP
↑ Plasma
solute
↓ Plasma volume
Sodium
reabsorptio
Thirst Water
reabsorption
↑ Plasma volume
↓ Plasma
solute
Water

156
that dehydration at 2% of body weight resulted in impairment of visual motor
tracking, short-term memory, attention deficits and decreased arithmetic
competence (Gopinathan et al. 1988, Cian et al. 2001). Dehydration can affect
physical performance through a number of mechanisms, including central nervous
system depression, fatigue and cardiovascular strain (Murray 2007).
The effects of chronic dehydration on the kidneys has been demonstrated in several
studies and summarised to conclude that development of kidney stones has been
consistently associated with chronic dehydration (Armstrong 2012). The effects of
dehydration on chronic diseases such as overweight, obesity, type 2 diabetes and
certain cancers have been debated (Stookey et al. 1997, Jiang et al. 2008,
Armstrong et al. 2012, Bai et al. 2014, Borys et al. 2014). There is insufficient
evidence to conclusively associate hydration with prevention of chronic diseases
especially overweight, obesity, bladder and colon cancers, yet some studies have
indicated the potential benefit of staying hydrated with regard to weight
management possibly due to feelings of fullness associated with drinking water
(Stookey and Ge 1998, Dennis et al. 2008, Phelan et al. 2008, Stookey et al. 2008,
Muckelbauer et al. 2013). Furthermore, there is evidence that dehydration
predisposes workers to fatigue, heat stress and heat related illnesses which can be
potentially fatal, especially when exposed to high environmental temperatures
(Kenefick and Sawka 2007, Armstrong et al. 2010, Bates et al. 2010). This is further
discussed in chapter six of this thesis.

157
Workers with pre-existing medical conditions and undiagnosed medical conditions,
such as diabetes and heart disease, are at an even greater risk of adverse health
effect from working in hot environments due to impaired thermoregulation
(Rutkove et al. 2009, Sokolnicki et al. 2009, Gryglewska et al. 2010, Biggs et al. 2011,
Armstrong et al. 2012, Jehn et al. 2014). It is therefore important to identify those
workers with pre-existing diabetes or heart disease, and monitor them closely.
Studies have shown that more than half of workers in the mining industry
presenting to work are dehydrated at the start of their shift (Brake and Bates 2003,
Bates and Schneider 2008, Polkinghorne et al. 2013). This is a cause for concern,
especially for those workers in the mining industry who work in hot environments
as they are at an increased risk of adverse health effects. This further reinforces the
importance of hydration of workers prior to commencing work in hot environments.
5.2.4 Assessing hydration status
A 3% body weight loss in water is the cut-off criteria for defining significant
dehydration, as at this level of dehydration the body induces physiological changes
such as increased heart rate and decreased sweating sensitivity, thus further
reducing the body’s ability to cope with heat stress (Casa et al. 2000). The 3% body
weight loss in water is now often used as the maximum dehydration limit in most
industries that expose workers to hot environments (Hanson 2000, ISO7933 2004).
Ways of assessing hydration status include simple methods such as urine specific
gravity and colorimetric tests to more complex methods such as dilution technique,

158
blood sample analysis for plasma osmolality and plasma volume and urine
osmolality (Armstrong 2005).
5.2.4.1 Plasma osmolality
Plasma osmolality has been used for assessing total body water, however this
method does not accurately represent total body water gain or loss during exposure
to hot environments (Armstrong et al. 1998, Armstrong 2007). This is because the
body’s buffer mechanisms help to maintain the plasma volume by shifting water out
of cells and into the plasma. Moreover, this method of assessing hydration status is
invasive and impractical for use as an everyday test among workers.
5.2.4.2 Urine osmolality
Urine osmolality has been suggested as a possible gold standard for hydration
assessment and monitoring (Shirreffs 2003). Urine osmolality is more sensitive at
detecting changes in hydration status faster than plasma osmolality and is therefore
a more sensitive indicator. However, it is still impractical and expensive for use in
everyday testing among workers.
5.2.4.3 Direct urine specific gravity (USG) instrumentation
The urine specific gravity is less sensitive than the plasma or urine osmolality in
representing total body water and hydration status, but it has been shown to be a
reliable and important indicator of the body’s absolute hydration status (Brake and
Bates 2003, Popkin et al. 2010, Montazer et al. 2013). The USG is non-invasive and
quick and cheap to conduct, making it practical for use as an everyday testing
method to assess and monitor hydration status of workers. Anecdotal evidence

159
suggests that some workplaces have introduced USG testing as a standard protocol
for hydration assessment and monitoring. A limiting value of the USG is used as an
indicator of hydration status. This is outlined in table 5-2.
A number of direct reading instruments have been developed for testing urine
specific gravity. The instruments could either be dipped in a sample of urine and the
USG read directly or a few drops of urine is placed on the reading chamber and the
USG then read off the instrument. The underlying principle behind urine specific
gravity measurement is that the instrument actually measures the refractive index
or ratio of the velocity of light in air to the velocity of light in the urine sample and is
dependent upon the number and weight of the dissolved particles (Armstrong et al.
1994, Casa et al. 2000).
Table 5-2: Index of hydration status (adapted from (Armstrong et al. 1994, Casa et
al. 2000, Oppliger et al. 2005, Armstrong et al. 2010)).
Hydration level Hydration status
category
Body weight loss (%)
Urine Specific Gravity
Good Hydrated
< 1 - 2 1.001 - 1.015
Fair 2 - 3 1.016 - 1.020
Poor
Dehydrated 3 - 5
1.021 - 1.025
Very poor 1.026 - 1.030
Clinical dehydration >5 > 1.031

160
5.2.4.4 Colorimetric tests
Colorimetric tests for hydration status are based on reaction of urinary metabolites
with reagents triggering a colour change. The change in colour is then read off a
colour chart to indicate the hydration level or the USG. Many are in the form of
urinary dipsticks. The USG tested this way correlates with urine osmolality
(Simerville et al. 2005). There are however certain confounding variables to the use
of the urine dipsticks that must be taken into account, these including vitamin
intakes, medications and even pre-existing medical conditions, such as diabetes or
renal failure. These variables tend to render the dipstick tests inaccurate due to the
increased urinary metabolites as well as changes to urine colour. Despite these
limitations, the dipstick test for hydration is simple to do, cheap and practical for
use in workplaces.
In summary, assessing and monitoring hydration status at workplaces is best
accomplished using either the direct reading of USG instruments, or the dipsticks, or
both, as these methods are non-invasive, simple, cheap and practical for everyday
use.
5.2.5 Promoting hydration at work
There are very limited studies that have exclusively focused on health promotion
interventions at worksites with water/fluid consumption as a key focus area.
Beverage consumption has been shown to be the predominant contributor to fluid
intake rather than water consumption alone (Mears and Shirreffs 2015). A number
of individual and environmental factors have been known to influence workers’

161
decisions about food and fluid consumption in the workplace. For example, the
presence of vending machines at worksites has been associated with an increased
consumption of sugar-sweetened beverages in favour of water consumption (Davy
et al. 2014). While other beverages and not only water, contribute water content to
the body, certain fluids when consumed in excess may have a diuretic effect.
Examples of such fluids include tea, coffee, soft drinks, energy drinks and alcohol
(Shirreffs and Maughan 1997, Armstrong 2002). However, with regard to coffee,
research has disputed its diuretic effects, especially as tolerance develops
(Armstrong et al. 2005, Armstrong et al. 2007), but this debate is far from over
(Zhang et al. 2014). Clearly more focused workplace interventions are required to
promote water consumption specifically at workplaces so as to ensure that workers
remain hydrated throughout their shift.
5.2.6 Summary
Maintaining optimal hydration status is important for workers in the mining
industry especially for overweight or obese workers who may be dehydrated and
working in hot humid environments. There is a real threat to this group’s health and
wellbeing since such workers are at an increased risk of developing heat related
illness, which may be potentially fatal. It was therefore a crucial part of this study to
assess hydration status of surface mine workers and to develop and test a simple
workplace intervention to promote water and other fluid consumption. A detailed
methodology of this process is outlined below in section 5.3.

162
5.3 Methodology
5.3.1 Design
Three formal monitoring periods were selected for this part of the study. The first
was a baseline monitoring conducted in January-February 2013, depicting the peak
summer period. The second was a mid-point monitoring conducted six months into
the study, depicting the winter period, and the third was a follow-up monitoring
conducted one year later in January-March 2014, again depicting the peak summer
period.
5.3.2 Participants
Of the 157 participants who enrolled in the study, 141 took part in hydration
measurements, and 83 took part at all three time points (baseline, midpoint and
final). All observations were conducted prior to shift commencement during the day
and night shifts.
5.3.3 Measures – instruments and procedures
5.3.3.1 Questionnaire
The same questionnaire that was previously described in chapter four was used to
collect information on hydration practices and fluid consumption (Appendix 5).
Specifically, sections three and seven of the questionnaire were for this part of the
study. Section three of the questionnaire collected information on hydration
practices and behaviours, while section seven collected information on fluids and
the frequency of different fluids consumed. This fluid frequency questionnaire was

163
based on a validated tool (Hedrick et al. 2010) and is further discussed in chapter
seven. The questionnaire was administered to all participants by the primary
researcher as previously outlined in chapter four.
5.3.3.2 Hydration status assessment
The hydration status was assessed by measuring the USG using an ATAGO digital
handheld “PEN” refractometer (PEN-URINE S.G.). The refractometer was calibrated
at the beginning of each day of testing by testing a sample of demineralised water
and zeroing the refractometer. Both pre- and post-shift USG were tested in all
participants. The pre-shift USG was measured prior to participants commencing
their shift. Post-shift urine specific gravity measurements were not considered
useful as a previous study by the researcher showed that pre-shift hydration status
largely determines the post-shift hydration status (Polkinghorne et al. 2013). USG
testing was done immediately in front of the participants and the samples
discarded. This assured the participants that only USG was being tested and also
provided immediate feedback to the participants of their hydration status. The USG
was converted to hydration status with reference to table 5-2 (Armstrong et al.
1994, Casa et al. 2000). The limiting values were adapted to simplify categorisation
of hydration level into two groups: hydrated and dehydrated. A feedback sheet
showing hydration status and matching USG was given to each participant
(Appendix 12).

164
5.3.4 Measures – intervention
As part of the study, the health promotion intervention program also focused on
drinking fluids and staying hydrated. Specific aspects of the intervention program
that focused on staying hydrated are discussed below in sections 5.3.4.1 to 5.3.4.5.
5.3.4.1 Immediate feedback and advice
Immediate feedback was provided to all participants during USG testing. Part of this
feedback included showing them a representative urine colour chart that also
indicated their hydration status. Feedback on improving hydration status was then
provided verbally to all participants. Information given included optimal amounts of
water to consume in a day (3-4 litres per day (Hall and Guyton 2011)) and prior to
starting their shift (at least one litre), tips on staying hydrated throughout their shift
(drinking at least one cup (250ml) of water every 15 minutes (Miller and Bates
2010)) and avoiding diuretic fluids, such as soft drinks and energy drinks.
5.3.4.2 Periodic voluntary hydration testing
To promote a greater awareness of hydration status, all participants were informed
that they could voluntarily undergo hydration testing at any time during their shift,
including when selected to undergo drug and alcohol testing.
5.3.4.3 Review of urine colour charts
All toilet facilities at the mine site had urine colour charts posted to guide workers
in knowing their hydration status through the colour of their urine. Initially these
standard charts were found to be poorly representative of hydration status and
were thus reviewed to provide a better representation of hydration status

165
(Appendix 13). The old urine colour charts were then replaced with the new charts
in all toilets. The new charts were also posted to general notice boards along with
information and education posters targeting hydration.
5.3.4.4 Information and education
A three-month information and education program centred on hydration was
implemented in two parts in the summer of 2013-2014. In November 2013, the first
information and education topic was “Hydration and its importance” (Appendix 14).
This topic focused on introducing the basics of hydration, including the amount of
water to consume during normal work and when working in hot environments,
recognising signs of dehydration and knowing what fluids can have a diuretic effect.
In addition, data was provided from the baseline hydration testing to reinforce the
importance of hydration. Finally, practical recommendations were provided for the
workers such as drinking a litre of water prior to starting the shift, refraining from
drinking soft drinks, energy drinks, alcohol or coffee for 12-24 hours before starting
the shift, among others.
The second information and education topic delivered in December 2013 was
“Hydration and heat stress” (Appendix 15). This topic focused on introducing heat
stress and linking hydration with heat stress. It also highlighted the importance of
recognising dehydration early and provided practical recommendations for drinking
water, reporting signs of dehydration and clothing and sunscreen use when working
in a hot environment.

166
The third information and education topic delivered in January 2014 was “Hydration
and fluid guidelines” (Appendix 16). This topic built on the previous two topics,
consolidating the information on hydration and the various fluids that are available
to hydrate. Specifically, this topic focused on the advantages and disadvantages of
the different fluids for hydration. In addition, the approximate composition of
commonly consumed beverages was provided to illustrate their energy content, the
sugar content (carbohydrate) and the caffeine content. This provided the workers
with an avenue to make an informed choice about beverage types consumed.
Furthermore, fluid consumption guidelines for work in hot environments were
specified and strategies to stay hydrated pre-shift, during the shift and post-shift,
were provided.
5.3.4.5 Provision of drink machines around the site
A number of water bubblers were installed around the site, especially in areas with
high worker traffic, such as the crib rooms and meeting rooms, where shift
handovers were conducted. Water bubblers and drink vending machines operated
side by side. However, the products in the vending machines were labelled to
inform the workers about healthier and less healthy choices. This aspect of the
intervention program has been discussed in chapter four.
5.3.5 Data processing and analysis
Only those participants who took part in hydration measurements at all three time
points of the study were included in data analyses. All data were entered into the
statistical software, IBM SPSS version 21. Mean and standard deviations are

167
provided as summary indices for all data. The cut-off point for USG was set at 1.020
in keeping with literature (Armstrong et al. 1994, Casa, Armstrong et al. 2000,
Oppliger et al. 2005, Armstrong et al. 2010). Statistical significance was set at a P-
value of < 0.05.
Repeated measures analysis of variance (ANOVA) and independent samples t-tests
were used to evaluate the differences between exposure groups (based on job
location and pre- and post-intervention) and at each time point. Paired samples t-
test was used to evaluate the differences in pre-shift USG between baseline and
midpoint, midpoint and final and baseline and final test points. Correlation analysis
was used to evaluate the relationship between risk factors such as age, body mass
index, duration of exposure, hydration behaviours and practices, and hydration
status.
5.4 Results
The general demographics of participants in the hydration measurements at the
three time points are presented in table 5-3. The average age of participants was 39
years, with a range of 20-60 years. Males constituted 78% of this population (n=65)
while females constituted 22% (n=18). The average body mass index was 29.4
kg/m2.

168
Table 5-3: Demography of participants in the hydration testing at all three test points (n = 83).
Mean (± SD) Range
Age (yrs) 39 (± 11) 20 - 60
Weight (kg)* 92.3 (±17.2) 58.6 - 134.8
Height (m) 1.77 (± 0.08) 1.51 - 1.96
BMI (kg/m2)* 29.4 (± 4.6) 21.1 - 42.1
*First test point (baseline) measures used
With regard to hydration status, table 5-4 presents the pre-shift USG and the
hydration status over the three time points of the study. There was a statistically
significant decrease in the USG as well as a statistically significant improvement in
hydration status (P < 0.001). This was reflected only among the male workers (P <
0.001) and not the female workers (P = 0.117). No statistically significant
relationship was found with regard to day or night shift (P = 0.098), although
workers presenting to the night shift were generally dehydrated compared to the
day shift. Figure 5-2 presents the trend of pre-shift USG over the entire study
period.

169
Table 5-4: Pre-shift Urine Specific Gravity (USG) and hydration status of all
participants at the three test points (n = 83).
1st test point
(baseline)
2nd test point
(midpoint)
3rd test point
(final) P - value
USG
Mean ± SD 1.020 (± 0.007) 1.017 (± 0.007) 1.015 (± 0.007) < 0.001*
Range 1.003 - 1.032 1.003 - 1.032 1.002 - 1.028
Hydration status n (%)
Hydrated 33 (47.5) 56 (67.3) 62 (75.3) <0.001†
Dehydrated 50 (52.5) 27 (32.7) 21 (24.7)
* Repeated measures ANOVA, †Chi-square statistic

170
Figure 5-2: Average pre-shift Urine Specific Gravity trend over the entire study
period (n = 83).
There was a statistically significant difference in the hydration status of field
(predominantly outdoor) and office (predominantly in an air conditioned office)
workers (P < 0.05). This is summarised in table 5-5. The proportion of workers who
started their shift dehydrated was 72.6% at the start of the study. This improved to
30.5% of workers starting their shift dehydrated at the end of the study, a 58%
improvement compared to the start of the study. Figure 5-3 (A and B) presents a
breakdown of the trend of hydration status of participants based on their job
location, that is, field, office or both, at the mine site across the three testing points.
1.020
1.017
1.015
1.012
1.013
1.014
1.015
1.016
1.017
1.018
1.019
1.020
1.021
Baseline Midpoint Final
Urin
e Sp
ecifi
c G
ravi
ty

171
Table 5-5: Hydration status of participants by job location over the three test points
(n = 83)
Job
location
Hydration
status
1st test
point
(baseline)
2nd test
point
(midpoint)
3rd test
point
(final)
P - value
Field*†
Hydrated 13 24 26
< 0.05
Dehydrated 29 18 16
Office*†
Hydrated 15 26 29
< 0.05
Dehydrated 16 5 2
Both
Hydrated 5 6 7
0.70
Dehydrated 5 4 3
* Statistically different from baseline to midpoint
† Statistically different from baseline to final

172
Figure 5-3: Hydration (A) and Dehydration (B) trends across categories of workers
(n=83).
18.1
31.334.9
15.7
28.9 31.3
6.0 7.2 8.4
39.8
67.574.7
0
10
20
30
40
50
60
70
80
Baseline Midpoint Final
Hydrated
Perc
ent o
f par
ticip
ants
(%)
A
Office Field Both ALL
23.2
7.32.9
42.1
26.1 23.2
7.3 5.8 4.4
72.6
39.2
30.5
0
10
20
30
40
50
60
70
80
Baseline Midpoint Final
Dehydrated
Perc
ent o
f par
ticip
ants
(%)
B
Office Field Both ALL

173
A significant 72% of workers predominantly consumed water at work, with other
beverages supplementing water consumption. The majority consumed between
500mL and 2000mL of water during a shift. A snapshot of the prevalent hydration
practices is presented in table 5-6.
Table 5-6: Prevalence of hydration practices and perceptions at work
Fluids predominantly consumed at work n (%)
Water 76 (72.4)
Tea/Coffee 19 (18.0)
Soft drink 9 (8.6)
Sports drink 1 (1.0)
Water consumed per shift (1 cup = 250mL) n (%)
< 2 cups 20 (20.8)
2 - 4 cups 32 (33.3)
5 - 8 cups 32 (33.3)
9 - 12 cups 10 (10.4)
> 12 cups 2 (2.2)
Perceived adequate water consumption at work n (%)
Strongly agree 3 (2.9)
Agree 42 (40.3)
Disagree 53 (51.0)
Strongly disagree 6 (5.8)

174
Workers perception of their drinking habits was the only significant factor that
correlated with hydration status. Table 5-7 summarises the correlation analysis of
hydration status with possible risk factors. Figure 5-4 presents the trend of self-
reported beverage consumption during the study period.
Table 5-7: Correlation of hydration status with potential risk factors
Risk factor Spearman’s correlation (rho)
P - value
Age 0.165 0.103
Gender 0.097 0.335
BMI -0.008 0.940
Education level 0.017 0.874
Smoking status 0.100 0.321
Physical activity -0.048 0.636
Perception of adequate water consumption -0.355 < 0.001
Work site (field, office, both) -0.146 0.148
Shift (day, night) -0.167 0.098

175
Figure 5-4: Average daily fluid consumption recorded using the Fluid Frequency
Questionnaire for Total fluids (A), Total water (B), Total non-alcoholic beverages (C)
and Total alcoholic beverages (D).
2,492 2,600 2,352
5001000150020002500300035004000
1st testpoint
(baseline)
2nd testpoint
(midpoint)
3rd testpoint(final)
Qua
ntity
(mL)
A
Total fluids + 2 SD - 2 SD
9981,167 1,113
200400600800
10001200140016001800
1st testpoint
(baseline)
2nd testpoint
(midpoint)
3rd testpoint(final)
Qua
ntity
(mL)
B
Total water + 2 SD - 2 SD
2,231 2,278 2,055
100015002000250030003500
1st testpoint
(baseline)
2nd testpoint
(midpoint)
3rd testpoint(final)
Qua
ntity
(mL)
C
Total non-alcoholic
+ 2 SD
- 2 SD
261 322 297
-2000
200400600800
1st testpoint
(baseline)
2nd testpoint
(midpoint)
3rd testpoint(final)
Qua
ntity
(mL)
D
Total alcoholic + 2 SD
- 2 SD

176
5.5 Discussion
The primary aim of this part of the study was to assess the hydration status of
workers in a surface mine in a temperate region of Australia. To the author’s
knowledge, no other study on dehydration has been conducted on workers in
surface mines in temperate climates of Australia. The secondary aim, if dehydration
was determined to be a problem, was to develop and implement a workplace
health promotion intervention to promote water and other fluid (milk and low
calorie drinks) consumption and decrease unhealthy fluid consumption (alcohol and
sugary drinks). The results indicate that the workers were dehydrated prior to
commencing their shift, which puts those working in the heat at an increased risk of
developing heat related illness. A simple workplace intervention program to
promote water and other fluid consumption was thus implemented.
This study showed that just over 70% of workers reported to work dehydrated. This
finding is higher than that found in a previous study on hydration status in
underground mines in a temperate region of Australia, where 58% of workers
started their shift dehydrated (Polkinghorne et al. 2013). Comparative studies done
in surface mines located in a tropical region of Australia showed that between 65%
and 90% of workers started their shift dehydrated (Carter and Muller 2007, Miller
and Bates 2007, Peiffer and Abbiss 2013, Hunt et al. 2014). Studies of hydration
status in underground mines located in tropical climates showed that up to 70%
were starting their shift dehydrated (Brake 2001, Brake and Bates 2003). It is

177
evident that the severity of dehydration is not restricted to surface mine workers in
tropical climates.
This study showed that only 500mL-2000mL of water was being consumed during a
shift. This is consistent with the findings of the study of hydration done with
underground workers in temperate Australia (Polkinghorne et al. 2013).
Consumption of 2000mL-4000mL is the daily water requirement of the body and
thus serves only as maintenance of hydration levels during a shift (Hall and Guyton
2011). Pre-shift hydration status has been indicated to be possibly the primary
determinant of post-shift hydration, and by proxy, the mid-shift hydration
(Gopaldasani et al. 2012, Polkinghorne et al. 2013). The reason for this is that an
average of 4000mL-5000mL of water, and possibly more, is required to rehydrate
from a dehydrated status, depending on the level of dehydration. It is therefore
important to focus on workers hydrating themselves sufficiently prior to
commencing their shift, as it becomes easier to maintain hydration during the shift
by consuming normal amounts of water during the shift. It is important to note that
additional amounts of water will still be required for those working in the heat, as
more water is lost during the process of sweating. Nonetheless such workers will be
better protected against heat related illnesses than if they were dehydrated.
Workers in this study showed good insight with regard to their perception of
drinking enough water at work. As many as 51% of workers stated that they did not
think they consumed enough water at work and this correlated very highly with
dehydration status (Table 5-6 and 5-7). This is an important finding in this study, as

178
a lack of perception or a misguided perception is more difficult to correct through
an intervention program. Several studies have highlighted the importance of
participants’ knowledge and perception as key factors in the uptake of health
intervention programs (Chinn et al. 2006, Ishii et al. 2009, Jacobs et al. 2010, Choe
et al. 2012, Blake et al. 2013, Harada et al. 2014).
Following the health intervention program that focused on improving pre-shift
hydration, significant improvements in pre-shift hydration status was noticed at the
6-month mark (2nd test point) and the 12-month mark (3rd test point). This was
evident across both field and office workers (Table 5-5 and Figure 5-3).
Several studies on health promotion at workplaces have shown that short-term
intervention programs, usually of six months or less, have greater success than long-
term intervention programs, that is, twelve months and above (Anderson et al.
2009, Milani and Lavie 2009, Olson et al. 2009, Groeneveld et al. 2011, Lassen et al.
2011, Strijk et al. 2012, Bevis et al. 2014). The reason for this is that long-term
health promotion programs target risk factors that are associated with chronic
diseases such as overweight and obesity, which take a longer time to show
demonstrable changes. Risk factors like overweight and obesity are usually
multifaceted and involve the interplay of genetics, food environment at home and
psychosocial aspects, thus making these risk factors difficult to control and maintain
over a long period of time. A simpler risk factor such as hydration status, which is
dependent on consumption of water supplemented by other beverages, shows
more promise for long-term success and sustainability. This is reflected in this study

179
as consumption of water increased over the study period (Figure 5-4). It is
important to note that the dip in consumption of total fluids towards the end of the
study may be explained by underreporting fluids consumed, given that there was an
improvement in hydration status at the end of the study. Another reason could be
the morale of the workforce at this pivotal time as the mine was going through a
period of structural change, including employee redundancies.
5.6 Limitations
The first limitation in this study is the use of the fluid frequency questionnaire to
collect information on water and beverage consumption. While a validation of this
questionnaire showed it to be a good marker for tracking fluid intake trends
progressively (chapter seven), overestimation of beverage intake is a possibility. The
second limitation was the number of dropouts due to the loss of a large number of
the workforce towards the end of the study. In addition, the morale of the rest of
the workers in the study was low, as many lost their colleagues and mates. This
would have limited the sustainability of the intervention program for the whole
study and this was reflected in the slight dip in total fluid and water consumption,
and a slight increase in total average alcohol consumption from the start of the
study.
5.7 Conclusion
A majority of surface mine workers in a temperate climate were dehydrated at the
commencement of their shift. Implementation of an intervention program that
included behavioural and environmental changes resulted in an improvement of the

180
hydration status over the duration of the study period. Water was the predominant
fluid of choice at the workplace. This was supplemented with tea, coffee, soft drinks
and energy drinks. Overall the consumption of water and other supplement
beverages increased over the study period sufficiently to improve the pre-shift
hydration status at the end of the study period. The success of this simple
intervention program can be sustained over a long term and can be applicable to
other surface mine sites.

181
5.8 References
Anderson, L. M., Quinn, T. A., Glanz, K., Ramirez, G., Kahwati, L. C., Johnson, D. B.,
Buchanan, L. R., Archer, W. R., Chattopadhyay, S., Kalra, G. P. and Katz, D. L. (2009).
"The Effectiveness of Worksite Nutrition and Physical Activity Interventions for
Controlling Employee Overweight and Obesity. A Systematic Review." American
Journal of Preventive Medicine 37(4): 340-357.
Armstrong, L. E. (2002). "Caffeine, body fluid-electrolyte balance, and exercise
performance." Int J Sport Nutr Exerc Metab 12(2): 189-206.
Armstrong, L. E. (2007). "Assessing hydration status: the elusive gold standard." J
Am Coll Nutr 26(5 Suppl): 575S-584S.
Armstrong, L. E. (2012). "Challenges of linking chronic dehydration and fluid
consumption to health outcomes." Nutrition Reviews 70: S121-S127.
Armstrong, L. E., Barquera, S., Duhamel, J. F., Hardinsyah, R., Haslam, D. and
Lafontan, M. (2012). "Recommendations for healthier hydration: addressing the
public health issues of obesity and type 2 diabetes." Clin Obes 2(5-6): 115-124.
Armstrong, L. E., Casa, D. J., Maresh, C. M. and Ganio, M. S. (2007). "Caffeine, fluid-
electrolyte balance, temperature regulation, and exercise-heat tolerance." Exerc
Sport Sci Rev 35(3): 135-140.
Armstrong, L. E., Ganio, M. S., Lee, E. C., McDermott, B. P., Klau, J. F., Yamamoto, L.
M., Marzano, S., Lopez, R., Beasley, K. N., Jimenez, L., Le Bellego, L., Chevillotte, E.,
Casa, D. J. and Lieberman, H. R. (2010). "Degraded Cognitive Performance,

182
Increased Fatigue in Men Following Mild Dehydration at 1.59% Body Mass Loss."
Medicine and Science in Sports and Exercise 42(5): 364-364.
Armstrong, L. E., Maresh, C. M., Castellani, J. W., Bergeron, M. F., Kenefick, R. W.,
LaGasse, K. E. and Riebe, D. (1994). "Urinary indices of hydration status." Int J Sport
Nutr 4(3): 265-279.
Armstrong, L. E., Pumerantz, A. C., Fiala, K. A., Roti, M. W., Kavouras, S. A., Casa, D.
J. and Maresh, C. M. (2010). "Human hydration indices: acute and longitudinal
reference values." Int J Sport Nutr Exerc Metab 20(2): 145-153.
Armstrong, L. E., Pumerantz, A. C., Roti, M. W., Judelson, D. A., Watson, G., Dias, J.
C., Sokmen, B., Casa, D. J., Maresh, C. M., Lieberman, H. and Kellogg, M. (2005).
"Fluid, electrolyte, and renal indices of hydration during 11 days of controlled
caffeine consumption." Int J Sport Nutr Exerc Metab 15(3): 252-265.
Armstrong, L. E., Soto, J. A., Hacker, F. T., Jr., Casa, D. J., Kavouras, S. A. and Maresh,
C. M. (1998). "Urinary indices during dehydration, exercise, and rehydration." Int J
Sport Nutr 8(4): 345-355.
Austin, A. W., Patterson, S., Heffner, K. and Suhr, J. (2008). "Relationship between
blood pressure, hydration and cognition in older adults." Annals of Behavioral
Medicine 35: S128-S128.
Bai, Y., Yuan, H., Li, J., Tang, Y., Pu, C. and Han, P. (2014). "Relationship between
bladder cancer and total fluid intake: a meta-analysis of epidemiological evidence."
World J Surg Oncol 12: 223.

183
Bates, G. P., Miller, V. S. and Joubert, D. M. (2010). "Hydration status of expatriate
manual workers during summer in the middle East." Ann Occup Hyg 54(2): 137-143.
Bates, G. P. and Schneider, J. (2008). "Hydration status and physiological workload
of UAE construction workers: A prospective longitudinal observational study." J
Occup Med Toxicol 3: 21.
Bevis, C. C., Nogle, J. M., Forges, B., Chen, P. C., Sievers, D., Lucas, K. R., Mahoney, J.
J. and Crawford, J. M. (2014). "Diabetes Wellness Care A Successful Employer-
Endorsed Program for Employees." Journal of Occupational and Environmental
Medicine 56(10): 1052-1061.
Biggs, C., Paterson, M. and Maunder, E. (2011). "Hydration status of South African
forestry workers harvesting trees in autumn and winter." Ann Occup Hyg 55(1): 6-
15.
Blake, H., Zhou, D. Y. and Batt, M. E. (2013). "Five-year workplace wellness
intervention in the NHS." Perspectives in Public Health 133(5): 262-271.
Borys, J. M., de Ruyter, J. C., Finch, H., Harper, P., Levy, E., Mayer, J., Richard, P.,
Ruault du Plessis, H., Seidell, J. C. and Vinck, J. (2014). "Hydration and obesity
prevention." Obes Facts 7 Suppl 2: 37-48.
Brake, D. J. and Bates, G. P. (2003). "Fluid losses and hydration status of industrial
workers under thermal stress working extended shifts." Occup Environ Med 60(2):
90-96.

184
Brake, R. (2001). Fluid consumption, sweat rates and hydration status of thermally
stressed underground miners and the implications for heat illness and shortened
shifts. Qld Mining Ind Occ Health and Safety Conference, Townsville, Qld Mining
Council.
Carter, A. and Muller, R. (2007). "Hydration knowledge, behaviours and status of
staff at the residential camp of a fly-in/fly-out minerals extraction and processing
operation in tropical North-Eastern Australia." Ind Health 45(4): 579-589.
Casa, D. J., Armstrong, L. E., Hillman, S. K., Montain, S. J., Reiff, R. V., Rich, B. S.,
Roberts, W. O. and Stone, J. A. (2000). "National athletic trainers' association
position statement: fluid replacement for athletes." J Athl Train 35(2): 212-224.
Chinn, D. J., White, M., Howel, D., Harland, J. O. E. and Drinkwater, C. K. (2006).
"Factors associated with non-participation in a physical activity promotion trial."
Public Health 120(4): 309-319.
Choe, M. A., Yi, M., Choi, J. A. and Shin, G. (2012). "Health Knowledge, Health
Promoting Behavior and Factors Influencing Health Promoting Behavior of North
Korean Defectors in South Korea." Journal of Korean Academy of Nursing 42(5):
622-631.
Cian, C., Barraud, P. A., Melin, B. and Raphel, C. (2001). "Effects of fluid ingestion on
cognitive function after heat stress or exercise-induced dehydration." Int J
Psychophysiol 42(3): 243-251.

185
Davy, B. M., You, W., Almeida, F., Wall, S., Harden, S., Comber, D. L. and Eatabrooks,
P. A. (2014). "Impact of Individual and Worksite Environmental Factors on Water
and Sugar-Sweetened Beverage Consumption Among Overweight Employees."
Preventing Chronic Disease 11.
Dennis, E., Dengo, A. L., Davy, K. P. and Davy, B. M. (2008). "Water consumption
reduces meal calorie intake in older overweight and obese adults." Annals of
Behavioral Medicine 35: S67-S67.
Ganio, M. S., Armstrong, L. E., Casa, D. J., McDermott, B. P., Lee, E. C., Yamamoto, L.
M., Marzano, S., Lopez, R. M., Jimenez, L., Le Bellego, L., Chevillotte, E. and
Lieberman, H. R. (2011). "Mild dehydration impairs cognitive performance and
mood of men." British Journal of Nutrition 106(10): 1535-1543.
Gopaldasani, V., Polkinghorne, B. G., Furber, S., Davies, B. and Flood, V. M. (2012).
Study of Hydration in Illawarra Miners, BHP Billiton Illawarra Coal.
Gopinathan, P. M., Pichan, G. and Sharma, V. M. (1988). "Role of dehydration in
heat stress-induced variations in mental performance." Arch Environ Health 43(1):
15-17.
Groeneveld, I. F., Proper, K. I., van der Beek, A. J., Hildebrandt, V. H. and van
Mechelen, W. (2011). "Short and long term effects of a lifestyle intervention for
construction workers at risk for cardiovascular disease: a randomized controlled
trial." Bmc Public Health 11.

186
Gryglewska, B., Necki, M., Cwynar, M., Baron, T. and Grodzicki, T. (2010). "Local
heat stress and skin blood flowmotion in subjects with familial predisposition or
newly diagnosed hypertension." Blood Press 19(6): 366-372.
Hall, J. E. and Guyton, A. C. (2011). Guyton and Hall textbook of medical physiology.
Hanson, M. A. (2000). Physiological Monitoring of Heat Stress in UK Coal Mines.
Harada, K., Shibata, A., Lee, E., Oka, K. and Nakamura, Y. (2014). "Associations
Between Perceived Health Benefits and Barriers to Strength Training, and Stages of
Change for Strength-Training Behavior Among Older Japanese Adults." Journal of
Physical Activity & Health 11(4): 801-809.
Hedrick, V. E., Comber, D. L., Estabrooks, P. A., Savla, J. and Davy, B. M. (2010). "The
beverage intake questionnaire: determining initial validity and reliability." J Am Diet
Assoc 110(8): 1227-1232.
Hunt, A. P., Parker, A. W. and Stewart, I. B. (2014). "Heat Strain and Hydration
Status of Surface Mine Blast Crew Workers." Journal of Occupational and
Environmental Medicine 56(4): 409-414.
Ishii, K., Inoue, S., Ohya, Y., Odagiri, Y., Takamiya, T., Suijo, K., Owen, N. and
Shimomitsu, T. (2009). "Sociodemographic Variation in the Perception of Barriers to
Exercise Among Japanese Adults." Journal of Epidemiology 19(4): 161-168.

187
ISO7933 (2004). Ergonomics of the thermal environment -- Analytical determination
and interpretation of heat stress using calculation of the predicted heat strain.
Geneva, International Standards Organisation.
Jacobs, J. A., Dodson, E. A., Baker, E. A., Deshpande, A. D. and Brownson, R. C.
(2010). "Barriers to Evidence-Based Decision Making in Public Health: A National
Survey of Chronic Disease Practitioners." Public Health Reports 125(5): 736-742.
Jehn, M., Gebhardt, A., Liebers, U., Kiran, B., Scherer, D., Endlicher, W. and Witt, C.
(2014). "Heat stress is associated with reduced health status in pulmonary arterial
hypertension: a prospective study cohort." Lung 192(4): 619-624.
Jiang, X. J., Castelao, J. E., Groshen, S., Cortessis, V. K., Shibata, D. K., Conti, D. V. and
Gago-Dominguez, M. (2008). "Water intake and bladder cancer risk in Los Angeles
County." International Journal of Cancer 123(7): 1649-1656.
Kalkowsky, B. and Kampmann, B. (2006). "Physiological strain of miners at hot
working places in German Coal mines." Industrial Health 44(3): 465-473.
Kenefick, R. W. and Sawka, M. N. (2007). "Hydration at the work site." Journal of the
American College of Nutrition 26(5): 597s-603s.
Lassen, A. D., Thorsen, A. V., Sommer, H. M., Fagt, S., Trolle, E., Biltoft-Jensen, A.
and Tetens, I. (2011). "Improving the diet of employees at blue-collar worksites:
results from the 'Food at Work' intervention study." Public Health Nutrition 14(6):
965-974.

188
Mears, S. A. and Shirreffs, S. M. (2015). "Assessing Hydration Status and Reported
Beverage Intake in the Workplace." American Journal of Lifestyle Medicine 9(2):
157-168.
Milani, R. V. and Lavie, C. J. (2009). "Impact of Worksite Wellness Intervention on
Cardiac Risk Factors and One-Year Health Care Costs." American Journal of
Cardiology 104(10): 1389-1392.
Miller, V. and Bates, G. (2007). "Hydration of outdoor workers in north-west
Australia." J Occup Health Safety 23(1): 79-87.
Miller, V. S. and Bates, G. P. (2010). "Hydration, hydration, hydration." Ann Occup
Hyg 54(2): 134-136.
Montazer, S., Farshad, A., Monazzam, M. R., Eyvazlou, M., Yaraghi, A. A. S. and
Mirkazemi, R. (2013). "Assessment of construction workers' hydration status using
urine specific gravity." International Journal of Occupational Medicine and
Environmental Health 26(5): 762-769.
Muckelbauer, R., Sarganas, G., Gruneis, A. and Muller-Nordhorn, J. (2013).
"Association between water consumption and body weight outcomes: a systematic
review." Am J Clin Nutr 98(2): 282-299.
Murray, B. (2007). "Hydration and physical performance." J Am Coll Nutr 26(5
Suppl): 542S-548S.

189
Olson, R., Anger, W. K., Elliot, D. L., Wipfli, B. and Gray, M. (2009). "A New Health
Promotion Model for Lone Workers: Results of the Safety & Health Involvement For
Truckers (SHIFT) Pilot Study." Journal of Occupational and Environmental Medicine
51(11): 1233-1246.
Oppliger, R. A., Magnes, S. A., Popowski, L. A. and Gisolfi, C. V. (2005). "Accuracy of
urine specific gravity and osmolality as indicators of hydration status." Int J Sport
Nutr Exerc Metab 15(3): 236-251.
Parsons, K. (2014). Human thermal environments: the effects of hot, moderate, and
cold environments on human health, comfort, and performance, Crc Press.
Peiffer, J. J. and Abbiss, C. R. (2013). "Thermal Stress in North Western Australian
Iron Ore Mining Staff." Annals of Occupational Hygiene 57(4): 519-527.
Phelan, S., Lang, W., Jordan, D. and Wing, R. (2008). "Weight Loss Maintainers Drink
more Water and Diet Soda than the Never Overweight." Obesity 16: S278-S278.
Polkinghorne, B. G., Gopaldasani, V., Furber, S., Davies, B. and Flood, V. M. (2013).
"Hydration status of underground miners in a temperate Australian region." BMC
Public Health 13: 426.
Popkin, B. M., D'Anci, K. E. and Rosenberg, I. H. (2010). "Water, hydration, and
health." Nutr Rev 68(8): 439-458.

190
Rutkove, S. B., Veves, A., Mitsa, T., Nie, R., Fogerson, P. M., Garmirian, L. P. and
Nardin, R. A. (2009). "Impaired distal thermoregulation in diabetes and diabetic
polyneuropathy." Diabetes Care 32(4): 671-676.
Sawka, M. N. and Coyle, E. F. (1999). "Influence of body water and blood volume on
thermoregulation and exercise performance in the heat." Exerc Sport Sci Rev 27:
167-218.
Sawka, M. N., Montain, S. J. and Latzka, W. A. (2001). "Hydration effects on
thermoregulation and performance in the heat." Comp Biochem Physiol A Mol
Integr Physiol 128(4): 679-690.
Shirreffs, S. M. (2003). "Markers of hydration status." Eur J Clin Nutr 57 Suppl 2: S6-
9.
Shirreffs, S. M. and Maughan, R. J. (1997). "Restoration of fluid balance after
exercise-induced dehydration: effects of alcohol consumption." J Appl Physiol
(1985) 83(4): 1152-1158.
Simerville, J. A., Maxted, W. C. and Pahira, J. J. (2005). "Urinalysis: a comprehensive
review." Am Fam Physician 71(6): 1153-1162.
Sokolnicki, L. A., Strom, N. A., Roberts, S. K., Kingsley-Berg, S. A., Basu, A. and
Charkoudian, N. (2009). "Skin blood flow and nitric oxide during body heating in
type 2 diabetes mellitus." J Appl Physiol (1985) 106(2): 566-570.

191
Stookey, J. D., Belderson, P. E., Russell, J. M. and Barker, M. E. (1997). "Relationship
of food groups and water intake to colon cancer risk." Cancer Epidemiology
Biomarkers & Prevention 6(8): 657-658.
Stookey, J. D., Constant, F., Popkin, B. M. and Gardner, C. D. (2008). "Drinking Water
Is Associated With Weight Loss in Overweight Dieting Women Independent of Diet
and Activity." Obesity 16(11): 2481-2488.
Stookey, J. D. and Ge, K. (1998). "Low food water intake and overweight status."
Faseb Journal 12(4): A221-A221.
Strijk, J. E., Proper, K. I., van der Beek, A. J. and van Mechelen, W. (2012). "A
worksite vitality intervention to improve older workers' lifestyle and vitality-related
outcomes: results of a randomised controlled trial." Journal of Epidemiology and
Community Health 66(11): 1071-1078.
Suhr, J. A., Hall, J., Patterson, S. M. and Niinisto, R. T. (2004). "The relation of
hydration status to cognitive performance in healthy older adults." International
Journal of Psychophysiology 53(2): 121-125.
Suhr, J. A., Patterson, S. M., Austin, A. W. and Heffner, K. L. (2010). "The Relation of
Hydration Status to Declarative Memory and Working Memory in Older Adults."
Journal of Nutrition Health & Aging 14(10): 840-843.
Zhang, Y., Coca, A., Casa, D. J., Antonio, J., Green, J. M. and Bishop, P. A. (2014).
"Caffeine and diuresis during rest and exercise: A meta-analysis." J Sci Med Sport.

192
CHAPTER 6 – HEAT STRESS AND HEAT STRAIN AMONG
SURFACE MINE WORKERS
6.1 Introduction
Workers in the mining industry, in both surface and underground mines, are often
exposed to high levels of occupation-related heat stress. This can occur when they
are working in hot, humid environments in underground mines or out in the open,
exposed to solar radiation in surface mines, especially when these mines are
located in the tropics. Heat is often generated by nearby machinery being used in
the mining process and is often exacerbated by the high ambient temperatures of
the climatic zones in which the mining operation is located. These environmental
factors, coupled with physiological factors such as metabolic demands, dehydration
and poor general health status, among other physiological factors have the
potential to cause heat strain among workers in these environments. The end result
is heat-related illnesses. This chapter characterises the thermal environment at a
surface mine, determines the potential for heat-related stressors and evaluates the
potential heat strain on high-risk workers in this environment.
6.2 Literature review
Humans are homeotherms, that is, they are warm-blooded and thus regulate their
core body temperature within a very narrow range (36.1°C to 37.2°C) (Parsons
2014). All enzymatic and biochemical reactions including organ function, muscular
contractions and propagation of nerve impulses within the human body are

193
temperature dependent. Shifts in core body temperatures can therefore affect the
ability of body organs and systems to function effectively. For instance, elevation of
the core body temperature above the upper limit of normal (hyperthermia) may
initiate denaturing and breakdown of proteins, including DNA and RNA (Streffer
1982). Above 40°C core body temperature this denaturing may be irreversible,
leading to permanent damage to organs and systems. Furthermore, a causal
relationship exists between hyperthermia and decreased maximal oxygen uptake by
tissues, which may attenuate physical effort and dampen an individual’s metabolic
output. This is perceived as fatigue (Wingo and Cureton 2006). The body’s response
to any changes or deviations from the normal core body temperature constitutes
the process of thermoregulation. The physiological thermoregulatory mechanisms
that attempt to compensate increases in core body temperature and prevent
development of heat related illnesses can all be summarised mathematically, using
the laws of thermodynamics, in the heat balance equation.
6.2.1 Heat balance equation
The heat balance equation is underpinned by the 1st and 2nd laws of
thermodynamics. The 1st law of thermodynamics states that energy can neither be
created nor destroyed but simply changes from one state to another. The 2nd law of
thermodynamics states that energy tends to spontaneously flow from regions of
higher concentration to regions of lower concentration. Based on these two laws of
thermodynamics, for the human body to maintain the core body temperature
within a narrow range of normality, there must be a heat (energy) balance that

194
exists between the internal body environment and the external environment
(Parsons 2014). In other words, a balance must exist between heat generation in
the body (metabolic heat production), heat transfer and heat storage. This is all
summarised in the heat balance equation as follows:
M - W = E ± R ± C ± K ± S
where:
M = rate of metabolic heat production
W = external work performed by the body
K = conductive heat loss or gain
C = convective heat loss or gain
R = radiant heat loss or gain
E = evaporative heat loss
S = heat gained or lost by the body
All of the above units are in Watts per Metre Squared (W/m2)
When the body is in a state of thermoregulatory balance, the value of S is
approximately zero. When the body is not dissipating residual heat or when the
external environment is causing the body to heat up further, then the value of S will
be positive (i.e. the body is storing heat), and vice versa. A positive S will result in
hyperthermia unless the heat balance is restored and the accumulated heat energy

195
is dissipated. This balance is achieved by the physiological process of
thermoregulation.
6.2.2 Thermoregulation
Thermoregulation is the body’s ability to self-regulate its core temperature within
the normal range. This process relies on a number of complex interactions between
the various systems of the body. The main systems responsible for
thermoregulation are the central nervous system (CNS), the peripheral nervous
system (PNS) and the cardiovascular system (CVS). The acute physiological response
to thermal shifts in the environment include shunting of blood from the core to the
periphery (skin) and sweating at thermal triggers, while the chronic physiological
response includes decreased blood viscosity and early sweating at non-thermal
triggers (Kondo et al. 2010). Secondary physiological responses also aid in the
thermoregulatory process and include piloerection, water conservation by the
kidneys and sensation of thirst. Apart from the physiological processes that operate
in thermoregulation, humans have developed behavioural responses to augment
and optimise the physiological thermoregulatory processes. These behavioural
responses include undressing, fanning, seeking shade/shelter and pacing
themselves while working (Parsons 2014). While some of these behavioural
responses are learned progressively; others such as self-pacing are a response to
subtle physiological triggers such as the onset of fatigue (Ekkekakis and Lind 2006,
Wingo and Cureton 2006).

196
While all the above physiological and behavioural processes are involved in
thermoregulation, these processes are not infallible. A limit is eventually reached
when these processes can no longer buffer or compensate the rise in core body
temperature from heat stress, and the heat strain builds up to eventually
overwhelm this thermoregulatory system, resulting in heat-related illnesses.
6.2.3 Heat-related illnesses
Ordinarily, humans exposed to heat from endogenous or exogenous sources have
no significant health consequence if they are able to compensate for the heat stress
and negate its deleterious impact. Heat-related illnesses arise when the
compensatory mechanism described above is unable to prevent a rise in core body
temperature (Donoghue 2004, Parsons 2014). The spectrum of heat-related
illnesses that may develop as a consequence may include:
• Prickly heat or heat rash – this is a transient debilitating condition that arises
when the skin remains wet due to continued sweating in excess of
evaporation. The water, salt and debris that remain on the skin may cause
blockage and inflammation of the sweat glands leading to this condition
(Donoghue and Sinclair 2000).
• Heat cramps – these are painful muscular spasms of the major muscles of the
arms, legs or abdomen. They occur due to excessive loss of sodium salts
through sweating (Stofan et al. 2005, Bergeron 2007, Parsons 2014).
• Heat syncope – this is a sudden loss of consciousness due to an abrupt
decrease in blood pressure as a result of blood shunting from the core to the
extremities in response to a rapid increase in environmental temperature. This

197
is normally seen in dehydrated and unacclimatised workers. It is mediated by
the autonomic nervous system (Carrillo et al. 2013).
• Heat exhaustion – this occurs due to loss of muscular output as a result of a
combination of dehydration and deficient oxygen and nutrient supply to the
muscles, following circulatory insufficiency as blood flow has been
redirected to the skin to cool the body and decrease core body temperature
(Donoghue and Sinclair 2000, Wingo and Cureton 2006).
• Heat stroke – this is the end stage of complete thermoregulatory failure. It is a
life-threatening condition as core body temperature rises to dangerous levels
(in excess of 41°C), leading to irreparable damage to tissues and organs
(Holman and Schneider 1989, Bazille et al. 2005). This condition requires
urgent medical intervention.
Between 2012 and 2013, 20 cases of heat-related illnesses and deaths were
recorded in the United States for those working in outdoor environments (Arbury et
al. 2014). There is therefore a real threat to people working outdoors in surface
mines in Australia. There are other adverse health consequences of hyperthermia
that do not strictly fall into the category of heat-related illness. Confusion and
cognitive degradation have been shown to occur in workers when the core body
temperature reaches 38.3°C (Pisacane et al. 2007). This in turn impairs a worker’s
ability to recognise the severity of a threat and act accordingly, thus increasing the
risk of serious harm, and possibly a fatal outcome (Hancock 1986, Xiang et al. 2014).
Men may develop infertility if exposed to frequent episodes of hyperthermia while
hyperthermia in women during pregnancy has been found to be teratogenic,

198
especially if the core body temperature exceeds 39°C in the first trimester of
pregnancy (McMurray and Katz 1990). There are some intrinsic factors that can
limit the efficiency of the body’s heat dissipation mechanisms, such as pre-existing
medical conditions.
6.2.4 Pre-existing medical conditions
Pre-existing medical conditions such as diabetes can interfere with blood circulation
to the periphery (skin) as a result of diabetic peripheral neuropathy, thus decreasing
the efficiency of evaporative heat loss (Scott et al. 1987, Rutkove et al. 2009,
Sokolnicki et al. 2009). Hypertension is another pre-existing medical condition that
interferes with thermoregulation as a result of altered response of peripheral blood
vessels to heat (impaired vasodilatation) (Gryglewska et al. 2010, Jehn et al. 2014).
Use of certain medications and stimulants may also affect the body’s
thermoregulatory process by directly affecting the peripheral blood vessels or by
elevating the metabolic rate (Brown and Kiyatkin 2004, Levine et al. 2012).
Examples of such medications and stimulants include blood pressure medications
such as beta-blockers e.g. atenolol and propranolol, central nervous stimulants such
as amphetamines, antidepressants such as tricyclic antidepressants e.g.
amitriptyline, and recreational drugs such as cocaine and methylenedioxy-
methamphetamine (MDMA or Ecstasy).
The general fitness of the worker is equally important as overweight and obese
workers have impaired thermoregulatory mechanisms because the excess body fat
acts as a thermal insulator and also increases resistance to blood flow through fatty

199
tissue (Anderson 1999, Savastano et al. 2009). This places overweight and obese
workers at a greater risk of heat stress, heat strain and heat-related illness. A study
showed that up to 91% of workers in the mining industry are overweight or obese
(Polkinghorne et al. 2013). Hence there is a need to investigate the extent to which
overweight and obesity actually influences the risk of working in hot environments.
Two other factors that fall under general fitness of the worker are the ability to
acclimatise to the hot working environment and the hydration status of the worker.
6.2.5 Acclimatisation
Heat acclimatisation is a complex process that involves a series of physiological
adaptations by the body, which occur after multiple exposure of a worker to hot
working environments (Parsons 2014). Acclimatisation has been described as being
a major factor in a worker’s ability to cope with heat stressors within the work
environment (Logan and Bernard 1999, Dang and Dowell 2014, Parsons 2014). The
physiological adaptations in heat acclimatisation include increased blood volume,
increased sweat rate and decreased electrolyte loss in sweat and urine. The
cumulative effect of these physiological adaptations results in a more efficient
sweating mechanism that is triggered earlier by exertion in a hot environment
rather than a rise in core body temperature (Charkoudian 2010, Kondo et al. 2010).
Thus, workers who are not acclimatised to working in hot environments will be at
an increased risk of heat strain and heat-related illness than workers who are
acclimatised to working in such environments. The length of time taken to
acclimatise varies due to differing physiologies of each worker and can range from

200
seven to 21 days (Parsons 2014). However, it is important to note that the
variations in thermoregulatory capacity have been found to have a stronger
association with hydration status than acclimatisation (Montain and Coyle 1992,
Sawka et al. 1992). Even acclimatisation depends on the hydration status of workers
to a large extent given that the end result of acclimatisation is increased sweat rate,
which would be limited in dehydration.
6.2.6 Hydration status
Hydration status has been discussed previously in chapter five. Staying hydrated is
crucial to working in hot environments as it enables efficient maintenance of core
body temperature within normal limits. Core temperature is regulated by the
hypothalamus from where adjustments are made in response to inputs from
thermoreceptors in the skin, muscle and central nervous system (Parsons 2014).
These adjustments are the physiological responses to hot environments described
above in the section on thermoregulation. These physiological responses are highly
dependent on total body water to function effectively, such that dehydration or
hypohydration will result in reduced heat strain tolerance and thus inability to
tolerate as high an increase in core body temperature as when hydrated (Sawka et
al. 2001a, Sawka et al. 2001b). This is further illustrated in figure 6-1. It is important
to note that the capacity of hydration to protect workers is finite, as over-hydration
from excessive consumption of water can result in dangerous electrolyte
disturbances (Armstrong et al. 2007). Research has shown that heat exhaustion and
heat cramps are strongly correlated with dehydration (Chan et al. 2013).

201
Furthermore, dehydrated persons exhibit disproportionate increases in their core
body temperature and heart rate on exposure to heat stress when compared with
hydrated persons (Cheung and McLellan 1998, Carter et al. 2005). Hence the risk of
hyperthermia and consequent heat-related illness can be decreased by being well
hydrated prior to exposure to hot environments and also by maintaining optimum
hydration levels during exposure. This is not the case for workers in the mining
industry, as a large number of them start work dehydrated.
Figure 6-1: Core temperature changes during exercise-heat stress in heat
acclimatised (HA), unacclimatised (UA), normal hydrated (euhydrated (Eu)) and
hypohydrated (Hypo) persons (Sawka et al. 2001).
Although hydration status is not a measure of heat strain, the state of dehydration
can result in high heat strain, resulting in increased risk of heat-related illness. Thus

202
the maintenance of optimal hydration levels is critical in preventing heat strain, as
well as supporting other bodily functions. Therefore, assessing and monitoring
hydration status is important for people working in hot environments. Assessment
of hydration status must be done in conjunction with assessment of heat stress and
heat strain to create a complete hot environment work profile that includes both
the worker and the environment.
6.2.7 Heat stress and heat strain
The combined effect of the external thermal environment and internal metabolic
heat production is the thermal (heat) stress on the body, while the physiological
responses to thermal stress by the body is the thermal (heat) strain (Tillman 2006).
Exposure to heat stressors that contribute to heat strain result in symptoms ranging
from headaches, sweating, exhaustion and impairment of cognition, through to
frank thermoregulatory failure and even death (Parsons 2014). This usually results
from gradual failure of the body’s thermoregulatory processes, leading to the
development of heat-related illnesses.
6.2.7.1 Assessment of heat stress
Heat stress assessment requires consideration of several key factors. These include
air temperature (both wet bulb and dry bulb temperatures), radiant temperature,
humidity, air velocity and the insulation factor of the type of clothing worn (Parsons
2014). These six factors affect the human response to heat. In order to protect a
worker from heat stress and the risk of heat related illness, heat stress indices have

203
been developed, many of which take all six factors into consideration. These indices
can be categorised into rational and empirical indices.
1. Rational indices
Rational indices, also known as theoretical indices, are measurements based on
physiological parameters of the human body in response to a hot environment.
These parameters include sweating, core body temperature, heart rate and
metabolic work. Many are modelled on the heat balance equation. Common
rational indices in use in the mining industry include the Predicted Heat Strain and
the Thermal Work Limit.
A) Predicted Heat Strain
The predicted heat strain (PHS) was developed to improve the analytical method of
assessing hot environments based on the required sweat rate index (Malchaire et
al. 2001). The PHS predicts minute by minute sweat rate and rectal temperature (a
surrogate for core body temperature). Many significant changes were made to the
PHS to include the effects of forced convection, body movements and exercise,
acclimatisation, maximum skin wettedness for efficient evaporation of sweat,
maximum sweat rate, maximum dehydration and water loss and maximum
permissible rectal temperature (Malchaire et al. 2001). Individual factors can thus
be modified to determine which conditions can be adjusted to enable a safe
working environment. The PHS therefore encourages the introduction of
sustainable higher level controls (such as substitution and engineering controls)
over the predominantly administrative controls used in the other common rational

204
index used, the thermal work limit. A fundamental assumption of the PHS is that
acclimatised workers are able to sweat more efficiently and abundantly, thus
resulting in a lower heat storage (lower core body temperature) and lower
cardiovascular constraint (lower heart rate). This assumption may be limiting as
workers have varying hydration levels. In fact, up to 58% of workers in the mining
industry are dehydrated, putting them at an increased risk of heat strain
(Polkinghorne et al. 2013).
The PHS was validated through a series of laboratory and field experiments
involving stable and dynamic conditions with high and low radiation, humidity and
air velocity. It is important to note that experiments to develop the PHS model were
done on male subjects and cannot therefore be generalised to females working in
hot environments. In the mining industry, this is not a weakness of the PHS as most
people working in hot humid environments generally tend to be males. The PHS is
based on a complex set of algorithms making it difficult to use without
computerised software. This is one of the major limiting factors that has prevented
widespread uptake of the PHS despite being an International Standard (ISO7933
2004). Other limitations to the PHS include the assessment of rapidly changing
environments, short exposures and the use of fully encapsulated protective suits all
of which are outside the scope of the PHS index.
B) Thermal Work Limit
The thermal work limit (TWL) is defined as the limiting or maximum sustainable
metabolic rate that an euhydrated, acclimatised individual can maintain in a given

205
thermal environment within safe limits of both deep body core temperature and
sweat rate (Brake and Bates 2002). The TWL estimates the work rate that can be
maintained in a given environment in which the core body temperature should be
less than 38.2°C and the sweat rate less than 1.2 kg/h. It is gaining increasing
popularity within Australia and the Middle East (Miller and Bates 2007, Bates and
Schneider 2008). The basis for this index is that for any given thermal environment
and any given combination of environmental and clothing parameters, there is a
maximum rate at which heat can be dissipated from the body. The index makes use
of the wet bulb, dry bulb and globe temperatures and the air velocity to calculate
the index. The calculated index is then compared to primarily administrative
interventions as outlined in table 6-1 below.
The TWL makes a number of important assumptions that workers are physically fit,
not affected by any thermoregulatory limitations and able to self-pace their work.
These assumptions are not valid for workers in the mining industry, as over half the
workers are already dehydrated, overweight or obese, thus limiting their
thermoregulatory capacity, and self-pacing is virtually non-existent as workers must
work to a specified quota every shift (Brake and Bates 2003, Bates and Schneider
2008, Savastano et al. 2009, Polkinghorne et al. 2013). Furthermore, the TWL does
not take into account the clothing ensemble worn by the workers as the original
algorithm for the TWL used a clothing insulation factor of 0.35, equivalent to a
worker wearing tee-shirt and shorts. The clothing insulation factor has subsequently
been revised in a number of proprietary algorithms but the modifications have not

206
been made available nor supported by any published research. Instrument
manufacturers that have incorporated the modified algorithms have stated neither
what version of the TWL is being used, nor what clothing insulation factor is being
used. This has resulted in different instruments producing different values of the
TWL for a given thermal environment.
Table 6-1: TWL working zones and recommended management interventions
(Source: www.pointhealth.com.au)
TWL (W/m2)
Working Zone
Interventions (controls)
> 140 Unrestricted No limits on self-paced work for educated, hydrated, acclimatised workers
115-140 Buffer Buffer zone exists to identify situations in which environmental conditions may be limiting to work
• Any practicable intervention to reduce heat stress should be implemented e.g. provide shade, improve ventilation etc.
• Working alone to be avoided if possible • Unacclimatised workers not to work in this zone • Fluid intake of ≥1 litre per hour required • Work-rest cycling or rotation required
< 115 Withdrawal Work limited to essential maintenance or rescue operations
• No person to work alone • No unacclimatised person to work • Documentation required authorising work in
hostile thermal conditions for specific purpose • Specific induction required emphasising
hydration and identifying signs of heat strain • Apply 20 minutes work and 40 minutes rest
schedule • Dehydration testing recommended at end of
shift • Personal water bottle (2 litre capacity) must be
on the job at all times

207
Further research has been done with the TWL using a clothing insulation factor of
0.6, equivalent to a worker wearing shirt and trousers, which correlated well with
physiological parameters measured in a given thermal environment (Chan et al.
2013). To date there has been no independent validation of the TWL apart from
validation by the creators of the index due to unavailability of the algorithms used.
2. Empirical indices
Empirical indices are those indices that have been developed by assessing the
influence of varying environmental conditions on the human body’s physiological
response in a group of people under controlled test conditions. Common empirical
indices in use in the mining industry include the effective temperature and the wet
bulb globe temperature.
A) Effective temperature
The effective temperature (ET) was initially developed as a thermal comfort scale by
Houghton and Yagloglou in 1923 (Houghton and Yagloglou 1923). It essentially
combines the effects of air temperature, humidity and air velocity into a single
index used for comparisons (Parsons 2014). Two separate charts for the ET were
developed, one for persons naked to the waist – the basic ET, and one for normally
clothed people – the normal ET. A fundamental flaw of the ET was that it
overestimated the effects of humidity at low temperatures and underestimated
them at high temperatures. In an attempt to correct this flaw, the dry bulb
temperature was replaced with globe temperature, which resulted in the corrected
ET. The ET scales do not adequately allow for the adverse effect of low air velocity

208
when conditions are very humid (McArdle et al. 1947). A small allowance is made
for clothing but no other personal factors (such as hydration status, weight and
metabolic rate) have been taken into account. In addition, the ET is misleading
when used to predict physiological effects at levels of environmental temperatures
at which heat collapse may be expected, that is above 32.2°C effective temperature
(Ellis et al. 1972). The ET is widely used in the mining industry in the United Kingdom
and Europe (Kalkowsky and Kampmann 2006). In Australia, the ET is required under
the Queensland Coal Mining Safety & Health Regulation, with a stipulated
prohibition of work at an ET > 29.4°C (Queensland 2001).
B) Wet bulb globe temperature
The wet bulb globe temperature (WBGT) was developed in 1957 specifically for use
by the United States military to reduce their heat casualties during training (Yaglou
and Minard 1957). This is the most commonly used index of heat stress worldwide
and was also adopted as an International Standard (ISO7243 1989). The index
combines the air temperature, humidity, air velocity and radiant heat into a single
number for comparison. Two versions of the index exist, one for outdoors and the
other for indoors. The calculated WBGT is then compared with screening criteria
provided by the American Conference of Governmental Industrial Hygienist
Threshold Limiting Values (ACGIH-TLV) to determine exposure times and work-rest
regimes (ACGIH 2014). It is important to note that the screening criteria are based
on the assumption that the workers are fit, acclimatised, fully clothed, have access
to adequate drinking water and are able to function without exceeding a core
temperature of 38°C. The WBGT does not take into account humidity or the

209
hydration level of workers. This limits the WBGT as it does not adequately reflect
the additional strain workers experience when evaporation of sweat is restricted by
high humidity or low air velocity (Budd 2008). Furthermore, the WBGT has been
shown to be excessively conservative and unsuitable for use in environments with
high ambient temperatures, as it may lead to production loss due to frequent work
stoppage (Miller and Bates 2007, Budd 2008).
6.2.7.2 Assessment of heat strain
While assessment of heat stress using the heat stress indices provides guidelines to
manage those working in hot environments, assessment of actual heat strain
through physiological monitoring is required when the heat stress indices cannot
ensure the safety of the exposed worker. This often occurs when the heat stress
indices indicate periods of work no greater than 30 minutes in a given hot
environment or the use of fully encapsulated personal protective equipment (PPE),
which is not factored into any heat stress index, as it does not allow air or water
vapour movement, or a combination of both.
Physiological monitoring includes parameters such as core body temperature, heart
rate, sweat loss and urine specific gravity, all of which strongly correlate with heat
strain (ISO9886 2004). The most commonly used physiological monitoring
parameters include the core body temperature, the heart rate and the urine specific
gravity. The urine specific gravity has been discussed in chapter five.

210
A) Core body temperature
Following the guidelines of the International Standards, the core body temperature
of any person working in a hot environment must not exceed 38°C (ISO7933 2004).
Various methods have been proposed to measure the core body temperature, and
include oesophageal temperature, rectal temperature, intra-abdominal (core)
temperature, oral temperature, tympanic temperature, auditory canal temperature
and urine temperature (ISO9886 2004).
The tympanic and oesophageal temperatures react more quickly to changes in
exertion as the tissue has a lower thermodynamic inertia compared to intra-
abdominal temperature (Gagnon et al. 2010). The auditory canal temperature
appears to be more favoured as an acceptable compromise between precision of
estimation and practicality due to its simplicity, acceptability, cost effectiveness and
ease of use (ISO9886 2004, Huggins et al. 2012). A comparison of auditory canal
temperature and rectal temperature showed that the auditory canal temperature
underestimates the rectal temperature by an average of 0.7°C (Huggins et al. 2012).
Recently, ingestible telemetry pills have begun to gain significant favour as the
method is more efficacious and has been validated to represent an individual’s true
core body temperature (Byrne and Lim 2007, Casa et al. 2007, Ruddock et al. 2014).
It nonetheless is more expensive to use and prone to electromagnetic and
radiofrequency interference that may result in inaccurate results (Byrne and Lim
2007).

211
B) Heart rate
For each °C rise in core body temperature, the heart rate increases, on average, by
33 beats per minute (bpm) (ISO9886 2004). Three heart rate limits have been
proposed as a measure of heat strain. These are:
• ISO 9886 – Heart Rate Limit calculated as “185-0.65*(worker’s age)”. This
heart rate limit then becomes the upper limit for sustained output while
working in a hot environment.
• Heart rate recovery – First proposed in 1963, the heart rate recovery assesses
the physiological strain on the heart when working in hot environments
(Maxfield and Brouha 1963). The heart rate of a seated worker is measured
and recorded in the last 30 seconds of the first, second and third minutes.
These measures are designated P1, P2 and P3 respectively. The interpretation
of the heart rate recovery is as follows:
o The physiological stress is acceptable if P3 < 90 bpm or P3 ≥ 90 bpm
but with a P1 minus P3 ≥ 10 bpm.
o The physiological stress of the work is too high to allow sufficient
recovery for the subject if P3 ≥ 90 bpm and P1 minus P3 < 10 bpm.
• The ACGIH guidelines for limiting heat strain – These include:
o A sustained heart rate in excess of “180-worker’s age in years” for
workers assessed with normal cardiac performance.
o Recovery heart rate at one minute after a peak work effort greater
than 120 bpm.

212
The core temperature, the heart rate, or both may be used in the assessment of
heat strain depending on the resources available.
6.2.8 Summary
In summary, the process of thermoregulation is controlled centrally by the
hypothalamus with sensory inputs from thermoreceptors in the body. Physiological
compensations are made in response to a hot environment to limit heat storage by
the body, thus limiting any rise in core body temperature. A failure of these
compensatory mechanisms leads to dangerous elevations of core body
temperature. This may result in heat-related illness ranging from heat rash to the
potentially fatal heat stroke. Pre-existing medical conditions such as high blood
pressure and diabetes can limit the ability of the body to physiologically
compensate for increases in core body temperature, predisposing such persons to a
higher risk of heat-related illness. Other factors such as body fat may impair heat
dissipation, as the fat acts as a thermal insulator for the body, trapping the heat.
Acclimatisation is one way to train the body to adapt to working in hot
environments. This normally takes between seven and 21 days to happen. A key
factor in a person’s ability to work in hot environments is their hydration status,
which has been discussed previously in chapter five. Heat stress indices have been
developed to provide a guide for workers in hot environments. It is important to
understand the limitations of the different heat stress indices prior to their
application. Heat strain assessment may be required when a heat stress index

213
cannot protect a worker. Heat strain assessments can be done by measuring the
core body temperature, the heart rate, or both.
For overweight or obese workers who are dehydrated and working in hot humid
environments, there appears to be a real threat to their health and wellbeing as
such workers are at an increased risk of developing heat-related illness, which may
be potentially fatal. It was therefore a crucial part of this study to assess heat stress,
heat strain and hydration status among high-risk workers at the study site, that is,
workers who were exposed to hot environments. A detailed methodology of this
process is outlined below.
6.3 Methodology
6.3.1 Design
Three formal monitoring periods were selected for this part of the study. The first
was a baseline monitoring conducted in January 2013 depicting the peak summer
period. The second was a mid-point monitoring conducted in August 2013 depicting
winter period. The third was a follow-up monitoring conducted one year later in
January 2014, again depicting the peak summer period.
6.3.2 Participants
Participants for the heat stress study were selected as a subset from the entire
study population based on the shift that was working during the testing days. All
observations were conducted during the day shift. The workers targeted for the
heat stress study were those at high risk for developing heat-related illness. As most

214
people who worked at the mine were either in air-conditioned vehicle cabins or
offices, only those whose work required them to be exposed to a hot environment
were selected. These workers were thus grouped into similar exposure groups
(SEGs). These included shot firers and processing personnel only. Drillers were not
identified as an at-risk group as they were always in an air-conditioned cabin in the
drilling machine. Maintenance workers were not identified as an at-risk group as
they all worked in ventilated sheds under shade. Shot firers were responsible for
assembling, positioning and detonating explosives at the mine site to dislodge rock
or soil. As such they were required to work out in the sun throughout their shift.
Processing personnel were responsible for inspecting, measuring and recording
various parameters around the crushers, grinding mills, settling tanks and agitation
tanks, all of which are located outdoors, requiring processing personnel to work in
the sun throughout their shift. Characteristics and activities performed by each SEG
are summarised in Appendix 21.
Of the 152 participants who enrolled in the study, 13 were identified as employees
directly exposed to working in a hot environment and therefore at high risk of
developing heat-related illness. Other workers who were exposed to working in the
same hot environment but who were not part of the overall study, were
approached to participate in this aspect of the study, but all declined to participate.
6.3.3 Measures – instruments and procedures
6.3.3.1 Questionnaire
A questionnaire comprised of four sections was developed (Appendix 17).

215
• Section 1 collected demographic information from participants including
age, gender and job. Other parts of the first section included date, shift,
measured weight, measured height and USG.
• Section 2 collected information on frequency of heat-illness symptoms
experienced over the previous twelve months.
• Section 3 collected information on the working environment, and included
information pertinent for assessing heat stress such as type of clothing
worn, parts of the body used mostly during work, number of breaks taken
and number of hours working in the sun.
• Section 4 collected information on hydration and included questions on
accessibility to drinking water, frequency of drinks, quantity of water drunk,
other fluids drunk apart from water and frequency of urination.
The questionnaire was administered to all participants by the primary researcher
who also measured the weight, height and pre-shift USG prior to participants
commencing their shift, and post-shift USG after the end of the shift. Participants
completed all other sections of the questionnaire, which was handed back to the
researcher at the end of the shift.
6.3.3.2 Environmental monitoring
Environmental parameters such as the wet bulb temperature, dry bulb
temperature, globe temperature, humidity and air velocity were all measured using
three different instruments – the QUEST Temp 36 (S/N: TKG050022), the CALOR
Heat Stress Monitor (S/N: 1026998) and the KESTREL 4400 Heat Stress Meter (S/N:

216
664553). All three instruments were used within their specified operating ranges.
Instruments were mounted on a tripod at waist height, approximately 1.2 meters
from the ground. Monitoring locations were selected next to the working areas for
all participants so as to take representative measurements of heat exposures.
Measurements were taken periodically throughout the shift, starting at 6:00am and
ending at 6:00pm.
A) QUEST Temp 36
The QUEST Temp 36 was used in compliance with the manufacturer’s instructions.
It was first checked to see if it was within its calibration date (see calibration
certificate in Appendix 18). Following that, the instrument was tested with a dummy
dongle that verified that the instrument was within its calibration range. During
each measurement, the QUEST Temp 36 was left to equilibrate with the
environment for a minimum of 10 minutes prior to data being collected and
recorded.
B) CALOR Heat Stress Metre
The CALOR Heat Stress Metre was used in compliance with the manufacturer’s
instructions. It was first checked to see if it was within its calibration date (see
calibration certificate in Appendix 19). The CALOR Heat Stress Metre collected static
measurements after 2 minutes of equilibration with the environment. No prior
checks or pre-calibration was required as long as the instrument was within the
calibration date, and only the TWL was being used and not the alternative Heat
Strain Model. However, on using the CALOR Heat Stress Meter on the first day and
217
comparing it with the other two heat stress meters, it was discovered that the
CALOR Heat Stress Meter readings were markedly different from the other two. The
error in measurement with the CALOR instrument ranged from 0.6°C to 4.8°C.
Based on this margin of error, it was decided that the CALOR instrument would be
discontinued and all data from the CALOR instrument discarded. Upon further
investigation, it was discovered that the sensor panel on the CALOR instrument had
been damaged, resulting in the inaccuracies of measurement. The sensor panel
could not be replaced in time to continue the study using the CALOR instrument.
C) KESTREL 4400 Heat Stress Meter
The KESTREL 4400 Heat Stress Meter was used in compliance with the
manufacturer’s instructions. It was set up on the tripod with a vane mount that
made the instrument able to take omnidirectional air velocity readings averaged
progressively. The KESTREL 4400 was left to equilibrate for a minimum of 10
minutes prior to data being collected and recorded.
6.3.3.3 Physiological monitoring
The physiological monitoring was developed with reference to ISO 9886:2004 –
Ergonomics-Evaluation of thermal strain by physiological measurements. Variations
from the ISO9886 were essential due to funding limitations and practicality of
performing the assessments with minimal interference to normal operations.
The core body temperature was measured using the tympanic temperature as a
surrogate. A Braun Thermoscan PRO 4000 was used to measure tympanic
temperature using infrared reading of the tympanum, with the reading provided to

218
the nearest 0.1°C. All participants were wearing hats with neck flaps covering their
ears. This allowed the use of the tympanic temperature as a surrogate for the core
temperature, as there was little effect of the external environment on the ear and
auditory canal. Readings were done on the right and left tympanums, and averaged.
The heart rate was measured, using the pulse rate as a surrogate, by physically
counting the pulse rate on the radial artery of the right arm. This was done by the
primary researcher, who is a trained health professional and competent to take
these readings. Any abnormality in the rate or rhythm of the pulse was
crosschecked by taking the pulse on the left arm as well.
6.3.3.4 Hydration status
The hydration status was assessed by measuring the USG as outlined in chapter five
(Section 5.3.3.2).
6.3.4 Measures – intervention
As part of the study, the health promotion/intervention program also focused on
heat stress awareness. Specific aspects of the intervention program that focused on
heat stress were packaged together with hydrations status and have been discussed
in chapter five (Section 5.3.4.4).
6.3.5 Data processing and analysis
All data were entered into the statistical software IBM SPSS version 21 for analysis.
Mean and standard deviations were provided as summary indices for all data. Cut-
off points for the core body temperature was 38°C in keeping with International
Standards (ISO7933 2004). The cut-off point for USG was set at 1.020 in keeping

219
with literature (Armstrong et al. 1994, Casa et al. 2000, Oppliger et al. 2005,
Armstrong et al. 2010). Statistical significance was set at a P-value of < 0.05. The
limits used for the heat stress indices were based on the International Standards for
the PHS, the ACGIH for the WBGT, the Queensland legislation for the ET and the
TWL guidelines (Queensland 2001, Bates and Miller 2002, ISO7933 2004, ACGIH
2014). Environmental data analysis for the PHS modelling was done using the
software ergonomics of the thermal environment (ETE) produced by Rio Tinto Pty
Ltd.
Independent samples t-test was used to evaluate the differences between each
exposure group (shot firers and processing personnel) for body mass index, USG,
heart rate, core body temperature and fluids consumed. Paired samples t-test was
used to evaluate the differences between pre- and post-shift USG. Correlation
analysis was used to evaluate the relationship between risk factors such as age,
body mass index, duration of exposure, hydration status, heart rate, core body
temperature and the heat stress indices and heat strain. Repeated measure analysis
of variance was used to evaluate the differences in the physiological and
environmental variables collected at the different time points during the shift.
6.4 Results
The general demographics of participants who took part in the heat stress study are
presented in table 6-2. The average age of participants was 39 years with a range of
23 to 58 years. Most participants were male. One female shot firer was the only
exception. The average body mass index was 30.3 kg/m2. All participants were

220
acclimatised to working in hot environments and had been doing so for over two
years. None of the participants had any pre-existing medical conditions preventing
them working in hot environments.
Table 6-2: Demography of participants in the heat stress study (n = 13).
Mean (± SD) Range
Age (yrs) 39 (± 12.0) 23 - 58
Weight (kg) 92.9 (± 12.5) 75.5 - 113.4
Height (m) 1.75 (± 0.07) 1.64 - 1.90
BMI (kg/m2) 30.3 (± 3.5) 24.9 - 35.1
With regard to hydration status, table 6-3 presents the pre- and post-shift USG,
while figure 6-2 presents the trend of hydration status over the entire shift. There
was a statistically significant deterioration in the hydration status of the participants
over the 12-hr shift (P < 0.05), with only one participant who was left hydrated at
the end of the shift. Shot firers were the highest risk group, with 75% of them
presenting to work dehydrated and all of them remaining dehydrated at the end of
their shift.

221
Table 6-3: Pre- and post-shift Urine Specific Gravity (USG) and hydration status of
participants (n = 13).
Pre-shift Post-shift P - value
USG
Mean ± SD 1.021 (± 0.005) 1.024 (± 0.003) 0.009*
Range 1.010 - 1.027 1.019 - 1.032
* Statistically significant at P <0.05 using paired samples t-test
Figure 6-2: Hydration status pre- and post-shift (n = 13).
5
1
8
12
0
2
4
6
8
10
12
14
Pre-shift Post-shift
Num
ber o
f par
ticip
ants
Hydrated Dehydrated

222
Tables 6-4A and 6-4B presents the distribution of heat strain symptoms among the
participants during a 12-hour shift over the previous year. Headaches and fatigues
were the most common symptoms of heat strain. More heat strain symptoms were
experienced during the day shift than during the night shift and more heat strain
symptoms were experienced by workers aged 55 to 59 years. The environmental
data collected at the first (baseline), second (midpoint) and third (final) monitoring
periods are presented in tables 6-5, 6-6 and 6-7 respectively. The heat stress indices
are also displayed in the same tables for comparison with each other.
Table 6-4A: Heat strain symptoms among participants.
SYMPTOM n (%) Frequency Shift
Rash on skin 2 (15.4) More than once Day only
Muscle cramp 2 (15.4) More than once Day only
Headache 9 (69.2) More than once Day and night
Weakness 3 (23.1) More than once Day only
Fatigue 6 (46.2) More than once Day and night
Dizziness 2 (15.4) More than once Day only
Clammy/moist skin 1 (7.7) More than once Day only
Irritability 1 (7.7) More than once Day and night
Hot dry skin 2 (15.4) More than once Day only
High body temperature 2 (15.4) More than once Day only
Low coordination 1 (7.7) More than once Day only

223
Table 6-5B: Heat strain symptoms by age group.
AGE GROUP No. of Symptoms Frequency Shift
25 – 29 5 More than once Day only
30 – 34 5 More than once Day only
35 – 39 3 More than once Day only
40 – 44 2 More than once Day only
45 – 49 0 More than once Day only
50 – 54 0 More than once Day only
55 – 59 16 More than once Day only

224
Table 6-6: Environmental monitoring data and heat stress indices for the first (baseline) monitoring period
CREW DATE TIME WB (°C)
DB (°C)
GT (°C)
AV (m/s)
RH (%)
WBGT (°C)
TWL ET PHS Predicted water loss from PHS
Processing 30/01/2013*
09.00 14.4 23.7 30.1 1.5 34 18.5 333 22.0 Rectal temp of 38°C not exceeded
8.2L over 12-hr shift 10.00 18.4 25.2 43.5 1.1 52 24.1 215 27.5
11.30 16.9 27.1 42.0 1.3 34 23.0 240 26.8 13.00 18.1 30.2 44.8 2.4 29 27.0 222 27.5 15.00 17.1 31.4 41.6 3.0 21 23.4 256 26.2
Shot firer 14.05 20.3 34.1 46.7 1.9 27 27.0 201 28.8 Rectal temp of 38°C not exceeded
10.4L over 12-hr shift
Processing 31/01/2013*
09.00 15.8 22.7 34.9 1.5 48 20.3 291 24.1 Rectal temp of 38°C not exceeded
8.0L over 12-hr shift 10.00 16.3 27.1 38.1 1.6 31 21.7 275 25.4
13.00 19.6 33.9 44.7 2.1 25 26.1 222 28 16.00 16.7 37.2 45.0 1.1 9 24.4 230 27.3
Processing 01/02/2014*
09.00 14.7 18.3 25.4 2.1 68 17.2 365 19 Rectal temp of 38°C not exceeded
6.6L over 12-hr shift 10.00 17.3 22.4 37.4 1.1 60 21.8 259 25.6
14.00 17.2 25.5 32.8 3.0 43 21.2 320 25.5
Shot firer 12.00 17.8 26.9 38.7 6.1 40 22.9 276 25.0 Rectal temp of 38°C not exceeded
7.7L over 12-hr shift
WB - Wet bulb temperature, DB - Dry bulb temperature, GT - Globe temperature, AV - Air velocity, RH - Relative humidity, ET - Effective temperature, PHS - Predictive Heat Strain (Phase 1 - 390 minutes work, Phase 2 - 45 minutes lunch break, Phase 3 - 270 minutes work) * Overcast for most of the day

225
Table 6-7: Environmental monitoring data and heat stress indices for the second (midpoint) monitoring period
CREW DATE TIME WB (°C)
DB (°C)
GT (°C)
AV (m/s)
RH (%)
WBGT (°C)
TWL ET PHS Predicted water loss from PHS
Processing 05/09/2013
10.30 15.5 19.3 28.8 2.1 60 18.5 338 21.0 Rectal temp of 38°C not exceeded
5.2L over 12-hr shift 12.30 16.2 26.8 35.5 3.0 36 21.1 304 24.2
14.30 16.5 26.7 30.6 0.8 31 20.6 298 24.9 16.30 16.1 25.0 27.8 0.9 37 19.8 310 21.3
Processing 06/09/2013
08.30 14.7 18.6 27.4 2.8 68 17.2 358 19.6 Rectal temp of 38°C not exceeded
4.8L over 12-hr shift 11.30 16.9 22.6 29.1 2.5 52 19.9 341 21.2
14.30 18.1 26.2 36.8 3.1 30 23.5 267 25.0 16.30 16.7 26.7 30.1 3.1 29 19.8 320 21.5
Processing 10/09/2013
13.00 14.6 20.1 30.4 2.8 36 19.1 319 21.3 Rectal temp of 38°C not exceeded
4.5L over 12-hr shift 15.30 14.5 21.3 26.6 1.2 39 16.5 320 20.1
Shot firer 14.30 17.2 22.9 40.0 0.8 26 24.9 236 26.9 Rectal temp of 38°C not exceeded
7.6L over 12-hr shift 16.30 18.4 24.7 35.6 0.8 33 23.7 274 25.9
WB - Wet bulb temperature, DB - Dry bulb temperature, GT - Globe temperature, AV - Air velocity, RH - Relative humidity, ET - Effective temperature, PHS - Predictive Heat Strain (Phase 1 - 390 minutes work, Phase 2 - 45 minutes lunch break, Phase 3 - 270 minutes work)

226
Table 6-8: Environmental monitoring data and heat stress indices for the third (final) monitoring period
CREW DATE TIME WB (°C)
DB (°C)
GT (°C)
AV (m/s)
RH (%)
WBGT (°C)
TWL ET PHS Predicted water loss from PHS
Processing 14/01/2014
08.30 22.2 28.7 42 1 57 26.8 204 24 Rectal temp of 38°C exceeded at 121 minutes following lunch break
8.9L over 12-hr shift 10.30 23.9 33.4 46.6 1.1 45 29.3 169 26.7
13.30 24.9 37.2 56.1 1.2 36 32.4 <115 28.3 15.30 22.6 37.1 47.9 4.2 28 29.1 179 26 17.30 26.4 41.7 58.4 3.8 30 34.3 <115 29.6
Processing
15/01/2014
08.30 21 28.3 40.2 0.5 52 25.6 201 24 Rectal temp of 38°C not exceeded
9.9L over 12-hr shift 11.30 22.8 37.5 53.9 0.9 27 30.5 121 27.5
14.00 22.8 39.7 53.1 1 22 30.6 134 28.2 17.00 23.5 41.2 53.6 5 21 31.3 <115 28.1
Shot firer 10.30 23.5 34.9 49.3 1.1 38 29.8 154 29.5 Rectal temp of 38°C
exceeded at 35 minutes following lunch break
12.7L over 12-hr shift 14.15 24.8 42.5 59.1 0.1 23 33.4 <115 32.5
15.30 25.4 44.9 60.6 0.6 20 34.4 <115 30.7
Processing
16/01/2014
08.45 21.3 31.5 38.9 2 40 25.8 255 24.3 Rectal temp of 38°C not exceeded
8.6L over 12-hr shift 11.00 23 36.6 48.3 1.9 31 29.4 175 26.9
13.00 23.2 39.9 51.8 1.7 23 30.6 145 28.4 15.00 23.9 41.9 56 1.5 21 32.1 <115 29
Shot firer 09.00 26.2 36 51 0.8 46 32.1 <115 29.2 Rectal temp of 38°C
exceeded at 66 minutes into the shift
12.9L over 12-hr shift 10.45 24.5 37.6 51.1 1 34 31.1 135 28.2
15.30 25.4 44.1 59.6 0.8 21 34.1 <115 30.2 WB - Wet bulb temperature, DB - Dry bulb temperature, GT - Globe temperature, AV - Air velocity, RH - Relative humidity, ET - Effective temperature, PHS - Predictive Heat Strain (Phase 1 - 390 minutes work, Phase 2 - 45 minutes lunch break, Phase 3 - 270 minutes work)

227
The PHS model indicated that workers would generally exceed rectal (core)
temperatures of 38°C after lunch break with at least 2.5 hours left to the end of
their shift during summer months. The estimated minimum water required to
maintain thermoregulation during this summer period was at least 8.6 litres over
the 12-hour shift. Participants all agreed that the working conditions during testing
in the summer months were hot (46.2%) to very hot (53.8%).
Each participant’s measure of USG, fluids consumed during the shift, average
number of heat strain symptoms experienced during a shift over the past one year,
maximum tympanic temperature and maximum pulse rate are presented in table 6-
8. Consumption of very large amounts of fluids, in excess of five litres (over eight
litres as predicted by the PHS) was required to maintain adequate hydration when
working in hot environments. Three participants exceeded the ISO7933 standard’s
maximum core body temperature limit of 38°C while two participants exceeded the
ACGIH guidelines for limiting heat strain as their pulse rates exceeded the
recommended guidelines.
Correlation of the maximum recorded tympanic temperature and the maximum
recorded pulse rate with potential risk factors are presented in tables 6-9 and 6-10.
Pre-shift hydration status was strongly correlated with the maximum tympanic
temperature (P <0.05).

228
Table 6-9: Participants’ measures of USG, fluids consumed, heat strain symptoms
and physiological monitoring parameters
Participant Age Pre-shift USG
Post-shift USG
Quantity of fluids consumed during shift (mL)
No. of heat strain symptoms
Max. tympanic temperature (°C)
Max. pulse rate (bpm)
1 36 1.027 1.028 5000 1 37.5 88 2 34 1.020 1.024 5000 1 38.4 124 3 58 1.018 1.023 2000 1 38.0 132* 4 36 1.013 1.019 6000 2 36.9 96 5 43 1.024 1.023 1500 0 37.5 90 6 57 1.025 1.026 1250 8 37.4 128* 7 23 1.029 1.033 2000 4 38.2 136 8 55 1.022 1.025 2000 7 37.6 100 9 44 1.027 1.032 1500 0 37.8 96
10 28 1.010 1.022 2750 4 36.6 84 11 25 1.021 1.022 3000 0 36.8 80 12 41 1.015 1.022 3000 2 36.8 84 13 23 1.021 1.024 4000 1 36.8 138
* Exceeds the ACGIH guidelines for limiting heat strain (180-Age)
Table 6-10: Correlation of maximum tympanic temperature with potential risk
factors
Risk factor Spearman’s correlation (rho) P-value
BMI 0.085 0.783
Pre-shift hydration status -0.693 0.009
Post-shift hydration status 0.158 0.606
Fluids consumed during shift -0.156 0.611
Heat strain symptoms 0.300 0.319

229
Table 6-11: Correlation of maximum pulse rate with potential risk factors
Risk factor Spearman’s correlation (rho) P-value
BMI 0.353 0.237
Pre-shift hydration status -0.444 0.125
Post-shift hydration status 0.171 0.578
Fluids consumed during shift -0.074 0.809
Heat strain symptoms 0.539 0.057
6.5 Discussion
The primary aim of this part of the study was to assess the thermal environment,
determine the potential for heat-related stressors and evaluate the potential heat
strain of high-risk workers, namely the shot firers and the processing personnel in a
surface mine located in a temperate climate. Studies on heat stress and heat strain
have been conducted on surface and underground mines in tropical climates (Miller
and Bates 2007, Peiffer and Abbiss 2013, Xiang et al. 2014), but no studies have
been conducted previously on surface mines in a temperate climate. The results of
this study suggest that heat stress and heat strain were evident in high-risk surface
mine workers, even in mine sites located in temperate climates, especially during
the summer months.
The average age of participants was 39 years reflecting the fact that a
predominantly middle-aged workforce participated in this part of the study. The
average BMI of participants was 30.3, thus categorising these participants as

230
predominantly overweight or obese. The BMI has some limitations for workers with
high muscle mass, but direct observations of participants did not indicate that this
was the case.
The USG measurements showed that participants predominantly started their shift
in a dehydrated state and remained dehydrated at the end of their shift (P <0.05).
Only 5 of the 13 participants started their shift in a hydrated state. At the end of the
shift, all participants except one were dehydrated, with two participants being
clinically dehydrated (USG > 1.030). The only participant who remained hydrated at
the end of the shift (Participant 4) started his shift in a hydrated state and
reportedly consumed 6000 mL of fluid, comprised mainly of water, which was
sufficient to keep him hydrated till the end of the shift, though he was close to
borderline dehydration. It is clear that employees working in hot environments
need to consume sufficient amounts of water and fluids to be able to stay hydrated
throughout their shift. Using the PHS model, it was estimated that up to 8600 mL of
fluids was required to maintain thermoregulatory balance while working in hot
environments in this mine site. The quantity of fluids required to be consumed also
depended on the pre-shift hydration status. For example, while Participant 10 had
the best pre-shift hydration status, he reportedly consumed only 2750 mL of fluids
during the 12-hour shift, which was insufficient to keep him hydrated over the
entire shift. Participant 2, who had consumed 5000 mL of fluids, was not able to
maintain his pre-shift hydrated status, as he was borderline hydrated at the start of
his shift. This relationship of pre-shift hydration status, fluids consumed during the

231
shift and post-shift hydration status is evident among the 13 participants (Table 6-
8), however no statistically significant association between the three variables was
demonstrated, possibly due to the small sample size in the study.
The pattern of pre-shift dehydration among high-risk employees working in hot
environments in this study is consistent with other studies done in mine sites in
tropical environments (Carter and Muller 2007, Miller and Bates 2007, Peiffer and
Abbiss 2013) and thus affirms that mine location climate plays no part in the
hydration practices of mine workers. Hence an intervention program targeting
these hydration practices can be utilised to improve the pre-shift hydration status
of mine workers. Such an intervention was trialled in this study and has been
discussed in chapter five.
Environmental monitoring at the first (baseline) monitoring period did not show any
risk to working in hot environment on the days tested. This was most likely due to
those testing days being overcast for most of the shift and thus negating the
contribution of solar radiation to the hot environment. Under such overcast
conditions, there was no restriction to working outside. The PHS model predicted
that an estimated average fluid consumption of 8.2 litres over the 12-hour shift
would be sufficient to maintain thermoregulatory balance in these overcast
conditions. The second (midpoint) monitoring period showed that working in winter
and spring time did not restrict any work outside and the PHS model predicted that
an estimated average fluid consumption of 5.5 litres over the 12-hour shift would
be sufficient to maintain thermoregulatory balance. The different estimates of

232
average fluid consumption between an overcast summer day and a winter or spring
day can be attributed to the higher globe temperatures in the summer days, which
would still cause fluid loss through sweating during thermoregulation. The third
(final) monitoring period was a true indication of the working conditions during a
peak summer period without any cloud cover. Several restrictions to work were
indicated by the TWL and the PHS especially following lunch break, that is, during
peak sun exposure between the hours of 1.30pm and 4.30pm (Table 6-7). The
estimated average fluid consumption during these working conditions was 10.6
litres over the 12-hour shift, that is, an average of about 900 mL per hour or an
estimated one (250 mL) cup of fluid every 15 minutes.
Heat strain symptoms were experienced by 10 out of the 13 participants in this
study. It is interesting to note that the highest number of heat strain symptoms was
experienced by the older workers aged 55 to 59 years, which affirms that age
influences the thermoregulatory capacity of the body, with older workers less able
to effectively adapt to the work environment. Incidentally, the maximum pulse
rates that exceeded the ACGIH guidelines were noted in the two oldest participants
in this study, with one of them reaching the critical core temperature of 38°C. Due
to the small sample size of this study, it is difficult to extrapolate any further than
the observations noted. These observations are consistent with research showing
that older adults are less able to efficiently maintain thermoregulation (Austin et al.
2008, Dang and Dowell 2014, Jehn et al. 2014, Parsons 2014).

233
During physiological monitoring of the participants during the third (final)
monitoring period, only three participants exceeded the core temperature of 38°C.
One of the three participants also exceeded the maximum pulse rate guidance
provided by the ACGIH. Correlating potential risk factors such as BMI, pre- and post-
shift USG, fluids consumed during the shift and heat strain symptoms, with the
maximum tympanic temperature and the maximum pulse rate showed that only the
pre-shift hydration status was statistically significantly correlated with maximum
tympanic temperature. This indicated that the pre-shift hydration status was the
most crucial determining risk factor for people working in hot environments and
who could potentially suffer a heat-related illness if they were dehydrated at the
start of their shift.
6.6 Limitations
The first limitation in this aspect of the study is the small sample size. This
prevented analysis of key associations between risk factors such as body mass index
and hydration status, and heat stress, heat strain and physiological parameters of
core body temperature and heart rate. Therefore, observations recorded in this
study cannot be generalised to any extent without further data. The second
limitation is the use of the tympanic membrane temperature as a surrogate for core
body temperature. Research has documented that there is up to 0.7°C difference
between the recorded tympanic membrane temperature and the core body
temperature (Huggins et al. 2012). This has a direct bearing on the data used in this
study as no correction factor was applied to approximate the tympanic membrane

234
temperature to core body temperature. This was not possible, as the actual core
temperature of a representative sample of participants would have been required
to calculate the exact correction factor to be applied to the tympanic temperature,
and this was beyond the scope of this study. The third limitation of this study is that
intermittent measurements of the core body temperature and heart rate were
done. A continuous measurement of these physiological parameters may have
highlighted specific tasks and times of the day when participants may have been at
an increased risk of heat strain. This data could have been used in designing a more
effective heat stress management plan.
6.7 Conclusion
The single most important finding of this study was that workers were starting their
shift in a dehydrated state, which predisposed them to reaching a critical core body
temperature of 38°C sooner than hydrated workers. This finding was strongly
correlated, though further studies with a larger sample size are required to verify
this finding. No other risk factor correlated with the core body temperature or the
pulse rate. This may also be due to the limited sample size in this study. Working in
hot environments requires optimal thermoregulation by the body to prevent the
onset of heat-related illnesses. Factors that interfere with this process include pre-
existing medical conditions such as diabetes and heart disease, lack of
acclimatisation and poor hydration status. Using the heat stress indices and
monitoring the core body temperature and the heart rate can help predict
potentially detrimental work condition thus preventing any heat-related illnesses.

235
6.8 References
ACGIH (2014). TLVs and BEIs, Threshold limit values for chemical substances and
physical agents & Biological exposure indices. Cincinnati.
Anderson, G. S. (1999). "Human morphology and temperature regulation." Int J
Biometeorol 43(3): 99-109.
Arbury, S., Jacklitsch, B., Farquah, O., Hodgson, M., Lamson, G., Martin, H. and
Profitt, A. (2014). "Heat illness and death among workers – United States, 2012-
2013." Morb Mortal Wkly Rep 63(31): 661-665.
Armstrong, L. E., Casa, D. J., Millard-Stafford, M., Moran, D. S., Pyne, S. W. and
Roberts, W. O. (2007). "Exertional heat illness during training and competition."
Medicine and Science in Sports and Exercise 39(3): 556-572.
Armstrong, L. E., Maresh, C. M., Castellani, J. W., Bergeron, M. F., Kenefick, R. W.,
LaGasse, K. E. and Riebe, D. (1994). "Urinary indices of hydration status." Int J Sport
Nutr 4(3): 265-279.
Armstrong, L. E., Pumerantz, A. C., Fiala, K. A., Roti, M. W., Kavouras, S. A., Casa, D.
J. and Maresh, C. M. (2010). "Human hydration indices: acute and longitudinal
reference values." Int J Sport Nutr Exerc Metab 20(2): 145-153.
Austin, A. W., Patterson, S., Heffner, K. and Suhr, J. (2008). "Relationship between
blood pressure, hydration and cognition in older adults." Annals of Behavioral
Medicine 35: S128-S128.

236
Bates, G. and Miller, V. (2002). "Empirical validation of a new heat stress index."
JOURNAL OF OCCUPATIONAL HEALTH AND SAFETY AUSTRALIA AND NEW ZEALAND
18(2): 145-154.
Bates, G. P. and Schneider, J. (2008). "Hydration status and physiological workload
of UAE construction workers: A prospective longitudinal observational study." J
Occup Med Toxicol 3: 21.
Bazille, C., Megarbane, B., Bensimhon, D., Lavergne-Slove, A., Baglin, A. C., Loirat, P.,
Woimant, F., Mikol, J. and Gray, F. (2005). "Brain damage after heat stroke." J
Neuropathol Exp Neurol 64(11): 970-975.
Bergeron, M. F. (2007). "Exertional heat cramps: recovery and return to play." J
Sport Rehabil 16(3): 190-196.
Brake, D. J. and Bates, G. P. (2003). "Fluid losses and hydration status of industrial
workers under thermal stress working extended shifts." Occup Environ Med 60(2):
90-96.
Brake, R. and Bates, G. (2002). "A valid method for comparing rational and empirical
heat stress indices." Ann Occup Hyg 46(2): 165-174.
Brown, P. L. and Kiyatkin, E. A. (2004). "Brain hyperthermia induced by MDMA
(ecstasy): modulation by environmental conditions." Eur J Neurosci 20(1): 51-58.
Budd, G. M. (2008). "Wet-bulb globe temperature (WBGT)--its history and its
limitations." J Sci Med Sport 11(1): 20-32.

237
Byrne, C. and Lim, C. L. (2007). "The ingestible telemetric body core temperature
sensor: a review of validity and exercise applications." Br J Sports Med 41(3): 126-
133.
Carrillo, A. E., Cheung, S. S. and Flouris, A. D. (2013). "Autonomic nervous system
modulation during accidental syncope induced by heat and orthostatic stress." Aviat
Space Environ Med 84(7): 722-725.
Carter, A. and Muller, R. (2007). "Hydration knowledge, behaviours and status of
staff at the residential camp of a fly-in/fly-out minerals extraction and processing
operation in tropical North-Eastern Australia." Ind Health 45(4): 579-589.
Carter, R., Cheuvront, S. N., Wray, D. W., Kolka, M. A., Stephenson, L. A. and Sawka,
M. N. (2005). "The influence of hydration status on heart rate variability after
exercise heat stress." Journal of Thermal Biology 30(7): 495-502.
Casa, D. J., Armstrong, L. E., Hillman, S. K., Montain, S. J., Reiff, R. V., Rich, B. S.,
Roberts, W. O. and Stone, J. A. (2000). "National athletic trainers' association
position statement: fluid replacement for athletes." J Athl Train 35(2): 212-224.
Casa, D. J., Becker, S. M., Ganio, M. S., Brown, C. M., Yeargin, S. W., Roti, M. W.,
Siegler, J., Blowers, J. A., Glaviano, N. R., Huggins, R. A., Armstrong, L. E. and
Maresh, C. M. (2007). "Validity of devices that assess body temperature during
outdoor exercise in the heat." J Athl Train 42(3): 333-342.
238
Chan, A. P. C., Yi, W., Chan, D. W. M. and Wong, D. P. (2013). "Using the Thermal
Work Limit as an Environmental Determinant of Heat Stress for Construction
Workers." Journal of Management in Engineering 29(4): 414-423.
Charkoudian, N. (2010). "Optimizing heat dissipation for every environment: the
cool ability of the skin to locally regulate sweating." J Appl Physiol (1985) 109(5):
1288-1289.
Cheung, S. S. and McLellan, T. M. (1998). "Influence of hydration status and fluid
replacement on heat tolerance while wearing NBC protective clothing." European
Journal of Applied Physiology and Occupational Physiology 77(1-2): 139-148.
Dang, B. N. and Dowell, C. H. (2014). "Factors associated with heat strain among
workers at an aluminum smelter in Texas." J Occup Environ Med 56(3): 313-318.
DiCorleto, R., Firth, I. and Mate, J. (2013) "A Guide to Managing Heat Stress:
Developed for Use in the Australian Environment.", AIOH.
Donoghue, A. M. (2004). "Occupational health hazards in mining: an overview."
Occup Med (Lond) 54(5): 283-289.
Donoghue, A. M. and Sinclair, M. J. (2000). "Miliaria rubra of the lower limbs in
underground miners." Occup Med (Lond) 50(6): 430-433.
Ekkekakis, P. and Lind, E. (2006). "Exercise does not feel the same when you are
overweight: the impact of self-selected and imposed intensity on affect and
exertion." Int J Obes (Lond) 30(4): 652-660.
239
Ellis, F. P., Walters, J. D. and Smith, F. E. (1972). "Measurement of Environmental
Warmth in Si Units." British Journal of Industrial Medicine 29(4): 361-&.
Gagnon, D., Lemire, B. B., Casa, D. J. and Kenny, G. P. (2010). "Cold-water immersion
and the treatment of hyperthermia: using 38.6 degrees C as a safe rectal
temperature cooling limit." J Athl Train 45(5): 439-444.
Gryglewska, B., Necki, M., Cwynar, M., Baron, T. and Grodzicki, T. (2010). "Local
heat stress and skin blood flowmotion in subjects with familial predisposition or
newly diagnosed hypertension." Blood Press 19(6): 366-372.
Hancock, P. A. (1986). "Sustained attention under thermal stress." Psychol Bull
99(2): 263-281.
Holman, N. D. and Schneider, A. J. (1989). "Multi-organ damage in exertional heat
stroke." Neth J Med 35(1-2): 38-43.
Houghton, F. C. and Yagloglou, C. P. (1923). "Determining equal comfort lines." J
ASHVE 29: 165-176.
Huggins, R., Glaviano, N., Negishi, N., Casa, D. J. and Hertel, J. (2012). "Comparison
of rectal and aural core body temperature thermometry in hyperthermic, exercising
individuals: a meta-analysis." J Athl Train 47(3): 329-338.
ISO7243 (1989). Hot Environments - Estimation of hte Heat Stress on Working Man,
based ont he WBGT index. Geneva, International Standards Organisation.

240
ISO7933 (2004). Ergonomics of the thermal environment -- Analytical determination
and interpretation of heat stress using calculation of the predicted heat strain.
Geneva, International Standards Organisation.
ISO9886 (2004). Ergonomics – Evaluation of thermal strain by physiological
measurement. Geneva, International Standards Organisation.
Jehn, M., Gebhardt, A., Liebers, U., Kiran, B., Scherer, D., Endlicher, W. and Witt, C.
(2014). "Heat stress is associated with reduced health status in pulmonary arterial
hypertension: a prospective study cohort." Lung 192(4): 619-624.
Kalkowsky, B. and Kampmann, B. (2006). "Physiological strain of miners at hot
working places in German Coal mines." Industrial Health 44(3): 465-473.
Kondo, N., Nishiyasu, T., Inoue, Y. and Koga, S. (2010). "Non-thermal modification of
heat-loss responses during exercise in humans." Eur J Appl Physiol 110(3): 447-458.
Levine, M., LoVecchio, F., Ruha, A. M., Chu, G. and Roque, P. (2012). "Influence of
drug use on morbidity and mortality in heatstroke." J Med Toxicol 8(3): 252-257.
Logan, P. W. and Bernard, T. E. (1999). "Heat stress and strain in an aluminum
smelter." Am Ind Hyg Assoc J 60(5): 659-665.
Malchaire, J., Piette, A., Kampmann, B., Mehnert, P., Gebhardt, H., Havenith, G.,
Den Hartog, E., Holmer, I., Parsons, K., Alfano, G. and Griefahn, B. (2001).
"Development and validation of the predicted heat strain model." Ann Occup Hyg
45(2): 123-135.

241
Maxfield, M. E. and Brouha, L. (1963). "Validity of heart rate as an indicator of
cardiac strain." Journal of Applied Physiology 18(6): 1099-1104.
McArdle, B., Dunham, W., Holling, H. E., Ladell, W. S. S., Scott, J. W., Thomson, M. L.
and Weiner, J. S. (1947). "The prediction of the physiological effects of warm and
hot environments." Med Res Council 47(391).
McMurray, R. G. and Katz, V. L. (1990). "Thermoregulation in pregnancy.
Implications for exercise." Sports Med 10(3): 146-158.
Miller, V. and Bates, G. (2007). "Hydration of outdoor workers in north-west
Australia." J Occup Health Safety 23(1): 79-87.
Miller, V. S. and Bates, G. P. (2007). "The thermal work limit is a simple reliable heat
index for the protection of workers in thermally stressful environments." Ann Occup
Hyg 51(6): 553-561.
Montain, S. J. and Coyle, E. F. (1992). "Fluid ingestion during exercise increases skin
blood flow independent of increases in blood volume." J Appl Physiol (1985) 73(3):
903-910.
Oppliger, R. A., Magnes, S. A., Popowski, L. A. and Gisolfi, C. V. (2005). "Accuracy of
urine specific gravity and osmolality as indicators of hydration status." Int J Sport
Nutr Exerc Metab 15(3): 236-251.
Parsons, K. (2014). Human thermal environments: the effects of hot, moderate, and
cold environments on human health, comfort, and performance, Crc Press.

242
Peiffer, J. J. and Abbiss, C. R. (2013). "Thermal Stress in North Western Australian
Iron Ore Mining Staff." Annals of Occupational Hygiene 57(4): 519-527.
Pisacane, V. L., Kuznetz, L. H., Logan, J. S., Clark, J. B. and Wissler, E. H. (2007).
"Thermoregulatory models of space shuttle and space station activities." Aviat
Space Environ Med 78(4 Suppl): A48-55.
Polkinghorne, B. G., Gopaldasani, V., Furber, S., Davies, B. and Flood, V. M. (2013).
"Hydration status of underground miners in a temperate Australian region." BMC
Public Health 13: 426.
Queensland (2001). Coal Mining Safety and Health Regulation. Queensland,
Australia.
Ruddock, A. D., Tew, G. A. and Purvis, A. J. (2014). "Reliability of intestinal
temperature using an ingestible telemetry pill system during exercise in a hot
environment." J Strength Cond Res 28(3): 861-869.
Rutkove, S. B., Veves, A., Mitsa, T., Nie, R., Fogerson, P. M., Garmirian, L. P. and
Nardin, R. A. (2009). "Impaired distal thermoregulation in diabetes and diabetic
polyneuropathy." Diabetes Care 32(4): 671-676.
Savastano, D. M., Gorbach, A. M., Eden, H. S., Brady, S. M., Reynolds, J. C. and
Yanovski, J. A. (2009). "Adiposity and human regional body temperature." Am J Clin
Nutr 90(5): 1124-1131.

243
Sawka, M. N., Latzka, W. A., Montain, S. J., Cadarette, B. S., Kolka, M. A., Kraning, K.
K., 2nd and Gonzalez, R. R. (2001). "Physiologic tolerance to uncompensable heat:
intermittent exercise, field vs laboratory." Med Sci Sports Exerc 33(3): 422-430.
Sawka, M. N., Montain, S. J. and Latzka, W. A. (2001). "Hydration effects on
thermoregulation and performance in the heat." Comp Biochem Physiol A Mol
Integr Physiol 128(4): 679-690.
Sawka, M. N., Young, A. J., Latzka, W. A., Neufer, P. D., Quigley, M. D. and Pandolf,
K. B. (1992). "Human tolerance to heat strain during exercise: influence of
hydration." J Appl Physiol (1985) 73(1): 368-375.
Scott, A. R., Bennett, T. and Macdonald, I. A. (1987). "Diabetes mellitus and
thermoregulation." Can J Physiol Pharmacol 65(6): 1365-1376.
Sokolnicki, L. A., Strom, N. A., Roberts, S. K., Kingsley-Berg, S. A., Basu, A. and
Charkoudian, N. (2009). "Skin blood flow and nitric oxide during body heating in
type 2 diabetes mellitus." J Appl Physiol (1985) 106(2): 566-570.
Stofan, J. R., Zachwieja, J. J., Horswill, C. A., Murray, R., Anderson, S. A. and Eichner,
E. R. (2005). "Sweat and sodium losses in NCAA football players: a precursor to heat
cramps?" Int J Sport Nutr Exerc Metab 15(6): 641-652.
Streffer, C. (1982). "Aspects of biochemical effects by hyperthermia." National
Cancer Institute monograph 61: 11-17.

244
Tillman, C. (2006). Principles of occupational health and hygiene: an introduction,
Allen & Unwin.
Wingo, J. E. and Cureton, K. J. (2006). "Body cooling attenuates the decrease in
maximal oxygen uptake associated with cardiovascular drift during heat stress." Eur
J Appl Physiol 98(1): 97-104.
Xiang, J., Bi, P., Pisaniello, D., Hansen, A. and Sullivan, T. (2014). "Association
between high temperature and work-related injuries in Adelaide, South Australia,
2001-2010." Occup Environ Med 71(4): 246-252.
Yaglou, C. P. and Minard, D. (1957). "Control of heat casualties at military training
centers." American Medical Association Archives of Industrial Health 16: 302-316.

245
CHAPTER 7– RELATIVE VALIDITY OF THE FOOD AND
FLUID FREQUENCY QUESTIONNAIRES
7.1 Introduction
With the ever increasing work demands and limited time available for employees to
effectively participate in health research, existing tools to assess dietary intake such
as food records (FR) and 24-hour recalls may be impractical as they can be
burdensome, costly, and time and resource intensive (Hedrick et al. 2010, Flood et
al. 2014). It is therefore important to find alternative tools that are practical, easily
applicable and quick to administer. Short concise questions regarding food and
beverage intake can be a useful assessment tool in this regard but they must reflect
accurate assessment of dietary intake (Gwynn et al. 2011, Flood et al. 2014). This
chapter explores the relative validity of a fruit and vegetable short food frequency
questionnaire and a fluid frequency questionnaire that aimed to capture fruit and
vegetable, and beverage intake of participants in this study, respectively, compared
with a 3-day FR.
7.2 Literature review
Frequency questionnaires that estimate the frequency and quantity of foods (Food
Frequency Questionnaire (FFQ)) and beverages (Beverage Intake Questionnaire
(BEVQ) and Fluid Frequency Questionnaire) consumed are quantitative tools that
use short questions (Mohammadifard et al. 2011). While they may appear
convenient to use, they are fraught with potential sources of error due to their

246
reliance on memory and thus should always be validated before widespread use
(Carlsen et al. 2011, Mohammadifard et al. 2011). The validity of an assessment tool
is the tool’s ability to precisely and accurately approximate what it intends to
measure (Masson et al. 2003). In order to assess the true validity of the Food and
Fluid Frequency Questionnaires in this study, it would require highly accurate
measurement of the food and fluid intakes of free-living individuals over several
months and this is not feasible. Therefore, assessment of relative validity by
comparing the Food and Fluid Frequency Questionnaire with an alternative dietary
assessment method such as the 3-day FR, which has its own limitations (Byers
2001), is a feasible way to estimate accuracy.
While accuracy is compromised in FFQs, the ability to rank individuals along the
distribution of intake into, for example, low, medium and high intake groups, helps
assess relative risk and odds ratio of a disease or condition in relation to dietary
intake (Masson et al. 2003). Food Frequency Questionnaires therefore have merit in
nutritional research especially when studying the link between lifestyle-related
chronic illnesses and poor dietary intakes (Barclay et al. 2008). Many FFQs that use
short questions to estimate the frequency and amount of foods such as fruit and
vegetables, and beverages consumed have been relatively validated by comparing
them with self-reported FR, 24-hour recalls or weighted food records (Barclay et al.
2008, Ambrosini et al. 2011, Barbieri et al. 2013). There is however, limited
validation of tools exclusively used to estimate fluid and beverage consumption

247
(Hedrick et al. 2010). The only exclusive tool that the author could find that
estimated fluid and beverage consumption was the BEVQ (Hedrick et al. 2010).
The BEVQ is a 19-item questionnaire developed to estimate mean daily intakes of
water, sugar-sweetened beverages (soft drinks, energy drinks and juices), alcohol
and other beverages (tea and coffee) and overall total beverage intake (Hedrick et
al. 2010). The questionnaire is essentially an FFQ that measures “How often” and
“How much each time” a beverage was consumed over the past month. The total
beverage consumed per day for each beverage can then be calculated by
multiplying the frequency by the quantity consumed. This questionnaire has been
validated in healthy adults, as compared with a 4-day food intake record and has
been shown to be a reliable estimate of habitual beverage consumption (Hedrick et
al. 2010).
The BEVQ was further reduced to a 15-item questionnaire to make the
questionnaire more usable among adults with lower literacy levels and to improve
the administration time of the questionnaire (Hedrick et al. 2012). The main
differences between the 19-item and the 15-item BEVQ is the removal of three
categories of beverages that did not contribute significantly to overall energy
consumption (vegetable juice, mixed alcoholic drinks and meal replacement drinks),
while beer and light beer were grouped together into one beverage category. The
revised questionnaire was revalidated, and had acceptable validity and reliability
when compared with the original 19-item BEVQ (Hedrick et al. 2012).

248
Rapid assessment of fluid and beverage consumption as a correlate of hydration
status is useful in mitigating the effects of heat stress and heat-related illness by
providing workers with information on adequacy of fluid consumption. In addition
to dehydration, being overweight or obese exacerbates the effects of heat stress
and heat-related illness, as the excess body fat acts as a thermal insulator trapping
heat within the body (Savastano et al. 2009). Hence, adequate water consumption
and good dietary habits are indispensably essential in these workers, as well as
nutritional assessment tools that can effectively and accurately measure their
regular intake of foods and fluids. Given the acute nature of dehydration and how
easily it can be corrected, it is more useful to have a rapid assessment tool for fluid
consumption. The paucity of fluid/beverage frequency questionnaires and their
validation stifles research into this area. Most validated FFQs do incorporate some
questions that estimate certain fluids and beverages as part of an overall nutritional
assessment but these essentially tend to cover alcohol and soft drinks for adults and
milk, soft drink and fruit juices for children (Ambrosini et al. 2011, Flood et al. 2014,
Sam et al. 2014). Moreover, these FFQs take time to administer and are thus not
suitable for rapid assessment of fluid and beverage consumption in a population
that is pressed for time, such as the workers in this study. The BEVQ is thus a quick
method to assess usual fluid intake in these workers. A Fluid Frequency
Questionnaire based on the 15-item BEVQ was developed and validated to measure
fluid/beverage intake among this study cohort.

249
The short FFQ on fruit and vegetable consumption has been used in state health
monitoring (NSW Health 2012) and has previously been validated in young children
(Flood et al. 2014). The fruit and vegetable questions from this short FFQ were used
without any modification. However validation in adults was required and this was
undertaken in this study cohort.
The aim was to determine the relative validity of short questions related to fruit and
vegetable consumption, and fluid/beverage consumption, compared with a 3-day
FR, as well as the applicability of the questionnaire to the men and women working
in the mining industry.
7.3 Methodology
7.3.1 Design
The BEVQ was used as the template to develop the fluid frequency questionnaire,
as this was the only tool that had been exclusively designed to estimate
fluid/beverage intake. Further inspiration in the development of the questionnaire
was taken from a validation study of short FFQ (fluid/beverage consumption
questions only) for assessing dietary habits of two-to-five year-old children that was
being finalised at the time of the study (Flood et al. 2014). To further simplify the
questionnaire and to aid in rapid administration, the quantity section of the original
BEVQ was removed and a single “Amount” column created by standardising each
beverage quantity using Australian metrics, such as cup (250mL), can (375mL),
bottle (600mL), bottle (500mL for iced tea only), stubbie/schooner (375mL), wine
glass (150mL) and nip/shot (30mL). This meant that only frequencies needed to be

250
ticked in the questionnaire. The total amount consumed for each beverage was
then calculated by multiplying the standard amount for each beverage category by
the frequency. The fruit and vegetable questions of the short FFQ from the study of
Flood et al. (2014) were used without any further development or modification. The
total amount of fruit and vegetables consumed was calculated in serves per day, as
stated by participants, or as serves per week divided by seven days to obtain the
amount in serves per day.
7.3.2 Participants
Participants included men and women recruited into the overall study and who
completed the fruit and vegetable FFQ, the Fluid Frequency Questionnaire and the
FR at the baseline or the final data collection process. As this part of the study
assessed the validity of the fruit and vegetable FFQ and the Fluid Frequency
Questionnaire, duplicate entries (entries were one year apart) were also analysed
provided an FR was also completed by the participant at each time point. Forty-six
participants completed the short FFQ on fruit and vegetable consumption, the Fluid
Frequency Questionnaire and the 3-day FR. Of these 46 participants, eight
participants had data that was considered implausible, as their recorded energy
intake from their FR was below their calculated BMR and were thus excluded from
the final analysis. One participant did not provide his age, which was required to
calculate his BMR using the Schofield equation, and was thus also excluded from
the final analysis. A total of 37 participants remained. The mean age of these 37
participants was 44 years (range 22-64 years) and the mean BMI was 29 kg/m2

251
(range 22-39 kg/m2). Anthropometric measures such as the weight, height and body
mass index were taken, as described in section 4.3.3.2 above. All participants’ fruit
and vegetable FFQ, the Fluid Frequency Questionnaires and FRs were de-identified
and coded to ensure anonymity.
7.3.3 Food and Fluid Frequency Questionnaire
There were two FFQ short questions on fruit and vegetables that were used from
the validation study of Flood et al. (2014) in children. The Fluid Frequency
Questionnaire was developed into a 21-item short questions survey that estimated
beverage intake among the miners. Beverage categories were expanded to get a
more detailed fluid consumption profile by including common beverages consumed
in Australia such as flavoured milk, iced tea and cordial. Beers were not grouped
together like the BEVQ and were separated into full strength, mid-strength and light
beer (Appendix 11). All data from the fruit and vegetable FFQ, and the Fluid
Frequency Questionnaire were collated and intake was averaged per day.
7.3.4 3-day Food Records
A 3-day FR was used as the reference comparison method for validating the fruit
and vegetable FFQ and the Fluid Frequency Questionnaire. The FR contained
detailed instructions on recording everything the participants consumed (both food
and beverages) on two weekdays and one weekend day. The FR also included a
sample recording for one day (Appendix 6). All data from the FR were entered into
the FoodWorks Nutrition Software Version 7 (Xyris Software (Australia) Pty Ltd)
using the AUSNUT 2007 database (Food Standards Australia and New Zealand) to

252
collate information on the average energy and nutrient intake (including fluid) of
each participant for the three days that were recorded. A Microsoft Excel 2010
database was created and used to document all nutrition decisions regarding the FR
if food items in the FoodWorks software did not directly correlate with an item
recorded by participants. This decision tool was then used throughout the data
entry process for all similar FR entries into the FoodWorks software (Appendix 20).
This ensured consistency throughout the data entry process. The completed
FoodWorks data was then exported into Microsoft Access 2010 for Windows, from
which serves of fruit and vegetables, and millilitres of fluids could be calculated for
comparison with the fruit and vegetable FFQ and the Fluid Frequency
Questionnaire.
7.3.5 Statistical analysis
The FoodWorks software was used to analyse the Basal Metabolic Rate (BMR) of
participants using the Schofield equation factoring in the participants’ age, weight,
height and gender (Schofield 1985). Average daily intakes of fruit, vegetables and
fluids were obtained from the fruit and vegetable FFQ, the Fluid Frequency
Questionnaire and the FR. For simplicity in analysis, the 21 beverages in the Fluid
Frequency Questionnaire were grouped into four categories: Water, Alcoholic
beverages, Non-alcoholic beverages and Total Fluids. Further data analysis was
performed using the IBM Statistical Package for the Social Sciences (IBM SPSS)
version 19.0 for Windows. Common statistical tests used to validate FFQs and other

253
nutritional assessment tools were identified and used. A brief description of these
statistical tests follows.
7.3.5.1 Paired sample t-test
The paired sample t-test was used to compare mean intakes of fruit, vegetables and
fluids between the fruit and vegetable FFQ, the Fluid Frequency Questionnaire and
the FR. This was one of the methods used to validate the fruit and vegetable FFQ
and the BEVQ when intakes were compared across the fruit and vegetable FFQ and
the BEVQ with the FR (Hedrick et al. 2010, Flood et al. 2014). While the paired
sample t-test is the simplest comparison between the fruit and vegetable FFQ, the
Fluid Frequency Questionnaire and the FR, the distribution was not normal and thus
non-parametric tests, such as the Spearman rank correlation, was also
appropriately used (Johansson 2006).
7.3.5.2 Spearman rank correlation
The Spearman rank correlation was used to assess the magnitude and direction of
the relationship between the fruit and vegetable FFQ, the Fluid Frequency
Questionnaire data and the FR data. This is one of the preferred approaches to
statistically assess the relative validity, especially as data are continuous (Masson et
al. 2003). However, the Spearman rank correlation assesses the spatial relationship
with only one aspect of the agreement that relates to ranking (Johansson 2006). It
does not provide any meaningful information on the agreement between the two
assessment tools, especially with regard to bias (Bland and Altman 1986). It is

254
therefore more appropriate to use the Spearman correlation in conjunction with
the Bland-Altman method (Cade et al. 2004, Flood et al. 2004).
7.3.5.3 Bland-Altman analysis
The Bland-Altman analysis measures only the level of agreement between the fruit
and vegetable FFQ, the Fluid Frequency Questionnaire and the FR and makes no
assumptions of which is the better method (Bland and Altman 1986), though it
would be customary to assume the more detailed dietary assessment method is
more likely to be accurate than the short FFQ (Cade et al. 2004). The analysis
involves plotting the difference against the mean of both pairs of observations on a
scatter plot. A regression line is then fitted to show the dependency between the
fruit and vegetable FFQ, the Fluid Frequency Questionnaire and the FR. For perfect
agreement between the two methods (i.e. equal variability with no systematic bias),
the correlation of the differences would equal zero (i.e. as mean intake increases
the two methods do not differ in their results). The β coefficient for the regression
equation (Difference = α + βx) with 95% CI was used to assess the degree to which
the fruit and vegetable FFQ and the Fluid Frequency Questionnaire may have under-
or over-estimated intake compared with the FR (i.e. measuring the non-significant
linear trend). The limits of agreement (LoA) represent the limits in which 95% of the
differences between the two methods are expected to lie in a particular population
(Bland and Altman 1986). These are calculated as follows:
Upper LoA = d + (2 x Sdiff)
Lower LoA = d - (2 x Sdiff)

255
where d = Mean of Difference and Sdiff = Standard deviation of the difference
However, of important note is how these ‘Mean of Difference’ and ‘limits of
agreement’ describe the study population, and this is obtained by estimating the
95% confidence intervals of these statistics (Carkeet 2015). These were calculated
using the following formula:
For 95% Confidence Interval of Mean of Difference (d):
d ± t0.975, n-1 (Sdiff / √n)
For 95% Confidence Interval of limits of agreement (LoA):
Upper LoA ± t0.975, n-1 √2.92(Sdiff / √n)
Lower LoA ± t0.975, n-1 √2.92(Sdiff / √n)
Rather than relying on set cut-points, agreement between the two methods is left
open to interpretation by the investigator on which is the better method (Carkeet
2015). If the difference between the two methods is not of significant or clinical
importance then these two methods may be used interchangeably to measure the
same quantity (Carkeet 2015).

256
7.4 Results
7.4.1 Validity of the short Fruit and Vegetable questions of the FFQ
Table 7-1 shows the mean and median intakes for both fruit and vegetables for the
FFQ and the 3-day average from the FR with paired t-test and Spearman’s rank
correlation coefficients. The paired t-test showed that there was a significant
difference in mean intake of vegetables between the two assessment methods.
Vegetable intake had a moderate negative significant correlation (-0.508, P<0.001)
between the FFQ and the FR while fruit intake had a non-significant correlation. This
would suggest that vegetable intake in the FFQ was underestimated or more likely
that the vegetable consumption in the FR was over-reported as shown in figure 7-1
above. This is confirmed in the Bland-Altman plots (Figure 7-1B). With regard to
vegetable consumption, the FFQ could potentially overestimate by up to two serves
while grossly underestimating it by seven serves. With regard to fruit consumption,
there is poorer agreement between the FFQ and the FR, as the serves of fruit
increases (Figure 7-1A). The FFQ could potentially overestimate by three serves and
underestimate it by two serves.

257
Table 7-1: Comparison of mean and median fruit and vegetables intakes, mean difference and Spearman’s rank correlation between the FFQ
and the FR (N = 37)
Food Frequency Questionnaire 3-day Food Record Mean
Difference
Standard Error of Mean
Paired t-test Spearman's
rank correlation Mean Median Mean Median
Fruit (serves/day) 1.8 1.5 1.4 1.0 0.4 0.2 P = 0.060 0.265
Vegetables (serves/day) 1.8 2.0 4.4 4.0 -2.6 0.4 P < 0.001 -0.508*
*P<0.001

258
Figure 7-1: Bland Altman plot assessing the validity of the Food Frequency Questionnaire (FFQ) and the 3-day FR. (A) Fruit intake (N = 37). Plot shows the Mean of difference 0.4 serves (CI: 0.0, 0.8), Upper level of agreement (LoA) 3.1 serves (CI: 2.4, 3.9), Lower level of agreement (LoA) -2.3 serves (CI: -3.0, -1.5) and the Regression line (equation: y = -0.233 + 0.417x). (B) Vegetables intake (N = 37). Plot shows the Mean of difference -2.6 serves (CI: -1.9, -3.4), Upper level of agreement (LoA) 1.8 serves (CI: 0.5, 3.1), Lower level of agreement (LoA) -7.0 serves (CI: -8.3, -6.0) and the Regression line (equation: y = 0.378 - 0.965x).
-3.00
-2.00
-1.00
0.00
1.00
2.00
3.00
4.00
5.00
0.00 0.50 1.00 1.50 2.00 2.50 3.00 3.50 4.00
Diffe
renc
e in
Fru
it In
take
[FFQ
-FR
]
Mean Fruit Intake [(FFQ+FR)/2)]
A
Upper LoA Mean of difference Lower LoA Regression Line
-10.00
-8.00
-6.00
-4.00
-2.00
0.00
2.00
4.00
0.00 1.00 2.00 3.00 4.00 5.00 6.00
Diffe
renc
e in
Veg
etab
les
Inta
ke [F
FQ -
FR]
Mean Vegetables Intake [(FFQ+FR)/2]
B
Upper LoA Mean of difference Lower LoA Regression Line

259
7.4.2 Validity of the Fluid Frequency Questionnaire
Table 7-2 shows the mean and median intakes across all beverages grouped into
water, alcoholic, non-alcoholic and total fluids for the Fluid Frequency
Questionnaire and the average of the 3-day FR. The table also reports the calculated
t-test and the Spearman’s rank correlation coefficients. According to the paired t-
test, there was no significant difference in the mean intake of fluids (mL/day) for all
beverages (P > 0.05) between the two assessment methods. Estimates of fluid
intakes were higher for the Fluid Frequency Questionnaire for alcoholic, non-
alcoholic and total fluids than for the 3-day FR but lower for water in the Fluid
Frequency Questionnaire than the 3-day FR (but not significant). In addition,
Alcoholic showed the least variance between the two methods based on the mean
difference between the Fluid Frequency Questionnaire and the FR (a difference of
106 mL). Among the beverage categories, only water and alcoholic showed
significant correlation between methods (0.441 and 0.590 respectively), while total
fluids and non-alcoholic beverages showed a non-significant weak correlation
(0.111 and 0.218 respectively) between the Fluid Frequency Questionnaire and 3-
day FR data. Hence water and alcoholic both showed moderate correlation while
total fluids and non-alcoholic beverages showed weak correlations between the two
methods (Dancey and Reidy 2007).
Furthermore, the Fluid Frequency Questionnaire underestimated water
consumption by up to 1,994 mL per day and overestimated it by up to 1,612 mL per
day in 95% of the study population. With regard to alcohol consumption, the Fluid

260
Frequency Questionnaire underestimated consumption by 830 mL per day and
overestimated consumption by 1,042 mL per day. With regard to non-alcoholic
beverages, the Fluid Frequency Questionnaire underestimated consumption by
1,909 mL per day and overestimated consumption by 2,214 mL per day. And with
regard to total fluids consumption, the Fluid Frequency Questionnaire
underestimated consumption by 2,065 mL per day and overestimated consumption
by 2,582 mL per day.
The Bland Altman plots generally showed a tendency towards poor agreement
between the Fluid Frequency Questionnaire and the 3-day FR for all beverage
categories, except non-alcoholic beverages, and total fluid intake (Figures 7-2 to 7-
5). In general, larger β coefficients are indicative of poorer agreement with
increasing level of intakes. With regard to non-alcoholic and total fluid intake, the β
coefficients (-0.101 and 0.012) indicates no significant bias between the two
methods with increasing intakes; while for water intake, the β coefficient obtained
from the regression line (-0.418 and significant 95% CI (-0.940, -0.137) around the β
coefficient) indicate a statistically significant bias between the two methods of
measurement (P<0.001) with increasing intake of water (Figure 7-2). The same
observations cannot be made for alcoholic intake due to the positively skewed data,
as many participants did not consume alcoholic beverages. This was true even after
log transformation of the raw data (Figure 7-4).

261
Table 7-2: Comparison of mean and median fluid intakes between the Fluid Frequency Questionnaire and the 3-day Food Record (N = 37)
Beverage category (mL/day)
Fluid Frequency Questionnaire 3-day Food Record
Mean Difference
Standard Error of Mean
Paired t-test Spearman's
rank correlation
Mean Median Mean Median
Water 825.30 500.00 1016.00 800.00 -190.70 148.20 P = 0.322 0.441**
Non-Alcoholic 2143.41 1974.00 1990.97 1792.00 152.44 169.44 P = 0.374 0.218
Alcoholic 382.48 246.14 276.54 0 105.94 76.93 P = 0.177 0.590***
Total Fluids 2525.88 2387.00 2267.51 2117.00 258.37 190.97 P = 0.185 0.111
*P < 0.05 **P < 0.01 ***P < 0.001

262
Figure 7-2: Bland Altman plot assessing the validity of the Fluid Frequency
Questionnaire (FluFQ) and the 3-day FR for Water intake (N = 37). Plot shows the
Mean of difference -190.70 mL (CI: -490.22, 108.82), Upper level of agreement
(LoA) 1612.25 mL (CI: 1100.44, 2124.06), Lower level of agreement (LoA) -1993.65
mL (CI: -2505.46, -1481.84) and the Regression line (equation: y = 525.4 – 0.418x (CI
for regression line -0.940, -0.137)).
-2550
-2050
-1550
-1050
-550
-50
450
950
1450
1950
-50 450 950 1450 1950 2450
Diffe
renc
e in
wat
er in
take
[Flu
FQ -
FR]
Mean water intake [(FluFQ + FR)/2]
Upper LoA Mean of difference Lower LoA Regression line

263
Figure 7-3: Bland Altman plot assessing the validity of the Fluid Frequency
Questionnaire (FluFQ) and the 3-day FR for Non-alcoholic beverage intake (N = 37).
Plot shows the Mean of difference 152.43 mL (CI: -190, 494.87), Upper level of
agreement (LoA) 2213.74 mL (CI: 1628.59, 2798.89), Lower level of agreement (LoA)
-1908.87 mL (CI: -2494.02, -1323.72) and the Regression line (equation: y = 457.31 –
0.101x (CI for regression line -0.645, 0.350)).
-3000
-2000
-1000
0
1000
2000
3000
0 500 1000 1500 2000 2500 3000 3500 4000 4500
Diffe
renc
e in
Non
-alc
ohol
ic in
take
[Flu
FQ -
FR]
Mean Non-alcoholic intake [(FluFQ + FR)/2]
Upper LoA Mean of difference Lower LoA Regression line

264
Figure 7-4: Bland Altman plot assessing the validity of the Fluid Frequency Questionnaire (FluFQ) and the 3-day FR for Alcoholic beverage
intake (N = 37) using raw data (A) and log transformed data (B). Plot (A) shows the Mean of difference 105.94 mL (CI: -49.54, 261.42), Upper
level of agreement (LoA) 1041.86 mL (CI: 776.17, 1307.54), Lower level of agreement (LoA) -829.98 mL (CI: -1095.66, -564.30) and the
Regression line (equation: y = 143.60 – 0.114x). Plot (B) shows the plots for log transformed data to show any relationship in the data more
clearly.
-1500
-1000
-500
0
500
1000
1500
2000
2500
0 500 1000 1500 2000 2500Diffe
renc
e in
Alc
ohol
inta
ke [F
luFQ
-FR
]
Mean Alcohol intake [(FluFQ + FR)/2]
A
Upper LoA Mean of difference
Lower LoA Regression line
-2
-1
0
1
2
3
4.5 5 5.5 6 6.5 7 7.5 8Diffe
renc
e in
Alc
ohol
inta
ke a
fter
log
tran
sfor
mat
ion
[Flu
FQ -
FR]
Mean Alcohol intake after log transformation of data [(FluFQ + FR)/2]
B
Upper LoA Mean of difference
Lower LoA Regression line

265
Figure 7-5: Bland Altman plot assessing the validity of the Fluid Frequency
Questionnaire (FluFQ) and the 3-day FR for Total fluid intake (N = 37). Plot shows
the Mean of difference 258.38 mL (CI: -127.57, 644.33), Upper level of agreement
(LoA) 2581.62 mL (CI: 1922.11, 3241.13), Lower level of agreement (LoA) -2064.87
mL (CI: -2724.38, -1405.36) and the Regression line (equation: y = 211.876 + 0.012x
(CI for regression line -0.520, 0.559)).
-2750
-1750
-750
250
1250
2250
3250
1000 1500 2000 2500 3000 3500 4000 4500
Diffe
renc
e in
Tot
al fl
uids
inta
ke [F
luFQ
-FR
]
Mean Total fluids intake [(FluFQ + FR)/2]
Upper LoA Mean of difference Lower LoA Regression line

266
7.5 Discussion
There was a significant negative correlation for vegetables consumption between
the FFQ and the FR (r= -0.508). This is due to the over-reporting of vegetables
consumption in the FR and underreporting in the short FFQ by participants (Figure
4-4 and Table 7-1). This could possibly explain why the result in this study is
different from a study conducted among Finnish adults that showed non-significant
correlations for fruit and vegetables consumption between FFQ and FR (r = 0.53 and
0.44 respectively) (Paalanen et al. 2006). A study among Spanish adults also showed
non-significant correlations for fruit and vegetables consumption between the FFQ
and the FR (r = 0.57 and 0.70 respectively) (Fernández-Ballart et al. 2010). Another
study by Flood et al. (2014) found significant correlations for both fruit and
vegetables consumption between the FFQ and the FR (r = 0.52 and 0.55
respectively). However, it is important to note that the study of Flood et al. (2014)
was conducted among two-to-five year-old preschool children from parent- and
teacher-reported intake. The wide variability in correlation between FFQ and FR for
different populations and different age groups suggests that both the FFQ and the
FR varies by age, gender, population and possibly even subsets of population such
as the workers in this study. In addition, the FFQ overestimation of fruits intake by
up to three serves per day and the underestimation of vegetables intake by up to
seven serves per day potentially could misclassify the participants as being
compliant with the Australian Dietary Guidelines and the Australian Guide to
Healthy Eating of two serves of fruit and five serves of vegetables per day (NHMRC
2013a and 2013b). This is comparable to the study of Hebden et al. (2013) who

267
found that the FFQ underestimated by an average of 4.9 serves of fruit and
vegetables per day in 95% of their sample. Therefore, use and interpretation of the
FFQ data on fruit, and especially vegetable intake should be done with caution.
The methodology for measuring fluid intake in population studies remains
controversial due to the paucity of research on standardised questionnaires that
measure beverage intake, and also due to a lack of validation studies for existing
questionnaires (Nissensohn, et al. 2015). This study investigated the relative validity
of a quantitative Fluid Frequency Questionnaire compared with a 3-day FR in a
sample of adults working in the mining industry. A range of beverages, categorised
into four major consumption groups, was assessed. There were no significant
differences in the mean consumption of beverages between the two measurement
methods, suggesting that the Fluid Frequency Questionnaire can be used to
quantify mean beverage consumption overall. Water and Alcohol consumption
were significantly correlated (r = 0.44 (P < 0.01) and r = 0.59 (P < 0.001)
respectively) but were not well represented in terms of absolute quantity of intake
as indicated by the LoA. The correlation coefficient reported in this study for water
consumption is well below the r = 0.69 reported in an earlier validity study of the
Beverage Frequency Questionnaire (BEVQ) (Hedrick et al. 2010). However, it is
higher than the correlation coefficient of r = 0.35 reported in a study that utilised
the same questioning methodology for water intake in their questionnaire i.e.
restricting quantity to standard cups (Flood et al. 2014).

268
When comparing the reported fluid intakes between the two methods, the Fluid
Frequency Questionnaire has a higher reported intake than the 3-day FR for all
categories except water. This is likely due to the upper limit set for water
consumption in the Fluid Frequency Questionnaire. For instance, the highest level
of water intake that could be recorded in the Fluid Frequency Questionnaire is “6+
cups” which translates to 1.5 litres (6 x 250 mL cup) of water per day. Some
participants were recording water intakes far in excess of this amount in their 3-day
FR, which would limit the ability of the Fluid Frequency Questionnaire to accurately
assess water consumption. This was not a problem in the BEVQ as this
measurement tool did not restrict its beverage quantity intakes to a single cup, but
rather had 2.5 cups as its highest intake each time (Hedrick et al. 2010).
With regard to alcoholic beverages intake, the data was positively skewed as many
participants reported zero alcoholic beverages consumption on the days that they
recorded their 3-day FR when compared to the Fluid Frequency Questionnaire. This
is similar to a study done by Hebden et al. (2013) and presents some difficulty when
analysing such data. In such a case, the Fluid Frequency Questionnaire may be a
more accurate estimate of alcoholic beverages consumption than the 3-day FR.
Using log transformation to show any linear trends did not reveal any useful
information. This may be due to the fact that participants completed their 3-day FR
on days when “occasional drinkers” did not consume any alcoholic beverages. It is
therefore difficult to draw any meaningful conclusions regarding alcoholic
beverages intake between the two measurement methods.

269
As an overall fluid intake assessment tool, the reported total fluid intake in the Fluid
Frequency Questionnaire has a high level of agreement with that reported in the 3-
day FR. This is most likely to be a group level effect and thus conclusions at the
individual level cannot be made with any certainty. Another possible reason for this
may be that participants had been previously advised about their blood pressure
levels, their blood glucose levels and their hydration status prior to completing the
Fluid Frequency Questionnaire and the 3-day FR, which may have prompted an
overestimation of fluids consumed in their Fluid Frequency Questionnaire and an
increased intake when recording their 3-day FR. Nonetheless, the Fluid Frequency
Questionnaire appears to be a useful tool to study progressive trends in fluid intake
in a population group such as workers in the mining industry, particularly with
regard to planning an intervention.
Staying hydrated through adequate water consumption among workers in the
mining industry has workplace health implications, particularly for those working in
hot, humid environments (Polkinghorne et al. 2013). Having a validated tool that
can be quickly administered on site can be useful for Workplace Health and Safety
professionals in assessing habitual fluid consumption patterns among workers,
particularly with respect to intervention programs designed to improve hydration
status.
7.6 Limitations
A number of limitations are present in this study. For relative validity testing, the 3-
day FR was used as the reference standard, which has its own limitations and

270
sources of error (Carlsen et al. 2011). The exclusion criteria for implausible FR
entries did not account for an activity factor that should be used depending on the
physical activity of the miners, hence only the BMR was used as a cut-off point.
There were two reasons for this: first, there was a large discrepancy between the
self-reported physical activity levels from the questionnaire and the physical activity
level onsite suggesting over-reporting, and second, using the lowest physical activity
level of 1.4 (sedentary) excluded 80% of participants’ food records due to
underreporting across the sample for the FR thus considerably reducing the sample
size. Thus participants whose total energy intake (derived from the FR entries) fell
below their calculated BMR (from the Schofield equation) were excluded from the
final data analysis. Underreporting intakes is a phenomenon not uncommon among
overweight and obese participants (Bandini et al. 1990). Participants also over-
reported consumption of vegetables which skewed the validation statistics when
comparing the FFQ with the FR. Participants in this study worked both day and night
shifts, which would have affected their ability to adequately quantify and record
their intakes as the different shift times would dictate their intake patterns. Due to
the work demands placed on workers in the mining industry, participants may only
have time to quickly eat and drink in the short breaks thus postponing the FR
entries until they had more time. This would potentially introduce a recall bias,
especially if they didn’t remember to record it until the following day. Lastly it is
quite possible that the Fluid Frequency Questionnaire underestimated certain
beverage categories; particularly water, by creating an upper ceiling limit on
quantity in the response categories (6+ cups per day).

271
7.7 Conclusion
The fruit and vegetables short questions of the FFQ should be used and interpreted
with caution in a mining cohort, given the over-reporting of vegetables in the FR.
The Fluid Frequency Questionnaire, on the other hand is a practical, easily
applicable and quick to administer tool to measure fluid intake in the workplace. It
may also be a useful tool for researchers assessing fluid intake in large populations
and for assessing changes in fluid intake patterns following an intervention. This
study on the relative validity of the Fluid Frequency Questionnaire shows that there
is a tendency towards poor agreement with the 3-day FR for all beverage
categories, except non-alcoholic beverages and total fluid intake. The Fluid
Frequency Questionnaire may thus be used to assess overall fluid consumption, and
progressively track changes in selected patterns of fluid consumption, particularly
as a result of an intervention program focusing on fluid intake. With further
refinement of the Fluid Frequency Questionnaire, such as removing a ceiling limit
on water consumption, it may be possible to assess water consumption and thus
indirectly assess hydration status of workers. This would however require further
validation after refinement of the tool. Interpretation of the results of this validity
study must be with caution, given the limitations of this study. More validation
studies are required to assess questionnaires designed to estimate beverage
consumption only so as to get closer to developing a standardised and validated
tool for measuring beverage consumption.

272
7.8 References
Ambrosini, G. L., O'Sullivan, T. A., de Klerk, N. H., Mori, T. A., Beilin, L. J. and Oddy,
W. H. (2011). "Relative validity of adolescent dietary patterns: a comparison of a
FFQ and 3 d food record." Br J Nutr 105(4): 625-633.
Bandini, L. G., Schoeller, D. A., Cyr, H. N. and Dietz, W. H. (1990). "Validity of
reported energy intake in obese and nonobese adolescents." Am J Clin Nutr 52(3):
421-425.
Barbieri, P., Nishimura, R. Y., Crivellenti, L. C. and Sartorelli, D. S. (2013). "Relative
validation of a quantitative FFQ for use in Brazilian pregnant women." Public Health
Nutr 16(8): 1419-1426.
Barclay, A. W., Flood, V. M., Brand-Miller, J. C. and Mitchell, P. (2008). "Validity of
carbohydrate, glycaemic index and glycaemic load data obtained using a semi-
quantitative food-frequency questionnaire." Public Health Nutr 11(6): 573-580.
Bland, J. M. and Altman, D. G. (1986). "Statistical methods for assessing agreement
between two methods of clinical measurement." Lancet 1(8476): 307-310.
Byers, T. (2001). "Food frequency dietary assessment: how bad is good enough?"
Am J Epidemiol 154(12): 1087-1088.
Cade, J. E., Burley, V. J., Warm, D. L., Thompson, R. L. and Margetts, B. M. (2004).
"Food-frequency questionnaires: a review of their design, validation and
utilisation." Nutr Res Rev 17(1): 5-22.

273
Carkeet, A. (2015). "Exact parametric confidence intervals for bland-altman limits of
agreement." Optom Vis Sci 92(3): e71-80.
Carlsen, M. H., Karlsen, A., Lillegaard, I. T., Gran, J. M., Drevon, C. A., Blomhoff, R.
and Andersen, L. F. (2011). "Relative validity of fruit and vegetable intake estimated
from an FFQ, using carotenoid and flavonoid biomarkers and the method of triads."
Br J Nutr 105(10): 1530-1538.
Dancey, C. P. and Reidy, J. (2007). Statistics without maths for psychology, Pearson
Education.
Fernández-Ballart, J. D., Piñol, J. L., Zazpe, I., Corella, D., Carrasco, P., Toledo, E.,
Perez-Bauer, M., Martínez-González, M. Á., Salas-Salvadó, J. and Martín-Moreno, J.
M. (2010). "Relative validity of a semi-quantitative food-frequency questionnaire in
an elderly Mediterranean population of Spain." British journal of nutrition 103(12):
1808-1816.
Flood, V. M., Smith, W. T., Webb, K. L. and Mitchell, P. (2004). "Issues in assessing
the validity of nutrient data obtained from a food-frequency questionnaire: folate
and vitamin B12 examples." Public Health Nutr 7(6): 751-756.
Flood, V. M., Wen, L. M., Hardy, L. L., Rissel, C., Simpson, J. M. and Baur, L. A. (2014).
"Reliability and validity of a short FFQ for assessing the dietary habits of 2-5-year-
old children, Sydney, Australia." Public Health Nutr 17(3): 498-509.
Gwynn, J. D., Flood, V. M., D'Este, C. A., Attia, J. R., Turner, N., Cochrane, J., Wiggers,
J. H. and Many Rivers Diabetes Prevention Project study, t. (2011). "The reliability

274
and validity of a short FFQ among Australian Aboriginal and Torres Strait Islander
and non-Indigenous rural children." Public Health Nutr 14(3): 388-401.
Hebden, L., Kostan, E., O'Leary, F., Hodge, A. and Allman-Farinelli, M. (2013).
"Validity and reproducibility of a food frequency questionnaire as a measure of
recent dietary intake in young adults." PLoS One 8(9): e75156.
Hedrick, V. E., Comber, D. L., Estabrooks, P. A., Savla, J. and Davy, B. M. (2010). "The
beverage intake questionnaire: determining initial validity and reliability." J Am Diet
Assoc 110(8): 1227-1232.
Hedrick, V. E., Savla, J., Comber, D. L., Flack, K. D., Estabrooks, P. A., Nsiah-Kumi, P.
A., Ortmeier, S. and Davy, B. M. (2012). "Development of a brief questionnaire to
assess habitual beverage intake (BEVQ-15): sugar-sweetened beverages and total
beverage energy intake." J Acad Nutr Diet 112(6): 840-849.
Johansson, G. (2006). "Dietary assessments", accessed 15/05/2015,
http://www.diva-portal.org/smash/get/diva2:464612/FULLTEXT02
Kristal, A. R., Peters, U. and Potter, J. D. (2005). "Is it time to abandon the food
frequency questionnaire?" Cancer Epidemiol Biomarkers Prev 14(12): 2826-2828.
Masson, L. F., McNeill, G., Tomany, J. O., Simpson, J. A., Peace, H. S., Wei, L., Grubb,
D. A. and Bolton-Smith, C. (2003). "Statistical approaches for assessing the relative
validity of a food-frequency questionnaire: use of correlation coefficients and the
kappa statistic." Public Health Nutr 6(3): 313-321.

275
Mohammadifard, N., Omidvar, N., Houshiarrad, A., Neyestani, T., Naderi, G. A. and
Soleymani, B. (2011). "Validity and reproducibility of a food frequency
questionnaire for assessment of fruit and vegetable intake in Iranian adults(*)." J
Res Med Sci 16(10): 1286-1297.
NHMRC (2013a). “Australian Dietary Guidelines”, accessed 20/08/2015,
https://www.nhmrc.gov.au/_files_nhmrc/publications/attachments/n55_australian
_dietary_guidelines_130530.pdf
NHMRC (2013b). “Australian Guide to Healthy Eating”, accessed 20/08/2015,
https://www.eatforhealth.gov.au/sites/default/files/files/public_consultation/n55d
_draft_dietary_guidelines_agthe_111212.pdf
Nissensohn, M., Lopez-Ufano, M., Castro-Quezada, I. and Serra-Majem, L. (2015).
"Assessment of beverage intake and hydration status." Nutr Hosp 31 Suppl 3: 62-69.
NSW Health (2012). “Population Health Survey 2012 Questionnaire”, accessed
25/08/2015,
http://www.health.nsw.gov.au/surveys/child/Documents/Questionnaire-2012.pdf
Paalanen, L., Männistö, S., Virtanen, M. J., Knekt, P., Räsänen, L., Montonen, J. and
Pietinen, P. (2006). "Validity of a food frequency questionnaire varied by age and
body mass index." Journal of Clinical Epidemiology 59(9): 994-1001.
Polkinghorne, B. G., Gopaldasani, V., Furber, S., Davies, B. and Flood, V. M. (2013).
"Hydration status of underground miners in a temperate Australian region." BMC
Public Health 13: 426.

276
Sam, C. H., Skeaff, S. and Skidmore, P. M. (2014). "A comprehensive FFQ developed
for use in New Zealand adults: reliability and validity for nutrient intakes." Public
Health Nutr 17(2): 287-296.
Savastano, D. M., Gorbach, A. M., Eden, H. S., Brady, S. M., Reynolds, J. C. and
Yanovski, J. A. (2009). "Adiposity and human regional body temperature." Am J Clin
Nutr 90(5): 1124-1131.
Schofield, W. N. (1985). "Predicting basal metabolic rate, new standards and review
of previous work." Hum Nutr Clin Nutr 39 Suppl 1: 5-41.

277
CHAPTER 8 – CONCLUSIONS AND RECOMMENDATIONS
8.1 Introduction
The aim of this research was to demonstrate the feasibility of a workplace health
promotion intervention program in the mining industry using an open cut mine as
the study site. The results of this research have shown that it is feasible to introduce
a workplace health promotion program that can be applied to the mining industry,
albeit with some modifications depending on the type of mine site, the number of
shifts, the number of hours in a shift, resources available and most importantly,
interest from the management to run such a program. Major findings from this
research are as follows:
• The prevalence of overweight and obesity among workers in the mining
industry was very high (83%), even higher than the national average for
Australia (62.8%) at the time this research was conducted in 2013 (ABS
2013).
• The majority of workers started their shift dehydrated (70%) thus
predisposing themselves to developing heat-related illness from heat stress
and heat strain if they were exposed to hot, humid work environments.
• A combination of individual behavioural and environmental changes enabled
workers to maintain their weight over the study period and significantly
improve their pre-shift hydration status.

278
8.2 Conclusion
The workplace health promotion intervention program was demonstrated to be
feasible at this mine site and achieved the following effects:
• Maintained the weight of participants over the one-year study period with
threshold shifts in BMI among the borderline overweight and obese
participants, which resulted in a non-significant 2.5% decrease in overweight
and obesity rates, half of the 5% that this research aimed for,
• Improved the hydration status of workers by 58% from baseline, 43% more
than the 15% improvement that this research aimed for,
• Increased the consumption of fruit from 1.1 serves per day to 1.9 serves per
day, nearly meeting the Australian Dietary Guidelines and the Australian
Guide to Healthy Eating of 2.0 serves per day,
• Increased water consumption, and decreased non-alcoholic (tea, coffee,
cordial, sports and energy drinks, and fruit juice) and alcoholic beverages
consumption both of which contribute to a diuretic effect, thus worsening
hydration status,
• Demonstrated that pre-shift hydration status is one of the crucial
determinants of coping with heat stress while working in hot, humid
environments.

279
8.3 Limitations
Specific limitations have been discussed in Chapters four to seven. The limitations
stated here are a summary of those limitations and include the following:
• Large participant attrition towards the end of the study as a result of loss of
a significant number of the workforce during a climate of declining
commodity prices and restructuring of the mining company to remain
profitable. This resulted in low morale and a reduced number of
participants’ engagement with the health promotion intervention program.
This limited the power of the study and subsequent difficulty with
interpreting results.
• Restricted access to snack and beverage vending machines such that less-
healthy food and drinks could not be eliminated in favour of healthier
options.
• Restricted work environment and time for the participants to engage in any
meaningful physical activity onsite, thereby limiting physical activity
interventions.
• Small number of participants who were at risk of heat stress and heat-
related illness, limiting generalisation of findings regarding the association
between hydration status, BMI and core body temperature.
• Using an exclusion criterion for FR that did not account for a physical activity
factor as a result of misreporting of dietary data by the participants. This

280
may have skewed the validation statistics when comparing the FR with short
questions from the Food and Fluid Frequency Questionnaires.
• Given the limited validity of the short fruit and vegetable questions, results
from the short FFQ should be interpreted with caution.
8.4 Recommendations
Based on the findings of this aspect of the study, the following recommendations
are made with respect to future workplace health promotion programs in the
mining industry:
8.4.1 Nutrition
• Information about the benefits of good nutrition and consumption of core
foods, and especially fruit and vegetables, should be communicated
periodically to all workers.
• Researchers should undertake a review of onsite snack and beverages
vending machines with a view to replacing unhealthy snacks and beverages
with healthier options, and should consider adopting interpretative labelling
systems (such as the 5-star rating system) for labelling snacks and
beverages.
8.4.2 Physical activity
• Physical activity should be encouraged at the workplace through
walking/exercise debriefs, walking/exercise handovers and walking/exercise
meetings whenever possible. The aim would be to strive for 60 minutes of
moderate intensity physical activity per day to counteract the detrimental

281
effects of prolonged sitting on workers’ long term health. One way of
achieving this would be to hold gym meetings where participants are
engaged in moderate intensity physical activity while having a meeting at
the same time.
• Allow workers to have access to the onsite gym to engage in some form of
physical activity during their spare time.
• Introduce sitting/standing workstations for all office staff to decrease
prolonged sitting which contributes to sedentary activity.
8.4.3 Dehydration and heat stress
Based on the findings of this aspect of the study, recommendations were made to
the mine site in the form of a heat stress management plan. The same
recommendations are applicable to all mine sites for employees working in hot
environments. These recommendations included the following:
1. Information about the benefits of hydration, starting work hydrated and
sources of healthy fluids should be communicated to workers. Daily
reinforcement of this during hot days may be required.
2. Pre-shift hydration testing using the urine specific gravity (USG) should be
considered for high-risk workers (shot firers and processing workers) and
appropriate measures taken to ensure a fair hydration (pre-hydration with
water) prior to starting the shift.

282
3. During hot days, steps should be taken to limit the exposure of high-risk
workers such as shot firers and processing workers. This could be achieved
by the following options:
For Shot firers –
• Limit time on the ground in the open pit and spend more time in air
conditioned cabins of vehicles in the open pit.
• Rotate with other work groups in the open pit, if possible and
appropriate.
• Stop work especially on hot days when the risk of heat stress is
elevated as indicated by the PHS predicting early onset of core body
temperature elevation to 38°C prior to the end of the shift or a TWL
less than 115.
• Consider shade options while performing work in the open pit. This
shade option could be engineered onto the vehicle to be easily
deployed.
• Ensure hydration by drinking fluids that are carried in the 20L water
containers at the back of the vehicles.
• Consider clothing and PPE options e.g. cooling suits and cooling
towels worn around the neck.
For Processing workers –
• There are some processing jobs that can be done under cover. Hence
consider rotating jobs half way through the shift with processing jobs
under cover.

283
• Consider tasks which can be performed during cooler periods of the
day such as early mornings or late evenings.
• Stop work especially on hot days when the risk of heat stress is
elevated as indicated by the PHS predicting early onset of core body
temperature elevation to 38°C prior to the end of the shift or a TWL
less than 115.
• Consider shade options in certain areas of the buildings
• Consider clothing and PPE options e.g. cooling suits, use of camel
backs and cooling towels worn around the neck.
4. Water should be freely available to all employees undertaking work in hot
conditions. This may be supplemented with 7g/100ml of carbohydrate
containing fluid and/or electrolyte-containing fluids for work that exceeds
four hours in hot conditions, to provide energy and replace lost electrolytes
(DiCorleto et al. 2013).
5. New employees starting work in the hotter months of the year need to
undergo a period of heat acclimatisation prior to starting in the pit.
8.4.4 Policy
• Implementing a healthy workplace policy by the management to
demonstrate corporate commitment to workers’ health. Such policies could
include:
a. Policy on health eating, especially for worksites that provide food for
workers such as FIFO worksites to ensure availability of health food.

284
b. Policy on physical activity to encourage this at the workplace. This
can include sit/stand workstations, walking lunch among others.
c. Policy on social and emotional wellbeing, especially to manage the
morale of the workforce.
d. Monitoring the trend of workers’ weight using the pre-employment
weight, as the baseline would enable better planning of health
programs at the workplace, thus keeping workers in an optimal state
of health.
8.4.5 Department of Health – Healthy Workers Initiative
• The Australian Government Department of Health’s Healthy Workers
initiative program is encouraged to approach the mining industry through
key industry bodies such as the NSW Mine Safety Advisory Council (MSAC),
Queensland Coal Mining Safety and Health Advisory Committee (CMSHAC),
Queensland Mining Safety and Health Advisory Committee (MSHAC) and
Western Australia’s Mining Industry Advisory Committee (MIAC) in an effort
to promote the health of employees not just from exposures to workplace
hazards but also the general health of employees.
8.5 Contributions to the scientific community
To date there has been a paucity of research literature on workplace health
promotion programs in the mining industry. This research has made significant
contributions to the scientific community by demonstrating the feasibility and
effectiveness of a workplace health promotion program in the mining industry

285
among a cohort of workers who are difficult to access. In addition, the
methodological difficulties outlined in this study are characteristic of any mining
operation and serve as a guide to future studies involving health promotion
programs in the mining industry. An important point to note is that this research
was conducted in a non-unionised mine site, which is a rarity in the mining industry
in Australia. For unionised mine sites, the unions are key stakeholders and must be
willing to accept and engage with the health promotion program for any measure of
success.
In a challenging environment in which the workers’ time is of the utmost
importance, the use of a valid quick tool for collecting information on fruit,
vegetables and fluids consumed is paramount. This study has validated a fruit and
vegetable FFQ and a fluid assessment tool with mixed results. Future research is
required to refine this tool and revalidate it in an attempt to gather more accurate
data on workers’ fruit, vegetable and fluid consumption.
While evidence suggests that overweight and obese workers may be at an even
higher risk of heat stress and strain due to increased adiposity, which acts as a
thermal insulator (Savastano et al. 2009), this research did not find any such
association. This may likely be due to the small sample size of workers exposed to
high ambient temperatures at work coupled with these workers being acclimatised
to working in hot, humid environments. More research with a larger sample size is
required to clearly demonstrate any association between overweight and obese
workers compared to workers who are not overweight and obese, and risk of heat
286
stress and strain. This study did however find a strong correlation between the pre-
shift hydration status of workers and the time taken for the core body temperature
to increase to critical levels. Given the inadequate amount of fluids workers
consume while at work, any workers starting their shift in a dehydrated state will
remain dehydrated, or even have a worse hydration status at the end of their shift,
predisposing them to heat-related illness. It is therefore important to enlighten
workers on the need and importance of staying hydrated at all times

287
8.6 References
ABS 2013, “Overweight and obesity”, accessed 12/01/2015,
http://www.abs.gov.au/ausstats/[email protected]/lookup/33C64022ABB5ECD5CA257B820
0179437?opendocument
DiCorleto, R., Firth, I. and Mate, J. (2013) "A Guide to Managing Heat Stress:
Developed for Use in the Australian Environment.", AIOH.
Savastano, D. M., Gorbach, A. M., Eden, H. S., Brady, S. M., Reynolds, J. C. and
Yanovski, J. A. (2009). "Adiposity and human regional body temperature." Am J Clin
Nutr 90(5): 1124-1131.

288
Appendix 1 – Ethics approval
APPROVAL after review In reply please quote: HE13/014 Further Enquiries Phone: 4221 3386
26 February 2013
A/Professor Vicki Flood School of Health Sciences University of Wollongong
Dear A/Professor Flood
Thank you for your letter responding to the HREC review letter. I am pleased to advise that the Human Research Ethics application referred to below has been approved.
Ethics Number: HE13/014
Project Title: Supporting healthy lifestyles in the mining
industry – a focus on nutrition, physical activity and hydration
Name of Researchers: A/Professor Vicki Flood, Dr Brian Davies, Mr Ken Bermingham, Mrs Jane Whitelaw, Dr Vinodkumar Gopaldasani
Approval Date: 26 February 2013
Expiry Date: 25 February 2014
The University of Wollongong/ISLHD Health and Medical HREC is constituted and functions in accordance with the NHMRC National Statement on Ethical Conduct in Human Research. The HREC has reviewed the research proposal for compliance with the National Statement and approval of this project is conditional upon your continuing compliance with this document.
A condition of approval by the HREC is the submission of a progress report annually and a final report on completion of your project. The progress report

289
template is available at http://www.uow.edu.au/research/rso/ethics/UOW009385.html. This report must be completed, signed by the appropriate Head of School and returned to the Research Services Office prior to the expiry date.
As evidence of continuing compliance, the Human Research Ethics Committee also requires that researchers immediately report: • proposed changes to the protocol including changes to investigators involved • serious or unexpected adverse effects on participants • unforseen events that might affect continued ethical acceptability of the project. Please note that approvals are granted for a twelve-month period. Further extension will be considered on receipt of a progress report prior to expiry date.
If you have any queries regarding the HREC review process, please contact the Ethics Unit on phone 4221 3386 or email [email protected].
Yours sincerely
Associate Professor Sarah Ferber Chair, UOW & ISLHD Health and Medical Human Research Ethics Committee

290
Appendix 2 – Participant information sheet
Title: Supporting healthy lifestyles in the mining industry – a focus on nutrition, physical activity and hydration
Project Information & Objectives Healthy nutrition, physical activity and staying hydrated can all contribute to staying healthy and fit for work and recreation. The study aims to develop, implement and evaluate a healthy lifestyle intervention among employees of Cowal Gold Mine. Investigators • Assoc. Prof. Vicki Flood (02) 4221 3947 [email protected] • Dr Brian Davies 0407287406 [email protected] • Dr Vinod Gopaldasani (02) 4221 3463 [email protected] • Jane Whitelaw (02) 4221 5232 [email protected]
What do I have to do? If you agree to participate in this study you will be provided with information and advice regarding the health benefits of good nutrition, physical activity and good hydration and will be asked to answer some questions about your food and drink intake, physical activity at home and at work and your work environment. You will also be asked to keep a record of your food intake for 3 days in a week (2 weekdays and 1 weekend day). You will be asked to consent to have your height measured (using a stadiometer), be weighed (using a digital weighing scale) and to supply a urine sample (to be tested ONLY for hydration level using a digital optical refractometer) before and after the shift to determine the amount of fluid loss during the shift. You will also have your blood pressure and blood sugar levels measured. The blood pressure will be measured using a digital machine, with a cuff placed around your upper arm while your blood sugar levels will be measured using a glucometer, which requires a pin prick blood sample.
The study will run for 12 to 15 months, with regular measurements every 3-4 months. The regular measurements would include a questionnaire, weight, urine sample for hydration level testing, blood pressure and blood glucose levels.
Intervention component of the study
The intervention will include three main components:
1. Information and training sessions on healthy nutrition, physical activity and staying hydrated. Tools used include PowerPoint presentations, E-bulletin boards, noticeboards as well as regular follow-ups

291
2. Provision of water stations with palatable water, provision of accessories to facilitate water consumption, review of vending machines and snacks provided during meetings if possible to provide healthier food options, putting up notices and signs encouraging healthy eating, physical activity and staying hydrated
3. Review of guidelines, including discussions with management, which may facilitate the development of new guidelines/policies related to healthy nutrition, staying hydrated, physical activity and managing heat stress
Possible risks, inconveniences and discomforts The only inconvenience we foresee involves the time taken to complete the questionnaire and to keep a record of your food intake. The only discomfort that we can foresee involves the finger prick test for blood glucose level.
Potential benefits You will receive a copy of your hydration results with an explanation of what they mean. You will also receive feedback on your physical activity levels and nutrition in relation to the Australian guidelines for physical activity and healthy eating. Your health may benefit from this study through healthy nutrition, increased physical activity and improved hydration. Your workplace may benefit through a health promotion program that sustains and improves the overall health of its employees and this can be applied to other similar workplaces. If you have any concerns about your health please discuss them with your General Practitioner.
Participation is voluntary and you can withdraw at any time Your participation is completely voluntary and participating or refusing to participate will not affect your relationship with your employer. You have a right to withdraw your consent to participate and/or data from the study at any stage.
Use of research data Data from this research may be published in a peer reviewed journal article or presented at conferences. Data will also be used for Dr Gopaldasani's PhD thesis. In any reports, conference presentations or other publications resulting from this study, you will not be able to be identified. Group data will be shared with Cowal Gold in the form of presentations or reports. However, individual data will not be provided and you will remain completely anonymous.
Confidentiality All information provided will be coded to ensure confidentiality. All your data will be confidential and stored in a locked filing cabinet in a secure place at the University of Wollongong. All digital information will be password protected. All identifying

292
information will be removed after data collection. Upon completion of this study, all data collected will be retained in a secure place in a locked filing cabinet at the School of Health Sciences, University of Wollongong for at least five years so as to comply with the University of Wollongong Code Of Practice – Research. Enquiries This study has been approved by the University of Wollongong/ Illawarra Shoalhaven Local Health District Human Research Ethics Committee. For any concerns or complaints regarding the conduct of this research, please contact: • UOW Ethics Office (02) 4221 4457 [email protected]
Thank you for supporting this research

293
Appendix 3 – Participant consent form
Title: Supporting healthy lifestyles in the mining industry – a focus on nutrition, physical activity and hydration
Please read the following statements and sign below:
1. I have been given the information sheet explaining the study and all questions I have asked have been answered to my satisfaction
2. I have been advised of the potential risks and inconveniences upon participating in this research which includes a finger-prick blood sugar test
3. I understand that the research involves the following procedures: a. Receiving information and advice about healthy nutrition, sufficient
physical activity and maintaining good hydration levels; b. Answering paper-based questionnaires at the start of the study and
every 3-4 months thereafter till the end of the study; c. Keeping a 3-day food record (2 weekdays and 1 weekend day) at the
beginning and at the end of the study; d. Having my weight, urine specific gravity, blood pressure and blood sugar
levels measured at the start of the study and every 3-4 months thereafter till the end of the study;
e. Having my height measured at the start of the study. 4. I agree to participate in the study and understand that I may withdraw at any
time, taking my data with me. 5. I agree that the research data gathered for the study may be published provided
that I cannot be identified as a participant.
Name of participant.......................................................................................................
Signature of participant.................................................................................................
Date......../......./..........
Please sign and return this form to the Project Officer. You will be returned a copy of this form to keep for your records. The principal investigator of this study is Dr Vinod Gopaldasani, a PhD student of the University of Wollongong, who is supervised by A/Prof. Vicki Flood and Dr Brian Davies. • Assoc. Prof. Vicki Flood (02) 4221 3947 [email protected] • Dr Brian Davies 0407287406 [email protected] • Dr Vinod Gopaldasani (02) 4221 3463 [email protected] • UOW Ethics Office (02) 4221 4457 [email protected]

294
Appendix 4 – Proposed intervention list
INDIVIDUAL Details Cost
implications Feasibility
1. Dietary advice / management
Participants interested in dietary advice for weight loss can be linked to the NSW Get Healthy Information and Coaching Service. This is a free personalised one-on-one confidential phone service that helps make lifestyle changes in relation to healthy eating, being physically active and achieving and maintaining a healthy weight.
Free. Program runs for 6 months.
Yes.
2. Information and education
Periodic (3 monthly) seminars or programs to inform and educate workers on healthy eating, physical activity, heat stress and staying hydrated. Avenues to implement include Emails, TV screens on transport buses, posters, health messages before the start of meetings etc.
Negligible. Can be part of the OHS team activities. Support provided by UOW research team.
Yes.
3. Hydration – staying hydrated
Information and education (see above)
Provision of water bottles (See above) with quantity consumed to be recorded at the end of the shift.
Free samples of water bottles to be provided for trial run.
Yes for information and education.
No for water bottles as supplier was unable to provide bottles for use.

295
4. Physical activity Participation in offsite sporting activities.
Incorporated into information and education seminars
Use of pedometers with target goals to be met.
Low to moderate cost of pedometers.
Free – Pedometers will be trialled as part of the intervention.
Yes.
ENVIRONMENT
Details Cost implications
Feasibility
Nutrition 1. Provision of
fruit & vegetables
Provision of F & V in common areas, pantry, during meetings, possibly on desks of workers
Moderate No. Cost intensive for long term sustainability.
2. Provision of healthy alternatives to existing food products
Reduced fat milk to completely replace full cream milk, optional skim milk, completely replacing sweet pastries, cakes and biscuits with fruit/vegetables at meetings
Minimal No. Replacement of existing food products not possible. However, healthy options can be placed side-by-side with existing products.
Physical activity 1. Onsite gym use Make onsite gym use
available to interested participants. Should be advertised and encouraged to ensure participation.
None No. Reserved for training of rescue personnel. No time allocation possible for use of facilities.

296
2. Offsite sporting activities supported by Barrick
Examples include touch footy, basketball etc.
Need to make it competitive and fun e.g. have a league consisting of Crews A, B, C, D, office workers, with points allocation for wins and draws and possibly a prize at the end of the season.
Depends on program. Estimated moderate but returns far outweigh cost in terms of improved workers’ morale, company image and translating to a healthier workforce.
No. Financial implications may not be supported by management due to consolidation of mining industry with regard to cost saving.
3. Stand at work Situations in which this could be encouraged include standing while answering the phone, computer prompts with lockout screens telling participants to stand for 5-10mins, standing workstations if practicable.
None.
Cost will be high if standing workstations are considered.
No. Financial implications may not be supported by management due to consolidation of mining industry with regard to cost saving.
Smoking cessation 1. Must be
supported by policy or guideline
Encourage a smoke- free workplace by eliminating smoking zones.
Penalties/warnings for smoking at the workplace.
Must be supported by policy or will fail completely.
None. No. Too difficult to implement for fear of pushback from workers.
Hydration 1. Provision of
more drink machines around the site
Survey showed that more water bubblers are required around the site to encourage more water intake.
Low to moderate.
Yes.

297
2. Provision of water bottles
Specialised 2L water bottles with electronic tracker of amounts consumed can be trialled. Quantity consumed at the end of the shift to be recorded in mL.
Free samples (20-30) to be provided (See attached picture).
No. Supplier was unable to provide bottles for use.
Heat stress 1. Monitoring and
evaluation Heat stress monitoring and evaluation to include measures of WB, DB, GT, air speed and clothing worn. Use of heat stress indices to determine risk followed by appropriate risk management. Detailed in the heat management policy.
Low. Yes.
Monitoring strategies
Feasibility
1. Workers compensation claims, frequency and cost
No. Corporate sensitive information.
2. Sickness absence cost
No. Corporate sensitive information.
3. Lost Time Injury Frequency Rate (LTIFR)
No. Corporate sensitive information.
4. Absenteeism/absence rate/turnover and grievance rates
No. Corporate sensitive information.

298
5. Productivity – measured in terms of rates and cost
No. Corporate sensitive information.
6. Physical measures – weight, BMI, blood pressure, blood glucose
Yes.

299
Appendix 5 – Questionnaire for participants
CODE NO:________
TODAY'S DATE: _____________ SHIFT (DAY/NIGHT): _____________
WHAT IS YOUR USUAL JOB?: _______________________
MEASURED HEIGHT (m): ___________m
MEASURED WEIGHT (kg): ___________kg
MEASURED URINE SPECIFIC GRAVITY: ___________
MEASURED BLOOD PRESSURE: _________mmHg
MEASURED BLOOD GLUCOSE: _________mg/dl
I would like to ask you a few questions about yourself. Please remember that all data is confidential. All data will be de-identified before being used in the study.
Q1. AGE (yrs): _______yrs
Q2. GENDER (Circle one): M F
Q3. SUBURB OF HOME ADDRESS: ______________________________________
Q4. What is the level of the highest qualification you have completed?
□1 Completed primary school □2 Completed years 7 to 9 □3 School certificate or
Intermediate or Year 10 or 4th Form □4 Higher School Certificate or Leaving or Year 12 or
6th Form □5 TAFE Certificate or diploma □6 University, College of Advanced Education
or some other tertiary degree or higher □7 Other________________________________ Q5. In the last week, how many hours did you work? ________hrs Q6. I am wearing the following clothes today: (Tick all that apply)
Briefs □1 Short sleeves shirt □5 Overalls□9 Boots □13
Sleeveless shirt □2 Long sleeves shirt □6 Belt □10
T-shirt □3 Shorts □7 Socks (regular) □11
Full sleeves shirt □4 Trousers □8 Thick long socks □12

300
Q7. What part of your body do you use most during the course of your work? (Tick all that apply)
□1 Hand/wrist/fingers □2 Upper arm □3 Shoulder □4 Back
□5 Torso □6 Lower limbs □7 Ankles/foot Q8. Have you ever experienced any work-related injuries?
□1 Yes □2 No (Skip to Q10) Q9. Provide a brief description of the type of work related injury you sustained ______________________________________________________________________________________________________________________________________________________ SMOKING1
Q10. Which of the following best describes your smoking status?
□1 Smoke daily □2 Smoke occasionally □3 Do not smoke now but used to
□4 Have tried it a few times but never smoked regularly □5 Never smoked HYDRATION2
Q11. What do you drink most at work?
□1 Water □2 Sports drink □3 Soft drink □4 Energy drink
□5 Other_________
Q12. I drink enough at work
□1 Strongly Agree □2 Agree □3 Disagree □4 Strongly Disagree
Q13. How many cups of soft drink, cordials or sports drink such as lemonade or Gatorade do you usually drink in a day? (1 cup = 250ml, 1 can of soft drink = 1.5 cups, 1 x 500ml bottle of Gatorade = 2 cups)
□1 ______cups per day □2 ______cups per week □3 Don't drink soft drink □4 Don't
know
Q14. How many cups of fruit juice do you usually drink in a day? (1 cup = 250ml, a household cup, or a large popper)
□1 ______cups per day □2 ______cups per week □3 Don't drink juice □4 Don't
know
1 Adapted from NSW Population Health Survey 2011, accessed 20/10/2012, http://www0.health.nsw.gov.au/PublicHealth/surveys/hsa/resources/adult%2011_questions/t_7_ques_31_smoking.pdf 2Adapted from NSW Population Health Survey 2011, accessed 20/10/2012, http://www0.health.nsw.gov.au/PublicHealth/surveys/hsa/resources/adult%2011_questions/t_7_ques_23_nutrition.pdf and http://www0.health.nsw.gov.au/PublicHealth/surveys/hsa/resources/adult%2011_questions/t_7_ques_02_alcohol_cannabis.pdf

301
Q15. How many cups of water do you usually drink in a day? (1 cup = 250ml or a household tea cup, 1 average bottle of water = 1.5 cups)
□1 ______cups per day □2 ______cups per week □3 Don't drink water □4 Don't
know
Q16. What would help you drink more fluids at work? ______________________________________________________________________________________________________________________________________________________ Q17. How often do you usually drink alcohol?
□1 ____number of days □2 Less than once a week □3 Don't drink alcohol
□4 Don't know
HEALTH3 Q18. When did you last have your blood pressure measured by a medical practitioner?
□1 0-3 months ago □2 4-6 months ago □3 7-12 months ago □4 13 months to 2 yrs ago
□5 More than 2 yrs ago □6 Never measured (Go to Q20.) □7 Don't know Q19. Have you ever been told by a doctor/hospital you have high blood pressure (hypertension)?
□1 Yes □2 Yes, but only during pregnancy □3 Yes, but only temporarily □4 No
□5 Don't know Q20. When did you last have your cholesterol measured?
□1 0-6 months ago □2 7-12 months ago □3 13 months to 2 yrs ago □4 More than 2 yrs
ago □5 Never measured (Go to Q22.) □6 Don't know (Go to Q22.) Q21. Have you ever been told by a doctor/hospital you have high cholesterol?
□1 Yes □2 No □3 Borderline □4 Don't know
Q22. Have you ever been told by a doctor/hospital you have high blood glucose?
□1 Yes □2 No (→ Q28) □3 Borderline (MALE → Q28) □4 Only during pregnancy
(→ Q28) □5 Don't know (→ Q28)
3 Adapted from NSW Population Health Survey 2011, accessed 20/10/2012, http://www0.health.nsw.gov.au/PublicHealth/surveys/hsa/resources/adult%2011_questions/t_7_ques_06_cardiovascular_precursor.pdf and http://www0.health.nsw.gov.au/PublicHealth/surveys/hsa/resources/adult%2011_questions/t_7_ques_11_diabetes.pdf
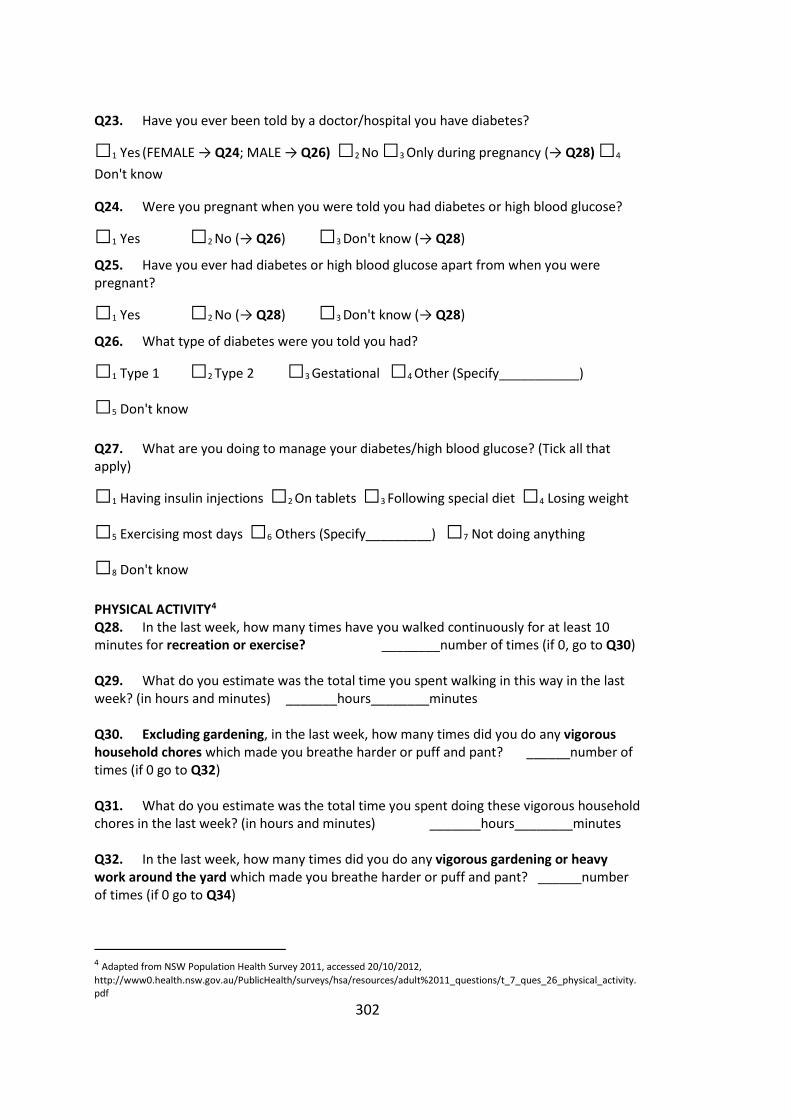
302
Q23. Have you ever been told by a doctor/hospital you have diabetes?
□1 Yes (FEMALE → Q24; MALE → Q26) □2 No □3 Only during pregnancy (→ Q28) □4 Don't know
Q24. Were you pregnant when you were told you had diabetes or high blood glucose?
□1 Yes □2 No (→ Q26) □3 Don't know (→ Q28)
Q25. Have you ever had diabetes or high blood glucose apart from when you were pregnant?
□1 Yes □2 No (→ Q28) □3 Don't know (→ Q28)
Q26. What type of diabetes were you told you had?
□1 Type 1 □2 Type 2 □3 Gestational □4 Other (Specify___________)
□5 Don't know Q27. What are you doing to manage your diabetes/high blood glucose? (Tick all that apply)
□1 Having insulin injections □2 On tablets □3 Following special diet □4 Losing weight
□5 Exercising most days □6 Others (Specify_________) □7 Not doing anything
□8 Don't know PHYSICAL ACTIVITY4 Q28. In the last week, how many times have you walked continuously for at least 10 minutes for recreation or exercise? ________number of times (if 0, go to Q30) Q29. What do you estimate was the total time you spent walking in this way in the last week? (in hours and minutes) _______hours________minutes Q30. Excluding gardening, in the last week, how many times did you do any vigorous household chores which made you breathe harder or puff and pant? ______number of times (if 0 go to Q32) Q31. What do you estimate was the total time you spent doing these vigorous household chores in the last week? (in hours and minutes) _______hours________minutes Q32. In the last week, how many times did you do any vigorous gardening or heavy work around the yard which made you breathe harder or puff and pant? ______number of times (if 0 go to Q34)
4 Adapted from NSW Population Health Survey 2011, accessed 20/10/2012, http://www0.health.nsw.gov.au/PublicHealth/surveys/hsa/resources/adult%2011_questions/t_7_ques_26_physical_activity.pdf

303
Q33. What do you estimate was the total time you spent doing this vigorous gardening or heavy work around the yard in the last week? (in hours and minutes) _______hours________minutes Q34. This question excludes household chores or gardening. In the last week, how many times did you do any vigorous physical activity that made you breathe harder or puff and pant? (For example football, tennis, netball, squash, athletics, cycling, jogging, keep-fit exercises and vigorous swimming) ______number of times (if 0 go to Q36) Q35. What do you estimate was the total time you spent doing this vigorous physical activity in the last week? (in hours and minutes) _______hours________minutes Q36. This question excludes household chores or gardening. In the last week, how many times did you do any other more moderate physical activity that you haven't already mentioned? (for example, lawn bowls, golf, tai chi, sailing, etc) ______number of times (if 0 go to Q38) Q37. What do you estimate was the total time that you spent doing these activities in the last week? (in hours and minutes) _______hours________minutes Q38. Regarding all the types of exercise you have already mentioned above, how many days in the last week did you exercise (0 days to 7 days)? _______days Q39. How many of these days did you exercise for at least 30 minutes per day (0 days to 7 days)? _______days Q40. How do you usually get to work?
□1 Car (as driver) □2 Car (as passenger) □3 Bus □4 Motorbike □5 Truck □6 Other_________ Q41. When at work, which of the following best describes what you do on a typical work- day?
□1 Mostly sitting □2 Mostly standing □3 Mostly walking □4 Mostly heavy labour
□5 Don't know Q42. How much time do you spend sitting at work on a typical workday?
_____hours _____min
Q43. Do you have a gym membership? □1 Yes □2 No (Skip to Q45) Q44. In the last week, how many times have you gone to the gym to work out? ______no of times Q45. Did you know that your employer provides a 50% gym membership subsidy?
□1 Yes □2 No

304
NUTRITION5 Q46. How many serves of fruit do you usually eat each day? (1 serve = 1 medium piece or 2 small pieces of fruit or 1 cup of diced pieces)
□1 _____serves per day □2 ______serves per week □3 Don't eat fruit □4 Don't know Q47. How many serves of vegetables do you usually eat each day? (1 serve = half cup cooked or 1 cup of salad vegetables)
□1 ___serves per day □2 ___serves per week □3 Don't eat vegetables □4 Don't know
5 Adapted from the NSW Population Health Survey 2011, accessed 20/10/2012, http://www0.health.nsw.gov.au/PublicHealth/surveys/hsa/resources/adult%2010_questions/t_7_ques_23_nutrition.pdf

305
Appendix 6 – 3-day food record
GENERAL INSTRUCTIONS
NAME:__________________________________________________ • Please fill in this food intake record on 3 days, including 2 weekdays and 1 weekend day. • The days in which food intake is recorded do not need to be consecutive, but need to be
within the same 1-week period. • Directions for how to fill in the food record are at the top of each day. An example of one
afternoon/evening is on the following page. When you have completed your food record please return it to the researchers. If you have any questions about the study or how you should complete the food record please call 02 4221 3947 or email [email protected] or [email protected].
Instructions to completing the food record • Write down EVERYTHING that you eat and drink over one day from waking to
going to sleep. This includes snacks, water, medications, vitamin and mineral supplements.
• Use a new line for each food or drink.
• Record the location of where the food was consumed in the location column. For
example work, home, shops, restaurants etc.
• Record the type of eating occasion in the appropriate column. For example,
breakfast, lunch, dinner, morning tea, afternoon tea, snacks.
• RECORD EACH FOOD INDIVIDUALLY, for example a tuna sandwich may
include two slices of wholemeal bread, two teaspoons of margarine and 1 small
can of tuna (canned in brine).
• Include the amounts in household measures or natural portion sizes. For example:
2 slices of bread, ½ cup rice, ½ cup peas. Please use the set of standard spoon
and cup measures we have provided to assist recording this information.
• Always record cooking methods such as boiling, frying etc.
• Give a detailed description of the food or drink and include brand names where
possible. For example Arnott's Milk Arrowroot® biscuit, Pure Blonde Full Strength
Beer, etc.
• Don't forget to include any sauces, mayonnaise or gravies that are used. We are
interested to find out about usual eating patterns, so please keep the food intake
as usual.
• If you record a day that is not usual, please indicate in the box at the end of each
food record day how it differs from usual. (For example: I was at a party)
• IF IN DOUBT ABOUT ANY FOOD, ASK YOUR PARTNER FOR ASSISTANCE

306
Example of one day
Date: 22/03/12 Day: Thursday Went to work today Yes □ No √
Location
Time Meal/eating occasion
Food / Drinks/ & Cooking method (where applicable)
Amount/size EATEN
Home 7am Breakfast Whole milk (on cereal) Weet-bix White sugar Toast – white bread (Tip Top) Margarine (Meadow Lea) Honey White tea; Black tea with 1 tea bag Whole milk Sugar
1 cup 3 weetbix 1 tspn 2 slices 2 tspn 1 tblspn 1 cup tea 2 tblspn 1 tspn
Work 10am Morning tea Banana water
1 medium banana 1 bottle (600ml)
Work 12md
Lunch 2x Cheese and ham sandwiches White bread (Tip Top) Margarine (Meadow-lea) Cheese (Kraft) Ham water Red apple
4 slices 4 teaspoon 2 slices 2 slices 1 cup 1 large apple
Work 3.00pm Snack Muesli bar, Uncle Toby's crunchy nut crumble Gatorade
2 bars 1 medium bottle (600ml)
Home
6.30pm
Dinner 1 Beef Fillet, grilled potato, peeled, steamed carrots, peeled, steamed Green peas, boiled from frozen Apple Juice (Just Juice) Ice cream (Dairy Farmer’s vanilla) Chocolate sauce (Cottees) Beer, Tooheys extra dry
1 fillet, 250gm 1 average ½ cup ½ cup 1 medium glass (1 cup from measuring cup) 2 medium scoops 2 tablespoons 2 stubbies
Was intake unusual in any way? No Yes ☑
If yes, in what way? _______Anniversary dinner_____________________

307
DAY 1 FOOD INTAKE RECORD (WEEKDAY)
• Write down everything that you eat and drink over one day from waking to going to sleep. This includes snacks, water, medications, vitamin and mineral supplements.
• Use a new line for each food or drink. • Record the location of where the food was consumed in the location column. For example
work, home, shops, restaurant, etc. • Record the type of eating occasion in the appropriate column. For example, breakfast, lunch,
dinner, morning tea, afternoon tea, snacks. • Record each food individually, e.g. a tuna sandwich might be two slices of wholemeal bread,
two teaspoons of margarine and half a cup of tuna (canned in brine). • Include the amounts in household measures or natural portion sizes. For example: 2 slices of
bread, ½ cup rice, ½ cup peas. Please use the set of standard spoon and cup measures to assist recording this information.
• Always record cooking methods such as boiling, frying etc. • Give a detailed description of the food or drink and include brand names when possible. For
example Arnott's Milk Arrowroot® biscuit, Pure Blonde Full Strength Beer, etc. • Don't forget to include any sauces, mayonnaise or gravies that are used. We are
interested to find out about usual eating patterns, so please keep the food intake as usual.
• If you record a day that is not usual, please indicate how it differs from the usual.
Date: Day: Went to work today: Yes □ No □
Location Time Meal/eating occasion
Food / Drinks/ & Cooking method (where applicable)
Amount/ size

308
Was intake unusual in any way? No Yes If yes, in what way? __________________________________________________

309
DAY 2 FOOD INTAKE RECORD (WEEKDAY)
• Write down everything that you eat and drink over one day from waking to going to sleep. This includes snacks, water, medications, vitamin and mineral supplements.
• Use a new line for each food or drink. • Record the location of where the food was consumed in the location column. For example
work, home, shops, restaurant, etc. • Record the type of eating occasion in the appropriate column. For example, breakfast, lunch,
dinner, morning tea, afternoon tea, snacks. • Record each food individually, for example a tuna sandwich might be two slices of
wholemeal bread, two teaspoons of margarine and 1 small can of tuna (canned in brine). • Include the amounts in household measures or natural portion sizes. For example: 2 slices of
bread, ½ cup rice, ½ cup peas. Please use the set of standard spoon and cup measures to assist recording this information.
• Always record cooking methods such as boiling, frying etc. • Give a detailed description of the food or drink and include brand names when possible. For
example Arnott's Milk Arrowroot® biscuit, Pure Blonde Full Strength Beer, etc. • Don't forget to include any sauces, mayonnaise or gravies that are used. We are
interested to find out about usual eating patterns, so please keep the food intake as usual.
• If you record a day that is not usual, please indicate how it differs from the usual.
Date: Day: Went to work today: Yes □ No □
Location Time Meal/eating occasion
Food / Drinks/ & Cooking method (where applicable)
Amount/ size

310
Was intake unusual in any way? No Yes If yes, in what way? __________________________________________________

311
DAY 3 FOOD INTAKE RECORD (WEEKEND DAY) • Write down everything that you eat and drink over one day from waking to going to
sleep. This includes snacks, water, medications, vitamin and mineral supplements. • Use a new line for each food or drink. • Record the location of where the food was consumed in the location column. For example
work, home, shops, restaurants, etc. • Record the type of eating occasion in the appropriate column. For example, breakfast, lunch,
dinner, morning tea, afternoon tea, snacks • Record each food individually, for example a tuna sandwich might be two slices of bread, two
teaspoons of margarine and 1 small can of tuna (canned in brine). • Include the amounts in household measures or natural portion sizes. For example: 2 slices of
wholemeal bread, ½ cup rice, ½ cup peas. Please use the set of standard spoon and cup measures to assist recording this information.
• Always record cooking methods such as boiling, frying, etc. • Give a detailed description of the food or drink and include brand names when possible. For
example: Arnott's Milk Arrowroot® biscuit, Pure Blonde Full Strength Beer, etc. • Don't forget to include any sauces, mayonnaise or gravies that are used. We are
interested to find out about usual eating patterns, so please keep the food intake as usual.
• If you record a day that is not usual, please indicate how it differs from the usual.
Date: Day: Went to work today: Yes □ No □
Location Time Meal/eating occasion
Food / Drinks/ & Cooking method (where applicable)
Amount/ size

312
Was intake unusual in any way? No Yes If yes, in what way? __________________________________________________

313
Appendix 7 – Diet, nutrition, physical activity and
chronic diseases information
Introduction Your diet and physical activity habits are important factors in the promotion and maintenance of good health throughout your life. By following the guidelines for healthy eating outlined below, you help reduce your risk of chronic diseases such as heart disease, type-2 diabetes, overweight and obesity and some cancers.
Food intake goals for Australians Most Australians don’t eat enough of the foods that are known to promote good health, including fruit and vegetables and wholegrain breads and cereals. Other foods and drinks that should be central in your diet include reduced fat milk, yogurt and cheese, lean meats, poultry, fish, eggs and water.
Most Australians eat too much 'discretionary foods and drinks' such as meat pies, sausage rolls, fried hot chips, potato crisps, lollies and chocolates, soft drinks, cordial, energy drinks, sports drinks, wine, beer and spirits. Details of specific food intakes for preventing diet-related chronic diseases are listed in the attached brochure.
Recommendations for preventing diet-related chronic diseases Tips to maintain a healthy weight.
1. Maintain your weight such that your BMI is in the range of 18.5 - 24.9 kg/m2. You can calculate your BMI by dividing your weight in kg by the square of your height in metres.
2. Eat a healthy breakfast. 3. Have a diet that includes at least 2 serves of fruit and 5 serves of vegetables per
day. 4. Eat slowly and savour every mouthful. 5. Stop eating before you feel full. 6. Don't eat meals while watching the TV. 7. Choose water as a drink. Only have soft drinks, cordial, fruit drinks, energy
drinks and sports drinks occasionally (e.g. less than once per week). 8. Consumption of alcoholic beverages is not recommended; if consumed, do not
exceed 2 standard drinks per day.

314
9. Maintain regular physical activity on most days of the week – 30 minutes per day of moderate-intensity activity.
There are four steps for better health for Australian adults. Together, steps 1-3 recommend the minimum amount of physical activity you need to do to enhance your health. They are not intended for high-level fitness, sports training or weight loss. To achieve best results, try to carry out all three steps and combine an active lifestyle with healthy eating. Step 4 is for those who are able, and wish, to achieve greater health and fitness benefits. Step 1 – Think of movement as an opportunity, not an inconvenience. Any form of movement of the body is seen as an opportunity for improving health, not as a time-wasting inconvenience. Step 2- Be active every day in as many ways as you can. Make a habit of walking or cycling instead of using the car, or do things yourself instead of using labour-saving machines. Step 3 – Put together at least 30 minutes of moderate-intensity physical activity on most, preferably all, days. You can accumulate your 30 minutes (or more) throughout the day by combining a few shorter sessions of activity of around 10 to 15 minutes each. Step 4 – If you can, also enjoy some regular, vigorous activity for extra health and fitness. This step does not replace Steps 1-3. Rather, it adds an extra level for those who are able, and wish, to achieve greater health and fitness benefits. Types of physical activity include: Sedentary activities – sitting, lying down Light activities – standing, moving around the home or workplace Moderate activities – brisk walking, gentle swimming, social tennis Vigorous activities – jogging, aerobics, football, netball Tips to add variety in your meals
1. Choose a variety of colours of fresh vegetables and fruit – green, orange, red, yellow, purple and white.
2. Use wholegrain cereals like wholemeal bread and brown rice. 3. Include meat-free meals each week e.g. eggs, beans and tofu. 4. Try new foods such as polenta, couscous or quinoa.

315
Tips to limit added sugars consumption 1. Keep to a minimum the amount of sugars, honey, sweetened sauces or syrups
added to foods. 2. Gradually reduce the sugars you consume over several weeks. 3. Eat fruit instead of biscuits, cakes, muffins, chocolates or lollies. 4. Avoid sweetened drinks. Choose water instead.
Tips to eat less salt Excess salt consumption increases your risk of hypertension and subsequent heart disease 1. Limit foods high in salt, such as processed meats, e.g. bacon, ham, corned beef
and devon rolls. 2. Choose lower sodium options among similar foods, e.g. slightly salted butter.
Use nutrition information panels on packaged foods to choose less sodium-containing food option.
3. Use pepper, fresh or dried herbs, to season food instead of using salt. If salt must be used, use it sparingly.
4. Gradually cut down your salt consumption over several weeks. Your taste buds are constantly regenerating. You’ll have new ones in a few weeks and they won’t know the difference when you cut down on salt!
Your guide to fats There are different types of fats – saturated (bad) fat, unsaturated (good) fat. Saturated fat increases your risk of health diseases. Saturated fats should be replaced with unsaturated (mono or polyunsaturated) fats.
Foods containing saturated fats include: butter, cream, lard and dripping, coconut and palm kernel oils, biscuits, cakes, pastries and pies, processed meats, commercial burgers, pizzas and fried foods, potato chips and crisps, sausages, untrimmed meats and full-cream dairy products, especially cheese.
Foods containing unsaturated fats include: seeds, legumes/beans, avocado, oats, fish, lean meat, poultry and eggs.
Tips to eat less saturated fat 1. Eat fish and legumes/beans more often. 2. Cut down on dishes with cream, buttery or creamy sauces or fatty gravy. 3. Use reduced-fat yoghurt, lemon juice, herbs and small amounts of unsaturated
oils for dressings. 4. Don't deep-fry foods. Instead sauté, stir-fry, grill, bake, steam, boil, microwave,
poach or barbeque your foods.

316
5. Order a side salad or vegetables instead of hot chips. 6. Choose reduced or low-fat milk, yoghurt and cheese.
References NHMRC 2013, "Australian Dietary Guidelines Summary", accessed 30/10/2013, http://www.nhmrc.gov.au/_files_nhmrc/publications/attachments/n55a_australian_dietary_guidelines_summary_131014.pdf WHO 2003, "Diet, Nutrition and the prevention of chronic diseases", accessed 20/10/2013, http://whqlibdoc.who.int/trs/who_trs_916.pdf

317
Appendix 8 – Physical activity information
Introduction • Physical activity is the leading preventable cause of disease. • Only about 57% of adult Australians are engaged in sufficient physical
activity for health. • The proportion of inactive Australians is increasing. • The rising number of overweight and obese adult Australians is strongly
linked to an overall decline in energy expenditure through physical inactivity. • Increasing your physical activity levels can significantly contribute to
reductions in chronic diseases such as heart disease, diabetes and certain cancers.
• Physical activity helps boost self-esteem, improve self-image and improve quality of life.
Health benefits of physical activity
• Reduced risk of developing high blood pressure. • Reduced risk of developing Type-2 diabetes. • Reduced risk of developing colon cancer. • Reduced risk of dying prematurely. • Reduced risk of musculoskeletal injuries. • Fewer slips, trips and falls. • Maintenance of healthy weight.
National Physical Activity Guidelines To achieve health benefits, a person should participate in 30 minutes of at least moderate-intensity physical activity on most days of the week. This translates to:
• the accumulation of at least 150 minutes of activity over 1 week (30 minutes per day on at least 5 days of the week).
• the accumulation of at least 150 minutes of activity and at least 5 sessions of activity over 1 week.
What you can do to stay physically active • Be active every day in as many ways as you can. • Put together at least 30 minutes of moderate intensity physical activity (e.g.
brisk walking, gentle swimming, social tennis or golf). • If you can, also enjoy some regular vigorous exercise for extra health and
fitness (e.g. jogging, football, netball). • Think of movement as an opportunity, not an inconvenience.

318
Appendix 9 – Heart disease information
Introduction • Heart disease is the most common form of cardiovascular disease. • Presents in two forms – Heart attack and Angina. • Heart attack is a life-threatening event that occurs when a blood vessel
supplying the heart itself is suddenly blocked completely, damaging the heart.
• Angina is chest pain or discomfort that occurs when a blood vessel supplying the heart itself is partially blocked, so that your heart muscle doesn't get enough oxygen-rich blood.
Putting it in perspective
• In 2011, heart attacks claimed 9,811 lives (27 lives each day). • Each year 55,000 Australians suffer a heart attack (1 heart attack every 10
minutes). • About 380,000 Australians have had a heart attack at some time in their
lives. • Males are three times more likely to have a heart attack.
Risk factors
• High blood pressure • High cholesterol • Overweight and obesity • Physical inactivity • Low fruit and vegetable intake • Excessive alcohol consumption (greater than 2 standard drinks (20g of
alcohol) per day) • Smoking
NOTE – NINE IN 10 ADULT AUSTRALIANS HAVE AT LEAST ONE RISK FACTOR AND ONE IN FOUR HAVE THREE OR MORE RISK FACTORS.
Recognising heart attack
It is important to note that warning signs of heart attack vary from person to person and may not always be sudden or severe:
• Pain, pressure, heaviness or tightness in your o Jaw

319
o Neck o Shoulder(s) – spreads from chest to shoulder and upper arm. o Chest – the most common symptom. Feels like a crushing sensation. o Back – dull ache between shoulder blades o Arm(s)
• Other symptoms to watch out for include:
o Nausea o Dizziness o Cold sweat o Shortness of breath

320
Appendix 10 – Diabetes information
WHAT IS DIABETES?
Diabetes is a chronic condition that lasts a lifetime. Our bodies convert glucose from food into energy through the action of a hormone called Insulin. In diabetes, this hormone is either no longer produced or not produced in sufficient quantities by the body. This results in the body being unable to convert glucose to energy, resulting in high blood glucose seen in diabetes.
TYPES OF DIABETES
There are three types of diabetes:
• Type-1 Diabetes
• Type-2 Diabetes
• Gestational Diabetes
Type-1 Diabetes
In this type of diabetes, the pancreas, which is the organ responsible for producing insulin stops making insulin. This causes the body to burn fats for energy, with accumulation of dangerous chemical byproducts in the body, which can be potentially life-threatening.
This type of diabetes accounts for 10-15% of all cases of diabetes, and typically occurs in people under 30 years of age, but can occur at any age.
Symptoms of Type-1 Diabetes:
• Being excessively thirsty
• Passing large amounts of urine • Feeling tired and lethargic all the time • Always feeling hungry • Unexplained weight loss Type-2 Diabetes The most common form of diabetes, affecting 85-90% of people with diabetes. Affects older adults mostly. Some insulin is produced but the amount is insufficient and does not work effectively to convert glucose to energy. There is a strong genetic predisposition for Type-2 diabetes.
Symptoms of Type-2 Diabetes:
• Being excessively thirsty

321
• Passing large amounts of urine • Feeling tired and lethargic all the time • Always feeling hungry • Gradual weight gain Gestational Diabetes This is seen in pregnancy and is a reversible cause of diabetes once the pregnancy is over.
Management of Diabetes
There is currently no cure for diabetes.
Type-1 diabetes is managed by maintaining a healthy lifestyle, including healthy diet and exercise, regular blood glucose testing and regular insulin injections for life.
Type-2 diabetes can be managed initially through lifestyle modifications, including healthy diet and exercise, and as the disease progresses, through medications and insulin.
Gestational diabetes is simply managed by adopting a healthy diet plan and regular exercise. Some women with gestational diabetes will require insulin treatment.
How do I know if I have diabetes?
Start by filling out the attached “Australian Type-2 Diabetes Risk Assessment Tool”. If you score 12 or more in the risk assessment tool, you may have undiagnosed type-2 diabetes. See your doctor and get a fasting blood glucose test done.
Tips to stay healthy
Healthy eating tips
• Eat 3 regular meals each day • Have at least 2 medium pieces of fruit each day • Have at least 5 serves of (1 serve = 1/2 cup cooked or 1 cup salad)
vegetables each day • Avoid deep-fried foods • Use skim or low fat milk/milk products • Minimize lollies, chocolates, biscuits and pastries • Minimize processed snack foods e.g. crisps and chips • Drink water for thirst
Regular physical activity tips
• At least 30 minutes of moderate intensity physical activity on most,

322
preferably all days of the week. Can be done in short 10-15 minutes sessions.
• Moderate intensity is any activity that noticeably increases your breathing and heart rate.
• Aerobic exercise makes you breathe harder and increases your heart rate. Examples include brisk walking, cycling and swimming.
• Resistance exercise improves muscle strength. Examples include free weights.

323
Appendix 11 – Fluid frequency questionnaire For each of the drinks listed, indicate how often you drank them over the last month with a √. Take into account the amount indicated, so for example, if you drink one cup (approximately 250ml) of milk per day (thinking about milk on cereals and used in tea/ coffee), tick ‘1 per day’; if you drink 2 cups, tick ‘2-3 per day’.
Drink Type
Amount
Number of times drank this amount over last month Never 1-3 per
month 1 per week
2-4 per week
5-6 per week
1 per day 2-3 per day
4-6 per day
6+ per day
Fruit juice 1 cup Soft drink 1x375 ml can Low calorie soft drink 1x375 ml can Cordial, made with water 1 cup Low calorie cordial, made with water 1 cup Sports drinks (e.g. Gatorade, Powerade) 1x600 ml bottle Energy drinks (e.g. V, Red Bull) 1x250 ml can Coffee 1 cup Tea 1 cup Iced tea 1x500 ml bottle Water 1 cup Flavoured milk 1 cup Regular milk 1 cup Reduced fat / skim milk 1 cup Full strength beer (heavy) 1 stubbie/schooner Mid strength beer 1 stubbie/schooner Light beer 1 stubbie/schooner White wine 1 wine glass Red wine 1 wine glass Spirits (e.g. whiskey, rum) 1 nip/shot Sherry or Port ½ wine glass

324
Appendix 12 – Hydration feedback
Hydration Status Results
Staying hydrated is easy…
# Urine
Colour*
Urine Specific Gravity
Shift start
Shift end Hydration level
1 1.001 – 1.005 □ □
Good 2
1.006 – 1.010 □ □
3 1.011 – 1.015 □ □
4 1.016 – 1.020 □ □
Fair
5 1.021 – 1.025 □ □
Poor
6 1.026 – 1.030 □ □
Very Poor
7 1.031 – 1.035 □ □
Clinical
Dehydration
8
≥1.036 □ □

325
Appendix 13 – Hydration status charts
Chart before intervention
Chart after intervention

326
Appendix 14 – Hydration and its importance
Introduction
• Water is important for life. It is easy to overlook this in a busy work environment.
• Good hydration is essential for workers' health and safety. • 2-3 litres of water needs to be consumed during a work shift in a normal
environment. • Working in hot environments requires consumption of up to 5 litres of
water per day depending on how hydrated you start your shift. • You cannot rely on thirst to know you need to drink water. When you feel
thirsty you are already dehydrated.
Signs of dehydration
• Headaches, light-headedness, dizziness, irritability, tiredness all of which can decrease mental performance.
• Dry mouth, throat, eyes and skin. • Urine volume will be reduced and will be darker than usual. • Good hydration prevents headaches and bad breath and improves
concentration, mental/physical performance and helps maintain a healthy body weight.
Did you know?
Drinks containing Caffeine such as Coffee, Cola based soft drink, Energy drink and Sports drink and Alcohol can have a dehydrating effect on the body. These drinks are therefore not as helpful for rehydration.
What to do?
• DRINK WATER. Water is the best quencher for thirst and rehydrates faster than any other liquid.
• Drinking water mixed with additives such as flavouring agents or electrolytes should be considered as a supplement to drinking water and not a replacement.

327
Urine test results from initial survey of the ongoing healthy miner study at Barrick CGM
• At the start of the study, more than half of the 141 participants at CGM came to work dehydrated (74 out of 141 people).
• Outdoor/field workers had the greatest risk of arriving at work already at risk of dehydration (44 out of 75 people), although almost half of those who worked indoors (23 out of 51 people), or those working in a mix of indoors and outdoors tasks (7 out of 15 people) were also at risk.
Recommendations
Drinking water
1. Drink at least 1 litre of water before the start of your shift. 2. Try to refrain from drinking soft drinks, energy drinks, alcohol or coffee for
12-24 hrs before your shift. 3. Drink up to 1 cup of water every hour during your shift. 4. Drink as much water as you can at the end of your shift. 5. Workers who come to work hydrated need to consume 1½ - 3 Litres of
water to stay hydrated. 6. Workers who come to work dehydrated need to consume 4 - 5 Litres of
water to become hydrated by the end of their shift.
At work
1. If you are working outdoors on a hot summer’s day, take a bottle of water with you and drink at least 1 cup every 15 minutes.
58.7
45.141.3
54.9
0
10
20
30
40
50
60
70
Field workers Office workers
Percentage
Figure 1 - Hydration status of participants by work group
Dehydrated
Hydrated

328
2. Report any feelings of headaches and dizziness to your supervisor immediately and start drinking water as soon as you are relieved to rest.
3. Remember to carry water with you at all times. 4. Keep hydrated during your shift (drink frequently). 5. Eat fruit during your break. 6. Use the urine colour charts located in all toilets / noticeboards to get an idea
of your current hydration status and drink water to keep yourself within the "Good" or "Fair" hydration level.

329
Appendix 15 – Hydration and heat stress information
Introduction
• Heat stress of an individual can be created as a result of a number of factors such as excessive exposure to heat, increased workload & clothing which, individually or combined may lead to a number of heat-related illnesses.
• Heat stress related illnesses range from mild conditions like prickly heat to life-threatening conditions like heat stroke.
• Everyone is at risk of heat-related illnesses but certain people are at greater risk: obese people, unacclimatised and dehydrated outdoor workers and people with chronic diseases such as diabetes or heart failure, or patients on medications.
• Good hydration is essential for working in hot environments. • 2-3 litres of water need to be consumed during a work shift in a normal
environment. • Working in hot environments requires consumption of up to 5 litres of
water per day depending on how hydrated you start your shift. • You cannot rely on thirst to know you need to drink water. When you feel
thirsty you are already dehydrated.
Identifying heat stress related illness
• Heat rash – itchy and painful skin rash • Heat cramps – painful muscle cramps affecting various parts of the body • Heat syncope (fainting) – starts with light-headedness, dizziness and finally
fainting • Heat exhaustion – most common in dehydrated persons. Characterised by
clammy moist skin, weakness or extreme fatigue, nausea, headache, low blood pressure and weak pulse. May be a lead-up to heat stroke.
• Heat stroke
Signs of dehydration
• Headaches, light-headedness, dizziness, irritability and tiredness, all of which can decrease mental performance
• Dry mouth, throat, eyes and skin • Urine volume will be reduced and will be darker than usual.

330
• Good hydration prevents headaches and bad breath, improves concentration and mental/physical performance, and helps maintain a healthy body weight.
What to do?
• DRINK WATER. Staying hydrated reduces your risk of developing any heat stress related illness.
How hydrated are you?
• Use the urine charts provided to roughly check how hydrated you are before commencing work in the heat.
• Coming to work hydrated, especially during summer months, is the best way to start your day.
• Urine test results from initial survey of the ongoing healthy miner study at Barrick CGM showed that outdoor/field workers had the greatest risk of arriving at work already at risk of dehydration, putting them at a higher risk of heat stress related illness.
Recommendations
Drinking plenty of water 1. Drink water to the point where your urine is light-yellow colour. 2. Limit your consumption of soft drinks, energy drinks, alcohol or coffee, as
these drinks provide unnecessary calories and may promote diuresis, (passing lots of urine) which can contribute to dehydration.
3. Drink up to 1 Litre of water for every hour you work outdoors in the heat. 4. Drink as much water as you can at the end of your shift. 5. Workers who come to work hydrated need to consume 1½-3 Litres of water
to stay hydrated. 6. Workers who come to work dehydrated need to consume 4-5 Litres of
water to become hydrated by the end of their shift.
During work 1. Report any feelings of headache and dizziness to your supervisor
immediately, and start drinking water as soon as you can. 2. Remember to carry water with you at all times.
Other 1. Wear light under-clothing to help evaporation of sweat. 2. Use strong sunscreen, as sunburn limits the body's ability to cope with heat.

331
Appendix 16 – Hydration & fluid guidelines information
Introduction • One of the best things you can do to help prevent heat-related illnesses is to stay
well hydrated by drinking more fluids (e.g. water). • Dehydration affects your physical performance (e.g. ability to carry out physical
work), mental and cognitive functions (your ability to think properly) and also increases fatigue.
• You cannot rely on thirst to know you need to drink water. When you feel thirsty you are already dehydrated.
Fluids available for consumption Drink type Positives Negatives
Water
• Plain water is one of the quickest fluids to be absorbed by the body
• It is freely available and safe • It is the cheapest fluid available
• Does not contain energy
Electrolyte fluids e.g. sports drinks, Gatorade, Powerade
• Provide energy (calories) • Provide electrolytes • Taste good, so you are likely to
drink more of it
• Excessive use (high calorie intake) may predispose to weight gain and electrolyte imbalance
Carbohydrate (energy) fluids e.g. fruit juice, Red Bull
• Provide energy (calories) • Taste good, so you are likely to
drink more of it
• Slow absorption compared with water
• Excessive use (high calorie intake) may predispose to weight gain
Caffeine and alcohol- containing fluids e.g. coffee, tea, Red Bull, beer
• Provide energy (calories) • Can increase non-sweat body-fluid loss through diuresis (increased urine production) particularly when consumed at rest
• Not recommended for fluid replacement
• Excessive intake can result in nervousness, insomnia, stomach upset, tremors and palpitations (racing heart)
Carbonated fluids e.g. sodas and other fizzy drinks
• Provide energy and potassium • Diet drinks have no energy and
is thus preferable to sugary carbonated beverages.
• Can cause belching • Increased risk of dental
cavities with sugary carbonated beverages.

332
Fluid consumption guidelines • FOR WORK IN THE HEAT LASTING LESS THAN 90 MINUTES
o Fluid requirements can be met by drinking adequate amounts of WATER alone.
• FOR WORK IN THE HEAT EXCEEDING 90 MINUTES BUT LESS THAN 240 MINUTES (4 hours)
o In addition to WATER, consideration should be given to the inclusion of CARBOHYDRATE-containing fluid of less than 7 g/100ml concentration (see column 2 in table 1 below).
• FOR WORK IN THE HEAT EXCEEDING 240 MINTUES (4 hours) o In addition to WATER and CARBOHYDRATE-containing fluid,
ELECTROLYTE-containing fluid, which includes sodium (20-30 mmol/L) and trace potassium (5 mmol/L) should be included to replace those lost in sweat.
Table 1 - Approximate composition of different fluids Carbohydrate
(g/100mL) Energy
(KJ/100mL) Sodium
(mmol/L) Potassium
(mg/L) Caffeine
(mg/100mL) Aim for (4-7) (10-25)
Water 0 0 0 0 0 Diet Pepsi 0 0 4.4 93.1 10.1 Pepsi Max 0 0 4.8 101.5 19.4 Coke Zero 0.1 1.4 4.8 124 9.5 Diet Coke 0.1 1.5 6.5 136 12.7 Percolated Coffee * 0 2 0.9 490 45.4 Espresso * 0 4 6.1 1150 212 Green Tea * 0 5 1.3 270 10.6 Black Tea * 0.3 6 1.3 370 17.8 Powerade Zero 0.1 6.8 22 0 0 Instant Coffee * 0.3 10 1.7 300 24.1 Decaf Coffee * 0.4 10 1.7 360 1 Mother sugar free 0.1 19 21 0 31.8 Hydralyte 1.6 23.2 45 20 0 Aqualyte 3.7 61 12 120 0 Gatorade 6 103 21 230 0 Fruit juice (Orange) 5.5 115 1.3 1500 0 Powerade Isotonic 7.3 129 12 141 0 Pepsi 11.7 175 4 25.4 10.7 Coca Cola (Regular) 11 180 5.98 0 9.6 Mother 10.1 190 21 0 32 Red Bull (Original) 11 192 37.5 0 32 Mountain Dew 13 200 7.4 16.9 15.2 Chocolate Drink * 10.7 227 39.6 790 2.1 Lucozade Sport Body Fuel Drink
6.4 298 20.5 90 0

333
*(unsweetened) (Source: www.nutritiondata.self.com & www.calorieking.com.au)
What you can do to stay hydrated
• Pre-shift – Pre-hydrating yourself with fluids should be initiated at least 2 hours before starting your shift to enable fluid to be distributed evenly in your body and allow urine output to return toward normal levels.
• During shift – Each individual's ability to consume fluids differs. You should aim to consume at least 600 ml to 1 L of fluid every hour.
• Post-shift – If time permits during the shift, consumption of normal meals and beverages will restore the normal state of body water, provided you have been consistently drinking fluids during your shift. Otherwise, drinking at least 1.5 L of fluid after your shift should start the recovery process towards the normal state of body water.
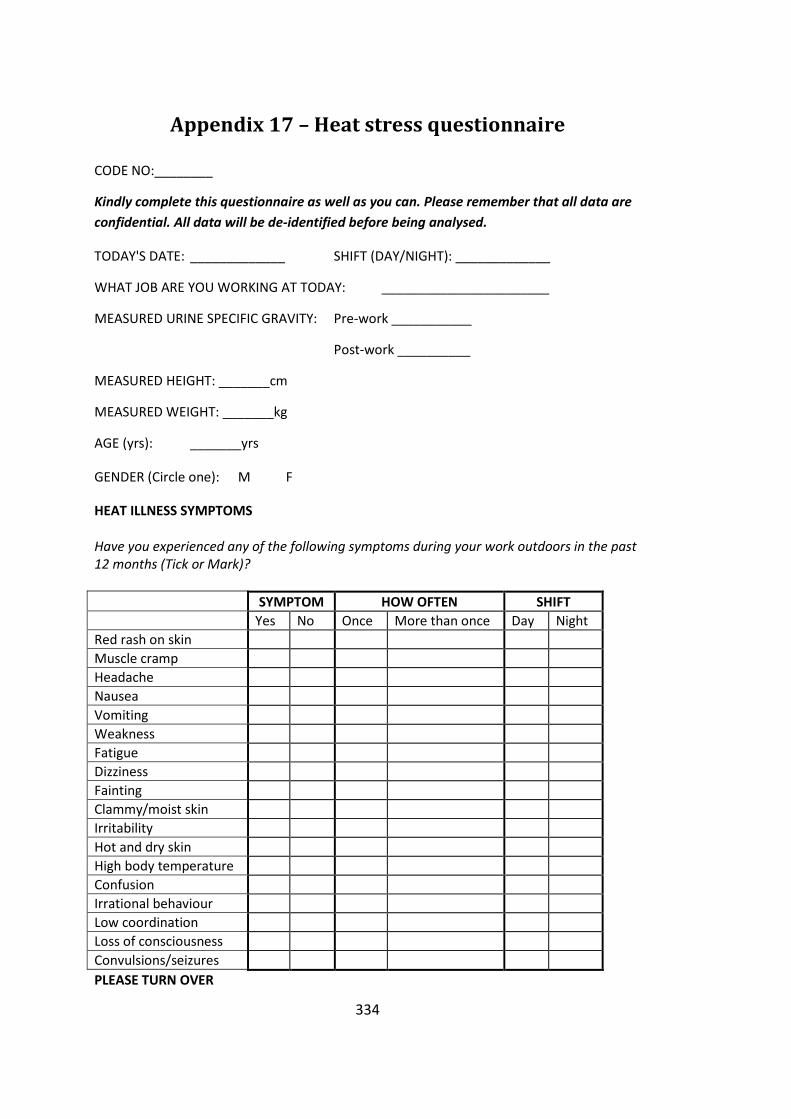
334
Appendix 17 – Heat stress questionnaire
CODE NO:________
Kindly complete this questionnaire as well as you can. Please remember that all data are confidential. All data will be de-identified before being analysed.
TODAY'S DATE: _____________ SHIFT (DAY/NIGHT): _____________
WHAT JOB ARE YOU WORKING AT TODAY: _______________________
MEASURED URINE SPECIFIC GRAVITY: Pre-work ___________
Post-work __________
MEASURED HEIGHT: _______cm
MEASURED WEIGHT: _______kg
AGE (yrs): _______yrs
GENDER (Circle one): M F
HEAT ILLNESS SYMPTOMS Have you experienced any of the following symptoms during your work outdoors in the past 12 months (Tick or Mark)?
SYMPTOM HOW OFTEN SHIFT Yes No Once More than once Day Night Red rash on skin Muscle cramp Headache Nausea Vomiting Weakness Fatigue Dizziness Fainting Clammy/moist skin Irritability Hot and dry skin High body temperature Confusion Irrational behaviour Low coordination Loss of consciousness Convulsions/seizures PLEASE TURN OVER

335
HYDRATION
Q1. Was drinking water freely accessible during your work outdoors? □1 Yes □2 No
Q2. How often did you drink water during your work outdoors? _______ Times Q3. How many cups of water did you drink during your work outdoors? (1 cup = 250ml
or a household tea cup, 1 average bottle of water = 1.5 cups) _______ cups
Q4. What other fluids did you consume during your work outdoors?
□1 Tea/Coffee □2 Soft drinks e.g. Coke □3 Sports drink e.g. Gatorade
□4 Energy drink e.g. Mother or V □5 Other ___________
Q5. How often did you urinate during your work outdoors? _______ Times
ENVIRONMENT
Q1. How would you describe the temperature of the outdoor work environment you worked in today?
□1 Very hot □2 Hot □3 Warm □4 Neutral □5 Cool □6 Cold □7 Very cold
Q2. Did you feel that it was dry or humid? □1 Dry □2 Humid
Q3. In the last week, how many hours did you work out in the sun? ________hrs Q4. I am wearing the following clothes today: (Tick all that apply)
Briefs □1 Short-sleeved shirt □5 Overalls □9 Boots □13
Sleeveless shirt □2 Long-sleeved shirt □6 Hard hat □10 Gloves□14
T-shirt □3 Shorts □7 Socks (regular) □11 Singlet□15
Eye protection □4 Trousers □8 Thick long socks □12 Belt □16
High-visibility vest □17 Reflective jacket □18 Waterproof jacket □19
Q5. What part of your body did you use most during the course of your work today? (Tick all that apply)
□1 Hand/wrist/fingers □2 Upper arm □3 Shoulder □4 Back
□5 Torso □6 Lower limbs □7 Ankles/foot Q6. How many breaks did you take during your work today?
□1 1 □2 2 □3 3 □4 4 □5 5 or more Q7. How long were you working out in the sun today? _______ hours
THANK YOU FOR TAKING THE TIME TO COMPLETE THIS QUESTIONNAIRE

336
Appendix 18 – QuestTemp 36 calibration certificate
NOTE: Model incorrectly labelled as QT34.

337
Appendix 19 – CALOR calibration certificate

338
Appendix 20 – Food Diary decisions spreadsheet
Food Item FoodWorks Name Volume / Measure
Foodworks Volume
General Notes
1/2 cup milk & Nutrigrain (plate full) KELLOGGS NUTRI-GRAIN (2 cups) + Milk,cow,fluid,regular fat (~3.5%) (70 mL)
Plate-full w/ 1/2 milk
0.5 cup milk + 2 cup Nutrigrain
2-minute noodles Soup,Asian style,w noodles,instant dry mix,cup style,reconstituted w water (75 g) + water, tap (1 cup)
Apple Apple,red skin,unpeeled,raw 1 apple 1 medium (6-8cm dia)
Apple cider (alcoholic) Cider,apple,non-alcoholic (no alcoholic option?? Should I put beer instead to make up calories from alcohol?)
Bacon & Egg roll Sandwich,white bread,tablespread,egg & bacon,toasted
Bacon Bacon,cooked,nfs (0.25 cooked, diced)
Bacon Pieces Bacon,breakfast rasher,fried,olive oil 2 pieces 2 rashers
339
Baked rice, sugar, milk, egg, peas
Rice,white,boiled without added salt (0.15 cup) + Sugar,white,granulated/lump (0.15 cup)+ Milk,cow,fluid,regular fat (~3.5%) (0.15 cup) + Egg,chicken,whole,cooked,nfs + peas (0.15 cup) C158
Banana Banana,cavendish,peeled,raw 1 Average 1 Medium
Banana Bread - Banana, Flour, Sugar Banana,cavendish,peeled,raw (0.5 medium) + Flour,wheat,white,plain (0.25 cup) + Sugar,brown (0.125 cup (packed)
Banana Bread (from café) Cake,banana,uniced,homemade (1 piece - 1/10 of loaf)
Basmati rice Rice,white,boiled with added salt Beans Bean,green,fresh,boiled,drained
Beef patties fried Burger patty/rissole,beef,commercial,grilled/fried without oil/fat (2 pqtties)
Beef rump Beef,rump steak,lean,grilled Beef sausages Sausage,beef,grilled 2 2 sausage (nfs)
Beef Stew (onion, carrot, potato, beef) 2.5 cup
Beef,stewed,nfs (1 cup) + Onion,mature,peeled,boiled/steamed,nfs (0.5 onion) + Carrot,mature,peeled,boiled,drained (0.5 cup) + Potato,boiled,drained,nfs (0.5 potato)

340
Beef strips Beef,stir-fry strips,lean,fried,ns oil Beer (coopers pale ale) Beer,lager Beer VB Beer,lager Beer XXXX gold Beer,lager Beetroot salsa Sauce,salsa,tomato-based Berri Orange & Guava juice BERRI JUICE ORANGE MANGO
Black tea (no sugar) Tea,regular,no milk,brewed from leaf/teabags
Block of Chocolate CADBURY CHOCOLATE MILK FRESH (200 g)
Boccocini Cheese,mozzarella (1 ball = 1 tb?) Bottle of water Water,bottled,non-sparkling Bread - white (Helgas) HELGAS TRADITIONAL BREAD WHITE Bread Bread,from white flour
Bread crumbs Bread,from white flour,toasted (0.5 cup cubes)
Broccoli Broccoli,fresh,boiled,drained 1 cup 1 cup (flowerets) Broccolini Broccoli,fresh,boiled,drained
Brownie Brownie,chocolate,with nuts,homemade
Butter Butter, salted Cake Cake,homemade,nfs
Calamari rings (Baked) Squid/calamari,crumbed,frozen,baked
Can Coke (1.5) & Jim Beam (80 mL) Alcoholic soda,bourbon & cola based (650 ml)

341
Cappacino Coffee,from ground coffee beans,espresso style,no milk + Milk,cow,fluid,regular fat (~3.5%) (50 mL) 400 ml & 1 cup
60 mL (espresso) 340 mL (milk, regular fat) & 60 mL espresso , 190 mL milk
Carrots Carrot,mature,peeled,boiled,drained 0.5 cup 0.5 cup (sliced fr fresh)
Cashews, multigrain and soy snack mix Nut,cashew,raw (15 g ) + Soya beans dried (15 g)
Casserole,homemade,lamb & Begetable,in tomato based sauce
Lamb,casserole cut,semi-trimmed,stewed + Mixed vegetables,frozen,broccoli & carrot & corn,cooked
Sauce,pasta,tomato-based,commercial,heated
Cauliflower Cauliflower,boiled,drained
Centrium Advance Multivitamin & mineral,tablet,nfs (1 tablet = 1 dose on FoodWorks)
Cheese Cheese,nfs Slices (pre-packed)
Cheese sauce (Restaurant and home) Sauce,cheese,made with butter & milk,home-prepared
Chicken & cheese toasted sandwich Bread,from white flour,toasted + Chicken,breast,lean,baked + Cheese,cheddar,processed
Chicken & veg soup Soup,chicken & vegetable,homemade,prepared w water

342
Chicken & vegetables (medium) Chicken,baked/roasted,nfs (150 g) + Mixed vegetables,frozen,boiled/microwaved,drained ( 1 cup)
Chicken alfredo Sauce,pasta,cream-based,added chicken
Chicken alfredo with penne pasta Sauce,pasta,cream-based,added chicken + Pasta,white wheat flour based,boiled from dry,no added salt
Chicken fillet, grilled Chicken,breast,lean,grilled/BBQ 2 fillets 2 medium breast Chicken schnitzel Chicken,breast,lean,crumbed,fried,olive oil
Chicken stock Stock,chicken,liquid,commercial Small amount ?? = 0.25 cup?
Chips Crisp/chip,potato,flavoured 50 g 50 packet (50g) Chips (restaurant) Potato,chips,deep fried,salted,from take-away outlet
Choc Bavarian Cheesecake Cake,cheesecake,chocolate flavour,biscuit base,cream cheese topping
Chocolate CADBURY CHOCOLATE MILK FRESH (2 tsp) 2 2 tsp Chocolate coated bullets Licorice,milk chocolate-coated 2 handfuls 0.5 cup Chocolate Marshmallow Marshmallow,chocolate & coconut-coated (snowball)
Chupa - chup Sugar confectionery,hard varieties (1 piece)

343
Coffee (Nescafe espresso) Coffee,from ground coffee beans,espresso style,no milk
Coffee Macona White No sugar Coffee,from instant coffee powder,w full fat milk
Coffee Nescafe 3 shots (1 cup) Coffee,from instant coffee powder,no milk (180 mL) + Milk,cow,fluid,regular fat (~3.5%) (70 mL)
Continental chicken curry pasta Pasta in cream based sauce,dry mix (90 g) + Milk,cow,fluid,regular fat (~3.5%) (190 mL) + water (250 ml)
Coon grated cheese Cheese,cheddar,processed
Coon tasty lite Cheese,cheddar,processed,reduced fat (<10% fat)
Cordial Cordial,less than 25% fruit juice,recommended dilution
Corn Sweetcorn,frozen,boiled,drained
Corn flakes Breakfast cereal,flakes of corn,unfortified
Cream (dessert) Cream,regular thickened,35% fat 1 spoon 1 tbs Crumbed cutlet Lamb,frenched cutlet/rack,lean,grilled
Cup of Cappacino Coffee,from espresso coffee,regular fat milk,ice & sugar,iced coffee style (60 mL) + Milk,cow,fluid,regular fat (~3.5%) (50 mL)

344
Cup of Coffee Coffee,from instant coffee powder,w full fat milk
Cup of Milo Beverage,chocolate flavour,from base (Milo brand),w ns milk & water
Cup of Tea Tea,regular,no milk,brewed from leaf/teabags (1 mug)
If they haven't specified a volume - I have assumed one cup and have done roughly 1:3 ratio of milk to water
Cup of Tea (green) BASKIN & ROBBINS DELUXE GREEN TEA (2 scoops) + Water,tap (250 ml)
Cupcake Cake,cupcake,iced,commercial
Curry chicken (BBQ chicken, curry hot pot + veg)
CONTINENTAL CREAMY CHICKEN CURRY (30G) + Chicken,breast,lean,grilled/BBQ + vegetables
Curry chicken packet Chicken,curry,prepared w curry powder,onions & stock
Decaf Coffee Coffee,from instant coffee powder,w full fat milk,decaffeinated
Deep fry chips Potato,chips,deep fried,salted,from take-away outlet
Dim Sim (baked) Dim sim,meat & vegetable filling,microwaved

345
Dragon Fruit Fruit,fresh,nfs
Drink wine & coke zero Wine,red (425 mL) + Soft drink,cola flavour,intense sweetened (375 mL) 800 mL
(assumed can of coke zero) - 425 mL red wine + 375 can of coke zero
Drumstick ice cream NESTLE DRUMSTICK VANILLA Egg noodle Noodle,boiled,nfs Eggs Egg,chicken,whole,cooked,nfs
Fish oil capsule Fish oil,capsule formulation,nfs (1 dosage unit)
Freedom Foods gluten free muesli bar Bar,muesli,breakfast,fruit/snack style,nfs
Fruit bar Bar,muesli,plain/with dried fruit Gingerbread men Gingerbread,iced (2 biscuits) Grain bread Bread,mixed grain,toasted 2 pieces 2 slices Grapes Grape,raw,nfs (6 grapes (seedless) Gravy Gravy,commercial,prepared
Grilled steak Beef,t-bone steak,untrimmed,grilled 1 Large 250 g
Ham cheese, tomato toasted sandwich Sandwich,white bread,tablespread,ham,cheese & tomato
Ham sandwich Bread,from white flour (2 slice)+ ham, leg, non-canned, lean (1 slice)
Hamburger Hamburger,plain (beef pattie w lettuce,tomato,onion,sauce),takeaway style

346
Hawaiian Pizza PIZZA HUT,PAN,HAWAIIAN,SLICE (93 G)
Hearty Roast chicken cup soup (continental) Soup,chicken & vegetable,instant dry mix,cup style 1 sachet 75 g
Herbal tea Tea,herbal other than chamomile,no milk (1 mug)
Homemade chutney Chutney/pickle,fruit,intense sweetened 1 spoon 1 tbs
Homemade sukiyaki She attached a recipe so I put them into FoodWorks (she had 1.5 cup and I put 375 g into FoodWorks)
Honey soy chips RED ROCK DELI CHIPS (FLAVOUR NOT REQUIRED) 1 handful 0.5 cup
Horlicks Malk Drink Beverage base,malted milk powder,w added vitamins A,B1,B2 & D 1 mug 1 cup
Hot Chocolate Beverage,drinking chocolate,from chocolate powder,w full fat milk
Hungry Jacks Angry Burger HUNGRY JACKS,BURGER,WHOPPER WITH CHEESE (294 G)
Hungry Jacks Angry Onions HUNGRY JACKS,ONION RINGS,REGULAR (94 G)
Hungry Jacks coke HUNGRY JACKS,SOFT DRINK,COKE,NO ICE,REGULAR (454 ML)
Ice cream vanilla IGA signature Ice cream,regular fat,vanilla & other non-chocolate flavours

347
Iced coffee Coffee,from espresso coffee,regular fat milk,ice & sugar,iced coffee style
Indian curry with beef Beef,curry,vindaloo,Indian restaurant style
Jalapeno Chilli (chili),green,raw Jam Jam,plum,preserve
Jim Beam & Cola Can Alcoholic soda,bourbon & cola based
Juice Juice,orange,added vitamin C Just Right KELLOGGS JUST RIGHT CEREAL Lamb Lamb,cooked,nfs Lamb chop Lamb,chump chop,lean,grilled Lean cuisine LEAN CUISINE NZ HOKI MEAL (180G)
Lean Cuisine lamb + Rosemary Hot Pot Potato,peeled,boiled,mashed,nfs + Lamb,cooked,nfs + Carrot,mature,peeled,boiled,drained + Pea,green,frozen,boiled,drained
Leg ham Ham,leg,non-canned,lean Light yoghurt + blue berry SKI D/LITE BERRY TWIST YOGHURT
Low fat fruit & nut meusli Muesli,homemade,untoasted,added nuts,seeds & dried fruit
Macchiato coffee (1 cup) Coffee,from espresso coffee,regular fat milk,ice & sugar,iced coffee style (60 mL) + Milk,cow,fluid,regular fat (~3.5%) (50 mL)
1 cup 60 mL (espresso) 50 mL (milk, regular fat

348
Manderin (Medium) Mandarin,peeled,raw,nfs
Margarine (black & gold) BLACK & GOLD SPREAD MONOUNSAT
Mashed Potato Potato,peeled,boiled,mashed,ns milk & butter,nfs 1 cup 500 g Melting moment GRIFFINS MELTING MOMENTS Milk Milk,cow,fluid,regular fat (~3.5%) Milk (lite IGA signature) WOOLWORTHS MILK LITE FRESH Milk (whole) Devondale DEVONDALE FULL CREAM FRESH
Mixed vegetables Stir-fry,mixed vegetable (capsicum,carrot,snow pea,bok choy & onion),w rice & soy-based sauce,no oil
Mongolian sauce Sauce,black bean,Asian,commercial Mrs fields pasta salad Pasta,salad,with vegetables
Muesli Muesli,homemade/commercial,bircher
Muesli bar (Be natural - berry) BE NATURAL ALMOND APRICOT BAR (40G)
Other options just contained nuts
Mushroom gravy Sauce,mushroom Naan bread Bread,naan,Indian restaurant style
Nescafe Cappacino Sachet Coffee,from ground coffee beans,espresso style,no milk (1 shot) + 200 ml water
Nutrigrain & milk (medium) KELLOGGS NUTRI-GRAIN (1 cup) + milk reg fat (1 cup)

349
Nuts mixed Nuts,mixed (peanut,cashew,hazelnut,brazil nut)
Oil & butter Oil,nfs (0.5 tsp) + Butter,salted (0.5 tsp)
Omelette Omelette,chicken egg,cooked with fat
Orange Orange,navel (all varieties),peeled,raw 1 1 medium Orange & poppy seed dressing Dressing,commercial,nfs (20 mL) Orange juice Juice,orange,added vitamin C Orange juice (25% strength) Fruit drink,25% orange juice
Osso Buco (Large)
Veal,leg steak,untrimmed,stewed/casseroled + Carrot,mature,peeled,boiled,drained (0.5 cup) + Celery,stir-fried without oil (0.5 cup) + Potato,peeled,boiled,mashed,nfs (0.5 cup) + sprouts (0.5 cup) + gravy (0.5 cup)
Oysters Oyster,raw
Packaged Fruit cake Cake,fruit,rich style,uniced,commercial 2 small pieces 2 piece (1/10 of 19x7x6cm)
Palm sugar sugar, brown
Pasta - gluten free Pasta,wholemeal wheat flour based,boiled from dry,no added salt

350
Pasta - wholemeal Pasta,wholemeal wheat flour based,boiled from dry,no added salt
Pear Pear,unpeeled,raw,nfs Peas Pea,green,fresh,boiled,drained
Pepsi max Soft drink,cola flavour,intense sweetened
Pie - mrs macs Pie, meat 1 pie 210 g Piece of Fish (Baked) Fish,fillet,frozen,glazed & flavoured,baked 1 piece 1 Fillet
Piece of fish and chips Fish,fillet,frozen,glazed & flavoured,baked(1 fillet), Potato,chips,homemade - fresh/frozen,fried,olive oil (50 g)
Piece of Steak & Mushrooms Beef,t-bone steak,untrimmed,grilled (400 g) + Mushroom,stir-fried,olive oil (100g) Large 250 g steak & 100
g mushrooms
Pies (chicken + mexican) Pie,chicken,baked
Pizza, pepperoni, tomato base (at pub) Pizza,pepperoni topping,tomato sauce,thick base,chain style
Plain yoghurt Yoghurt,natural,regular fat (~4%) 3 spoon 3 tbs Porridge w/ milk no sugar Porridge,rolled oats,made with full fat milk 1 bowl 2 cups Potato (baked) Potato,baked without oil,nfs

351
Potato (boiled) Potato,peeled,boiled,drained,nfs
Have put 1 cup of peas, carrots, pumpkin - put 0.66 of a cup in Foodworks for each vegetable
Potato/pumpkin mashed Pumpkin,peeled,boiled,drained,nfs (1 cup mashed) + Potato,peeled,boiled,mashed,nfs (1 cup)
Prawn - 5 medium Prawn,school,flesh only,purchased cooked 5 medium 7 g
Pro-active Margarine FLORA PRO ACTIV MARG
He did not specify grams on the 2nd day (#7) so I put the same amount he noted on the first day (10g)
Profiterole Bun,no dried fruit,iced,with mock cream?
Pumpkin Pumpkin,butternut,peeled,boiled,drained 1 cup peas, carrots, pumpkin 0.66 cup pumpkin
Pumpkin soup Soup,pumpkin,homemade Raisin Bran (Kelloggs) KELLOGGS SULTANA BRAN
Red onion Onion,mature,white skinned,peeled,raw

352
Rice (Baked) Rice,white,boiled without added salt
Rice Crackers Biscuit,savoury cracker,rice
Rissole Burger patty/rissole,beef,commercial,grilled/fried without oil/fat
Roast carrot Carrot,mature,peeled,baked without oil
Roast lamb Lamb,easy carve shoulder,untrimmed,baked/roasted
Roast pumpkin Pumpkin,peeled,baked without oil,nfs
Rolled Oats Oats,rolled,raw 1 serve
Roses chocolates Chocolate,dark,fondant/cream filled 2 pieces (nfs)
Salad Salad,caesar,no dressing
Salad (cheese, carrot, lettuce, red onion, cucumber
Cheese,nfs (0.2 cup) + Carrot,mature,peeled,boiled,drained (0.2 cup)+ Lettuce,iceberg,raw 0.2 cup + Onion,mature,white skinned,peeled,raw (0.2 cup) + Cucumber,common,peeled,raw (0.2 cup)

353
Salad roll - meat, tomato, cheese + lettuce
Bread roll,from white flour (1 roll lunch style), Meat,raw,nfs (80 g), Tomato,common,raw (2 slices), Cheese,nfs (1 slice pre-packed), Lettuce,iceberg,raw (0.5 shredded/chopped)
Salad Sandwich (chicken, tomato, cheese, lettuce)
Bread,from white flour (2 slice) + Chicken,cooked,nfs (1 medium slice) + Tomato,common,raw + 1 slice cheese, nfs + Lettuce,iceberg,raw (1 large leaf)
Salad wrap Wrap,flat white bread w crumbed fried chicken,salad & mayonnaise,fast food style
Salami Salami,nfs Salt Salt,table,non-iodised
Sandwich - tuna/egg w/ 2 slices brown bread
Bread,brown,from white & wholemeal flour + Tuna,canned,nfs (1 small can) + Egg,chicken,whole,cooked,nfs ( 1 med)
Sanitarium grain biscuit Biscuit,savoury crispbread,white & wholemeal wheat flour w grains & seeds
Satsuma Fruit,fresh,nfs Sausage Sausage,beef,grilled

354
Sausages and vegetables Sausage,beef,grilled + Mixed vegetables,frozen,boiled/microwaved,drained
Schweppes lemonade can Soft drink,lemonade,intense sweetened
Scotch & coke Alcoholic soda,bourbon & cola based
Scotch Steak Beef,fillet,scotch,lean,fried,olive oil
Seafood Salad Seafood,mixed,poached,w creamy dressing & lettuce 1 punnet 150 g?
Shallot Shallot,peeled,boiled 1 teas 0.5 serve (2 shallot bulbs)
Singapore noodles Chicken,stir fry,soy based sauce,hokkien noodle & mixed vegetables (1 serving)
Small seeve mashed potato Potato,peeled,boiled,mashed,nfs (1 small)
Solo soft drink lemon Soft drink,lemonade
Soup (packet) Soup,chicken noodle,instant dry mix,cup style
Spaghetti bolognese - small Spaghetti in meat sauce,canned
Spices/coriander Spice,mixed spice (cinnamon,nutmeg & cloves) + Coriander,fresh,leaves & stem
Spiral pasta Pasta,white wheat flour based,boiled from dry,no added salt

355
Steamed veg - cauliflower carrots brocc (1 packet)
Mixed vegetables (broccoli,cauliflower,carrot),w white sauce
Steamed veg - peas corn brocc beans (1 packet)
Pea,green,fresh,boiled,drained (75 g) + Sweetcorn,frozen,boiled,drained (75 g) + Broccoli,fresh,boiled,drained (75 g) +(Bean,green,fresh,boiled,drained (75g)
Sugar Sugar,white,granulated/lump
Suimin Bacon Cup Noodles Soup,chicken noodle,instant dry mix,cup style
Sun Rice Thai Green curry Chicken,curry,green,Thai restaurant style
Taziki Dip Dip,cucumber & yoghurt,Indian restaurant style
Tea with 3 equal tabs & UHT milk Tea,regular,no milk,brewed from leaf/teabags (150 ml) + FABULOUS FULL CREAM MILK UHT (100 ml)
Tea, milk, Sweetener (2 cups) Tea,regular,no milk,brewed from leaf/teabags (400 ml) + milk regular (100 ml) + Sweetener,powder,nfs (1 individual packet)
Tinned peaches - one peach Peach,canned in intense sweetened liquid,drained (75 g)

356
Tinned apricots & cream Apricot,canned in syrup,drained (150 g?) + Cream,regular thickened,35% fat ( 1 tb?)
Tinned chopped tomatoes Tomato,canned in tomato juice,nfs
Toast - White bread (Helga's) HELGAS CONTINENTAL TRADITIONAL WHITE BREAD TOASTED
Toasted ham sandwich Sandwich,white bread,tablespread,ham & cheese,toasted
Tomato Relish Relish, corn (only relish option)
Trail bar (Be Natural) BE NATURAL ALMOND APRICOT BAR (40G)
Tub of lite yoghurt (strawberry) PAULS FRUIT YOGHURT STRAWBERRY LITE
Tubs of Yoghurt Yoghurt,flavoured,nfs (2 Tub)
Tuna (in tomato & onion) Tuna,flavoured,canned in water,drained
Tuna (sweet chilli) Tuna,flavoured,canned in water,drained
Tuna (w lime & pepper) Tuna,flavoured,canned in water,drained
Tuna sandwiches Bread,from white flour (4 slice) + Tuna,canned,nfs (1 small can)
Tuna with hot chilli Tuna,flavoured,canned in water,drained
Veal Veal,cooked,nfs Water (everyone) Water,tap 2 glasses 2 cups

357
White Coffee No Sugar Coffee,from instant coffee powder,w full fat milk
Where they have put weight range - have used highest number in FoodWorks e.g. 100-150 g uses 150 g
White Coffee Triple Shot (1 cup) Coffee,from instant coffee powder,no milk (180 mL) + Milk,cow,fluid,regular fat (~3.5%) (70 mL)
White tea tea (200 ml) + milk, regular fat (50 ml)
Wine wine, nfs Wine Spritzer Wine,nfs + Water,carbonated/soda 3/4 cup 0.75 cup (cooked) Mince/Vege/Pasta Pasta,beef/vegetable filled,boiled,w tomato-based
sauce
Two fruits Fruit,fresh,nfs 1 fruit Biltong Beef jerky, all flavours
Hot Cross Bun Bun,with dried fruit,iced (finger bun)
Mentos Sugar confectionery,mint flavoured,hard & chewy
Chicken loaf (Steggles) Chicken,breast,lean,smoked

358
MIXED DISHES DECISIONS ON MIXED DISHES Cheese and cracked pepper chicken with pasta
Mixed vegetables,frozen,boiled/microwaved,drained 10% + Chicken,breast,lean,baked 40% + Cheese,cheddar (mild,tasty & vintage styles) 10% + Pasta,wholemeal wheat flour based,boiled from dry,no added salt 40% Pepper,ground,black/white
Carbonara pasta Pasta,white wheat flour-based,dry (regular pasta), Sauce,pasta,cream-based,added beef & ham
Commercial sandwiches, rolls, wraps and burgers As per FSANZ sandwiches, rolls, burgers and wraps measures program
Pasta in cream based sauce Pasta,white wheat flour based,boiled from dry,no added salt 60% + Sauce, nfs 40%
Pasta & sauce,tomato based Pasta,white wheat flour based,boiled from dry,no added salt 60% + Sauce,pasta,tomato-based,commercial,heated 40%
Soup,pea & ham,homemade Water 75% + Pea,green,fresh,cooked,no added fat 25% + Ham,leg,non-canned,lean 25%
Beef,casserole cut,untrimmed,stewed,no added fat
Beef,cooked,nfs 50% + Mixed vegetables,frozen,broccoli & carrot & corn,cooked 25% + Sauce, nfs 25%
Soup,meat & vegetable Water 75% + Mixed vegetables,frozen,broccoli & carrot & corn,cooked 12.5% + Beef,cooked,nfs 12.5% OR Chicken 12.5%
Meatballs,beef,lean,served w tomato-based prepared sauce Beef,mince,fried,ns oil,nfs 60% + Sauce,pasta,tomato-based,commercial,heated 40%
Thai Green Chicken Curry Chicken,breast,lean,stir-fried 30% + Rice,white,boiled with added salt 40% + capsicum 5% + green beans 5% + coconut cream 20%
Lasagne beef/chicken Pasta,white wheat flour based,boiled from dry,no added salt 25% + Sauce,pasta,tomato-based,commercial,heated 25% + Beef,cooked,nfs 40% OR Chicken 40% + Cheddar cheese 5% + onions 5%
Chicken enchiladas Bread,flat (pita/lebanese),white 20% + chicken breast 40% + Onion 5% + Capsicum 5% + Sauce,pasta,tomato 20% + lentils 5% + cheese 5%

359
Pasta,beef/vegetable filled,boiled,w tomato-based sauce
Sauce,pasta,tomato-based,commercial,heated 25% + Beef,mince,fried,ns oil,nfs 20% + Mixed vegetables,frozen,broccoli & carrot & corn,cooked 20% + Pasta,white wheat flour based,boiled from dry,no added salt 35%
Pasta,cheese & vegetable filled,no sauce,fast food style
Mixed vegetables,frozen,broccoli & carrot & corn,cooked 35% + Pasta,white wheat flour based,boiled from dry,no added salt 55% + Cheese nfs 10%
Rice,fried,with mixed vegetables & chicken,ns oil
Mixed vegetables,frozen,broccoli & carrot & corn,cooked 25% + Chicken,breast,lean,stir-fried 25% + Rice,white,boiled without added salt 50%
Chicken,stir fry,soy based sauce,hokkien noodle & mixed vegetables
Mixed vegetables,frozen,broccoli & carrot & corn,cooked 25% + Chicken,breast,lean,stir-fried 25% + Pasta,white wheat flour based,boiled from dry,no added salt 50%
Pasta,salad,with vegetables Pasta,white wheat flour based,boiled from dry,no added salt 75% + Mixed vegetables,frozen,broccoli & carrot & corn,cooked 25%
Fried rice,white, mixed vegetables Mixed vegetables,frozen,broccoli & carrot & corn,cooked 35% + Rice,white,boiled without added salt 65%
Beef,curry,vindaloo,Indian restaurant style
Beef,cooked,nfs 80% + Onion, cooked nfs 5% + Garlic 1.5% + Ginger 1.5% + Spices assorted 1% + Oil,cooking nfs 1% + Water 10%
Beef teriyaki Noodles Beef,cooked,nfs 40% + Noodle,boiled,nfs 50% + Mixed vegetables,frozen,broccoli & carrot & corn,cooked 8% + Oil,cooking 1% + Teriyaki sauce 1%
Pasta bolognese,Italian restaurant style
Sauce,pasta,tomato-based,commercial,heated 30% + Beef,mince,fried,ns oil,nfs 30% + Pasta,white wheat flour based,boiled from dry,no added salt 40%
Pasta in cream-based sauce,reconstituted from dry mix w milk & butter
Pasta,white wheat flour based,boiled from dry,no added salt 60% + Milk full cream 30% + Butter,salted 10%+ Dry mix 30g
Rissole,beef & vegetables,fried Beef,mince,fried,ns oil,nfs 80% + Mixed vegetables,frozen,peas & corn,cooked 20%
Beef,stir fry,chow mein (beef & noodles),Chinese restaurant style
Beef,mince,fried,ns oil,nfs 70% + Onion,cooked 2% + Cabbage,cooked 2% + Celery,cooked 2% + Carrot,cooked 2% + Green beans,cooked 2% + Egg Noodle,boiled,nfs 20%
Sushi,chicken Rice,white,boiled with added salt 70% + Chicken,breast,lean,fried,ns oil 25% + Cucumber 4.9% + Nori 0.1%

360
Appendix 21 – Characteristics and activities performed by each Similar Exposure Group (SEG)
SEG No.
SEG Name Roster Pattern
Shift duration
Work location
Activity Description
SEG01 Shot firer 7 days on / 7 days off
12 hrs/day Outside in direct sun
The Preparation and set-up of a blast area which includes: Demarcate the blast loading area by ensuring adequate barriers and/or bunting is correctly erected; Set up of signs, and flashing lights where appropriate; Dipping of holes and recording (where required) on drill/blast plan; Identify holes that require re-drilling, are damaged or contain water; Backfill holes where necessary
Blast loading activities which include: Laying out of Explosive Accessories; Priming blast holes; Loading explosives into blast holes; Checking of product column rise to design; Stemming of blast holes; Clean-up of blast area; Tie in of blast pattern to Design; Security of the blast area; Reporting of lost accessories or incidents on the shot
The preparation for the firing of shots including: Inspection of the tie in (walk the shot); The allocation of blast guard locations; Ensuring blast guards are trained and competent in their duties; Liaising with the others and blast guards prior to clearing the area; Ensure the clearance of all personnel and equipment from the blast exclusion zone
The firing of explosives and post blast examination

361
SEG02 Processing personnel 4 days on / 4 days off
12 hrs/day Outside in direct sun
Identifying and reporting potential hazards to eliminate risks; Use risk management systems to ensure a safe workplace; Undertake daily plant inspections and report faults; Use fixed and mobile plant equipment in accordance with procedures; Support the maintenance team in the completion of maintenance schedules and repair work.
SEG03 Drillers 4 days on / 4 days off
12 hrs/day AC vehicle Cabin
Setup and operate drilling rig; Drill holes to explore for mineral deposits and also for setting up of explosive charges by short firers; Record drilling activity
SEG04 Maintenance personnel 4 days on / 4 days off
12 hrs/day Under cover shed
Carry out scheduled maintenance of fixed plant and mobile plant; Carry out repairs on faulty plant and mobile equipment
SEG05 Office personnel 5 days / week
8 hrs/day AC office Various activities including administrative, geological mapping, health and safety, human relations among others.