supporting information · (i.e., the same sequence ... (msnt), fmoc-arg(pbf) loaded novasyn tga...
TRANSCRIPT

Supporting InformationHorne et al. 10.1073/pnas.0801135105
Supporting Information corrected 10/30/2008.SI TextStructural Characteristics of �/�-Peptide 7. As discussed in the maintext, a canonical coiled coil is characterized by hydrophobicresidues that are alternatively three and four residues apart inprimary sequence (i.e., a 3-4-3-4-3-4 repeat). The seven residuesin each heptad are typically assigned the letters abcdefg, withhydrophobic core residues denoted as a and d. In a parallel helixbundle fold, the interface between helices is characterized byalternating layers composed of a position residues (‘‘a-layers’’)and d position residues (‘‘d-layers’’). This is the case for theGCN4-pLI �-peptide (1) as well as �/�-peptide derivatives 2-4(i.e., the same sequence positions comprise the hydrophobiccores of 1-4). In �/�-peptide 7, however, there is a break in theheptad repeat of hydrophobic residues that comprise the core ofthe helix bundle. Specifically, there is a formal deletion of fourresidues from the 3-4-3-4-3-4 repeat, leading to a local 3-4-3-3-4pattern of core residues (Fig. S4). In natural coiled-coil struc-tures, this type of heptad discontinuity is referred to a ‘‘helicalstammer’’ (1). The change in hydrophobic core packing between4 and 7 is discussed in greater detail below.
The break in the heptad repeat of �/�-peptide 7 takes placeat sequence position 23. Leu23, which occupies an a position in4 is displaced from the core by �-ACPC22 which occupies a dposition in 7. One turn down the helix, Ile26, which occupies a dposition in 1, is still in the hydrophobic core of 7 but now occupiesan a position. In �/�-peptide 7, Leu30, which occupies an aposition in 4 is displaced from the core by Leu29, which occupiesa d position in 7. The slight overwinding of the helix bundleresulting from a helical stammer gives rise to one other inter-esting core packing feature. In proteins, the hydrophobic coreposition one turn up the helix from a stammer typically forms ahydrophobic core plate that is neither an a-layer nor a d-layer.This new type of core position, characterized by side chains thatare projected directly toward the central axis of the helix bundle,is termed an ‘‘x-layer’’ (1). �-ACPC19 shows this mode of packingin 7.
Several factors may contribute to the helical stammer observedin 7. As discussed in the main text, the substitution of hydrophilic�3-Glu22 in 4 with hydrophobic �-ACPC22 in 7 appears to be a keycomponent. In addition, the presence of Leu29, a hydrophobicresidue at a noncore g position in the GCN4-pLI primary sequence,may also be necessary for the stammer (Leu29 occupies a d positionin 7). The shape of the ACPC side chain may make this residuepredisposed to occupy an x-layer (as it does at position 19 in 7). Weare currently exploring various combinations of acyclic �3-resiudesand cyclic �-residues in the ��� backbone shared by �/�-peptides4 and 7. We hope that these investigations will provide insight intothe origins of the helical stammer in 7 as well as the thermodynamicrole of cyclic �-residues in stabilizing the folds of �/�-peptides.
General. Fmoc-protected �3-amino acids were purchased fromPeptech. The 2,4,6-mesitylene-sulfonyl-3-nitro-1,2,4-triazolide(MSNT), Fmoc-Arg(Pbf) loaded Novasyn TGA resin, unloadedNovasyn TGA resin, and all protected �-amino acids werepurchased from Novabiochem. The 2-(1H-benzotriazole-1-yl)-1,1,3,3-tetramethylaminium hexafluoro-phosphate (HBTU) waspurchased from AnaSpec. The 1-Methyl-2-pyrollidinone (NMP)was purchased from Advanced Chemtech. Fmoc-ACPC andFmoc-APC(Boc) were prepared as previously described (2, 3).Fmoc-�3-hArg(Pbf) and Fmoc-APC(Boc) loaded Novasyn TGA
resins were prepared by MSNT/1-methylimidazole activation ofthe protected amino acid as previously described (4). All otherreagents were purchased from Aldrich and used as receivedunless otherwise noted.
Automated Solid-Phase Peptide Synthesis. Synthesis of �-peptide 1was carried out on a Symphony Multiple Peptide Synthesizer(Protein Technologies) by using Fmoc-Arg(Pbf) NovaSyn TGAresin. Syntheses of �/�-peptides 2-6 was carried out by usingstandard Fmoc-solid-phase peptide-synthesis protocols by a com-bination of manual and automated methods. Novasyn TGA resinpreloaded with the C-terminal residue (25 �mol) was suspended inCH2Cl2, allowed to swell for 1 h, and then washed with DMF (threetimes). The resin was treated with 20% piperidine/DMF (two timesfor 8 min) to remove the terminal Fmoc group and then washedwith DMF (three times). Fmoc-amino acid (75 �mol) and HBTU(28 mg, 74 �mol) were weighed into a separate vessel and dissolvedin a 0.1 M solution of HOBT in NMP (0.75 ml). DIEA (26 �l, 150�mol) was added, and the solution was allowed to react for 2 minand was then added to the resin. The vessel was capped, placed ona benchtop shaker, and agitated for 1 h. The resin was washed withDMF (three times), and the deprotection/coupling cycle was re-peated for the next residue. After coupling of the second residuewas complete, the resin was transferred to an Applied BiosystemsSynergy 432A automated peptide synthesizer on which the remain-ing 30 residues were coupled. The N terminus of the resulting�/�-peptide was capped by treatment with 8:2:1 NMP/DIEA/Ac2O.The resin was washed thoroughly (three time with DMF, threetimes with CH2Cl2, and three times with MeOH) and then driedunder vacuum. Peptides were cleaved from resin by treatment with94:2.5:2.5:1 trif luoroacetic acid (TFA)/H2O/ethanedithiol/triisopropylsilane. The resin was filtered and washed with additionalTFA, and the combined filtrates were concentrated to �2 ml undera stream of dry nitrogen. Crude peptide was precipitated from thecleavage mixture by addition of cold ether (45 ml). The mixture wascentrifuged and decanted, and the remaining solid was dried undera stream of dry nitrogen. Purification was carried out as describedin Materials and Methods.
Microwave-Assisted Manual Solid-Phase Peptide Synthesis. Micro-wave-assisted reactions were carried out in a MARS multimodemicrowave reactor (CEM). Novasyn TGA resin preloaded withthe C-terminal amino acid (25 �mol) was weighed into a frittedpolypropylene tube and allowed to swell first in CH2Cl2 and thenin DMF. For coupling of an activated amino acid to an unpro-tected amine on resin, the desired Fmoc-protected amino acid(125 �mol) and HBTU (47 mg, 125 �mol) were dissolved in 1.25ml of 0.1 M HOBT in DMF. To the solution was addedN-methylmorpholine (50 �l, 500 �mol). This mixture was vor-texed briefly and allowed to react for at least 1 min. The activatedamino acid solution was then added to the fritted polypropylenetube containing the resin. The resin was heated to 70°C in themicrowave (2-min ramp to 70°C, 4-min hold at 70°C) withstirring. After the coupling reaction, the resin was removed fromthe microwave and washed with DMF (three times), CH2Cl2(three times), and DMF (three times). For Fmoc deprotection,3 ml of 20% piperidine in DMF was added to the resin, and themixture was heated to 80°C in the microwave (2-min ramp to80°C, 2-min hold at 80°C) with stirring. After the deprotectionreaction, the resin was washed with DMF (three times), CH2Cl2
Horne et al. www.pnas.org/cgi/content/short/0801135105 1 of 11

(three times), and DMF (three times). The cycles of coupling anddeprotection were alternately repeated to give the desiredfull-length peptide. After the final deprotection cycle, the N-terminal amine was acetylated by stirring the resin in a 14:5:1mixture of CH2Cl2/acetic anhydride/triethylamine. The resin waswashed thoroughly (three times in DMF, three times in CH2Cl2,and three times in MeOH) and then dried under vacuum.Peptides were cleaved from resin by treatment with 94:2.5:2.5:1trif luoroacetic acid (TFA)/H2O/ethanedithiol/triisopropylsi-lane. The resin was filtered and washed with additional TFA, andthe combined filtrates were concentrated to �2 ml under astream of dry nitrogen. Crude peptide was precipitated from thecleavage mixture by addition of cold ether (45 ml). The mixturewas centrifuged and decanted, and the remaining solid was driedunder a stream of dry nitrogen. Purification were carried out asdescribed in Materials and Methods.
Analytical Ultracentrifugation Curve Fitting. Apparent molecularmass was determined by nonlinear regression of the equilibriumradial absorbance data by using the program Igor Pro (Wavemet-rics). Data were fit to models either for a single species or forequilibrium between monomer and n-mer (Eqs. 1 and 2, respec-tively):
cr � cbase � c ref exp�M�1 � v� ���2
2RT�r2 � r ref
2 �� [1]
cr � cbase � c1 exp�M1�1 � v� ���2
2RT�r2 � r ref
2 ��� Kc1
n � nM1�1 � v� ���2
2RT�r2 � r ref
2 �� . [2]
In Eq. 1, cr is the concentration of peptide at radial position r,cref is the concentration of peptide at an arbitrary referenceradial position rref, M is the apparent molecular mass of thepeptide, v� is the partial specific volume of the pep, � is the densityof the sample, � is the radial velocity during the measurement,R is the universal gas constant, T is the temperature (in Kelvin),and cbase is a correction for baseline absorbance resulting fromnonsedimenting components of the sample. The variables in Eq.2 have the same meaning, except c1 is the concentration of themonomer, K is the equilibrium constant for the associationbetween the monomer and the n-mer, n is the aggregationnumber for the species in equilibrium with the monomer, and M1is the molecular mass of the monomer.
As a rule, equilibrium sedimentation data were fit to thesingle-species model first; the equilibrium model was attemptedif the single-species fit was unsatisfactory. The quality of aparticular fit was judged based on the randomness of residualsand the size of the fit standard deviation. If the single-species andequilibrium models were of similar quality according to thesecriteria, the simpler model was selected.
As described in the main text, the sedimentation data forpeptide 8� at 200 �M peptide concentration in 10 mM NaOAc(pH 4.6) and 150 mM NaCl showed evidence of high-orderaggregation. However, the sedimentation data for peptide 8�could be fit to the single species model shown in Eq. 1 when theexperiment was performed at a lower peptide concentration (100�M, 8�) and without NaCl. The following parameters of Eq. 1were used as constants: � � 0.9975 g cm3 (tabulated density of10 mM NaOAc), v� � 0.7728 cm3 g�1 (calculated according to themethod of Durschlag and Zipper), cbase � 0.0066 (the absor-bance near the meniscus during the highest speed of the exper-iment) (5, 6). Global nonlinear regression of the sedimentationdata at all experimental speeds gave an apparent molecular massof 15,390 Da, with a standard deviation of 0.0037 for the fit, anda relatively random distribution of residuals.
The experimental apparent molecular mass is 8% smaller thanthe molecular mass expected for a tetramer composed of fourcopies of 8� (16,672 Da). This difference may be a result ofcharged-based nonideality, in which charge-charge repulsiondecreases the apparent molecular mass of peptide assemblies byshifting the radial equilibrium distribution of the peptide awayfrom the bottom of the cell. The difference may also reflecterrors in the calculated values of � or v� that were used in the fit.In fact, a 2% increase in either � or v� could account for thedeviation of the experimental apparent molecular mass from thecalculated molecular mass of the tetramer.
This 8% molecular mass difference could also indicate thatpeptide 8� is equilibrating between two or more distinct speciesunder the conditions of the experiment. To test this hypothesis,we attempted to fit the sedimentation data for 8� to a monomer–tetramer equilibrium model according to Eq. 2. The same valuesfor �, v�, and cbase were used for the equilibrium fit as were usedfor the single-species fit. Additionally, the following parametersof Eq. 2 were used as constants: M1 � 4,168.1 g�mol�1 (themolecular mass of peptide 8� monomer), and n � 4. Theequilibrium constant obtained from this fit is 2152 M�3, sug-gesting that �90% of the peptide in a 100 �M solution of 8�would exist as a tetramer, with only 10% as monomer. Theresiduals and standard deviation (0.0035) of the equilibrium fitare not significantly better than those of the single-species fit;consequently, we did not attempt to fit the sedimentation datafor 8� to any additional models of increased complexity (involv-ing more than two equilibrating species, for example).
Both the single-species and equilibrium fits of sedimentationdata for peptide 8� lead to the same qualitative conclusion: that8� forms a stable tetramer in 10 mM NaOAc (pH 4.6) and at 100�M peptide concentration. The similarity of the residuals and fitstandard deviations for each model, and the potential uncer-tainty that results from nonideality and errors in � and v� precludea clear choice of which model best describes the sedimentationbehavior of peptide 8�. All other things being equal, the simplestmodel was selected for presentation in the main text.
1. Brown JH, Cohen C, Parry DAD (1996) Heptad breaks in �-helical coiled coils: Stuttersand stammers. Proteins 26:134–145.
2. Lee HS, LePlae PR, Porter EA, Gellman SH (2001) An efficient route to either enantiomerof orthogonally protected trans-3-aminopyrrolidine-4-carboxylic acid. J Org Chem66:3597–3599.
3. LePlae PR, Umezawa N, Lee HS, Gellman SH (2001) An efficient route to eitherenantiomer of trans-2-aminocyclopentanecarboxylic acid. J Org Chem 66:5629 –5632.
4. Blankemeyermenge B, Nimtz M, Frank R (1990) An efficient method for anchoringFmoc-amino acids to hydroxyl-functionalized solid supports. Tetrahedron Lett31:1701–1704.
5. Durchschlag H, Zipper P (1994) Calculation of the partial volume of organic compoundsand polymers. Prog Colloid Polym Sci 94:20–39.
6. Ballerat-Busserolles K, Ford TD, Call TG, Woolley EM (1999) Apparent molar volumesand heat capacities of aqueous acetic acid and sodium acetate at temperatures fromT�278.15 K to T�393.15 K at the pressure 0.3(5) MPa. J Chem Thermodyn 31:741–762.
Horne et al. www.pnas.org/cgi/content/short/0801135105 2 of 11

Fig. S1. Plot of 1 side-chain torsion angles for �- and �-residues in 1-4.
Horne et al. www.pnas.org/cgi/content/short/0801135105 3 of 11

Fig. S2. Comparison of hydrophobic core packing at different residues in �-peptide 1 and �/�-peptides 3 and 4. (A) Leu16 in 1. (B) �3-hLeu23 in 3. (C) �3-hLeu16
in 4. (D) Ile19 in 1. (E) �3-hIle19 in 3. (F) �3-hIle19 in 4.
Horne et al. www.pnas.org/cgi/content/short/0801135105 4 of 11

Fig. S3. CD thermal denaturation curves for 3-9. (A) Peptides 3-6 at 100 �M. (B) Peptides 3-5 at 25 �M. (C) Peptides 7-9 at 100 �M. (D) Peptides 7-9 at 25 �M.All samples are in 10 mM NaOAc (pH 4.6).
Horne et al. www.pnas.org/cgi/content/short/0801135105 5 of 11

Fig. S4. Comparison of the hydrophobic core packing in �/�-peptides 4 and 7. (A) Primary sequences of �/�-peptides 4 and 7. Boxed positions indicate residuespacked into the core of the helix bundle and are labeled by layer type (a, d, or x). Numbers below the sequence denote spacing between core residues. Coloredcircles indicate �-residues (cyan for �3 and orange for cyclic �). (B) Hydrophobic core packing at several positions in 4. (C) Hydrophobic core packing at thecorresponding positions in 7.
Horne et al. www.pnas.org/cgi/content/short/0801135105 6 of 11

Fig. S5. Analytical ultracentrifugation data with corresponding curve fits and residuals for 1 (A), 3 (B), 4 (C), and 5 (D) at 200 �M in 10 mM NaOAc (pH 4.6),150 mM NaCl.
Horne et al. www.pnas.org/cgi/content/short/0801135105 7 of 11

Fig. S6. AU data with corresponding curve fits and residuals for 7 (A), 8 (B), and 9 (C). �/�-Peptides 7 and 9 are 200 �M in 10 mM NaOAc, 150 mM NaCl (pH4.6). �/�-Peptide 8 is 100 �M in 10 mM NaOAc (pH 4.6).
Horne et al. www.pnas.org/cgi/content/short/0801135105 8 of 11
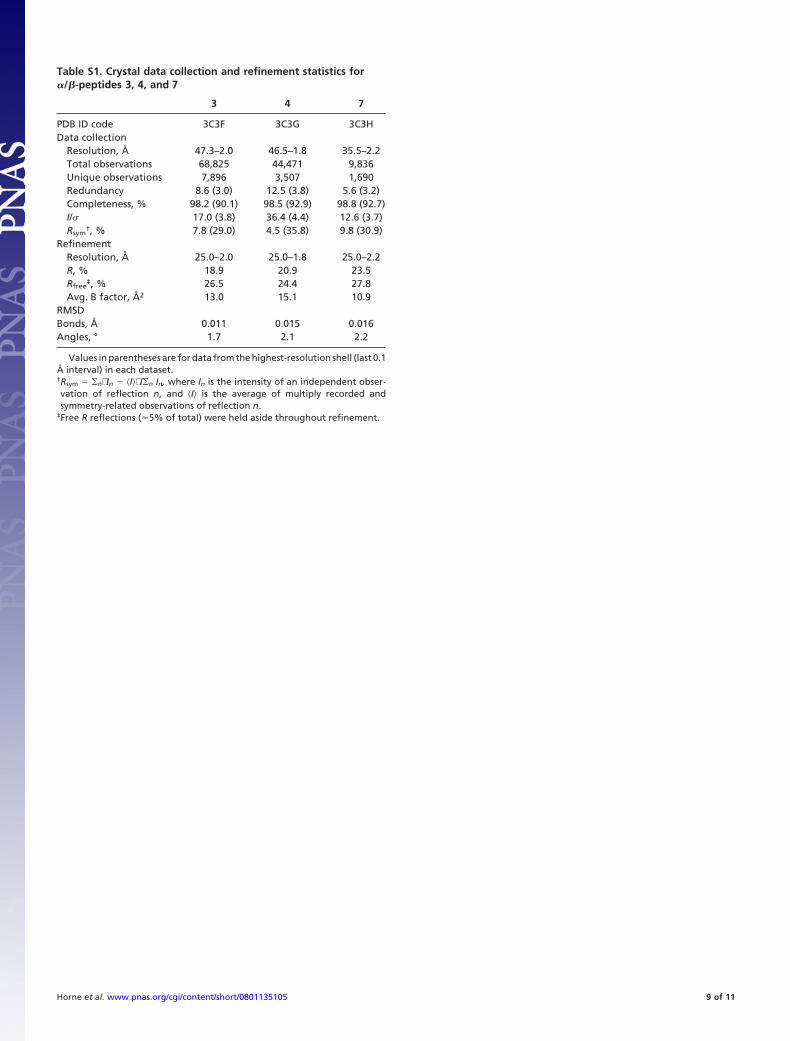
Table S1. Crystal data collection and refinement statistics for�/�-peptides 3, 4, and 7
3 4 7
PDB ID code 3C3F 3C3G 3C3HData collection
Resolution, Å 47.3–2.0 46.5–1.8 35.5–2.2Total observations 68,825 44,471 9,836Unique observations 7,896 3,507 1,690Redundancy 8.6 (3.0) 12.5 (3.8) 5.6 (3.2)Completeness, % 98.2 (90.1) 98.5 (92.9) 98.8 (92.7)I/ 17.0 (3.8) 36.4 (4.4) 12.6 (3.7)Rsym
†, % 7.8 (29.0) 4.5 (35.8) 9.8 (30.9)Refinement
Resolution, Å 25.0–2.0 25.0–1.8 25.0–2.2R, % 18.9 20.9 23.5Rfree
‡, % 26.5 24.4 27.8Avg. B factor, Å2 13.0 15.1 10.9
RMSDBonds, Å 0.011 0.015 0.016Angles, ° 1.7 2.1 2.2
Values in parentheses are for data from the highest-resolution shell (last 0.1Å interval) in each dataset.†Rsym � �n In � �I� /�n In, where In is the intensity of an independent obser-vation of reflection n, and �I� is the average of multiply recorded andsymmetry-related observations of reflection n.
‡Free R reflections (�5% of total) were held aside throughout refinement.
Horne et al. www.pnas.org/cgi/content/short/0801135105 9 of 11

Table S2. Calculated helical and superhelical parameters of four-helix bundle folds adopted by GCN4-pLI peptides with differentbackbone compositions
1 2 3 4 7
Backbone pattern (�) (�������) (����) (���) (���)Single-helix parameters
Residues per turn 3.58 3.57 3.55 3.57 3.51Rise per residue, Å 1.53 1.49 1.51 1.51 1.49Radius, Å 2.25 2.42 2.39 2.44 2.43
Superhelix parametersSupercoil radius, Å 7.13 7.73 7.66 7.69 7.63Residues per supercoil turn 129 219 222 185 146Supercoil pitch, Å 193 323 331 274 211Crossing angle, ° 26 17 17 20 26
Values for �-peptide 1 (PDB 1GCL) and �/�-peptide 2 (PDB 2OXK) are calculated from previously published coordinates (refs. 21 and 14, respectively, from themain text).
Horne et al. www.pnas.org/cgi/content/short/0801135105 10 of 11
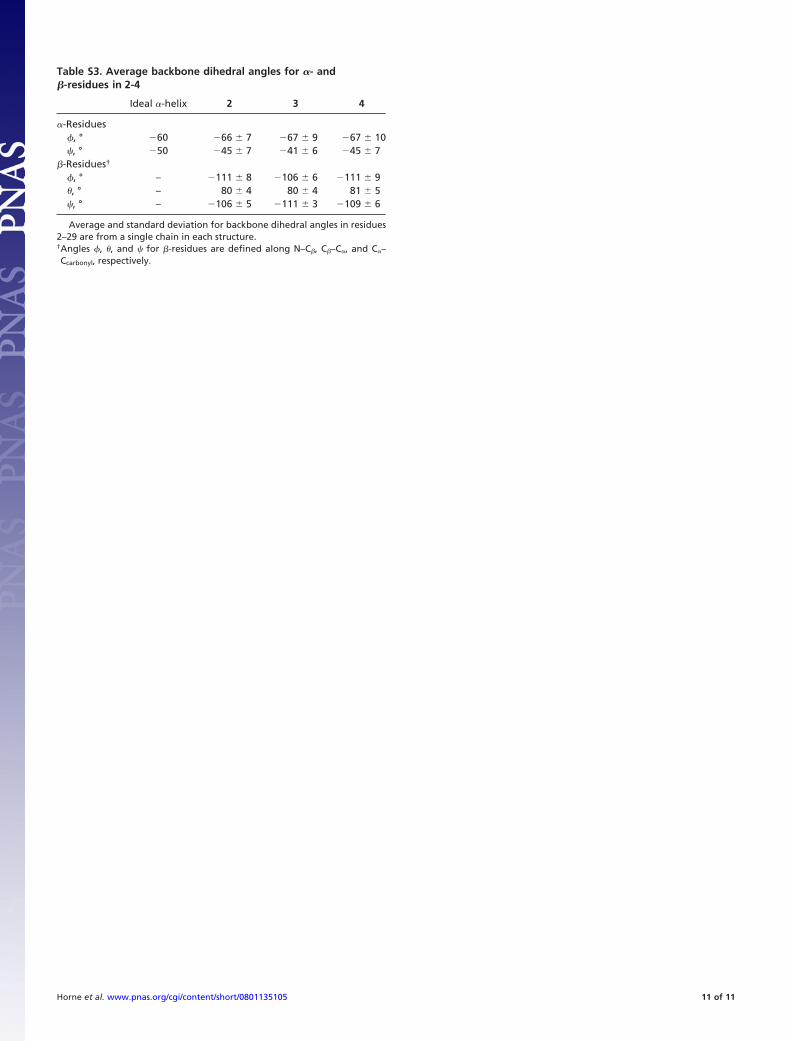
Table S3. Average backbone dihedral angles for �- and�-residues in 2-4
Ideal �-helix 2 3 4
�-Residues�, ° �60 �66 7 �67 9 �67 10�, ° �50 �45 7 �41 6 �45 7
�-Residues†
�, ° – �111 8 �106 6 �111 9 , ° – 80 4 80 4 81 5�, ° – �106 5 �111 3 �109 6
Average and standard deviation for backbone dihedral angles in residues2–29 are from a single chain in each structure.†Angles �, , and � for �-residues are defined along N–C�, C�–C�, and C�–Ccarbonyl, respectively.
Horne et al. www.pnas.org/cgi/content/short/0801135105 11 of 11