supporting information for - rsc.org · s1 supplementary information for: mitochondria-targeting...
TRANSCRIPT

S1
Supplementary Information for:
Mitochondria-targeting ratiometric fluorescent probe for -glutamyltranspeptidase and its
application to colon cancer
Seokan Park,a Dong Jun Bae,b Yeon-Mi Ryu,b, Sang-Yeob Kim,b,c Seung-Jae Myung,b,d,* and Hae-Jo Kima,*
a Department of Chemistry, Hankuk University of Foreign Studies, Yongin 449-791, Korea
[email protected] b Asan Institute for Life Sciences, Asan Medical Center, University of Ulsan College of Medicine, Seoul 138-736, Korea
c Department of Convergence Medicine, University of Ulsan College of Medicine, Seoul 138-736, Korea d Department of Gastroenterology, Asan Medical Center, University of Ulsan College of Medicine, Seoul 138-736, Korea
Contents
1. Experimental ··················· ······· ········ ···················· ······························· ···S2
2. NMR spectra ··················· ···· ··········· ···················· ······························· ···S5
2. Mass spectra ······························ ······················································· ·····S9
3. LOD and Titration ····················································································· ····S10
4 . pH P rof i l e · · · · · · · · · · · · · · · · · · · · · · · · · · · · · · · · · · · · · · · · · · · · · · · · · · · · · · · · · · · · · · · · · · · · · · · · · · · · · · · · · · · · · · · · ·S11
5. Cel l viabil i ty assay · · · · · · · · · · · · · · · · · · · · · · · · · · · · · · · · · · · · · · · · · · · · · · · · · · · · · · · · · · · · · · · · · · · · · · · · · · · · · · · · ·S12
Electronic Supplementary Material (ESI) for ChemComm.This journal is © The Royal Society of Chemistry 2016

S2
1. Experimental
General
In general, all the chemicals and solvents for the synthesis were purchased from commercial suppliers and used without
further purification, unless otherwise stated. Thin layer chromatography (TLC) was performed using Merck silica gel 60 F254
alumina plates with a thickness of 0.25 mm. Flash column chromatography was performed on silica gel 60 (230−400 mesh ASTM,
Merck). Absorption and fluorescence spectra were obtained using an Agilent 8453 spectrophotometer and a JASCO FP-6500
fluorescence spectrometer, respectively. High performance liquid chromatography (HPLC) analysis was carried out with an
YL9100 HPLC system with a reverse column (OPTIMAPAK® C18-51001546). 1H and 13C NMR spectra were recorded using Bruker
400 (400 MHz for 1H, 100 MHz for 13C) with chemical shifts () reported in ppm relative to the solvent residual signals of CDCl3
(7.16 ppm for 1H, 77.16 ppm for 13C), CD3OD (3.31 ppm for 1H, 49.00 ppm for 13C) and with coupling constants reported in Hz.
High resolution mass spectra (HRMS) were obtained using a MALDI-TOF mass spectroscopy.
Synthesis
1. To a solution of 3.0 mmol N-Boc-Glu-OtBu and 3.0 mmol 1-ethyl-3-(3-dimethylaminopropyl)carbodiimide (EDC) hydrochloride
in 6 mL CH2Cl2, was dropwise added a solution of 4-aminobenzyl alcohol (2.97 mmol) in 4 mL CH2Cl2 at 0 oC and the resulting
solution was stirred for additional 1.5 h. After the reaction was complete, all the volatiles were removed under reduced pressure
and the crude product was purified by column chromatography on silica gel (EtOAc-Hexane-MeOH as eluent, 1:2:0.5 v/v) to
afford the amide intermediate as a white solid (945 mg, 78 % yield). To a solution of 2.0 mmol of the intermediate in 8 mL CH2Cl2
was added 3 mmol pyridiniumchlorochromate (PCC) at room temperature and the resulting solution was stirred for additional 3
h. After completion of reaction, the reaction mixture was filtered off through celite and all the volatiles were was removed
under reduced pressure. The crude product was purified by column chromatography on silica gel (EtOAc-Hexane as eluent 1:1
v/v) to afford 1 as a white solid (782 mg, 96 %). 1H NMR (400 MHz, CD3OD): 9.88 (S, 1H), 7.87 (d, J = 8.6, 2H), 7.81 (d, J = 8.6,
2H), 4.08-4.04 (m, 1H), 2.54 (t, J = 7.4 2H), 2.25-2.16 (m, 1H), 2.01-1.92 (m, 1H), 1.49 (s, 9H), 1.44 (s, 9H). 13C NMR (100 MHz,
CD3OD): 191.5, 172. 1, 171.7, 156.6, 144.5, 131.9, 130.5, 119.0, 81.4, 79.1, 53.9, 32.9, 27.3, 26.9, 26.7.
2. The reaction mixture of 1 (0.20 mmol) and indocyanine bromide (0.22 mmol) in 1 mL EtOH was refluxed at 80 oC
overnight. After the reaction was complete, the solvent was removed under reduced pressure and the crude product
was purified by column chromatography on silica gel (CH2Cl2-MeOH, 10:1 v/v) to afford 2 as a dark orange solid (124
mg, 69 % yield). δ 8.47 (d, J = 16.0, 1H), 8.18 (d, J = 8.8, 2H), 7.96 (d, J = 7.6, 1H), 7.87 (d, J = 8.4, 2H), 7.808-7.73 (m,
2H), 7.67-7.61 (m, 2H), 4.75 (t, J = 7.6, 2H), 4.15 (q, J = 7.2 ,2H), 4.09-4.06 (m, 1H), 2.73 (t, J = 6.4, 2H), 2.57 (t, J = 7.2,
2H), 2.33-2.16 (m, 3H), 2.04-1.95 (m, 1H), 1.88 (s, 6H), 1.49 (s, 9H), 1.44 (s, 9H), 1.23 (t, J = 7.2, 3H). 13C NMR (100 MHz,
CD3OD): δ 182.24, 173. 20, 172.13, 171.81, 156.66, 154.71, 144.42, 143.71, 140.85, 131.11, 129.60, 129.43, 129.24,
122.81, 119.52, 114.67, 110.25, 81.39, 79.14, 60.63, 54.02, 52.44, 45.95, 32.94, 29.90, 27.48, 27.03, 26.68, 25.56,
23.14, 13.28 HRMS (MALDI+, DHB): m/z found 662.3809, calcd. 662.3802 for [M]+.
RP-Glu. To a solution of 2 (0.08 mmol) in 1 mL CH2Cl2 were added 84 L anisole and 0.7 mL CF3CO2H in an ice bath. The
resulting solution was cooled down to -10 oC and further stirred overnight. After the reaction was complete, all the
volatiles were removed under reduced pressure and the crude solid was washed with acetone to afford RP−Glu as an
orange solid (28 mg, 48 % yield). 1H NMR (400 MHz, CD3OD): 8.47 (d, J = 16.4, 1H), 8.18 (d, J = 8.8, 2H), 7.93 (d, J =
8.4, 1H), 7.88 (d, J = 8.4, 2H), 7.80-7.77 (m, 2H), 7.73-7.65 (m, 2H), 4.70 (t, J = 8.0, 2H), 4.15 (q, J = 7.2 ,2H), 4.05-3.98
(m, 1H), 2.78 (t, J = 6.4, 2H), 2.70 (t, J = 6.4, 2H), 2.35-2.22 (m, 4H), 1.88 (s, 6H), 1.25 (t, J = 7.2, 3H). 13C NMR (100 MHz,
S3
CD3OD): 182.32, 182.27, 173.20, 171.76, 154.67, 154.61, 144.25, 143.70, 140.85, 131.89, 129.72, 129.43, 129.20,
122.75, 119.57, 114.52, 110.27, 60.61, 52.74, 52.43, 52.40, 45.76, 32.22, 29.72, 25.66, 25.33, 23.00, 13.12. HRMS
(MALDI+, DHB): m/z found 506.2654, calcd. 506.2651 for [M]+.
RP. A solution of 4-acetamidobenzaldehyde (2.0 mmol) and indolium bromide (2.0 mmol) in 10 mL of EtOH was stirred at 80 oC
overnight. After the reaction was complete, the resulting orange precipitates were filtered and washed with EtOH to afford an aldol
intermediate (899 mg). To the solution of the aldol product (1.0 mmol) in 1 mL EtOH were added 3 drops of conc. HCl at room
temperature. The resulting solution was warmed to 80 oC and further stirred overnight. After the reaction was complete, the solvent
was removed under reduced pressure and the crude product was purified by column chromatography on sil ica gel (EtOH-Hexane,
1:3 v/v) to afford RP as a red solid (278 mg, 67 % yield). 1H NMR (400 MHz, CD3OD): 8.31 (d, J = 15.4, 1H), 7.93 (d, J = 8.5, 2H),
7.71-7.65 (m, 2H), 7.56 (t, J = 7.5, 1H), 7.49 (t, J = 7.5, 1H), 7.32 (d, J = 15.4, 1H), 6.79 (d, J = 8.9, 2H), 4.50 (t, J = 7.8, 2H), 4.16 (q, J =
7.1 ,2H), 2.65 (t, J = 6.1, 2H), 2.21-2.14 (m, 2H), 1.81 (s, 6H), 1.25 (t, J = 7.1, 3H). 13C NMR (100 MHz, CD3OD): 179.8, 173. 2, 157.0,
155.8, 142.5, 141.1, 134.9, 128.8, 127.5, 122.9, 122.4, 114.3, 112.8, 103.4, 60.51, 51.0, 44.3, 29.7, 26.1, 22.4, 13.1.
UV–vis and fluorescence spectral measurement
A stock s
pared
by placing
of the probe. As usual, fluorescence spectra were obtained by excitation at the isosbestic point of RP−Glu. Both excitation and
emission
otherwise stated.
HPLC analysis
The sample solution of RP−Glu (10 mM) in PBS buffer (1X, pH 7.4) was monitored in the presence of
performance liquid chromatography (MeOH (30% TEA) : H2O (30% TEA) = 95:5, 1 mL/min) on a reverse C18 column (OPTIMAPAK®).
As usual, UV–vis absorption was monitored at the maximum absorbance wavelength of each probe (RP−Glu at A400nm, RP at
A563nm).
Enzyme assay
able
monitored by fluorescence spectra. As usual, fluorescence spectra were obtained by excitation at the isosbestic point of RP−G lu.
Both excitation and emission slit widths were set to 3 nm x 3 nm. The fluorescence spectra of RP−Glu were monitored 4 h after
Cellular imaging
fetal bovine serum. The cells were seeded on an Ø 35mm glass-bottomed dish. After 48 h, each of cells was washed 2 times with
phosphate-buffered saline (PBS), treated with RP- -free
media. Then, the cells were washed 2 times with serum-free media before imaging by confocal laser scanning microscopy (CLSM).
The cellular images were taken under a CLSM using the excitation channel at 488 nm and 647nm, respectively. The correlation
between the intensities of corresponding pixels in two images was measured by using a MetaMorph program implemented in the
confocal laser microscopy.
Mouse model of colon cancer

S4
All the animal experiments and procedures were performed in the compliance with the Principles of Laboratory Animal Care
formulated by the Institutional Animal Care and Use Committee (IACUC) of the ASAN Institute for Life Sciences, ASAN Medical
Center, Seoul, Korea and were consistent with the Institute of Laboratory Animal Resources (ILAR) guidelines.
Female mice (BALB/c, 5−6 weeks old) were given a single intraperitoneal injection of azoxymethane (AOM, 10 mg/kg body weight).
One week later, the animals were fed with 2% dextran sulfate sodium (DSS, 36−50 kD in molecular weight) for 7 days via the
drinking water, followed by maintaining the basal diet and normal drinking water for 14 days. This administration of DSS in the
drinking water was repeated. Colonoscopy (Karl Storz, Tuttlingen, Germany) was performed with an AOM/DSS mouse model to
check whether the tumor cancers were grown up adequately in the colon. The mice were sacrificed at the end of the DSS
administration (week 14).
Fresh colon tissues were obtained from the AOM/DSS mouse model by surgically excising and longitudinally cutting along the main
axis to expose the mucosa layer of colon immediately after the sacrifice. Two different types of whole colons, one from the
AOM/DSS-
solution of RP−Glu was evenly sprayed on the surface of the mucosa layers of colons by micropipettes and sustained for 30 min.
After incubation with the probe, the colon tissues were unfolded on a plate with the mucosa layer facing up and their images were
obtained in the Xenogen IVIS spectrum system (Caliper Life Science, Inc., Hopkinton, MA). The rainbow fluorescence signals,
expressed at the colon tissue, were acquired with excitation at 430 nm and emission at 550 nm using auto acquisition, a binning
factor of 8 and field of view of 13.4 cm. Fluorescence imaging were processed with spectral unmixing using the Living Image 4.3.1
software (Caliper Life Sciences, Hopkinton, MA) to distinguish the autofluorescence and fluorescence of RP−Glu.

S5
2. NMR spectra
ppm (f1)
0.05.010.0
0
10000
20000
30000
40000
ppm (f1)
0.05.010.0
0
10000
20000
30000
40000
ppm (f1)
050100150
0
500
1000
1500
2000
ppm (f1)
050100150
0
500
1000
1500
2000
Fig. S1. 400 Hz and 100 Hz spectra of 1 in CD3OD.

S6
ppm (f1)
5.010.0
0
5000
10000
ppm (f1)
50100150
0
500
1000
Fig. S2. 400 Hz and 100 Hz spectra of 2 in CD3OD.

S7
ppm (f1)
5.010.0
0
5000
10000
15000
20000
25000
ppm (f1)
50100150
0
1000
2000
3000
4000
5000
6000
Fig. S3. 400 Hz and 100 Hz spectra of RP-Glu in CD3OD.
ppm (f1)
0.05.010.0
0
5000
10000
15000
ppm (f1)
0.05.010.0
0
5000
10000
15000
Fig. S4. 400 Hz and 100 Hz spectra of 4 in CD3OD.

S8
ppm (f1)
0.05.010.0
0
10000
20000
30000
40000
ppm (f1)
0.05.010.0
0
10000
20000
30000
40000
ppm (f1)
050100150
0
500
1000
ppm (f1)
050100150
0
500
1000
1500
Fig. S5. 400 Hz and 100 Hz spectra of RP in CD3OD.

S9
3. Mass spectra
49 240 431 622 813 1004
Mass (m /z)
1172.5
0
10
20
30
40
50
60
70
80
90
100
% Inte
nsity
TOF/TOF™ Reflector Spec #1 MC[BP = 662.4, 1173]
662.3
809
663.3
835
192.9
383
562.3
301
362.1
950
662.3809
Fig. S6. high resolution resolution mass spectra of 4 (MALDI+, DHB) m/z found 662.3809 calcd. 662.3802 for C38H52N3O7+
([M]+).
49 240 431 622 813 1004
Mass (m /z)
1.5E+4
0
10
20
30
40
50
60
70
80
90
100
% Inte
nsity
TOF/TOF™ Reflector Spec #1 MC[BP = 506.3, 14784]
506.2
654
377.2
068
507.2
726
378.2
104
460.2
578
443.2
337
491.2
461
506.2654
Fig. S7 high resolution high resolution resolution mass spectra of RP-Glu (FAB+, m-NBA): m/z found 506.2654, calcd. 505.2651
for C29H36N3O5+ ([M]+).
S10
4. Limit of detection (LOD) and Titration
0
5
10
15
20
25
0 10 20 30 40 50U/L
F5
65
nm
/F5
20
nm
y = 0.7124x + 0.0248
R2 = 0.9732
0
5
10
15
0 10 20
U/L
F5
65
nm
/F5
20
nm
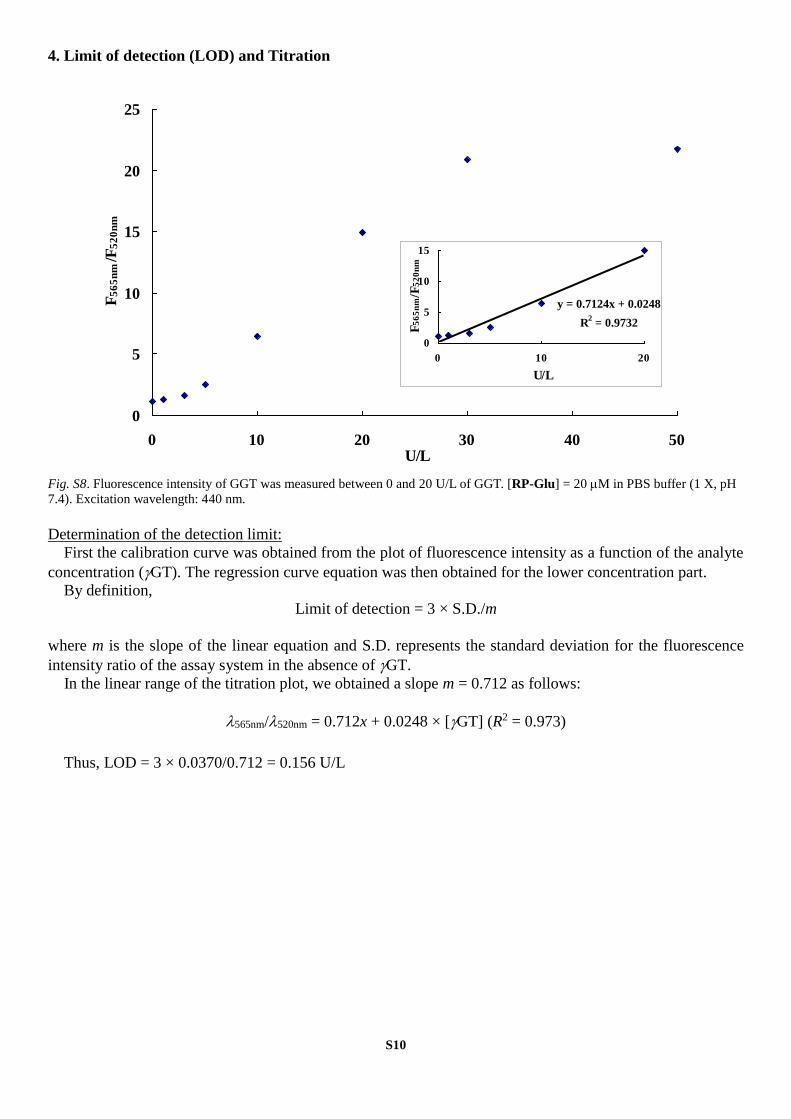
Fig. S8. Fluorescence intensity of GGT was measured between 0 and 20 U/L of GGT. [RP-Glu] = 20 M in PBS buffer (1 X, pH
7.4). Excitation wavelength: 440 nm.
Determination of the detection limit:
First the calibration curve was obtained from the plot of fluorescence intensity as a function of the analyte
concentration (GT). The regression curve equation was then obtained for the lower concentration part.
By definition,
Limit of detection = 3 × S.D./m
where m is the slope of the linear equation and S.D. represents the standard deviation for the fluorescence
intensity ratio of the assay system in the absence of GT.
In the linear range of the titration plot, we obtained a slope m = 0.712 as follows:
565nm/520nm = 0.712x + 0.0248 × [GT] (R2 = 0.973)
Thus, LOD = 3 × 0.0370/0.712 = 0.156 U/L

S11
5. pH profile
0
7
14
21
28
35
0 2 4 6 8 10pH
F5
65
nm
/F5
20
nm
RP-Glu
RP
Fig. S9. pH profile of RP-Glu and RP (20 M). Excitation wavelength: 440 nm

S12
6. Cell viability assay
HCT116 cells were plated in 100 L of media at 6,000 cells per well onto white clear-bottom 96-well
plates (Corning Costar, NY, USA). After 24h, cells were incubated for 24h and 48h with or without
compound before carrying out the viability assay. Using the Cell Titer-Glo Luminescent Cell Viability assay
kit (Promega, WI, USA) and instructions, luminescent measurements were taken on an EnSpire™ 2300
multilabel reader (Perkin Elmer, MA, USA). The graphically represented values are meanss.d. for three
independent samples.
DMSO 0.5 1 10 1000
20
40
60
80
100
120
140
24h treatment
48h treatment
Cell v
iab
ilit
y (
%)
RP-Glu (M)
Fig. S10. HCT116 cells were treated with RP-Glu or control (DMSO), and cell viability was determined by Cell Titer-Glo assay
after incubation for 24h or 48 h.