supporting information for - the royal society of … information for functionalization of biomass...
TRANSCRIPT
Supporting Information For
Functionalization of biomass carbonaceous aerogels and its
application as electrode materials for electro-enhanced recovery of
metal ions
Jie Liab, Xiangxue Wanga, Hongqing Wangc, Suhua Wanga,d, Tasawar Hayatd, Ahmed
Alsaedid, and Xiangke Wangabcd*
a College of Environmental Science and Engineering, North China Electric Power University,
Beijing 102206, P. R. China.
b Collaborative Innovation Center of Radiation Medicine of Jiangsu Higher Education Institutions,
School for Radiological and Interdisciplinary Sciences, Soochow University, Suzhou 215123, P. R.
China
c School of Chemistry and Chemical Engineering, University of South China, 28 Changsheng
West Road, Hengyang, Hunan 421001, P.R. China
d NAAM Research Group, Faculty of Science, King Abdulaziz University, Jeddah 21589, Saudi
Arabia
* Corresponding author. Email: [email protected] or [email protected]
Electronic Supplementary Material (ESI) for Environmental Science: Nano.This journal is © The Royal Society of Chemistry 2017
CDI decontamination test
The electrosorption capacity of the CDI system was conducted in a continuously
recycling system including a home-made single CDI unit, an electrical power supply,
a conductivity meter (Type 308A, Leici company), a peristaltic pump (BT100-2J,
Baoding LanGe constant Flow Pump Co., Ltd, China) and a water tank. In each
experiment, the CuCl2 solution was continuously pumped from the pump into the cell
and the effluent was returned to the water tank. In detail, the flow rate was set
constant to 25 mL/min and the total solution volume was 200 mL in the system. The
distance of 2 mm between the electrodes and a direct voltage were applied. The CDI
electrodes were prepared as following: 80 mg electrode materials with 10 mg carbon
black and 10 mg PTFE were dispersed into 5 mL ethanol solution under ultrasonic
treatment for 5 min to form dispersion. Then, this dispersion was dropped onto the
center of a nickel foam plate. After that, the resultant electrodes were dried at 140 °C
overnight. The hole with a diameter of 5 mm was punched in the prepared electrode to
allow the water flowing through the CDI device.
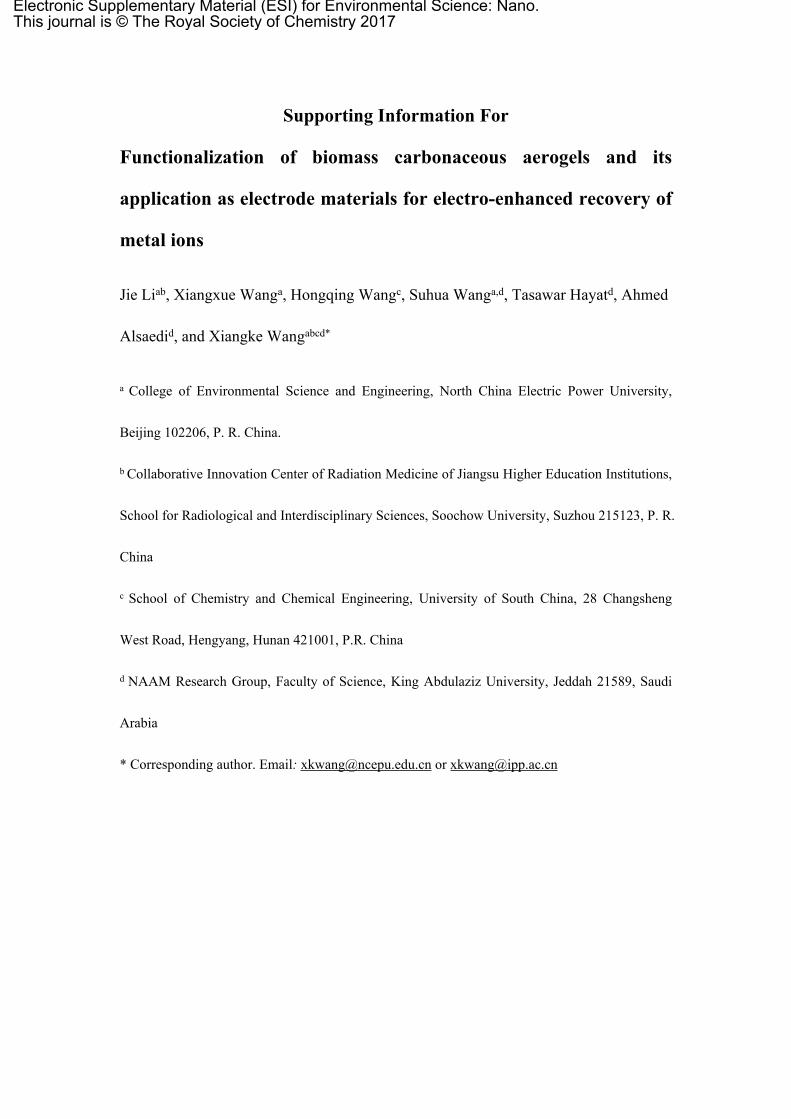
STEM C Ka
O Ka Ti Ka
Fig. S1 TEM mapping of the CAs/TiO2.
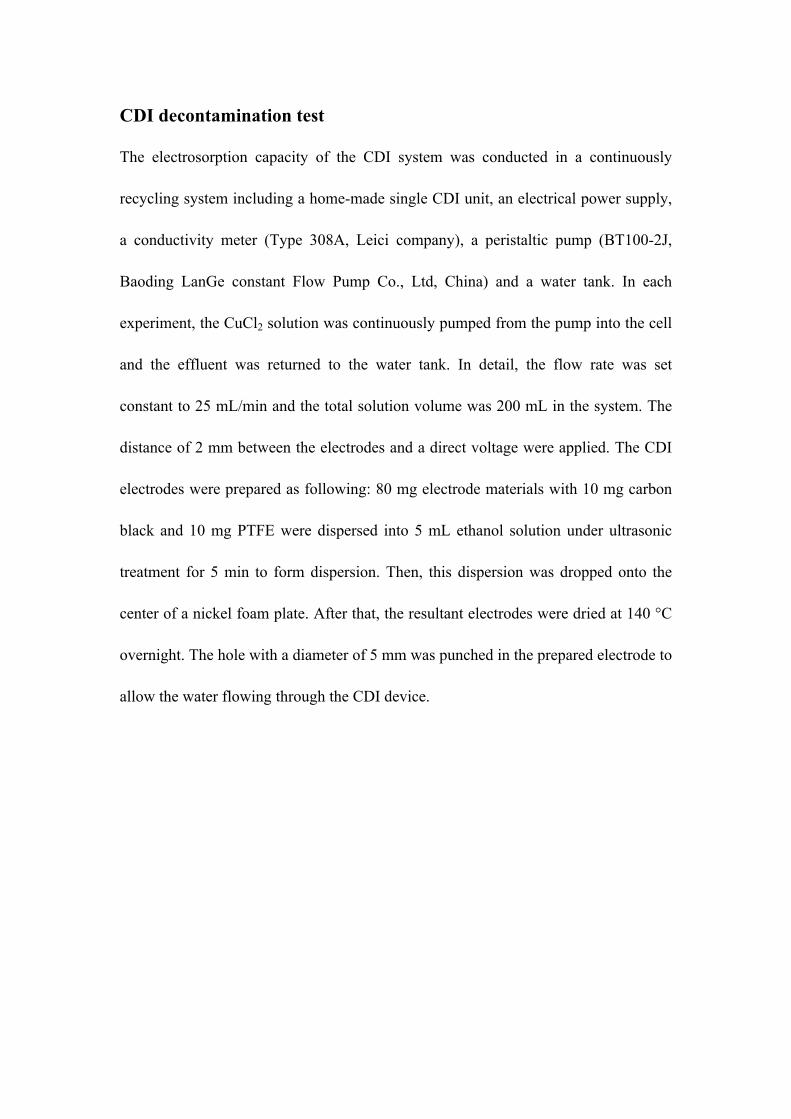
4000 3500 3000 2500 2000 1500 1000 500
CAs-Fe2O3
CAs-CeO2
CAs-TiO2
CAs
Wavenumber (cm-1)
Inten
sity
(a.u
.)
Fig. S2 FTIR spectra of CAs and CAs/MO hybrids.

0.0 0.2 0.4 0.6 0.8 1.0
0
20
40
60
80
100
120
Relative pressure (p/p0)
Qu
anity
adso
rbed
(cm
3 /g)
CAs/CeO2
CAs/Fe2O3
A
0 50 100 150 200 2500
40
80
120
160
200
240
CAs/Fe2O3
CAs/CeO2
Cum
ulati
ve su
rface
area
(m2 /g
)
Pore diameter (nm)
B
0.0 0.2 0.4 0.6 0.8 1.0
0
20
40
60
80
100
120
Relative pressure (p/p0)
Qu
anity
adso
rbed
(cm
3 /g)
CAs/CeO2
CAs/Fe2O3
A
0 50 100 150 200 2500
40
80
120
160
200
240
CAs/Fe2O3
CAs/CeO2
Cum
ulati
ve su
rface
area
(m2 /g
)
Pore diameter (nm)
B
Fig. S3 Nitrogen adsorption−desorption isotherms (A); and their corresponding
cumulative distribution curve (B) of the CAs/CeO2 and CAs/Fe2O3 hybrids.
(101)(101)(004)
(200)
CAs/TiO2
(102)(104)
CAs/Fe2O3 CAs/CeO2
(311)
(200)
(101)(101)(004)
(200)
CAs/TiO2
(101)(101)(004)
(200)
CAs/TiO2
(102)(104)
CAs/Fe2O3 CAs/CeO2
(311)
(200)
Fig. S4 The SAED patterns of the as-obtained CAs/MO hybrids.
50 nm50 nm
A B
50 nm50 nm50 nm50 nm
A B
Fig. S5 TEM images of the CAs/TiO2 hybrids with different added amount of Ti3+
precursor: 5 mg (A) and 15 mg (B) Ti3+ precursor in 15 mL aqueous solution
containing 30 mg of CAs.

0.0 0.2 0.4 0.6 0.8 1.0 1.2
-4
-2
0
2
4
Potential (V) vs Ag/AgCl
Spec
ific c
urre
nt (A
/g)
10 mg/L 50 mg/L 100 mg/L
Fig. S6 CAs/TiO2 electrodes in different CuCl2 concentrations at a scan rate of 20
mV/s.
CAs
CAs/TiO2
CAs/CeO2
CAs/Fe2O3
0.4 s 0.6 s 0.8 s 1.2 s
32o
25o
36o
38o
0o
0o
0o
0o
Fig. S7 Water contact angle measurements of the prepared electrodes.
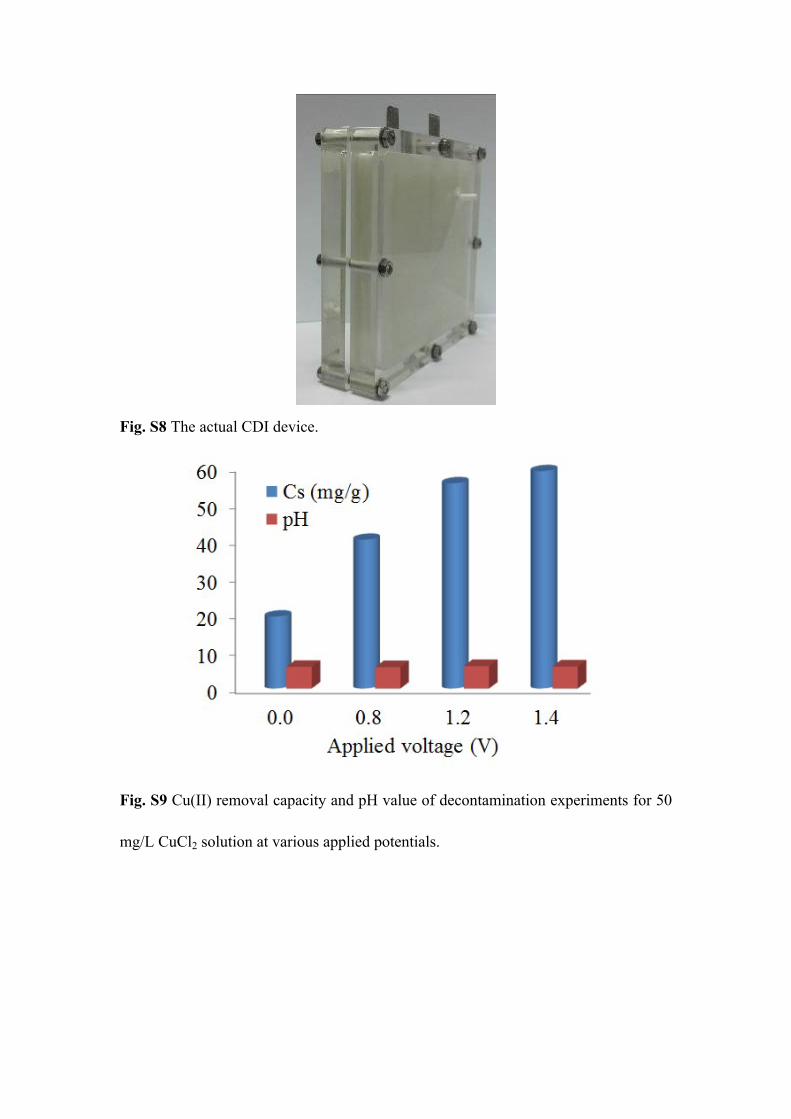
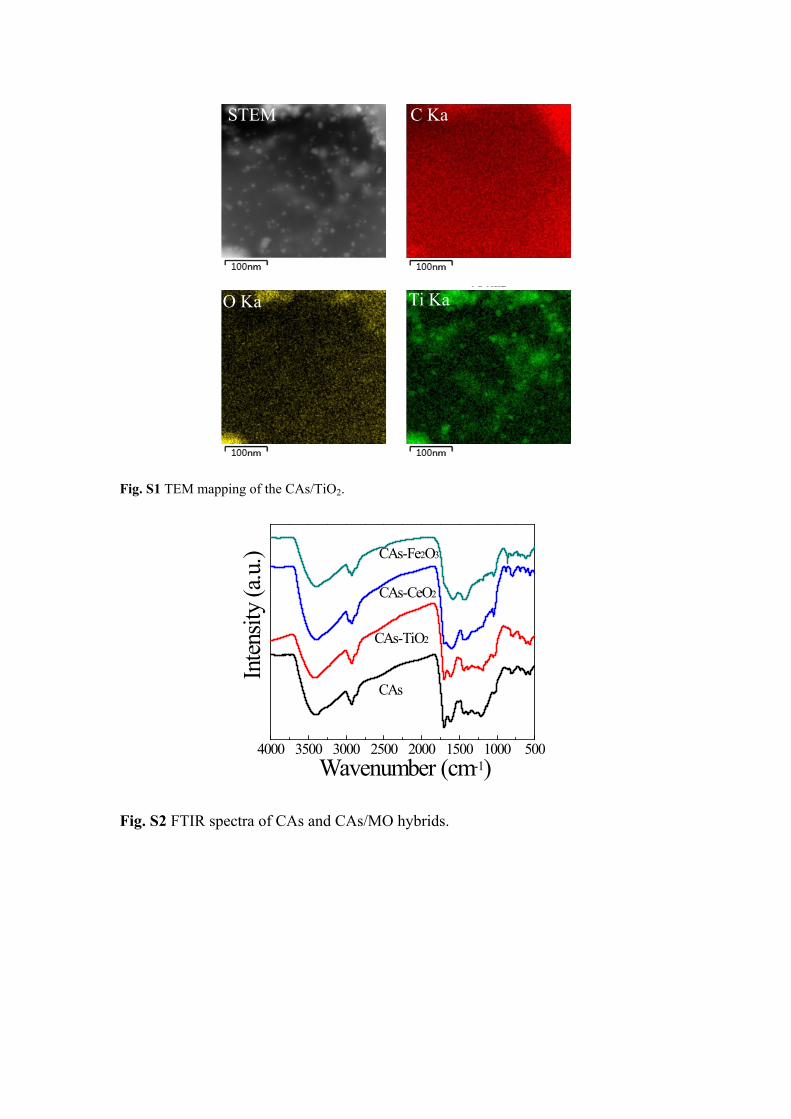
Fig. S8 The actual CDI device.
Fig. S9 Cu(II) removal capacity and pH value of decontamination experiments for 50
mg/L CuCl2 solution at various applied potentials.

930 940 950 960
Open circuit
Cu 2p1/2 shakeup
Cu 2p1/2Cu 2p3/2 shakeup
Cu 2p3/2
Binding energy (eV)
Inten
sity
(a.u
.)
Cu 2p
1.2 V
Fig. S10 Cu 2p high resolution XPS spectra of the CAs/TiO2 electrodes after the
experiments at open circuit and applied voltage of 1.2 V.
0 40 80 120 160 200
10
20
30
40
50
60
70
C0 (mg/L)
Rem
oval
effic
iency
(%) CAs/TiO2
CAs/CeO2
CAs/Fe2O3
CAs CAs/TiO2, 0 V
Fig. S11 The removal efficiency of these electrodes with different initial
concentration of Cu(II).
0 20 40 60 80 1000
1
2
3
4
5
6
Curre
nt (m
A)
Time (min)
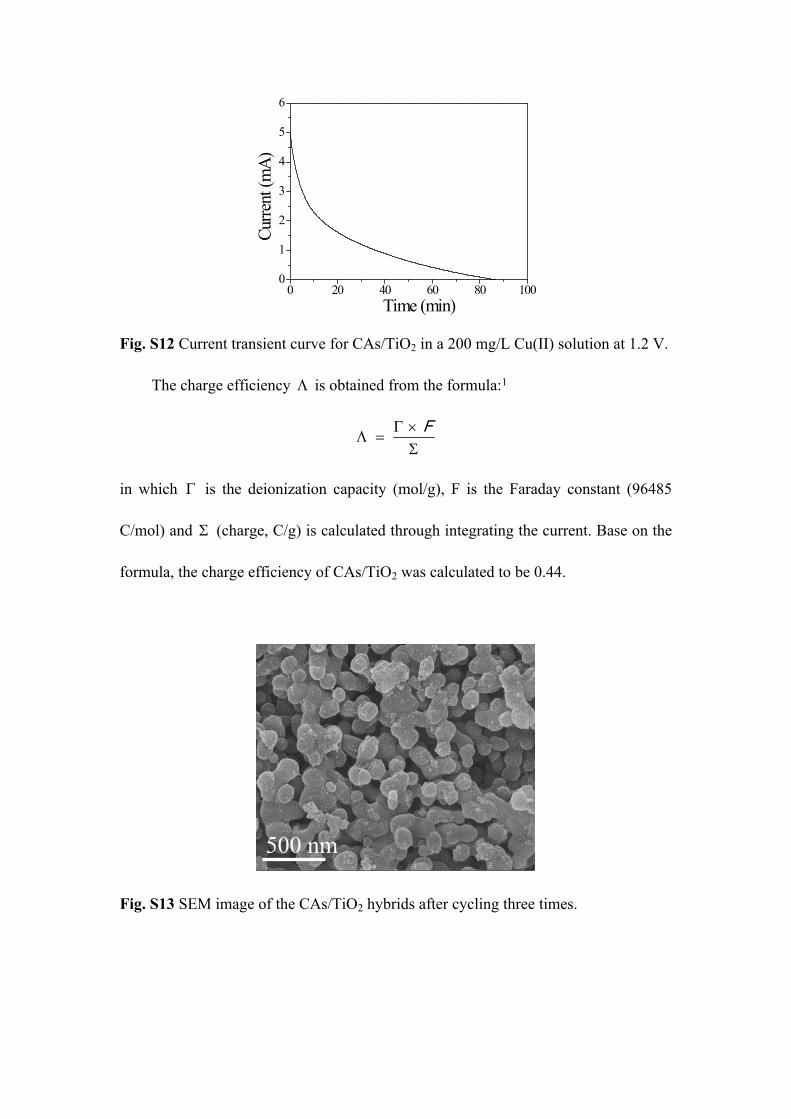
Fig. S12 Current transient curve for CAs/TiO2 in a 200 mg/L Cu(II) solution at 1.2 V.
The charge efficiency is obtained from the formula:1
F
in which is the deionization capacity (mol/g), F is the Faraday constant (96485
C/mol) and (charge, C/g) is calculated through integrating the current. Base on the
formula, the charge efficiency of CAs/TiO2 was calculated to be 0.44.
500 nm500 nm
Fig. S13 SEM image of the CAs/TiO2 hybrids after cycling three times.

Fig. S14 Underlying mechanism of the CDI process for Cu(II) removal in the
presence of NaCl.

Table S1 Parameters for Langmuir isotherm modelsCs max
(mg/g)b
(L/mg)R2
CAs/TiO2, 0 V 19.280 0.430 0.993
CAs, 1.2 V 30.353 0.309 966
CAs/Fe2O3, 1.2 V 41.424 0.268 0.996
CAs/CeO2, 1.2 V 49.281 0.238 0.990
CAs/TiO2, 1.2 V 57.134 0.337 0.989
Reference
1. X. Xu, Z. Sun, D. H. Chua and L. Pan, Sci. Rep., 2015, 5, 11225.