supporting information microwave-hydrothermal synthesis · pdf file3∙xh 2 o, aldrich, >...
TRANSCRIPT

Supporting Information
Microwave-hydrothermal synthesis and characterization of nanostructured copper
substituted ZnM2O4 (M = Al, Ga) spinels as precursors for thermally stable Cu catalysts
Synthesis details for the CuxZn1-xGa2O4 catalyst
Gallium sulfate (Ga2(SO4)3∙xH2O, Aldrich, > 99.995%), zinc sulfate (ZnSO4∙7H2O, Fluka, > 99.5%) and
cupric chloride (CuCl2∙2H2O, Fluka, > 99%) were used without further purification and dissolved in
deionized water with a metal ratio Cu:Zn:Ga of 1/8:1:2. After adjusting the pH to 10.5 with aqueous
ammonia (25 % NH3), the metal solution was poured into a 95 mL CEM Omni Teflon vessel and
heated within 30 min to 150 °C in a MARS5 microwave reactor (CEM Corporation, 2.45 GHz, 1600 W)
with five Teflon vessels per run. The constant reaction temperature of 150 °C was maintained for 1 h,
followed by a cool down period of 30 min. A reference vessel equipped with an appropriate sensor
was used to control the pressure and temperature during the reaction. All other vessels were
temperature monitored by IR sensors. A possible overheating of the reaction inside the pressure
vessel was prevented by stirring the reaction mixture and automatic power adjustment to keep the
temperature constant in the range of ± 5 °C. All products were washed with deionized water, vacuum
filtrated and dried in air at 80 °C for 1 h. For the catalytic MSR test twenty identical samples were
assembled from the above procedure.
Electronic Supplementary Material (ESI) for NanoscaleThis journal is © The Royal Society of Chemistry 2012

Figure S1. Representative XRD patterns of pH-dependent additional product types obtained from
MW-HT treatment of a suspension of Zn-, Al- and Cu-nitrates precipitated with NH3. 1a) initial
suspension at pH 7.5 (Al_7.5_NH3_1) 1b) initial suspension at pH 9.5 (Al_9.5_NH3_1) ; precipitated
with NaOH : 1c) initial suspension at pH 9 (Al_9_NaOH_1) and 1d) initial suspension at pH 11.5. In a)
and c) shift of the low-angle 00l reflections relative to those of the carbonate-hydrotalcite (blue lines)
can be explained with the substitution of carbonate with nitrate anions and the expanding effect on
the interlayer spacing [A. de Roy, Mol. Cryst. Liq. Cryst 311 (1998) 173-193].
Preparative and analytical notes to Figures S1 and S3: The structural difference shown in Figure S1 is
furthermore reflected in the sample morphologies and compositions. SEM investigations of the
hydrotalcite phases (Figure S1a,c S2a,b) showed that an unspecified microscale morphology is
obtained instead of the characteristic hydrotalcite sheets. This is accompanied by an inhomogeneous
distribution of copper- and zinc-rich areas (pH 7). Likewise, the boehmite products (pH > 9.5, Figure
1b) do not display distinguished morphologies (Figure S2a,c).
Further pH screening runs in the presence of NaOH brought forward a pH window between pH 9.5
and < 11 for the formation of the spinel. In line with the results for NH3 solutions, lower initial pH
values lead to hydrotalcite-related products with inhomogeneous element distributions and non-
characteristic morphologies. Raising the pH to 11 and 11.5 induces the subsequent formation of CuO
and ZnO impurities upon MW-HT treatment.
S1a S1b
S1c S1d
Electronic Supplementary Material (ESI) for NanoscaleThis journal is © The Royal Society of Chemistry 2012

Figure S2. Parameter variation study of pristine ZnAl2O4: PXRD pattern of samples prepared all at pH
10 with NaOH (green – with only 1400 W containing hydrotalcite and 2h, pink – with 1600 W for 1h)
and synthesized with NH3 (blue – only for 20 min, black – 1h at 180 °C). Higher temperature and NH3
as precipitating agent favor the crystallinity of the spinel material.
Figure S3a. Scanning electron microscopy images of CuxZn1-xAl2O4 prepared via MW-treatment from
suspensions with initial pH values of 7 (left) and 9.5 (right) with NH3.
Electronic Supplementary Material (ESI) for NanoscaleThis journal is © The Royal Society of Chemistry 2012

spot 04 spot 05
Element w % at % w % at %
Al 21.64 40.04 62.24 79.87
Cu 6.09 4.79 8.54 4.65
Zn 72.26 55.17 29.22 15.48
Figure S3b. Inhomogeneity of the sample Al_7_NH3_1 (hydrotalcite-containing) determined by SEM
and EDX. The amount of Zn and Al varies significantly.
spot 01 spot 02
Element w % at % w % at %
Al 62.03 79.77 63.28 80.62
Cu 4.73 2.59 4.84 2.62
Zn 33.23 17.64 31.88 16.76
Figure S3c. In contrast to Figure S2b, SEM-EDX of the sample Al_9_NH3_1 (spinel) reveals a more
homogenous element distribution.
Electronic Supplementary Material (ESI) for NanoscaleThis journal is © The Royal Society of Chemistry 2012

spot 1 spot 2 spot 3
Element w % at % w % at % w % at %
Al 77.11 89.06 79.04 90.12 80.62 90.95
Cu 1.79 0.88 1.17 0.56 1.68 0.8
Zn 21.1 10.06 19.8 9.32 17.7 8.24
Figure S3d. SEM and EDX of Al_9.5_NH3_1 (spinel and boehmite) showing a relatively homogenous
cation distribution, but low amounts of Cu.
Element w % at % w % at %
Al 59.72 78.1 57.51 76.5
Cu 10.74 5.96 10.8 3.1
Zn 29.54 15.94 31.69 17.4
Figure S3e. SEM and EDX of Al_10_NaOH_1 (spinel).
Additional pH screening runs in the presence of NaOH brought forward an equally narrow but slightly
more basic pH window for CuxZn1-xAl2O4 formation that proceeds between pH 9.5 and pH< 11. In line
with the above results for NH3 solutions, lower initial pH values lead to hydrotalcite-related products
with inhomogeneous element distributions and non-characteristic morphologies. Raising the pH to
11 and 11.5 induces the formation of CuO and ZnO impurities upon MW-HT treatment (Fig. S11-S13).
Electronic Supplementary Material (ESI) for NanoscaleThis journal is © The Royal Society of Chemistry 2012

Figure S4. TG/DSC (top) and PXRD (bottom) of Al_10_NaOH_1 as prepared spinel, after calcinations
at 800 °C in O2 and after TG/DSC at 1400 °C in N2.
Electronic Supplementary Material (ESI) for NanoscaleThis journal is © The Royal Society of Chemistry 2012

Figure S5. TG-MS of Al_10,5_NaOH_2 in synthetic air (21 % O2 in N2) showing at least two mass loss
steps due to evolving H2O.
Figure S6. Nitrogen adsorption isotherm of Al_10_NaOH_2, which can be classified as a type V
isotherm typical for weak interactions of adsorbent and adsorbate.
Electronic Supplementary Material (ESI) for NanoscaleThis journal is © The Royal Society of Chemistry 2012

Figure S7. PXRD of ZnGa2O4 prepared with NaOH (blue, pH 8.1) and NH3 (black, pH 10.5).
Electronic Supplementary Material (ESI) for NanoscaleThis journal is © The Royal Society of Chemistry 2012

a)
b)
c)
Figure S8. Rietfeld refinements of the sample Al_10_NaOH_1 after reduction at 500 °C in hydrogen
(a), storage in air for 11 days (b) and re-oxidation in oxygen at 500 °C (c) using the TOPAS software
package [A.A. Coelho, TOPAS Version 3.0 Bruker AXS GmbH, Germany].
100959085807570656055504540353025201510
1,000
950
900
850
800
750
700
650
600
550
500
450
400
350
300
250
200
150
100
50
0
-50
-100
-150
-200
-250
Al2ZnO4 88.55 %
Cu 11.45 %
9770 reduced (in situ)
[treated in 5% H2 at 500°C]
[same state as before, but longer scan]
“ZnAl2O4”
Cu
“ZnAl2O4” Cu
a = 8.1090(19) Å a = 3.613(2) Å
LVol-IB = 1.73(5) nm LVol-IB = 1.87(14) nm
100959085807570656055504540353025201510
1,1001,0501,000
950900850800750700650600550500450400350300250200150100
500
-50-100-150-200-250
Al2ZnO4 92.70 %
Cu 5.73 %
Cu2O_ICSD-63281 1.57 %
9770 partially re-oxidized
(storage in air at RT)
“ZnAl2O4”
Cu2O
Cu
“ZnAl2O4” Cu2O Cu
a = 8.1160(19) Å a = 4.294(6) Å a = 3.528(6) Å
LVol-IB = 1.706(16) nm LVol-IB = 4.9(4) nm LVol-IB = 1.34(8) nm
100959085807570656055504540353025201510
1,1501,1001,0501,000
950900850800750700650600550500450400350300250200150100
500
-50-100-150-200-250
Al2ZnO4 98.65 %
Cu2O_ICSD-63281 1.35 %
9770 re-oxidized (in situ)
[treated in 5% O2 at 500°C]
“ZnAl2O4”
Cu2O
“ZnAl2O4” Cu2O
a = 8.1152(18) Å a = 4.317(6) Å
LVol-IB = 1.778(15) nm LVol-IB = 5.2(5) nm
Electronic Supplementary Material (ESI) for NanoscaleThis journal is © The Royal Society of Chemistry 2012

Figure S9. HRTEM-image of Al_10_NaOH_1 after reduction at 500 °C in hydrogen and subsequent re-
oxidation in oxygen at 500 °C showing remaining oxidized copper particles indentified as Cu2O
(according to Fourier transform of the diffraction pattern).
Figure S10. PXRD of Ga_10.5_NH3_1after TPR at 500 °C. Formation of Cu metal is suggested by TPR
(see main text), but the total amount of Cu in this sample is below the detection limit of XRD.
100959085807570656055504540353025201510
1,900
1,800
1,700
1,600
1,500
1,400
1,300
1,200
1,100
1,000
900
800
700
600
500
400
300
200
100
0
-100
-200
ZnGa2O4 #1 100.00 %
Electronic Supplementary Material (ESI) for NanoscaleThis journal is © The Royal Society of Chemistry 2012

a)
b)
Figure S11. EDX mapping analyses on spinel samples obtained at pH 10 (Al_10_NaOH_2, a) and pH
10.5 (Al_10.5_NaOH_2, b) illustrate the strong pH dependence of the homogeneity of the Cu
distribution (see Figure S5). At high pH, Cu-enriched particles, probably CuO, were found as
segregated material appearing at bright dots in the SEM images.
Electronic Supplementary Material (ESI) for NanoscaleThis journal is © The Royal Society of Chemistry 2012

Figure S12. SEM/EDX images of Al_11_NaOH_2 indicating again the inhomogenous copper
distribution in samples obtained at high pH.
Figure S13 Similar SEM-EDX line-scan as shown in Figure S5 on a sample obtained after prolonged
MW-treatment (Al_10_NaOH_2): The increased reaction time seems to diminish the amount of
white CuO-like material on the surface and therefore to improve the purity and homogeneity of the
sample.
Electronic Supplementary Material (ESI) for NanoscaleThis journal is © The Royal Society of Chemistry 2012
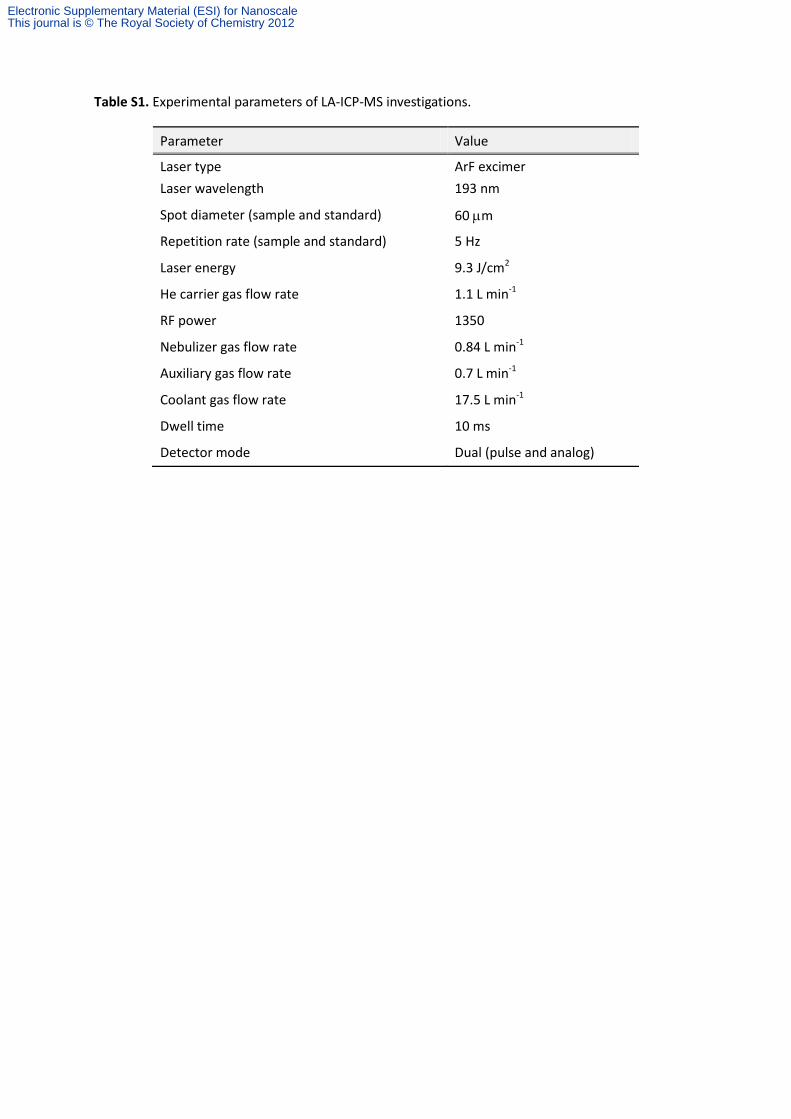
Table S1. Experimental parameters of LA-ICP-MS investigations.
Parameter Value
Laser type ArF excimer
Laser wavelength 193 nm
Spot diameter (sample and standard) 60 m
Repetition rate (sample and standard) 5 Hz
Laser energy 9.3 J/cm2
He carrier gas flow rate 1.1 L min-1
RF power 1350
Nebulizer gas flow rate 0.84 L min-1
Auxiliary gas flow rate 0.7 L min-1
Coolant gas flow rate 17.5 L min-1
Dwell time 10 ms
Detector mode Dual (pulse and analog)
Electronic Supplementary Material (ESI) for NanoscaleThis journal is © The Royal Society of Chemistry 2012