supporting information nanocoatings - royal society of ... · pdf filepotentiometric titration...
TRANSCRIPT

S1
Supporting Information
Molecular diversity in phenolic and polyphenolic precursors of tannin-inspired nanocoatings
Devin G. Barrett,1,4,5,‡ Tadas S. Sileika,1,4,‡ and Phillip B. Messersmith*,1-6
1Biomedical Engineering Department, 2Materials Science and Engineering Department, 3Chemical and Biological Engineering Department, 4Chemistry of Life Processes Institute,
5Institute for Bionanotechnology in Medicine, 6Robert H. Lurie Comprehensive Cancer Center, Northwestern University, Evanston, IL 60208
EXPERIMENTAL SECTION: ...................................................................................................................................2
MATERIALS.................................................................................................................................................................2COATING PROCEDURE. ................................................................................................................................................2COATING CHARACTERIZATION. ..................................................................................................................................2AQUEOUS STABILITY OF COATINGS............................................................................................................................3POTENTIOMETRIC TITRATION OF COATING PRECURSORS. ...........................................................................................3
ADDITIONAL AUTHOR NOTES: ............................................................................................................................3
SUPPLEMENTAL REFERENCES............................................................................................................................3
SUPPLEMENTARY TABLES....................................................................................................................................4
TABLE S1....................................................................................................................................................................4TABLE S2....................................................................................................................................................................5TABLE S3....................................................................................................................................................................6TABLE S4....................................................................................................................................................................6
SUPPLEMENTARY FIGURES..................................................................................................................................7
FIGURE S1...................................................................................................................................................................7FIGURE S2...................................................................................................................................................................8FIGURE S3...................................................................................................................................................................9FIGURE S4.................................................................................................................................................................10FIGURE S5.................................................................................................................................................................11FIGURE S6.................................................................................................................................................................12FIGURE S7.................................................................................................................................................................13FIGURE S8.................................................................................................................................................................14FIGURE S9.................................................................................................................................................................15FIGURE S10...............................................................................................................................................................16FIGURE S11...............................................................................................................................................................17FIGURE S12...............................................................................................................................................................18FIGURE S13...............................................................................................................................................................19FIGURE S14...............................................................................................................................................................20FIGURE S15...............................................................................................................................................................20FIGURE S16...............................................................................................................................................................21FIGURE S17...............................................................................................................................................................21
Electronic Supplementary Material (ESI) for ChemComm.This journal is © The Royal Society of Chemistry 2014

S2
Experimental Section:
Materials. Epigallocatechin gallate (EGCG) and resveratrol were purchased from TCI America and
Fisher Scientific, respectively. All other (poly)phenols, including tannic acid (TA), pyrogallol (PG), catechol (Ctl), catechin (Ctn), hydroxyhydroquinone (HHQ), and epigallocatechin (EGC), were purchased from Sigma-Aldrich. Silicon wafers were purchased from University Wafer. Thin films of titanium dioxide (TiO2) and gold (Au) were deposited on silicon wafers by electron-beam evaporation, cut into 1 cm x 1 cm pieces and subsequently cleaned by sequential sonication in acetone and 2-propanol for 10 min each. Polycarbonate (PC; McMaster-Carr), poly(p-phenylene sulfide) (PPS; McMaster-Carr), poly(ether ether ketone) mesh (PEEK; McMaster-Carr), poly(tetrafluoroethylene) (PTFE; McMaster-Carr), nylon 6-12 (nylon; McMaster-Carr), polydimethylsiloxane (PDMS; Baxter Healthcare), polystyrene (PS; Fisher Scientific), and stainless steel (SS; McMaster-Carr) were cleaned by sonication in 0.12 M HCl, DI water, and 2-propanol for 10 min, washed with DI water, and dried with nitrogen gas.
Coating procedure. All buffers were made at 100 mM buffer and 600 mM NaCl. The buffers used were as
follows: formate (pH 3 and 4), acetate (pH 5), bis-Tris (pH 6 and 7), bicine (pH 8 and 9), and bicarbonate (pH 10). Clean substrates were immersed in buffered solutions of 1 mg/mL precursor for 24 h (TA and PG) or 48 h (all other compounds) at room temperature with mild agitation on a rocking platform. Modified samples were then rinsed thoroughly with DI water and dried with nitrogen gas. When specified, samples were also agitated in a sonication bath after modification. Coatings were visualized by immersing samples in 100 mM AgNO3 for 48 h,[1] followed by rinsing thoroughly with DI water, and drying with N2 gas.
Porous constructs of poly(-caprolactone) (PCL; 70-90 kDa; Sigma Aldrich) were designed by the salt-leaching technique.[2] Briefly, PCL (2 g) was dissolved in 10 mL of dichloromethane, and NaCl particles (11.3 g) were added. After mixing vigorously for 10 min, the mixture was cast in a glass petri dish and then placed in a vacuum hood for 24 h to evaporate the solvent. The PCL/NaCl samples were then placed in 500 mL water, which was changed every 2 h during the first 24 h and daily thereafter. PCL foams were then coated as described above, rinsed thoroughly with DI water, submerged in DI water for 4 h, and stained with 100 mM AgNO3 for 24 h.
Coating Characterization. The surface chemical composition was determined by XPS (Thermo Scientific
ESCALAB 250Xi) and used as an indicator of coating deposition. Survey scans (0-1.1 keV binding energies) of uncoated and coated substrates were collected in triplicate. Attenuation of the underlying substrate signal and the C/O ratio (C1s/O1s electrons) were used as an indicator for the presence of coating. As evidenced by both a reduction in the Ti2p signal and an increase in the Si2p signal relative to unmodified substrates, attempts to deposit coatings at pH 10 appeared to result in etching of TiO2. C/O ratios unlike those of the precursor compounds were also observed. Accordingly, deposition of coatings at pH 10 was not further pursued.
Resultant coating thickness was evaluated by optical ellipsometry (J.A. Woollam M-2000V Ellipsometer) using a Cauchy optical model. Measurements were made at 60 , 65 , 70 , and 75 for TiO2 and 56 , 57 , 58 , 59 , and 60 for PC using wavelengths from 371 nm to

S3
1000 nm. The spectra were fitted with multilayer slab models in the CompleteEASE software (J. A. Woollam). Samples were measured and characterized in air to determine their thickness.
SEM (Hitachi SU8030) was performed in secondary electron mode at an accelerating voltage of 5 keV with a current of 10 µA and a working distance of ~15 mm relative to the sample surface. Prior to analysis, samples were sputter-coated with ~5 nm of gold/palladium. Energy dispersive x-ray spectroscopy was performed at an accelerating voltage of 15 keV with a current of 20 µA. In order to measure diameters of silver nanoparticles, images acquired via SEM of at least 1000 particles were analyzed in ImageJ.
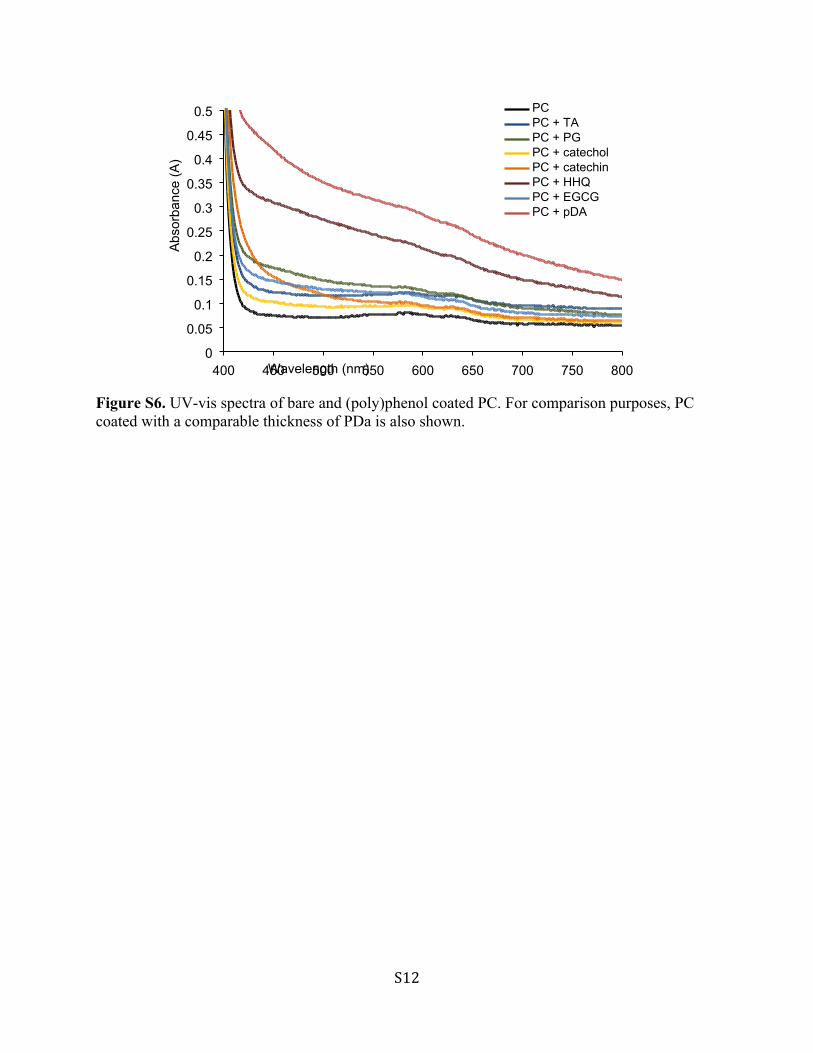
UV-vis optical absorption spectra of modified polycarbonate between 400-1000 nm were collected using a plate reader (BioTek PowerWave XS2).
Aqueous Stability of Coatings. Polycarbonate substrates were coated, rinsed, dried and coating thicknesses measured via
ellipsometry as described above. Samples were then submerged in 50 mM buffer (pH 3 – formate, pH 5 – acetate, pH 7 – phosphate, pH 9 – bicine) at room temperature. At day 1, 4, and 7, samples were rinsed with DI water, dried and then coating thickness determined by ellipsometry. Stability was evaluated by comparing the final coating thickness to the initial coating thickness. All measurements were performed in triplicate.
Potentiometric titration of coating precursors.Potentiometric titrations were performed using previously described methods with a
custom-built auto-titrator that was controlled using a custom MATLAB program.[3] A Mettler Toledo SevenEasy pH meter was interfaced with a PC via the serial port, and pH readings were collected at a rate of ~1 s–1. An InLab® Micro Combination pH Electrode (Mettler Toledo) was employed to allow small volume titrations. A Ramé-Hart automated dispensing system was used to titrate 0.100 M KOH (Ricca Chemical) with a 250 μL syringe, interfaced to the serial port. The titration was performed on a solution of ~1 mg of phenolic precursor in 2 mL of 100 mM KCl in a glass test tube. The phenolic and KOH solutions were degassed by aggressively sparging argon gas for no less than 30 min. Base was titrated in 1.0 μL increments, and the total amount added was 250 μL. NOTE: If oxygen is purged correctly, the phenolic solution should display little or no change in color throughout the titration. The pH was deemed stable when the standard deviation of the pH over the last 30 s was <0.005. A plot of volume of base added versus pH was made, and the first pKa was determined as being the pH value associated with the local maxima of the first derivative of this plot.
Additional Author notes: This study was conceptualized by all the authors. DGB and TSS performed experiments,
which were designed by all authors. The manuscript was drafted by DGB and PBM. All authors reviewed and edited the final draft of the manuscript.
Supplemental References[1] T. S. Sileika, D. G. Barrett, R. Zhang, K. H. A. Lau, P. B. Messersmith, Angew Chem Int
Ed 2013, 52, 10766-10770.[2] A. G. Mikos, G. Sarakinos, S. M. Leite, J. P. Vacant, R. Langer, Biomaterials 1993, 14,
323-330.[3] D. E. Fullenkamp, L. He, D. G. Barrett, W. R. Burghardt, P. B. Messersmith,
Macromolecules 2013, 46, 1167-1174.

S4
Supplementary Tables
Table S1. pH dependence of XPS Ti2p signal strength of TiO2 substrate after immersion in buffered 0.6M NaCl containing selected (poly)phenols.a,b
Ti2p Signal Strength (%)cPrecursor pH 3 pH 4 pH 5 pH 6 pH 7 pH 8 pH 9Gallic acid nt nt nt nt 94.0 95.0 88.3
TA 65.2 56.8 62.9 0.0 0.0 62.9 72.7Ellagic acid i i i i i i i
Ctn nt nt nt nt 44.9 49.0 0.0EGC (0.1 mg/mL) nt nt nt nt 90.2 84.1 41.2
EGCG (0.1 mg/mL) 81.5 87.4 82.5 52.4 8.7 43.8 91.8EGCG 70.1 71.5 71.8 67.7 0.3 45.5 83.8Morin i i i i i 45.9 54.7
Quercetin i i i i i i 73.3Naringenin i i i i i 80.2 90.1Naringin nt nt nt nt 90.9 79.0 80.0
Rutin i i i i i 65.1 88.0Phloroglucinol nt nt nt nt 98.0 82.8 77.4
PG 100.9 96.6 87.6 35.3 11.0 58.0 86.9Ctl nt nt nt nt 51.7 8.5 81.1
Resorcinol nt nt nt nt 94.7 85.0 90.9Hydroquinone nt nt nt nt 89.3 89.6 70.6
HHQ 18.6 32.9 22.0 1.1 51.6 88.2 76.8Phenol nt nt nt nt 102.2 68.5 79.0
Resveratrol (0.5 mg/mL) i i i i i 97.7 95.3Buffer Only 86.5 85.3 91.7 90.7 100.0 97.3 92.8
a: All coatings were performed at 1 mg/mL unless otherwise indicated. TA and PG were reacted for 24 hr at room temperature, all others for 48 h.b: Conditions considered to yield successful coatings are highlighted.c: Unmodified TiO2 = 100%.i = insolublent = not tested
S5
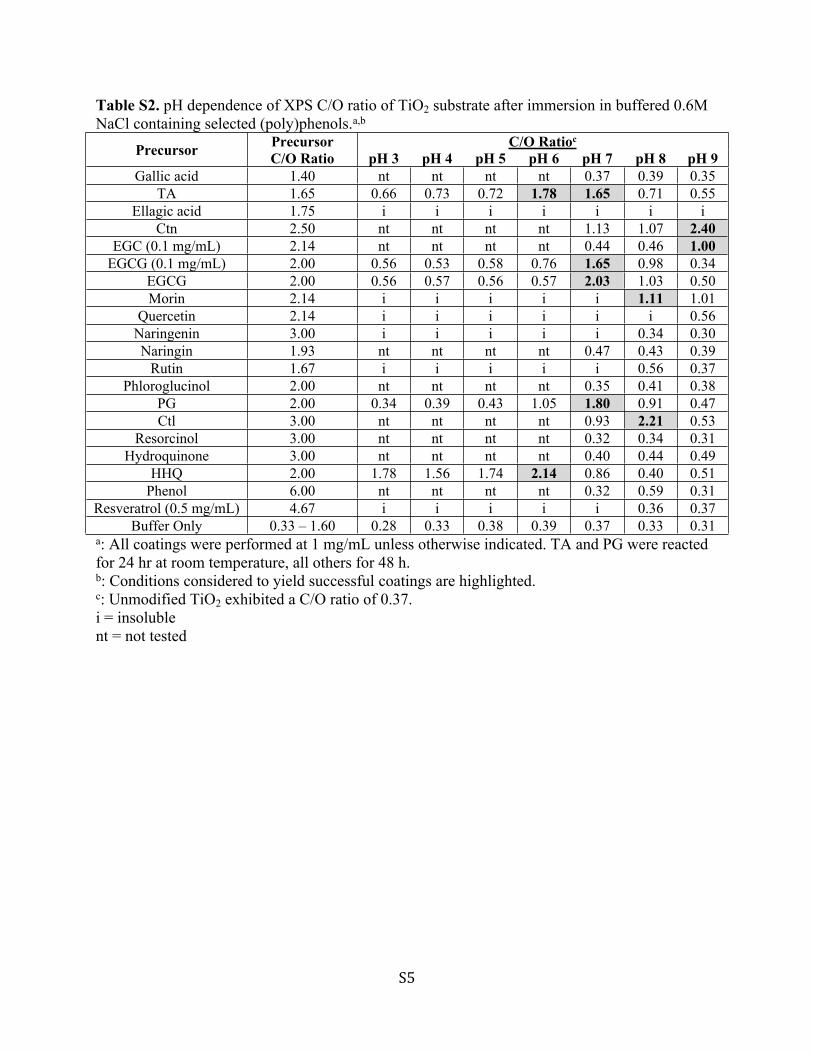
Table S2. pH dependence of XPS C/O ratio of TiO2 substrate after immersion in buffered 0.6M NaCl containing selected (poly)phenols.a,b
C/O RatiocPrecursor Precursor
C/O Ratio pH 3 pH 4 pH 5 pH 6 pH 7 pH 8 pH 9Gallic acid 1.40 nt nt nt nt 0.37 0.39 0.35
TA 1.65 0.66 0.73 0.72 1.78 1.65 0.71 0.55Ellagic acid 1.75 i i i i i i i
Ctn 2.50 nt nt nt nt 1.13 1.07 2.40EGC (0.1 mg/mL) 2.14 nt nt nt nt 0.44 0.46 1.00
EGCG (0.1 mg/mL) 2.00 0.56 0.53 0.58 0.76 1.65 0.98 0.34EGCG 2.00 0.56 0.57 0.56 0.57 2.03 1.03 0.50Morin 2.14 i i i i i 1.11 1.01
Quercetin 2.14 i i i i i i 0.56Naringenin 3.00 i i i i i 0.34 0.30Naringin 1.93 nt nt nt nt 0.47 0.43 0.39
Rutin 1.67 i i i i i 0.56 0.37Phloroglucinol 2.00 nt nt nt nt 0.35 0.41 0.38
PG 2.00 0.34 0.39 0.43 1.05 1.80 0.91 0.47Ctl 3.00 nt nt nt nt 0.93 2.21 0.53
Resorcinol 3.00 nt nt nt nt 0.32 0.34 0.31Hydroquinone 3.00 nt nt nt nt 0.40 0.44 0.49
HHQ 2.00 1.78 1.56 1.74 2.14 0.86 0.40 0.51Phenol 6.00 nt nt nt nt 0.32 0.59 0.31
Resveratrol (0.5 mg/mL) 4.67 i i i i i 0.36 0.37Buffer Only 0.33 – 1.60 0.28 0.33 0.38 0.39 0.37 0.33 0.31
a: All coatings were performed at 1 mg/mL unless otherwise indicated. TA and PG were reacted for 24 hr at room temperature, all others for 48 h.b: Conditions considered to yield successful coatings are highlighted.c: Unmodified TiO2 exhibited a C/O ratio of 0.37.i = insolublent = not tested

S6
Table S3. Tannin-inspired coating thickness before and after sonication in water for 10 min, as determined by ellipsometry.
Substrate Coating Precursor Coating Conditions
Thickness (nm)Before After
Tannic acid 24 h, pH 6 5.8 0.9 6.9 1.0Tannic acid 24 h, pH 7 109.3 7.1 70.7 7.6Pyrogallol 24 h, pH 7 19.0 1.9 8.9 1.9Catechol 48 h, pH 8 5.0 0.1 1.3 1.0Catechin 48 h, pH 9 250.3 51.8 48.7 2.9
Hydroxyhydroquinone 48 h, pH 6 48.8 10.5 16.6 0.1Epigallocatechin gallate 48 h, pH 7 34.3 7.2 12.7 2.8
Morin 48 h, pH 8 1.9 0.2 nt
TiO2
Ellagic acid 48 h, pH 10 1.4 0.4 ntTannic acid 24 h, pH 6 3.3 0.3 5.3 0.9Tannic acid 24 h, pH 7 70.2 6.4 68.3 13.3Pyrogallol 24 h, pH 7 71.6 1.0 67.3 7.4Catechol 48 h, pH 8 75.7 1.6 81.7 6.4Catechin 48 h, pH 9 78.6 11.7 79.8 4.5
Hydroxyhydroquinone 48 h, pH 6 84.9 2.1 84.3 4.3Epigallocatechin gallate 48 h, pH 7 65.7 0.8 4.1 1.1
Morin 48 h, pH 8 5.2 1.5 nt
PC
Ellagic acid 48 h, pH 10 2.4 0.3 ntnt: not tested
Table S4. First phenolic pKa and optimal coating pH of coating precursors.Precursor pKa pHcoating pKa - pHcoating
Ctn 9.2 9.0 0.2TA 7.7 7.0 0.7
EGCG 8.1 7.0 1.1Ctl 9.5 8.0 1.5PG 9.3 7.0 2.3
HHQ 9.1 6.0 3.1

S7
Supplementary Figures
A
B
Figure S1. Substrate-independent coatings based on TA. (A) Digital images of bare, coated, and silver-stained substrates demonstrating the ability of TA to coat a variety of substrates. (B) XPS characterization of substrate-specific electron signal fractions (red bars) and corresponding C/O ratios (blue markers). The dashed line represents the C/O ratio associated with TA (C/O = 1.65). * indicates the inability to differentiate coating from substrate by XPS

S8
A
B
Figure S2. Substrate-independent coatings based on PG. (A) Digital images of bare, coated, and silver-stained substrates demonstrating the ability of PG to coat a variety of substrates. (B) XPS characterization of substrate-specific electron signal fractions (red bars) and corresponding C/O ratios (blue symbols). The dashed line represents the C/O ratio associated with PG (C/O = 2.0). * indicates the inability to differentiate coating from substrate by XPS

S9
A
B
Figure S3. Substrate-independent coatings based on Ctl. (A) Digital images of bare, coated, and silver-stained substrates demonstrating the ability of Ctl to coat a variety of substrates. (B) XPS characterization of substrate-specific electron signal fractions (red bars) and corresponding C/O ratios (blue symbols). The dashed line represents the C/O ratio associated with Ctl (C/O = 3.0). * indicates the inability to differentiate coating from substrate by XPS

S10
A
B
Figure S4. Substrate-independent coatings based on HHQ. (A) Digital images of bare, coated, and silver-stained substrates demonstrating the ability of HHQ to coat a variety of substrates. (B) XPS characterization of substrate-specific electron signal fractions (red bars) and corresponding C/O ratios (blue symbols). The dashed line represents the C/O ratio associated with HHQ (C/O = 2.0). * indicates the inability to differentiate coating from substrate by XPS

S11
A
B
Figure S5. Substrate-independent coatings based on EGCG. (A) Digital images of bare, coated, and silver-stained substrates demonstrating the ability of EGCG to coat a variety of substrates. (B) XPS characterization of substrate-specific electron signal fractions (red bars) and corresponding C/O ratios (blue symbols). The dashed line represents the C/O ratio associated with EGCG (C/O = 2.0). * indicates the inability to differentiate coating from substrate by XPS
S12
400 450 500 550 600 650 700 750 8000
0.05
0.1
0.15
0.2
0.25
0.3
0.35
0.4
0.45
0.5 PCPC + TAPC + PGPC + catecholPC + catechinPC + HHQPC + EGCGPC + pDA
Wavelength (nm)
Abs
orba
nce
(A)
Figure S6. UV-vis spectra of bare and (poly)phenol coated PC. For comparison purposes, PC coated with a comparable thickness of PDa is also shown.

S13
50 µm
PEEK + TA
+ PG
+ catechol
+ catechin
+ HHQ
+ EGCG
Figure S7. SEM micrographs of (poly)phenol coated PEEK membranes (low magnification).
S14
5 µm
PEEK + TA
+ PG
+ catechol
+ catechin
+ HHQ
+ EGCG
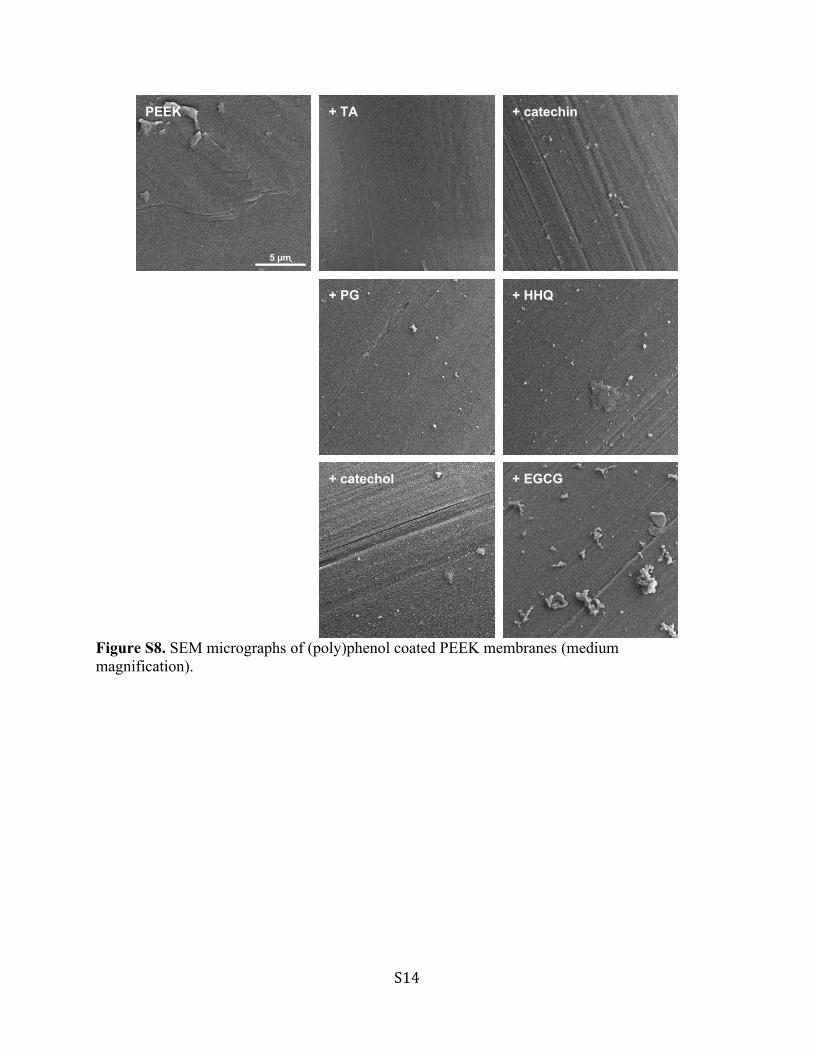
Figure S8. SEM micrographs of (poly)phenol coated PEEK membranes (medium magnification).

S15
500 nm
PEEK + TA
+ PG
+ catechol
+ catechin
+ HHQ
+ EGCG
Figure S9. SEM micrographs of (poly)phenol coated PEEK membranes (high magnification).

S16
50 µm
PEEK + Ag + TA + Ag
+ PG + Ag
+ catechol + Ag
+ catechin + Ag
+ HHQ + Ag
+ EGCG + Ag
Figure S10. SEM micrographs of (poly)phenol coated PEEK membranes treated with AgNO3 (low magnification).

S17
5 µm
PEEK + Ag + TA + Ag
+ PG + Ag
+ catechol + Ag
+ catechin + Ag
+ HHQ + Ag
+ EGCG + Ag
Figure S11. SEM micrographs of (poly)phenol coated PEEK membranes treated with AgNO3 (medium magnification)

S18
500 nm
PEEK + Ag + TA + Ag
+ PG + Ag
+ catechol + Ag
+ catechin + Ag
+ HHQ + Ag
+ EGCG + Ag
Figure S12. SEM micrographs of (poly)phenol coated PEEK membranes treated with AgNO3 (high magnification).
S19
1 µm
PEEK + Ag + TA + Ag
1 µm
+ PG + Ag
+ catechol + Ag
+ catechin + Ag
+ HHQ + Ag
+ EGCG + Ag
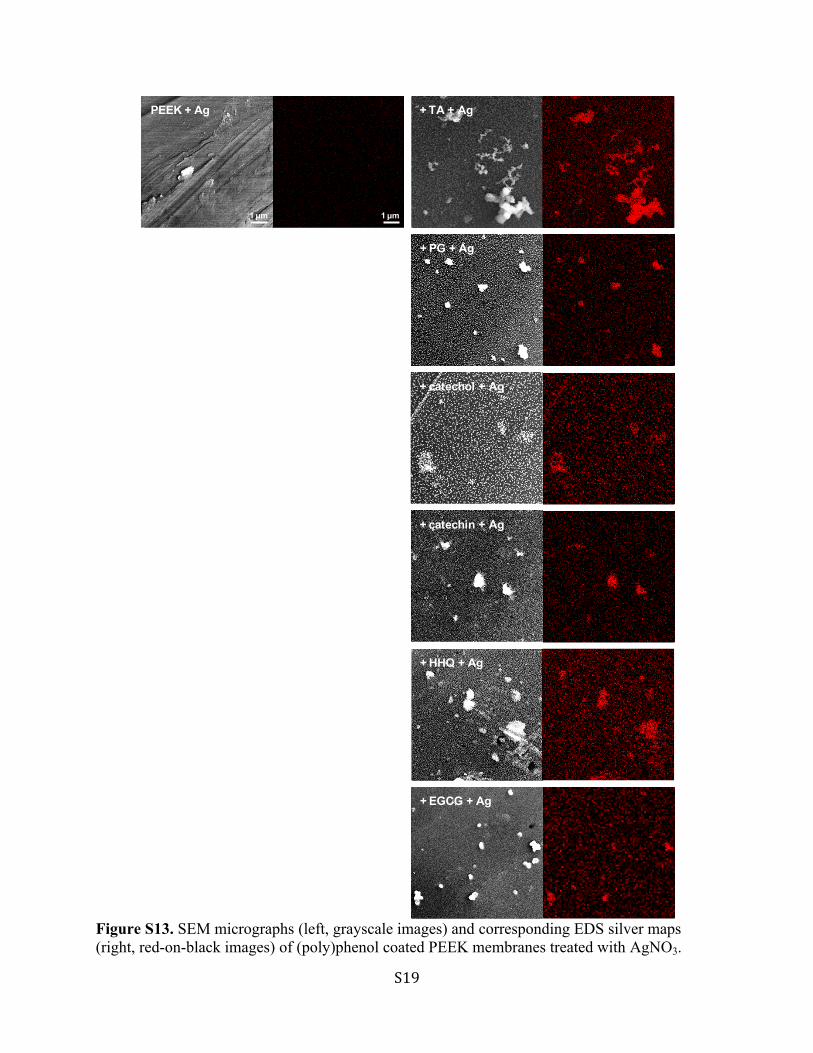
Figure S13. SEM micrographs (left, grayscale images) and corresponding EDS silver maps (right, red-on-black images) of (poly)phenol coated PEEK membranes treated with AgNO3.

S20
Figure S14. Stability of coatings on PC in aqueous buffer at pH 3.
Figure S15. Stability of coatings on PC in aqueous buffer at pH 5.

S21
Figure S16. Stability of coatings on PC in aqueous buffer at pH 7.
Figure S17. Stability of coatings on PC in aqueous buffer at pH 9.