supporting information - royal society of chemistry · supporting information molecular aggregation...
TRANSCRIPT
SUPPORTING INFORMATION
Molecular aggregation of naphthalimide organic semiconductors assisted by amphiphilic and lipophilic interactions: a joint theoretical
and experimental study
I. Arrechea-Marcos,aP. de Echegaray,b,c M.J. Mancheño,bM. C. Ruiz Delgadoa, M. M. Ramos,c J. A. Quintana,d J. M. Villalvilla,e M. A. Díaz-García,eJ. T. López Navarrete,a* R. Ponce Ortiz,a* J.L. Segurab*
aDepartmento de Química Física, Universidadde Málaga, Málaga, 29071, Spain.
bDepartmento de Química Orgánica I, Facultad de Química, Universidad Complutense de Madrid, E-28040 Madrid, Spain.
cDepartmento de Tecnología Química y Ambiental, Universidad Rey Juan Carlos, Madrid 28933, Spain.
d Dpto. Óptica, Instituto Universitario de Materiales de Alicante y Unidad Asociada UA-CSIC, Universidad de Alicante, 03080 Alicante, Spain.
eDpto. Física Aplicada, Instituto Universitario de Materiales de Alicante y Unidad Asociada UA-CSIC, Universidad de Alicante, 03080 Alicante, Spain.
Electronic Supplementary Material (ESI) for Physical Chemistry Chemical Physics.This journal is © the Owner Societies 2017

Contents
1. Materials, instruments and methods
2. Synthetic details
Schemes S1-S3
3. Characterization
3.1. NMR, FT-IR and MS characterization
3.2. Thermogravimetric analysis
Figure S1.Thermal stability of NIP-3TAmphi by TGA
Figure S2.Thermal stability of NIP-3TLipo by TGA
3.3. Molecular Orbitals DFT calculations
Figure S3.B3LYP/6-31G** molecular orbital topologies
3.4. Concentration dependent electronic absorption spectra
Figure S4.UV-Vis spectra of NIP-3TAmphi at different concentrations in a)Dichloromethane, b) Hexane and c) Methanol
Figure S5.UV-Vis spectra of NIP-3TLipo at different concentrations in dichloromethane
Figure S6.UV-Vis spectra of left)NIP-3TAmphi and right)NIP-3TLipoat different mixtures of THF/H2O.
Figure S7.UV-Vis spectra of left) NIP-3TAmphi and right) NIP-3TLipo at two extreme mixtures of THF/H2O (10/90 and 100/0).
3.5. Differential scanning calorimetry (DSC) analysis
Figure S8.DSC plot of NIP-3TLipo
Figure S9.DSC plot of NIP-3TAmphi
3.6. Powder and thin-film XRD analysis
Figure S10. Powder X-ray diffraction of NIP-3TAmphi
Figure S11.Powder X-ray diffraction of NIP-3TLipo.
Figure S12.Thin film X-ray diffraction of NIP-3TAmphi and NIP-3TLipo.
3.7. M062X estimated dimers for NIP-3TAmphi and NIP-3TLipo.

Figure S13. CAM-B3LYP/6-31G** estimated dimers (left: antiparallel
configuration (AP) and right: parallel configuration (P)) for NIP-3TAmphi
and NIP-3TLipo.
3.8. Transfer integral DFT calculation
Figure S14. Evolution of the HOMO and LUMO transfer integrals for an
unsubstitutednaphthalimide-fused thienopyrazinecofacial dimer, as a
function of the short-axis displacements of the top molecule
1. Materials, instruments and methods
All the chemicals were purchased from commercial suppliers and used without further
purification. Compounds1-(2-bromothiophen-3-yl)-2,5,8,11-tetraoxadodecane1, 2-(2-
ethylhexyl)-1H-indeno[6,7,1-def]isoquinoline-1,3,6,7(2H)-tetraone2and 3´,4´- Dinitro-
3,3´´-dioctyl-[2,2´;5´,2´´]terthiophene3were obtained as previously described.
Toluene was freshly distilled over sodium/benzophenone under nitrogen and
Chloroform over calcium hydride before use. 1H NMR and 13C NMR spectra were
recorded on a Bruker Avance 300, and AMX 500 MHz spectrometer. Chemical shifts
are reported in ppm and referenced to the residual non-deuterated solvent frequencies
(CDCl3: δ 7.26 ppm for 1H, δ 77.0 ppm for 13C). UV–vis absorption spectra of the
compounds in HPLC dichloromethane solutions at 20 oC were recorded on a Varian
Cary 50 UV–vis spectrophotometer. Mass spectra were recorded on a MAT95 XP
(FAB/IE) or Bruker Reflex 2 (MALDI-TOF). Cyclic voltammograms were recorded in
an inert atmosphere in electrochemical workstation at a scan rate of 100 mV·s-1 at 20 oC
using tetrabutylammoniumhexafluorophosphate(TBAHFP, 0.1 mol L-1) as supporting
electrolyte in dichloromethane. Polymer-precoated platinum electrode, platinum–wire
electrode, and Ag/Ag+ electrode were used as working electrode, an auxiliary electrode,
and reference electrode, respectively. Potentials were recorded versus Fc/Fc+.
Absorption spectra were recorded with a Cary 5000 spectrophotometer from Varian
operating in a maximal 175–3300 nm range.2Me-THFsolutions were prepared to obtain
the spectra at different temperatures from room conditions to 79 K in a cryostat
OPTISTAT from Oxford instruments.
Emission and excitation spectra were measured using a spectrofluorometer from
Edinburgh Analytical Instrument (FLS920P) equipped with a pulsed xenon flash-lamp,

Xe900, of 400 mW. 2Me-THF solutions were prepared to obtain the spectra at different
temperatures from room conditions to 79 K in a cryostat OPTISTAT from Oxford
instruments.
Scanning electron microscopy images were obtained on a JEOL JSM 6335F microscope
working at 10kVand on anHelios Nanolab 650 Dual Beam from FEI company. The
latter is a microscope with a Schottky field emission source for SEM (FESEM) and a
Tomohawk focused ion beam (FIB). The microscope is equipped with energy dispersive
X-ray detector (EDS) and electron backscatter diffraction detector (EBSD) from
Oxford.
TGA and DSC measurements were performed at a heating rate of 10 ºC/min under
nitrogen flow on a TA Instruments SDT Q600 and a METTLER TOLEDO DSC822
respectively.
X-ray diffraction was performed in a Panalytical X’Pert PRO diffractometer with Cu
tube and primary beam monochromator (lambda Kα=1.5406 Å) operated at 45 kV, 40
mA, programmable divergence slit working in fixed mode, and fast linear detector
(X’Celerator) working in scanning mode. Samples were deposited on “zero
background” silicon sample holders and measured in reflection geometry.
The electrical measurements were made by using Linkam cells which require small
amounts of materials and allow the formation of very uniform films. They consist of
two indium tin oxide (ITO)-coated parallel glass plates with a gap of 5.0 µm and an
effective area of 0.81 cm2 which were capillary-filled with NIP-3TAmphi and NIP-
3TLipo. The mobility of charge carriers at RT was determined by employing the time of
flight (TOF) technique. The excitation source was a pulsed Nd:YAG laser (7 ns, 10 Hz)
operating at 355 nm, which is close to the wavelength of maximum absorbance of the
NIP-3T derivatives.
Photoconductivity measurements were also carried out in the spectral region of
maximum absorption. A high-pressure mercury vapor lamp and a 12 nm bandwidth
interferential filter with maximum transmission at 365 nm was the light source selected
to illuminate the samples. The applied field was 0.4 V/µm and the light intensity 1
mW/cm2. Current densities in the absence of light, jdark, and under illumination, jlight,
were measured. Then, corrected photocurrent densities, jphot, defined as jlight - jdark, and
photosensitivities, S = jphot / jdark, were calculated.

The theoretical study was carried out in the frame of density functional theory (DFT)
using the B3LYP functional1,2 and the 6-31G** basis set3,4 as implemented in the
Gaussian 09 program.5 The geometry optimizations were performed without any
symmetry constraints. On the basis of the resulting ground-state geometries, harmonic
vibrational frequencies were calculated analytically at the same theoretical level. The
reorganization energies, were calculated directly from the relevant points on the
potential energy surfaces using the standard procedure detailed in the literature.6
To gain further insight into the aggregation behavior of the NPI dimers, DFT
calculations were conducted for two different dimers for each molecule (i.e.,NIP-
3TAmphi and NIP-3TLipo), one in a parallel (P) and the other in an antiparallel (AP)
fashion. The more recently developed long-range corrected Coulomb attenuated method
of B3LYP (CAM-B3LYP functional)7 was used to evaluate the dimer ground-state
geometries. Vertical electronic excitation energies were computed by using the time-
dependent DFT (TD-DFT) approach8 on the previously optimized dimer geometries.
CAM-B3LYP and wB97XD9 functionals were employed to examine the excited-state
properties.
The transfer integrals of the optimized dimers were calculated at the B3LYP/6-31G(d,p)
level, according to the approach described by Valeev et al.10 with the corresponding
matrix elements evaluated with Gaussian 09.Note that the coupling values depend on
the functional used and generally increase with the increasing percentage of Hartree-
Fock exchange in the functional.11 We also computed the transfer integrals for model
cofacial dimers of unsubstituted naphthalimide-fused thienopyrazine when one of the
molecules is translated along its short axis.
[1] Becke, A. D. Density-Functional Thermochemistry. III. The Role of Exact
Exchange. J. Chem. Phys.,1993, 98, 5648−5652. (31) Lee, C. T.; Yang, W. T.; Parr, R.
G. Development of the Colle- Salvetti Correlation-Energy Formula into a Functional of
the Electron-Density. Phys. Rev. B.,1988, 37, 785−789.
[2] Lee, C. T.; Yang, W. T.; Parr, R. G. Development of the Colle-Salvetti Correlation-
Energy Formula into a Functional of the Electron-Density. Phys. Rev. B.,1988, 37,
785−789.
[3] Harihara, P. C.; Pople, J. A. Influence of Polarization Functions on Molecular-
Orbital Hydrogenation Energies. Theor.Chim.Acta.,1973, 28, 213−222.

[4] Hehre, W. J.; Ditchfield, R.; Pople, J. A. Self-Consistent Molecular-Orbital
Methods. 12. Further Extensions of Gaussian-Type Basis Sets for Use in Molecular-
Orbital Studies of Organic-Molecules. J. Chem. Phys.,1972, 56, 2257−2261.
[5] Frisch, M. J.; et al. Gaussian 09, revision C.01; Wallingford, CT, 2009.
[6] Brédas, J. L.; Beljonne, D.; Coropceanu, V.; Cornil, J. Chem. Rev.,2004, 104, 4971.
[7] T. Yanai, D. P. Tew, and N. C. Handy, Chem. Phys. Lett., 2004, 393, 51–57.
[8]M. E. Casida in Recent Advances in Density Functional Methods, (Ed. D. P. Chong),
World Scientific, Singapore, 1995, p. 115.
[9]J.-D. Chai, M. Head-Gordon, Phys. Chem. Chem. Phys.,2008, 10, 6615 –
6620.
[10] Valeev E. F.; Coropceanu V; da Silva D. A., Salman S., Bredas J. L.,J. Am. Chem.
Soc., 2006, 128, 9882.
[11] Sini G., Sears J. S., Bredas J. L., J. Chem. Theory Comput.,2011,7, 602.

2. Synthetic details
All compounds were synthesized according to Schemes S1-S3.
Scheme 1
S
C8H17
S
C8H17NBS
Acetic Acid Br S
C8H17
SnBu3
n-BuLiClSnBu3
THF
S
O2N NO2
BrBr
ToluenePd(PPh3)4
SS S
O2N NO2
C8H17 C8H17
H2Ni/Raney EtOH
SS S
H2N NH2
C8H17 C8H17
7Scheme 2
6
N
O O
OO
Bu
Et
N OO
N N
SSS
O
O
O
O
O
O
O
O
NIP-3TAmphi
N
N N
OO
SS S
Et
Bu
Et
Bu
5 7CHCl3
70 ºC, 24 hp-TsOH ac.
CHCl3
70 ºC, 24 h69% 68%
p-TsOH ac.
NIP-3TLipo
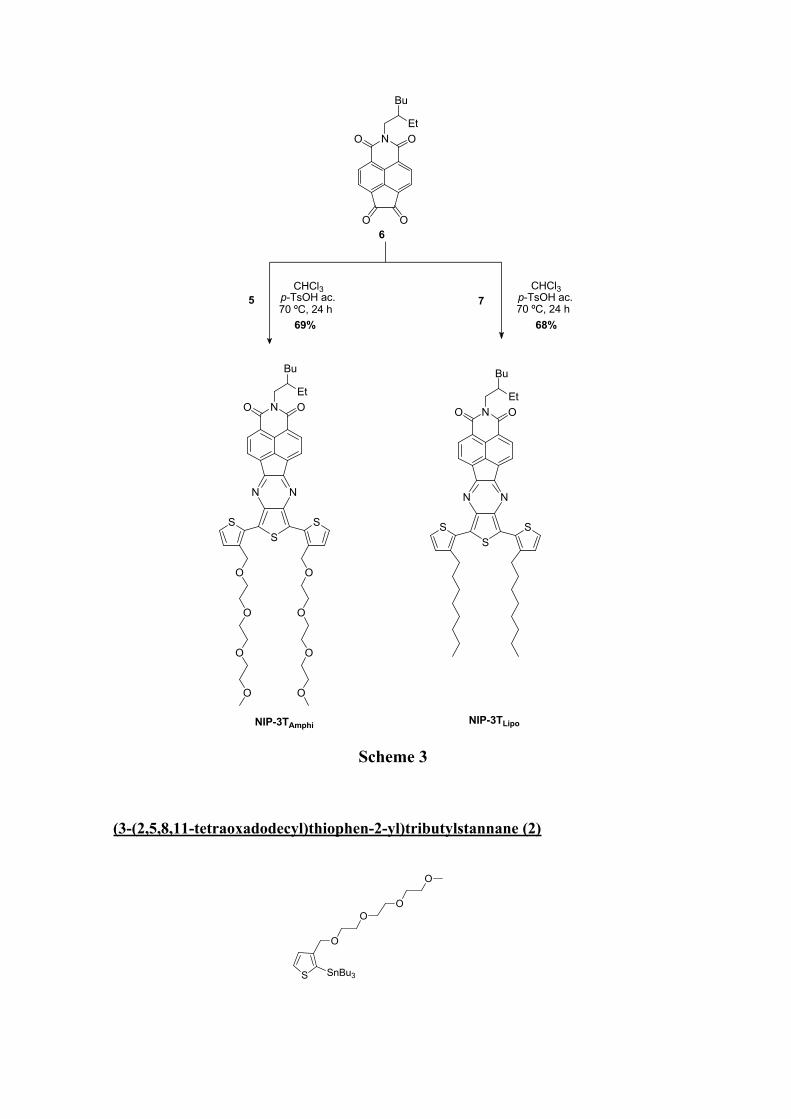
Scheme 3
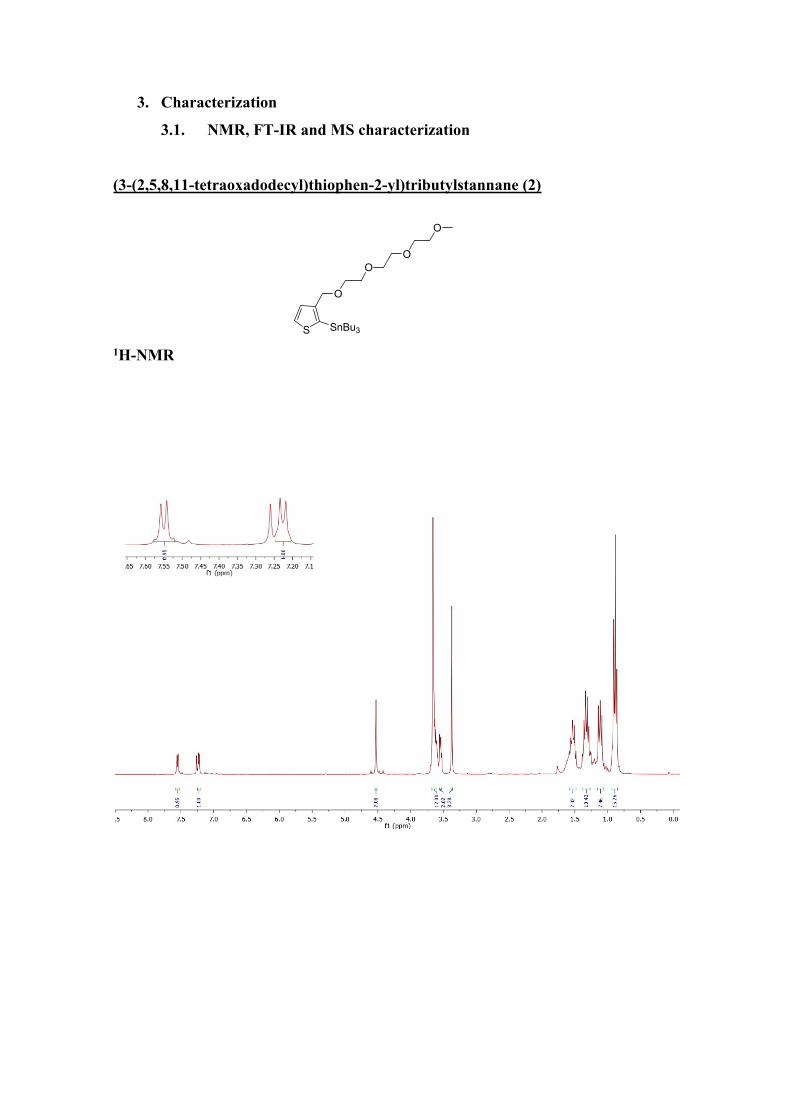
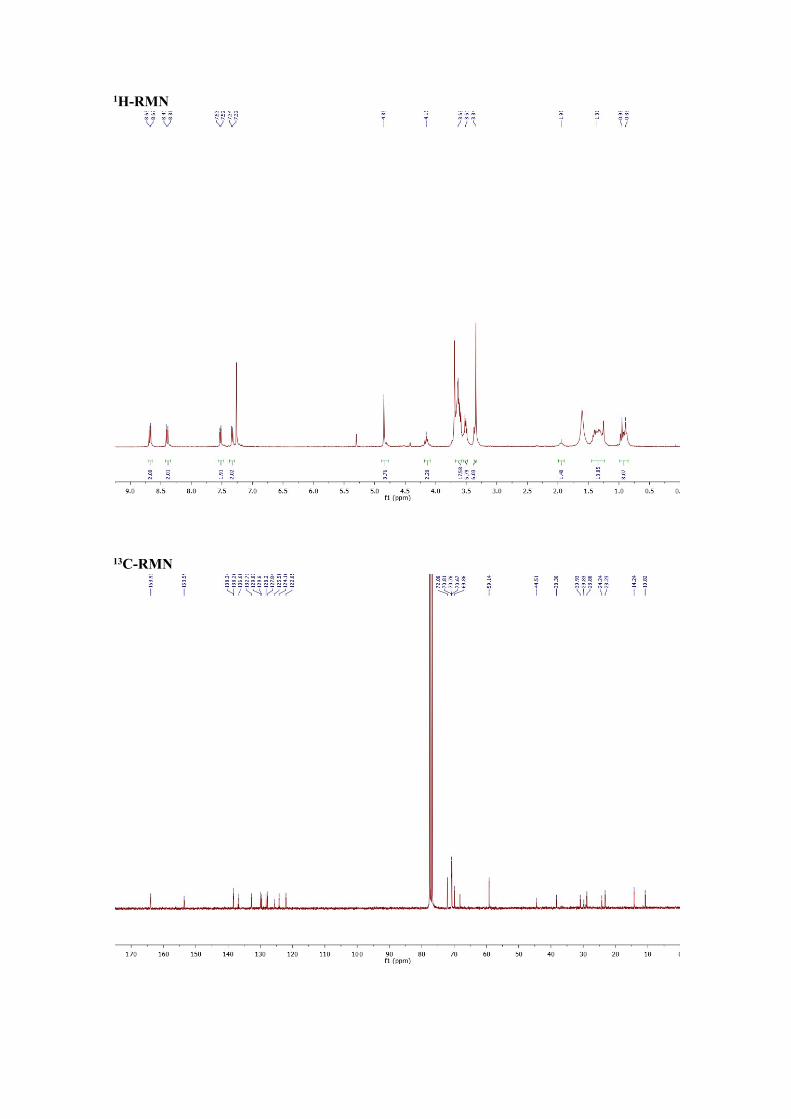
(3-(2,5,8,11-tetraoxadodecyl)thiophen-2-yl)tributylstannane (2)
S
O
OO
O
SnBu3

1-(2-bromothiophen-3-yl)-2,5,8,11-tetraoxadodecane1(500 mg, 1.47 mmol)1 was
dissolved in 26 mL of THF under argon atmosphere in the absence of light. The mixture
was cooled at -78ºC and n-BuLi (1.25 mL, 1.47 mmol) was added dropwise. The
reaction was stirred for 1.5 h at that temperature. Then tributyltin chloride (0.4 mL, 1.47
mmol) was added and the mixture was stirred at room temperature overnight. After the
removal of the solvent under reduced pressure the crude was dissolved in
dichloromethane and washed with NH4Cl and water. The organic layer was dried over
MgSO4, filtered and finally solvent was removed in vacuo. The crude reaction was
chromatographied on basic alumina (hexane) and the tributyltin chloride excess was
distilled off yielding 538 mg (67%) of product as a clear oil.
1H-NMR (300 MHz, CDCl3) δ (ppm)= 7.55 (d, J= 4.7 Hz, 1H,Ar), 7.23 (d, J=
4.7 Hz, 1H,Ar), 4.53 (s, 2H), 3.70-3.57 (m, 10H), 3.55 (m, 2H), 3.37 (s, 3H), 1.53 (m,
6H), 1.39-1.23 (m,6 H), 1.20-1.05 (m, 6H), 0.88 (t, J= 7.3 Hz, 9H).
13C-NMR (75MHz, CDCl3) δ (ppm)=146.7, 134.9, 131.1, 129.3, 72.1, 70.8,
70.4, 69.4, 59.2, 29.1, 27.4, 13.8, 11.2.
FTIR (ATR, CH2Cl2), (cm-1) = 2955, 2922, 2865, 1675, 1522, 1459, 1417,
1372, 1292, 1248, 1198, 1105, 1029, 960, 873, 698, 669, 596.
MS (EI) m/z = calc. 550.21; found 573.28 (M+Na+).
1,1'-(3',4'-dinitro-[2,2':5',2''-terthiophene]-3,3''-diyl)bis(2,5,8,11-tetraoxadodecane) (4)
SS S
O2N NO2
O
O
O
O
O
O
O
O

A mixture of (3-(2,5,8,11-tetraoxadodecyl)thiophen-2-yl)tributylstannane2 (400
mg, 0.73 mmol), 2,5-dibromo-3,4-dinitrothiophene (80.8 mg, 0.24 mmol) and a
catalytic amount of Pd(PPh3)4 (5%) were dissolved in 27 mL of degassed anhydrous
toluene. The mixture was refluxed under stirring for 21 h under argon. Then, the
mixture was cooled to room temperature and the solvent was removed under reduced
pressure. The crude was dissolved in dichloromethane and washed with NH4Cl and
water. The organic layer was dried over MgSO4, filtered and finally the solvent was
removed in vacuum. The solid was purified by column chromatography on silica gel
(ethyl acetate/methanol) yielding 150.5 mg (90%) of4 as a brown oil.
1H-NMR (300 MHz, CDCl3) δ (ppm)= 7.53 (d, J= 5.2 Hz, 2H, Ar), 7.21 (d, J=
5.2 Hz, 2H, Ar), 4.54 (s, 4H), 3.64-3.61 (m, 20H), 3.54 (m, 4H), 3.36 (s, 6H).
13C-NMR (75MHz, CDCl3) δ (ppm)= 142.3, 138.6, 134.2, 129.6, 129.5, 123.0,
72.0, 70.7, 70.6, 70.5, 70.0, 67.2, 59.1.
FTIR (ATR, CH2Cl2), (cm-1) = 3098, 2921, 2854, 1717, 1539, 1461, 1400,
1378, 1349, 1323, 1246, 1198, 1104, 1030, 965, 847, 800, 751, 704.
MS (MALDI TOF)(m/z) =calc.690.15; found713.04 (M+Na+).
3,3''-di(2,5,8,11-tetraoxadodecyl)-[2,2':5',2''-terthiophene]-3',4'-diamine (5)
A solution of 1,1'-(3',4'-dinitro-[2,2':5',2''-terthiophene]-3,3''-diyl)bis(2,5,8,11-
tetraoxadodecane)4 (95 mg, 0.14mmol)and Ni/Raney in ethanol was stirred under
hydrogen pressure (1 atm ) at 12ºC overnight. The mixture was filtered over celite under
SS S
H2N NH2
O
O
O
O
O
O
O
O

argon atmosphere, washed with chloroform and acetone. The organic layer was dried
over MgSO4 and the solvent was removed under reduced pressure to a quantitatively
yieldof 5 as a brown solid. Due to instability diamine 5 was used without further
purification.
1H-NMR (300 MHz, CDCl3) δ (ppm)= 7.28 (d, J =6 Hz, 2H), 7.13 (d, J =6 Hz,
2H), 4.48 (s, 4H), 3.67 (m, 20H), 3.54 (m, 4H) 3.35 (s, 6H).
FTIR (ATR, CH2Cl2), (cm-1) = 3414, 3348, 2922, 2855, 1737, 1636, 1507,
1451, 1392, 1349, 1529, 1198, 1175, 1100, 1024, 937, 846, 801, 735, 697, 658, 638,
544.
MS (EI) m/z = calc. 630.2; found630.2 (M+.)
3´,4´- Diamino-3,3´´-dioctyl-[2,2´;5´,2´´]terthiophene (7)
A solution of 3´, 4´- Dinitro-3,3´´-dioctyl-[2,2´; 5´,2´´] terthiophene3(116.3 mg,
0.21 mmol) and Ni/Raney in 14 mL of ethanol was stirred under hydrogen pressure (1
atm) at 12ºC overnight. The mixture was filtered over celite under argon, washed with
dichloromethane and the organic layer was dried over MgSO4. Solvent was removed
under reduced pressure to a quantitatively yield of 6 as a brown solid. Due to instability
diamine 6 was used without further purification. Compound 7 was checked by
comparison with reported data3.
NIP-3TAmphi
SS S
H2N NH2
C8H17 C8H17
N
O
ON
N
S
S
S
Bu
Et
OO
OO
OO
OO

To a 20 mL chloroform solution of 2-(2-ethylhexyl)-1H-indeno[6,7,1-
def]isoquinoline-1,3,6,7(2H)-tetraone2 (50.8 mg, 0.14 mmol), a catalytic amount of ac.
p-TsOH.(10%) was added and the mixture was heated at 70ºC. When the temperature
reached 50ºC a solution in chloroform of 3,3''-di(2,5,8,11-tetraoxadodecyl)-[2,2':5',2''-
terthiophene]-3',4'-diamine4 (99.5 mg, 0.157 mmol) was added. The mixture turns
quickly to a red wine color. The mixture was stirred for 22 h at 70ºC. Then the crude
was washed with Na2CO3, the organic layer was dried over MgSO4 and the solvent was
removed in vacuum. The solid was chromatographied on silica gel
(dichloromethane/methanol) to obtain 93.0 mg (69%) of a blue solid.
1H-NMR ( 300 MHz, CDCl3) δ (ppm) = 8.68 (d, J=6.0 Hz, 2H), 8.40 (d, J=6.0,
2H), 7.52 (d, J=6.0 Hz, 2H), 7.33 (d, J=6.0 Hz, 2H), 4.85 (s, 4H), 4.18-4.13 (m, 2H),
3.66-3.59 (m, 18H), 3.53-3.49 (m, 6H), 3.34 (s,6H), 1.95 (m, 1H), 1.43-1.25 (m, 8H),
0.97-0.87 (m,6H)
13C-NMR (75MHz, CDCl3) δ (ppm)=163.9, 153.6, 138.3, 138.2, 136.9, 136.7,
132.7, 129.9, 129.6, 128.2, 127.8, 125.6, 124.2, 122.0, 72.0, 70.8, 70.7, 70.6, 69.8, 68.1,
59.1, 44.5, 38.3, 30.9, 29.8, 28.8, 24.2, 23.2, 14.2, 10.8.
FTIR (ATR, CH2CL2), (cm-1) = 2925, 2855, 1705, 1669, 1538, 1460, 1408,
1374, 1332, 1230, 1108, 991, 874, 829, 715, 686, 634, 578.
MS (MALDI TOF HR) (m/z) = calc. 957.3; found 980.3 (M+Na+)
NIP-3TLipo
To a 27 mL chloroform solution of 2-(2-ethylhexyl)-1H-indeno[6,7,1-
def]isoquinoline-1,3,6,7(2H)-tetraone2 (62.6 mg, 0.17mmol), a catalytic amount of ac.p-
N
N
NO
O
S
S
S

TsOH (10%) was added and the mixture was heated at 70ºC. When the temperature
reached 50ºC a solution in chloroform of 3´,4´- Diamino-3,3´´-dioctyl-
[2,2´;5´,2´´]terthiophene6 (104.3 mg, 0.21 mmol) was added. The mixture turns quickly
to a dark purple color. The mixture was stirred for 22 h. Then, the solvent was removed
under reduced pressure and the crude was dissolved in dichloromethane and washed
with Na2CO3. The organic layer was dried over MgSO4 and the solvent was removed by
rotary evaporation. The solid was chromatographied on silica gel
(dichloromethane/hexane) to obtain 97.6 mg (68%) of a blue solid.
1H-NMR ( 300 MHz, CDCl3) δ(ppm)= 8.65 (d, J=7.4 Hz, 2H), 8.37 (d, J=7.4
Hz, 2H), 7.49 (d, J=5.2 Hz, 2H), 7.10 (d, J=5.2 Hz, 2H), 4.15 (m, 2H), 2.96-2.93 (m,
4H), 1.94 (s, 1H), 1.83-1.73 (m, 4H), 1.40-1.21 (m, 28 H), 0.97-0.80 (m, 12H).
13C-NMR (75MHz, CDCl3) δ (ppm)= 164.0, 153.2, 142.4, 138.0, 136.9, 136.8,
132.6, 129.8, 128.2, 127.6, 127.2, 123.9, 121.9, 38.3, 32.0, 30.7, 29.9, 29.7, 29.4, 24.2,
23.2, 22.8, 14.3, 14.2, 10.8.
FTIR (ATR, CH2Cl2), (cm-1) =2956, 2925, 2855, 1736, 1702, 1666, 1637,
1458, 1327, 1235, 1169, 1082, 857, 821, 748, 698.
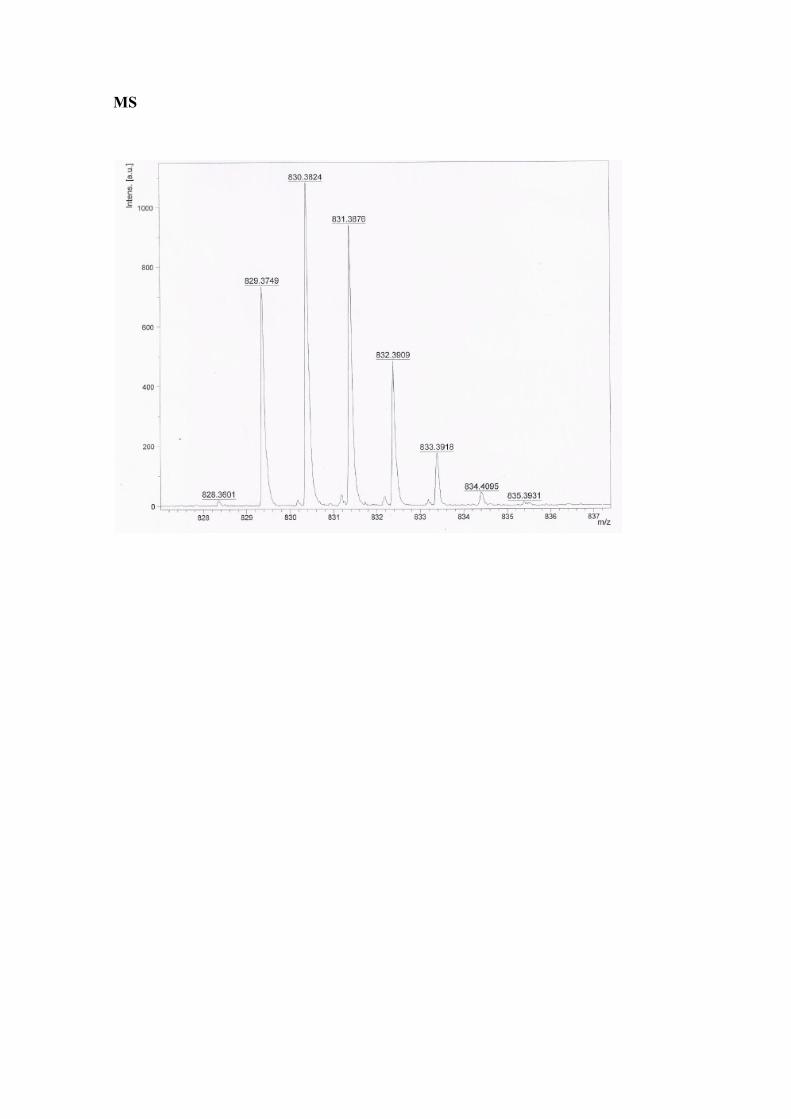
MS (MALDI TOF HR) (m/z) = calc.829.3769; found. 830.3824(M+H+).
References:
[1] TomoyaHigashihara, Kaoru Ohshimizu, Yecheol Ryo, Takuya Sakurai, Ayumi Takahashi, Shuichi Nojima, MoonhorRee, Mitsuru Ueda, Polymer, 2011, 52, 3687
[2]Helena Herrera, Paula de Echegaray, Marta Urdanpilleta, María J. Mancheño,Elena Mena-Osteritz, Peter Baüerle and Jose L. Segura, Chem. Commun.,2013,49, 713.
[3]Luis M. Campos, Ana Tontcheva, SerapGünes, GurselSonmez, Helmut Neugebauer, N. SerdarSariciftci, and Fred Wudl, Chemistry of materials, 2005, 17, 4031.
3. Characterization
3.1. NMR, FT-IR and MS characterization
(3-(2,5,8,11-tetraoxadodecyl)thiophen-2-yl)tributylstannane (2)
1H-NMR
S
O
OO
O
SnBu3

13C-NMR
IR

1,1'-(3',4'-dinitro-[2,2':5',2''-terthiophene]-3,3''-diyl)bis(2,5,8,11-tetraoxadodecane) (4)
1H-NMR
2.83.03.23.43.63.84.04.24.44.64.85.05.25.45.65.86.06.26.46.66.87.07.27.47.67.8f1 (ppm)
6.15
4.85
22.1
8
4.26
2.02
2.00
3.36
3.53
3.53
3.54
3.54
3.61
3.61
3.62
3.63
3.64
4.54
7.20
7.22
7.52
7.54
SS S
O2N NO2
O
O
O
O
O
O
O
O

13C-NMR
4550556065707580859095100105110115120125130135140145150f1 (ppm)
59.1
1
67.2
470
.10
70.6
270
.70
70.7
472
.05
123.
05
129.
5112
9.59
138.
60
142.
32
IR

3,3''-di(2,5,8,11-tetraoxadodecyl)-[2,2':5',2''-terthiophene]-3',4'-diamine (5)
1H-NMR
2.53.03.54.04.55.05.56.06.57.07.58.0f1 (ppm)
6.01
3.92
2.00
1.95
3.35
3.63
4.48
7.13
7.15
7.27
7.29
SS S
H2N NH2
O
O
O
O
O
O
O
O

IR
NIP-3TAmphi
N
O
ON
N
S
S
S
Bu
Et
OO
OO
OO
OO
1H-RMN
13C-RMN

IR
MS

NIP-3TLipo
1H-NMR
0.00.51.01.52.02.53.03.54.04.55.05.56.06.57.07.58.08.59.0f1 (ppm)
14.1
1
33.3
4
4.10
1.37
3.84
2.05
2.04
1.75
2.00
2.12
0.80
0.83
0.85
0.89
0.91
0.92
0.95
0.97
1.21
1.22
1.23
1.25
1.73
1.76
1.78
1.81
1.83
1.94
2.91
2.93
2.96
4.12
4.14
4.17
7.09
7.11
7.48
7.50
8.36
8.38
8.64
8.66
N
N
NO
O
S
S
S

13C-NMR
IR
MS

3.2. Thermogravimetric analysis
Figure S1. Thermal stability of NIP-3TAmphi by thermogravimetric analysis (TGA) in nitrogen gas at a heating of 10ºC/min.
Figure S2. Thermal stability of NIP-3TLipo by thermogravimetric analysis (TGA) in nitrogen gas at a heating of 10ºC/min.
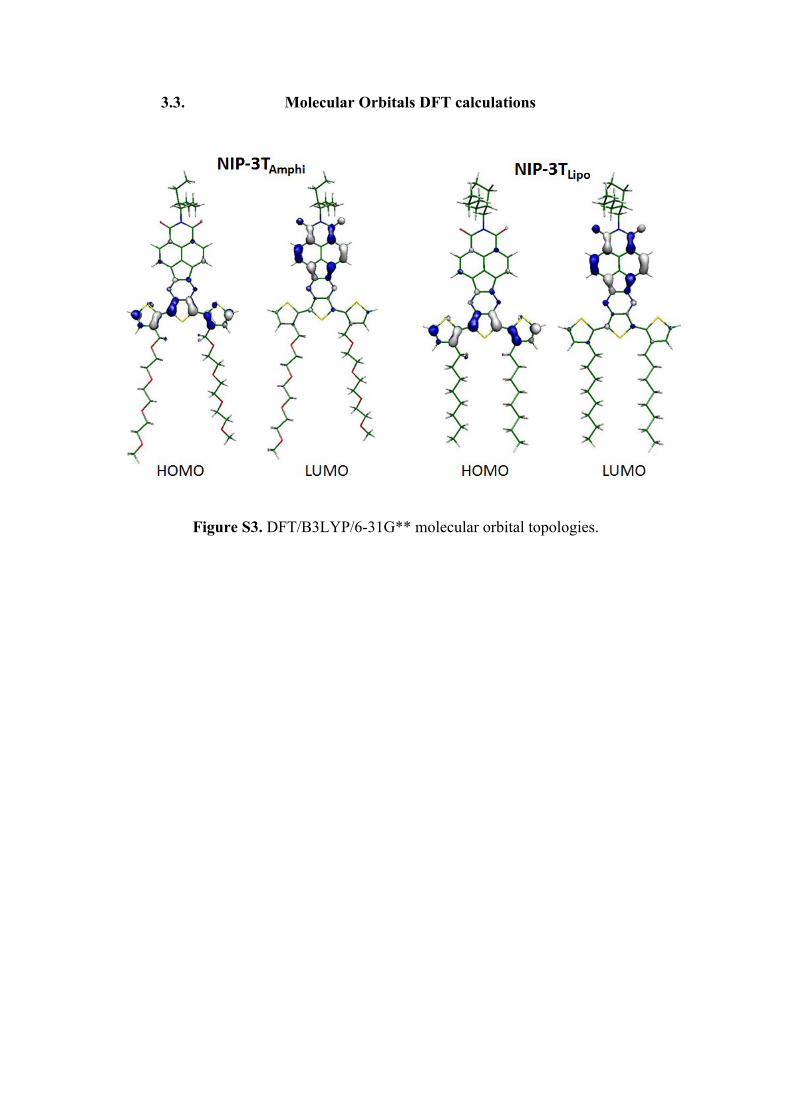
3.3. Molecular Orbitals DFT calculations
Figure S3. DFT/B3LYP/6-31G** molecular orbital topologies.

3.4. Concentration dependent electronic absorption.
300 400 500 600 7000,00,20,40,60,81,01,21,41,61,8
3,9 10-7 M 3,1 10-7 M 1,9 10-7 M 7,0 10-8 M 6,2 10-7 M 5,4 10-8 M 3,9 10-8 MAb
s (u
.a.)
(nm)
a
300 400 500 600 7000,0
0,2
0,4
0,6
0,8
3,1 10-4 M 1,5 10-4 M 6,2 10-5 M 3,1 10-5 M
Abs
(u.a
.)
(nm)
b
300 400 500 600 7000,0
0,5
1,0
1,5
2,0
7,8 10-5 M 3,1 10-5 M 2,7 10-5 M 2,3 10-5 M 1,6 10-5 M 1,5 10-5 M 7,8 10-6 M
Abs
(u.a
.)
(nm)
c
Figure S4.UV-Vis spectra of NIP-3TAmphi at different concentrations in a)Dichloromethane, b) Hexane and c) Methanol.
300 400 500 600 7000,00,10,20,30,40,50,60,70,80,91,0
Abs
(u.a
.)
(nm)
--- 1,95 10-5
--- 1,56 10-5
- 1,17 10-5
- 7,8 10-6
... 6,24 10-6
... 4,68 10 -6
-.- 3,12 10-6
-.- 1,56 10-6
- 7,8 10-7
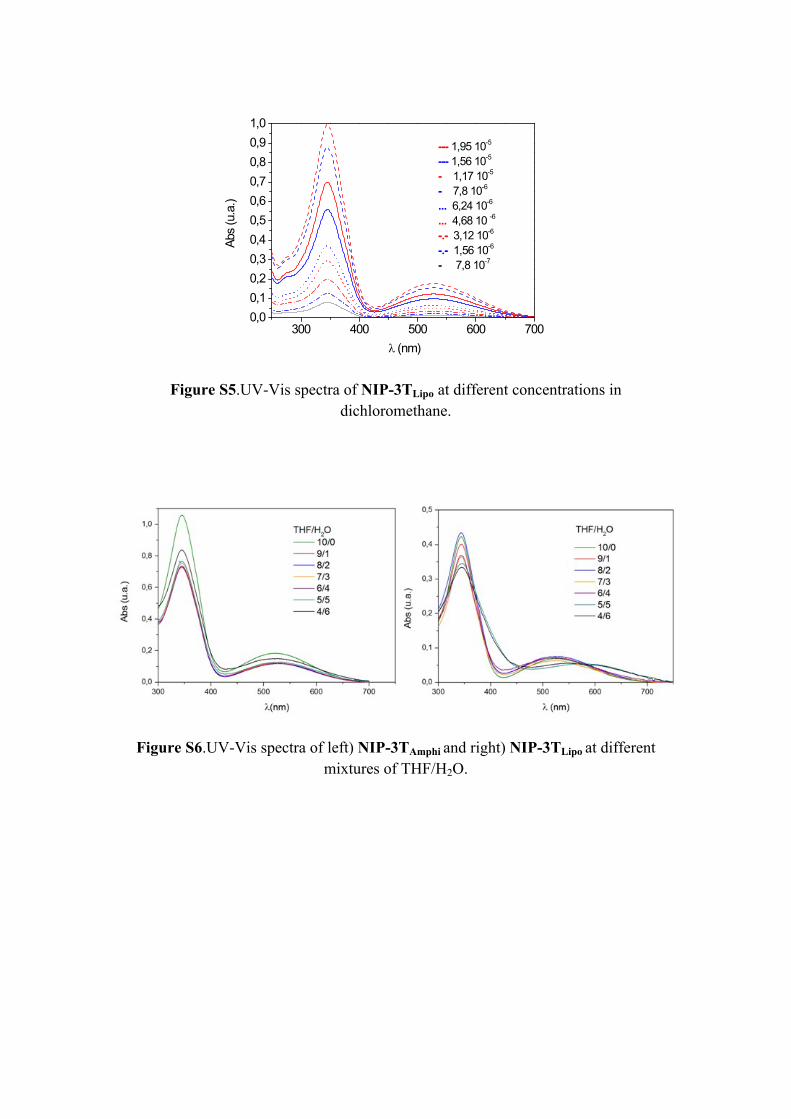
Figure S5.UV-Vis spectra of NIP-3TLipo at different concentrations in dichloromethane.
Figure S6.UV-Vis spectra of left) NIP-3TAmphi and right) NIP-3TLipo at different mixtures of THF/H2O.

Figure S7.UV-Vis spectra of left) NIP-3TAmphi and right) NIP-3TLipo at two extrememixtures of THF/H2O (10/90 and 100/0).
3.5. Differential scanning calorimetry (DSC analysis)
Figure S8. Differential Scanning calorimetry (DSC) curve of compound NIP-3TAmphiat a heating rate of 10ºC/min.
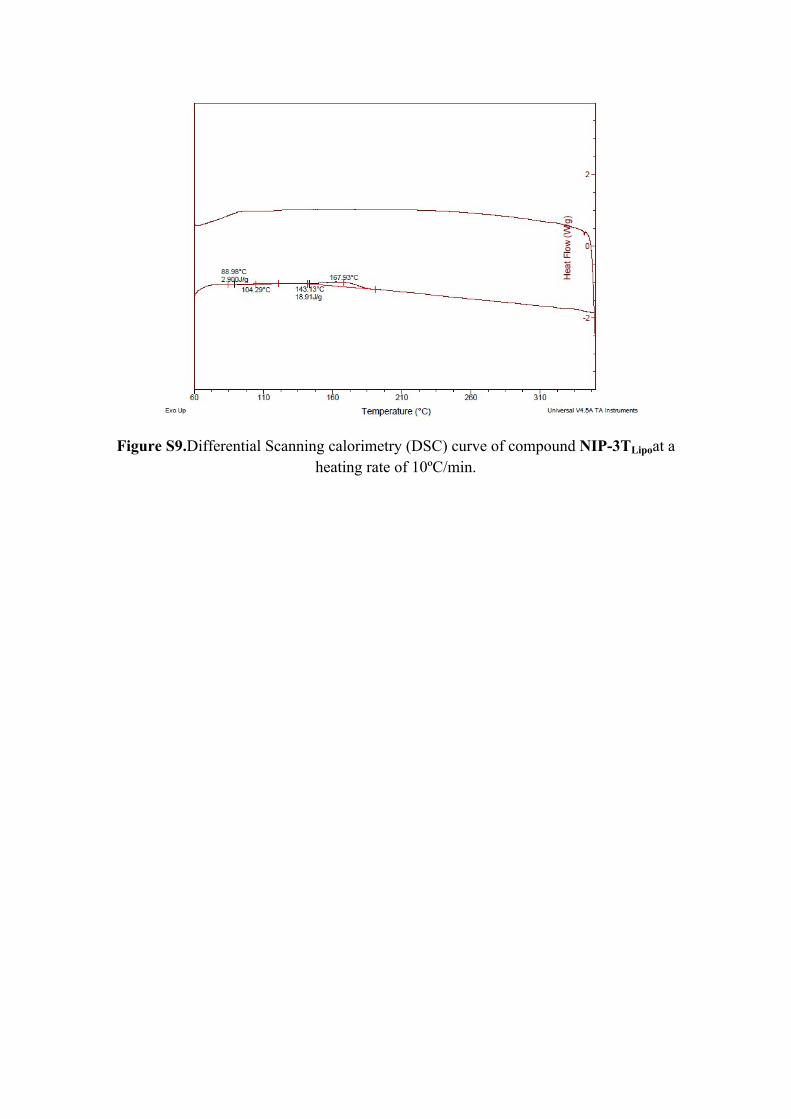
Figure S9.Differential Scanning calorimetry (DSC) curve of compound NIP-3TLipoat a heating rate of 10ºC/min.

3.6. Powder and thin film XRD analysis
The powder X-ray diffraction (XRD) analysis for NIP-3TLipo showed two peaks corresponding to d-spacingsof 23.71 and 18.29while NIP-3TAmphi showed a set of four distinct peaks with d-spacings of 26.33, 16.88, 10.97 and 8.16 Å thus reflecting the more ordered structure of the amphiphilic derivative (Figure S13).
Peak List:
Pos. [°2Th.] Height [cts] d-spacing [Å] Rel. Int. [%]
3.3546 1357.78 26.33826 100.00
5.2347 529.68 16.88224 39.01
8.0581 34.91 10.97233 2.57
10.8335 41.58 8.16680 3.06
Figure S10.Powder X-ray diffraction of NIP-3TAmphi.
0 5 10 15 20 25 300
500
1000
1500
2000
2500
3000
Position [º2Theta] (Copper (Cu))

Position [°2Theta] (Copper (Cu))
10 20 30 40
Counts
0
2000
4000
1431200020101; PE96; 25.00 [°C]; Measured: 15/01/2014 12:43:36
Peak list:
Figure S11.Powder X-ray diffraction of NIP-3TLipo.
Pos. [°2Th.] Height [cts] d-spacing [Å] Rel. Int. [%]
3.7258 4044.60 23.71550 100.00
4.8315 670.66 18.29014 16.58

Thin film XRD analysis
Figure S12.Thin film X-ray diffraction of NIP-3TAmphi and NIP-3TLipo.
3.7. M062X estimated dimers for NIP-3TAmphi and NIP-3TLipo.
Figure S13.M062X/6-31G** estimated dimers (left: antiparallel configuration (AP) and right: parallel configuration (P)) for NIP-3TAmphi and NIP-3TLipo.

3.8. Transfer integral DFT calculation.
Figure S14.Evolution of the HOMO and LUMO transfer integrals for an unsubstituted naphthalimide-fused thienopyrazine cofacial dimer, as a function of the short-axis
displacements of the top molecule. The intermolecular distance is set at 3.50 Å, the average intermolecular separation found in crystals of -conjugated molecules along the
π-stacks.