supporting online material for - omar yaghi's...
TRANSCRIPT

www.sciencemag.org/cgi/content/full/316/5822/268/DC1
Supporting Online Material for
Designed Synthesis of 3D Covalent Organic Frameworks
Hani M. El-Kaderi, Joseph R. Hunt, José L. Mendoza-Cortés, Adrien P. Côté,
Robert E. Taylor, Michael O’Keeffe, Omar M. Yaghi*
*To whom correspondence should be addressed. E-mail: [email protected]
Published 13 April 2007, Science 316, 268 (2007)
DOI: 10.1126/science.1139915
This PDF file includes:
Materials and Methods Figs. S1 to S56 Tables S1 to S6 References

S1
Materials and Methods for Designed Synthesis of 3-D Covalent Organic Frameworks
Hani M. El-Kaderi1, Joseph R. Hunt1, José L. Mendoza-Cortés1, Adrien P. Côté1, Robert E. Taylor1, Michael O’Keeffe2, Omar M. Yaghi1*
1Center for Reticular Chemistry at California NANOSystems Institute, Department of
Chemistry and Biochemistry, University of California, Los Angeles, 607 Charles E.
Young Drive East, Los Angeles, California 90095, USA. 2Department of Chemistry and
Biochemistry, Arizona State University, Tempe, Arizona 85287, USA.
*To whom correspondence should be addressed. E-Mail: [email protected]
Materials and Methods Table of Contents Section S1 3-D COF Structural Models and Calculation of Simulated
PXRD Patterns S2
Section S2 X-ray Data Collection, Unit Cell Determination, and Le Bail
Extraction S7
Section S3 Synthetic Procedures for the Preparation of COF-102, COF-
103, COF-105, and COF-108 and Activation Methods for Gas Adsorption Measurements
S18
Section S4 FT-IR Spectroscopy of Starting Materials, Model Compounds,
COF-102, COF-103, COF-105, and COF-108 S21
Section S5 Solid-State 11B MAS, 29Si MAS and 13C CP-MAS Nuclear
Magnetic Resonance Studies for COF-102, COF-103, COF-105, and COF-108, and Model Compounds
S30
Section S6 Scanning Electron Microscopy Imaging (SEM) of COF-102,
COF-103, COF-105, and COF-108 S56
Section S7 Thermogravimetric Analysis for COF-102, COF-103, COF-105,
and COF-108 S61
Section S8 Low Pressure (0 – 1.0 bar) Gas Adsorption Measurements for
COF-102 and COF-103 S65
S2
Materials and Methods Section S1: 3-D COF Structural Models and Calculation of
Simulated PXRD patterns.
Cerius2 Modeling (development of synthetic blueprint for 3-D COFs).
All models were generated using the Cerius2 chemical structure-modeling
software suite (1) employing the crystal building module. Carbon nitride structures were
created by starting with the space group dI 34 , cell dimensions and vertex positions
obtained from the Reticular Chemistry Structure Resource (http://okeeffe-
ws1.la.asu.edu/RCSR/home.htm) under the symbol ctn (2). The model of COF-102 was
built from ctn by replacing the nitrogen (3-coordinate node) with the B3O3 (boroxine)
unit positioning boron at each vertex of the triangle. Then the C-N bond in the structure
was replaced by phenyl rings and the piecewise constructed structure was minimized
using Universal Force Field (UFF) of Cerius2 (3). The model of COF-103 was created
using the method described above except carbon was substituted with silicon. Likewise,
COF-105 was built in a similar fashion to COF-103 except the 3-coordinate species was
substituted by 2,3,6,7,10,11-hexadydroxytriphenylene (HHTP) with the boron of the
triboronate ester defining the vertex of the triangular unit.
Boracite structures were created starting with the space group mP 34 , cell
dimensions and vertex positions obtained from the Reticular Chemistry Structure
Resource (http://okeeffe-ws1.la.asu.edu/RCSR/home.htm) under the symbol bor (2). The
model of COF-108 was created using the method described above except the B3O3
(boroxine) unit was replaced by the HHTP with the boron of the triboronate ester in each
vertex of the triangle.
S3
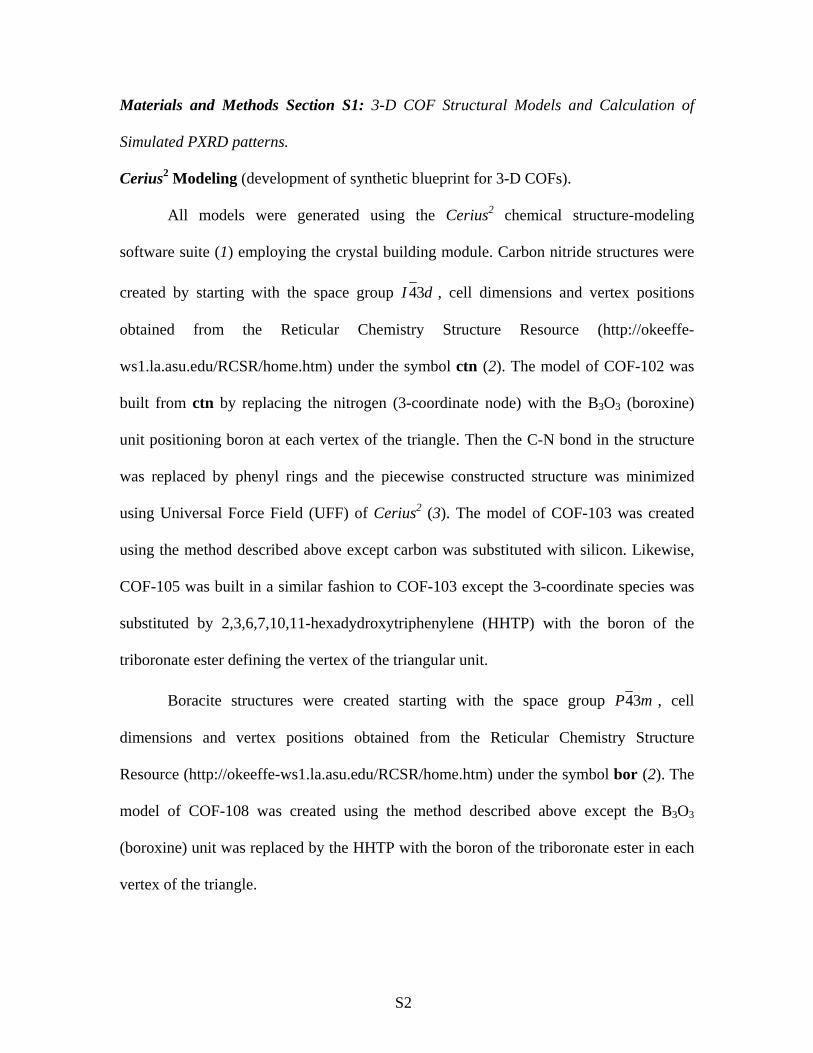
Positions of atoms in the respective unit cells are listed as fractional coordinates
in Tables S1-S4. Simulated PXRD patterns were calculated from these coordinates using
the PowderCell program (4). This software accounts for both the positions and types of
atoms in the structures and outputs correlated PXRD patterns whose line intensities
reflect the atom types and positions in the unit cells.
Table S1: Fractional atomic coordinates for COF-102 calculated from Cerius2 modeling.
COF-102 Space group symmetry
a = b = c = 27.1771 (13) Å α = β = γ = 90º
Atom x y z O1 0.8285 0.74693 0.30298B1 0.83533 0.71325 0.26216C1 0.9049 0.76629 0.22758C2 0.87894 0.72231 0.2263C3 0.9312 0.69419 0.16049C4 0.95634 0.7393 0.1596C5 0.89252 0.6863 0.19272C6 0.94306 0.77459 0.19484C7 1.0 0.75 0.125H1 0.89552 0.7946 0.25352H2 0.94125 0.66415 0.13717H3 0.87377 0.6515 0.19176H4 0.96223 0.80911 0.1966
dI 34

S4
Table S2: Fractional atomic coordinates for COF-103 calculated from Cerius2 modeling.
COF-103 Space group symmetry a = b = c = 28.2477 (21) Å α = β = γ = 90º
Atom x y z O1 0.20173 0.17738 0.24979B1 0.24102 0.17052 0.21731C1 0.3407 0.07966 0.20001C2 0.33591 0.05139 0.24007C3 0.30021 0.06125 0.27253C4 0.26989 0.09921 0.26533C5 0.27496 0.12788 0.22549C6 0.31062 0.11783 0.1929Si1 0.375 0.0 0.25H1 0.36748 0.07242 0.17407H2 0.29575 0.03949 0.30345H3 0.24263 0.10607 0.291H4 0.31517 0.1392 0.16171
dI 34

S5
Table S3: Fractional atomic coordinates for COF-105 calculated from Cerius2 modeling.
COF-105 Space group symmetry
a = b = c = 44.886 (5) Å α = β = γ = 90º Atom x y z O1 0.24923 0.26434 0.11672O2 0.12931 0.20284 0.29149B1 0.28905 0.10906 0.22877C1 0.22645 0.21781 0.18335C2 0.20018 0.23477 0.19174C3 0.23455 0.25261 0.14166C4 0.20882 0.26778 0.14873C5 0.19137 0.25958 0.17328C6 0.24387 0.22787 0.15826C7 0.35228 0.05035 0.21728C8 0.34987 0.03288 0.24348C9 0.32755 0.03978 0.26475C10 0.30811 0.0641 0.26008C11 0.31075 0.0818 0.23403C12 0.33294 0.07478 0.21265Si1 0.375 0.0 0.25H1 0.17131 0.2727 0.1768H2 0.26464 0.21763 0.15114H3 0.36894 0.04522 0.20028H4 0.33529 0.08803 0.19228H5 0.32518 0.02632 0.28497H6 0.29108 0.06904 0.27686
dI 34

S6
Table S4: Fractional atomic coordinates for COF-108 calculated from Cerius2 modeling.
COF-108 Space group symmetry
mP 34 a = b = c = 28.401 (5) Å α = β = γ = 90º Atom x y Z O1 0.67143 0.85456 0.08457B1 0.64886 0.89710 0.10290C1 0.60702 0.92264 0.07736C2 0.53295 0.97038 0.02962C3 0.77691 0.81243 0.15180C4 0.58884 0.96472 0.09527C5 0.55309 0.98865 0.07139C6 0.77691 0.84820 0.18757C7 0.70726 0.88278 0.15107C8 0.74101 0.88337 0.18627C9 0.500 0.00 0.000H1 0.60305 0.87282 0.02007H2 0.54196 0.91468 -0.02225 H3 0.73800 0.91161 0.21118
Note : Since the identity and number of guests is not known for COF-108 the structure
was refined with no guests included in the model and this pattern is shown in Figures S8.
Despite this the refinement gave very good r factors and a good fitting indicating that the
proposed structure is correct. However for Figure 2D in the paper a calculated pattern is
shown that contains one carbon atom in the center of the structure at 0.5 0.5 0.5 a,b,c to
represent guests that may still be in the structure.

S7
Materials and Methods Section S2: X-ray Data Collection, Unit Cell Determination, and
Le Bail Extraction. Powder X-ray data were collected using a Bruker D8-Discover θ-2θ
diffractometer in reflectance Bragg-Brentano geometry employing Ni filtered Cu Kα line
focused radiation at 1600 W (40 kV, 40 mA) power and equipped with a Vantec Line
detector. Radiation was focused using parallel focusing Gobel mirrors. The system was
also outfitted with an anti-scattering shield which prevents incident diffuse radiation from
hitting the detector, preventing the normally observed large background at 2θ < 3º.
Samples were mounted on zero background sample holders by dropping powders from a
wide-blade spatula and then leveling the sample surface with a razor blade. Given that the
particle size of the ‘as synthesized’ samples were already found to be quite mono-
disperse no sample grinding or sieving was used prior to analysis, we note, however, that
the micron sized crystallites lead to peak broadening. The best counting statistics were
achieved by collecting samples using a 0.02º 2θ step scan from 1.5 – 60º with an
exposure time of 10 s per step. No peaks could be resolved from the baseline for 2θ > 35º
therefore this region was not considered for further analysis.

S8
Figure S1: PXRD pattern of COF-102 as synthesized before activation and removal of
guests from the pores. Note that the large amorphous background arises from disordered
guests in the pores.
COF-102 "as synthesized"
3 6 9 12 15 18 21 24 27 30 33 36 39 42 45 48
2-theta (degrees)

S9
Figure S2: PXRD pattern of evacuated COF-102 (top) compared to patterns calculated
from Cerius2 for potential ctn and bor structures, ctn topology (middle), and bor
topology (bottom). Note the pattern from the bor model does not match the pattern of
COF-102. Note that the experimental pattern matches that for the ctn-model, and
emergence of the flat baseline with removal of guests from the pores.
COF-102
3 6 9 12 15 18 21 24 27 30 33 36 39 42 45
2-theta (degrees)
COF-102ctn-modelbor-model
S10
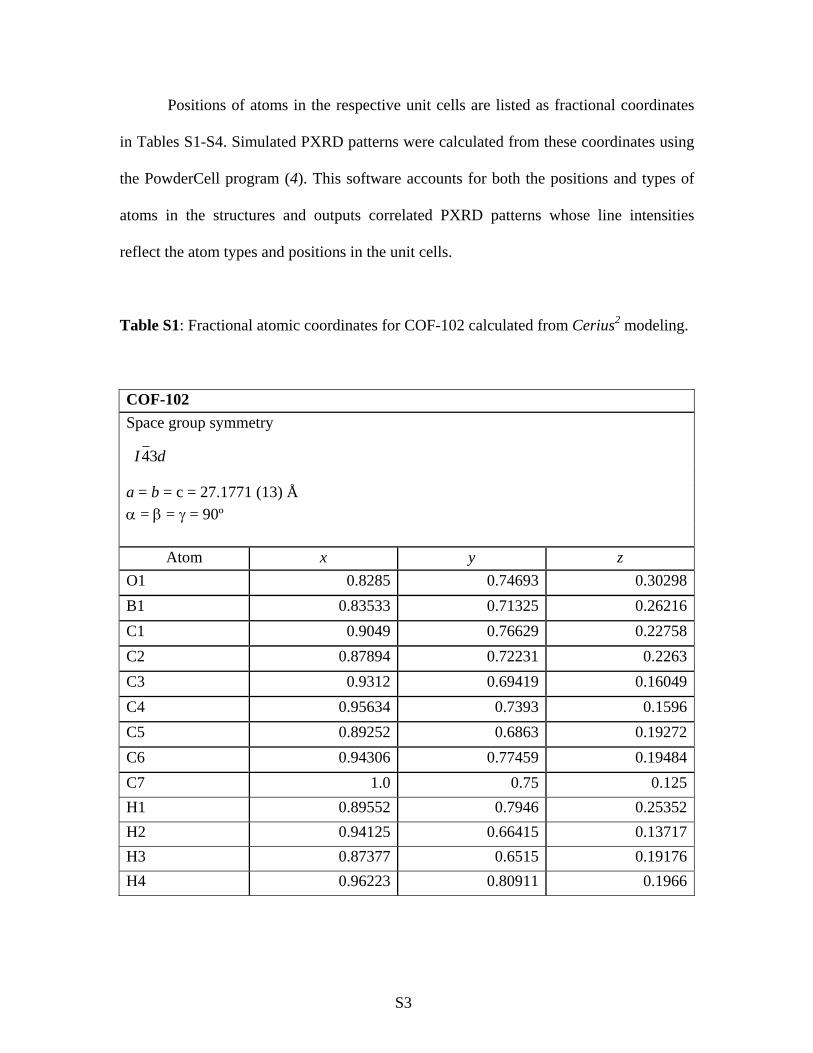
Figure S3: PXRD pattern of COF-103 as synthesized before activation and removal of
guests from the pores. Note the large amorphous background arises from disordered
guests in the pores.
COF-103 "as synthesized"
3 6 9 12 15 18 21 24 27 30 33 36 39 42 45 48
2-theta (degrees)

S11
Figure S4: PXRD pattern of evacuated COF-103 (top) compared to patterns calculated
from Cerius2 for potential ctn and bor structures, ctn topology (middle), and bor
topology (bottom). Note the pattern from the bor model does not match the pattern of
COF-103. Note that the experimental pattern matches that for the ctn-model, and the
emergence of a flat baseline with removal of guests from the pores.
COF-103
2 5 8 11 14 17 20 23 26 29 32 35 38 41 442-theta (degrees)
COF-103ctn-modelbor-model

S12
Figure S5: PXRD pattern of COF-105 as synthesized before activation and removal of
guest molecules. Note the large amorphous background arises from disordered guests in
the pores.
COF-105 "as synthesized"
3 6 9 12 15 18 21 24 27 30 33 36 39 42 45 48
2-theta (degrees)

S13
Figure S6: PXRD pattern of evacuated COF-105 (top) compared to patterns calculated
from Cerius2 for potential ctn and bor structures, ctn topology (middle), and bor
topology (bottom). Note the pattern from the bor model does not match the pattern of
COF-105. Note that the experimental pattern matches that for the ctn-model and the
emergence of a flat baseline with removal of guests from the pores.
COF-105
0
0 3 6 9 12 15 18 21 24 27 30 33 36 39 42 452-theta (degrees)
COF-105ctn-modelbor-model
S14
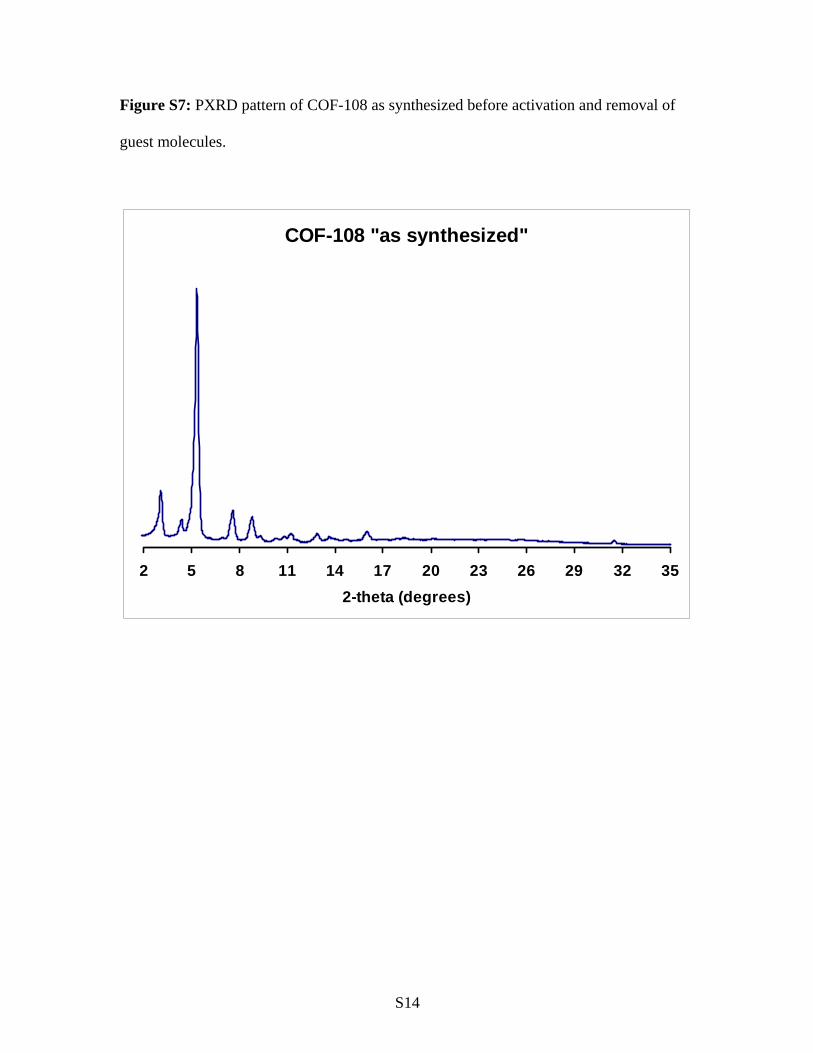
Figure S7: PXRD pattern of COF-108 as synthesized before activation and removal of
guest molecules.
COF-108 "as synthesized"
2 5 8 11 14 17 20 23 26 29 32 352-theta (degrees)

S15
Figure S8: PXRD pattern of “as prepared” COF-108 (top) compared to patterns
calculated from Cerius2 for potential ctn and bor structures, ctn topology (bottom), and
bor topology (middle). Note the pattern from the bor matches the experimental pattern of
COF-108. Note that the experimental pattern does not match that for the ctn-model and
the emergence of a flat baseline with removal of guests from the pores
COF-108
1 4 7 10 13 16 19 22 25 28 31 342-theta (degrees)
COF-108bor-modelctn-model

S16
Unit cell determinations were carried out using the Powder-X software suite
(PowderX: Windows-95 based program for powder X-ray diffraction data processing) (5)
for peak selection and interfacing with the Treor (TREOR: A Semi-Exhaustive Trial-and-
Error Powder Indexing Program for All Symmetries ab inito powder diffraction indexing
program (6).
Table S5: Calculated and experimental unit cell parameters for COF-102, COF-103,
COF-105, and COF-108.
Le Bail extractions were conducted using the GSAS program using data up to
2θ = 35 degrees. Backgrounds where hand fit with six terms applying a shifted
Chebyschev Polynomial. Both profiles where calculated starting with the unit cell
parameters indexed from the raw powder patterns and the atomic positions calculated
from Cerius2. Using the model-biased Le Bail algorithm, Fobs were extracted by first
Unit cell Parameter Cerius2 Treor Le Bail
COF-102, Cubic, dI 34
a = b = c (Å) 27.4081 28.00(9) 27.177(1)
COF-103, Cubic, dI 34
a = b = c (Å) 28.4550 28.42(4) 28.247(2)
COF-105, Cubic, dI 34
a = b = c (Å) 44.3818 45.1(8) 44.886(5)
COF-108, Cubic, mP 34
a = b = c (Å) 28.4410 27.7(9) 28.401(5)

S17
refining peak asymmetry with Gaussian peak profiles, followed by refinement of
polarization with peak asymmetry. Unit cells were then refined with peak asymmetry and
polarization resulting in convergent refinements. Once this was achieved unit cell
parameters were refined followed by zero-shift. Refinement of unit cell parameters, peak
asymmetry, polarization and zero-shift were used for the final profiles.
Table S6: Final statistics from Le Bail extractions of COF-102, COF-103, COF-105, and
COF-108 PXRD data.
COF-102 COF-103 COF-105 COF-108
Rp 8.79 7.33 4.64 7.70 wRp 12.78 16.85 6.91 11.08 χ2 53.58 43.76 17.13 65.37
S18
Materials and Methods Section S3: Full synthetic procedures for the preparation of
COF-102, COF-103, COF-105, and COF-108.
General Synthetic Procedures: All starting materials and solvents, unless otherwise
noted, were obtained from the Aldrich Chemical Co. and used with out further
purification. Tetrahydrofuran was distilled from sodium benzophenone ketyl, acetone
was distilled from anhydrous Ca(SO4). Tetra(4-(dihydroxy)borylphenyl)silane and
tetra(4-(dihydroxy)borylphenyl)methane were prepared according to literature method
(7), COF-5 was prepared according to methods described by A.P. Côté et al (8). The
isolation and handling of all products were performed under an inert atmosphere of
nitrogen using either glovebox or Schlenk line techniques. Yields reported here are un-
optimized.
Synthesis of COF-102. A Pyrex tube measuring o.d. × i.d. = 10 × 8 mm2 was charged
with tetra(4-(dihydroxy)borylphenyl)methane (50.0 mg, 0.10 mmol) and 1.0 mL of a 1:1
v:v solution of mesitylene:dioxane. The tube was flash frozen at 77 K (LN2 bath),
evacuated to an internal pressure of 150 mTorr and flame sealed. Upon sealing the length
of the tube was reduced to ca. 18 cm. The reaction mixture was heated at 85 °C for 4
days to afford a white precipitate which was isolated by filtration over a medium glass
frit and washed with anhydrous tetrahydrofuran (10 mL). The product was immersed in
anhydrous tetrahydrofuran (10 mL) for 8 h, during which the activation solvent was
decanted and freshly replenished four times. The solvent was removed under vacuum at
room temperature to afford COF-102 as a white powder (27.8 mg, 65%). Anal. Calcd.
for (C25H16B4O4): C, 70.88; H, 3.81. Found: C, 64.89; H, 3.76.
Synthesis of COF-103. In a fashion similar to the preparation of COF-102, treatment of

S19
tetra(4-(dihydroxy)borylphenyl)silane (55.0 mg, 0.10) in 1.5 mL of a 3:1 v:v solution of
mesitylene:dioxane at 85 °C/150 mTorr for 4 days afforded COF-103 as a white powder
(37.0 mg, 73%) after purification by the described method above. Anal. Calcd. for
(C24H16B4O4Si): C, 65.56; H, 3.67. Found: C, 60.43; H, 3.98.
Synthesis of COF-105. In a fashion similar to the preparation of COF-102, treatment of
tetra(4-(dihydroxy)borylphenyl)silane (26.0 mg, 0.05 mmol) with 2,3,6,7,10,11-
hexahydroxytriphenylene [(HHTP) 23.8 mg, 0.07 mmol, TCI] in 1.0 mL of a 1:1 v:v
solution of mesitylene:dioxane at 85 °C/150 mTorr for 9 days afforded COF-105 as a
green powder. The product was filtered over a medium glass frit and washed with
anhydrous acetone (10 mL) then immersed in anhydrous acetone (20 mL) for 24 h,
during which the activation solvent was decanted and freshly replenished two times. The
solvent was removed under vacuum at room temperature to afford COF-105 (26.8 mg,
58% based on the boronic acid). Anal. Calcd. for (C48H24B4O8Si): C,72.06; H, 3.02.
Found: C, 60.39; H, 3.72.
Synthesis of COF-108. In a fashion similar to the preparation of COF-102, treatment of
tetra(4-(dihydroxy)borylphenyl)methane (25.0 mg, 0.05 mmol) with 2,3,6,7,10,11-
hexahydroxytriphenylene [(HHTP) 34.0 mg, 0.10 mmol, TCI] in 1.0 mL of a 1:2 v:v
solution of mesitylene:dioxane at 85 °C/150 mTorr for 4 days afforded COF-108 as a
green powder. The product was filtered over a medium glass frit and washed with
anhydrous acetone (10 mL) then immersed in anhydrous acetone (20 mL) for 24 h,
during which the activation solvent was decanted and freshly replenished two times. The
solvent was removed under vacuum at room temperature to afford COF-108 as a green

S20
powder (30.5 mg, 55% based on the boronic acid). Anal. Calcd. for (C147H72B12O24): C,
75.07; H, 3.09. Found: C, 62.80; H, 3.11.
The low carbon values calculated for COF-102, -103, -105, and -108 is commonly
encountered with organoboron compounds due to the formation of non-combustible
boron carbide byproducts. Error in hydrogen elemental analysis data could be attributed
to incomplete removal of solvents and starting materials from the pores.
Activation of COF-102 and COF-103 for gas adsorption measurements. Under an
atmosphere of nitrogen, samples of COF-102 (65.0 mg) and COF-103 (65.0 mg) were
loaded into a cylindrical quartz cells inside a glovebox then were heated to 60 °C under
dynamic vacuum (1.0 x10⁻⁵ Torr) for 12 h. The samples were back-filled with nitrogen to
excluded adsorption of moisture prior Ar adsorption measurements.
S21
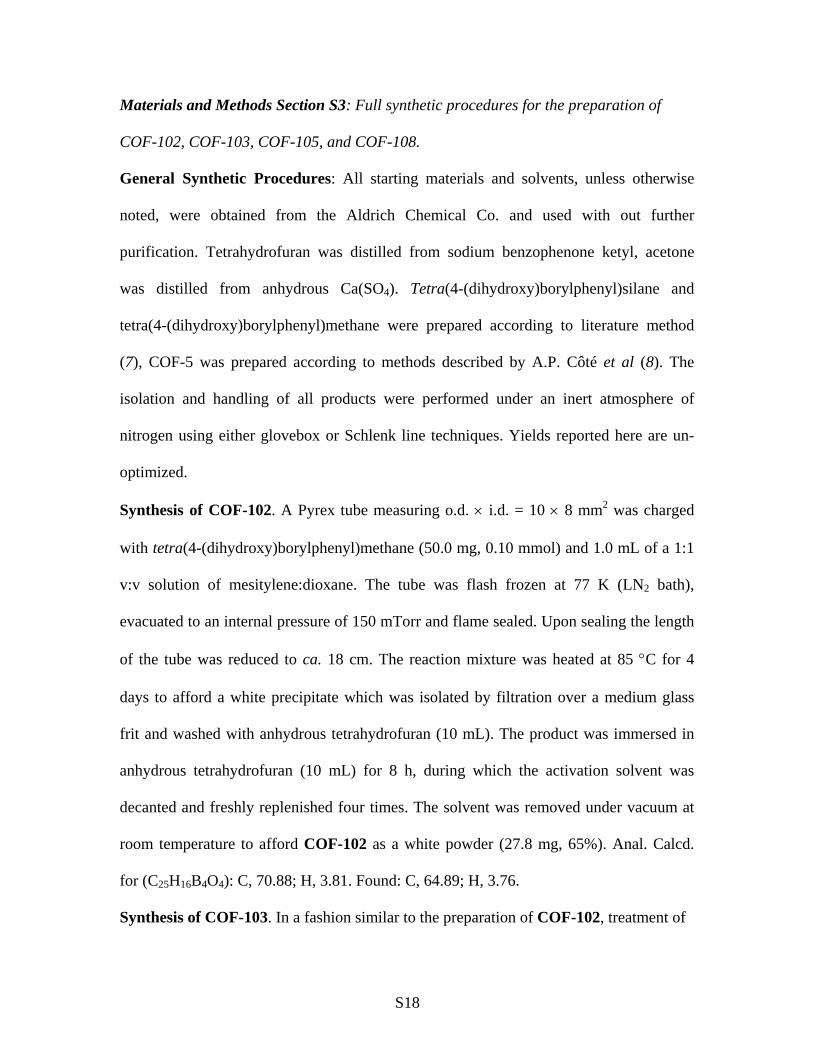
Materials and Methods Section S4: FT-IR Spectroscopy of Starting Materials, Model Compounds, and COFs.
FT-IR data was used to verify that the products were being produced. By
observing the loss of certain stretches like hydroxyl groups expected for condensation
reactions as well as the appearance of distinctive functional groups produced by the
formation of boroxine and triboronate esters, the formation of the expected products can
be confirmed. FT-IR spectra of starting materials, model compounds, and COFs were
obtained as KBr pellets using Nicolet 400 Impact spectrometer.
Figure S9: FT-IR spectrum of tetra(4-(dihydroxy)borylphenyl)methane.

S22
Figure S10: FT-IR spectrum of tetra(4-(dihydroxy)borylphenyl)silane

S23
Figure S11: FT-IR spectrum of triphenylboroxine (model compound).

S24
Figure S12: FT-IR spectrum of COF-5 (model compound).
S25
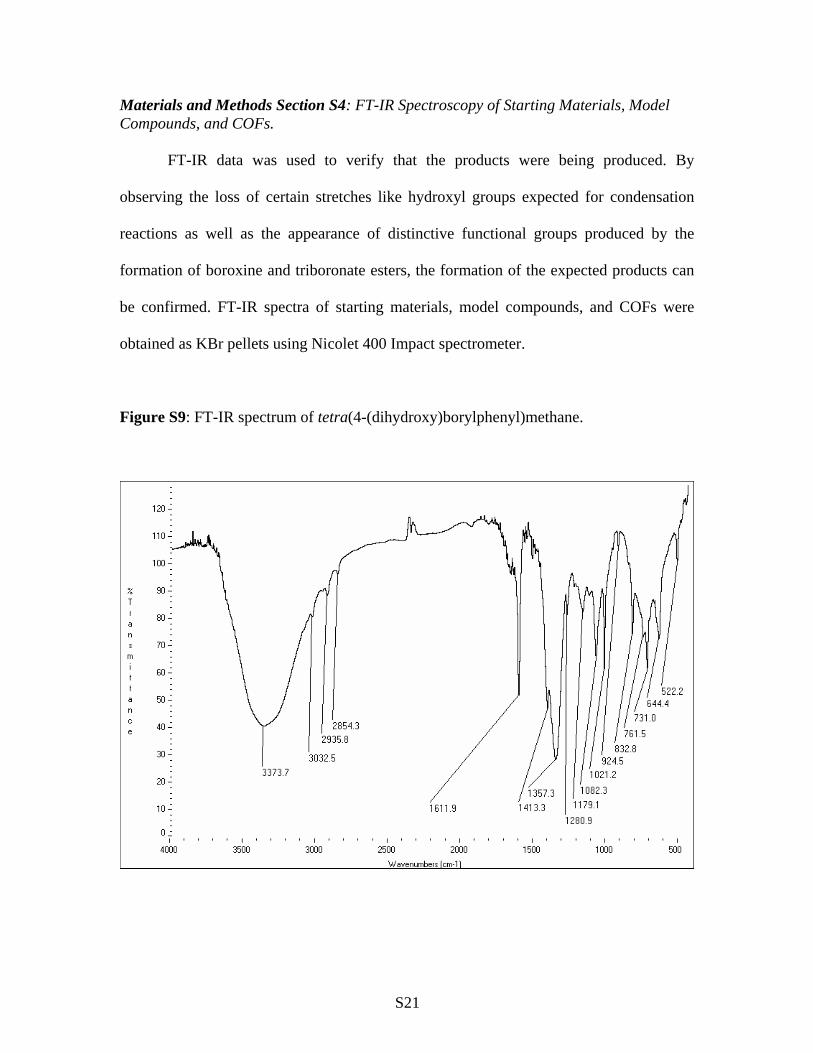
Figure S13: FT-IR spectrum of 2,3,6,7,10,11-hexahydroxytriphenylene (HHTP).

S26
Figure S14: FT-IR spectrum of COF-102. Note that the hydroxyl band stretch of the
boronic acid is almost absent indicating a completed consumption of the starting
materials. The formation of the B3O3 ring is supported by the following IR-bands (cm-1).
B-O (1378), B-O (1342), B-C (1226), B3O3 (710).

S27
Figure S15: FT-IR spectrum of COF-103. Note that the hydroxyl band stretch of the
boronic acid is almost absent indicating a completed consumption of the starting
materials. The formation of the B3O3 ring is supported by the following IR-bands (cm-1).
B-O (1387), B-O (1357), B-C (1226), B3O3 (710)

S28
Figure S16: FT-IR spectrum of COF-105. Note that the hydroxyl band stretch of the
boronic acid is almost absent indicating a completed consumption of the starting
materials. The formation of the C2B2O ring is supported by the following IR-bands (cm-
1): B-O (1398), B-O (1362), C-O (1245), B-C (1021).
S29
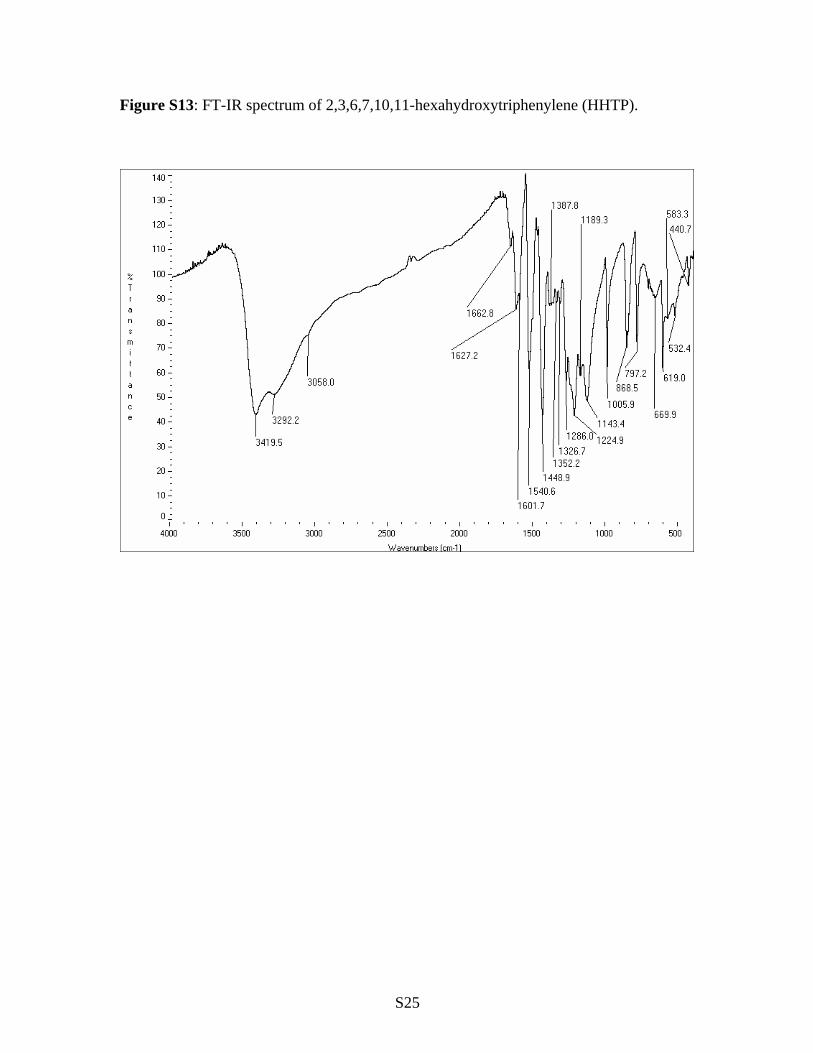
Figure S17: FT-IR spectrum of COF-108. Note that the hydroxyl band stretch of the
boronic acid is almost absent indicating a completed consumption of the starting
materials. The formation of the C2B2O ring is supported by the following IR-bands (cm-
1): B-O (1369), C-O (1253), and B-C (1026).

S30
Materials and Methods Section S5: Solid-State 11B MQ/MAS, 13C CP/MAS, and 29Si Nuclear Magnetic Resonance Studies for COF-102, COF-103, COF-105, and COF-108.
High resolution solid-state nuclear magnetic resonance (NMR) spectra were
recorded at ambient temperature on a Bruker DSX-300 spectrometer using a standard
Bruker magic angle spinning (MAS) probe with 4 mm (outside diameter) zirconia rotors.
Cross-polarization with MAS (CP/MAS) was used to acquire 13C data at 75.47 MHz (9).
The 1H and 13C ninety-degree pulse widths were both 4 µs. The CP contact time was 1.5
ms. High power two-pulse phase modulation (TPPM) 1H decoupling was applied during
data acquisition (10). The decoupling frequency corresponded to 72 kHz. The MAS
sample spinning rate was 10 kHz. Recycle delays betweens scans varied between 10 and
30 s, depending upon the compound as determined by observing no apparent loss in the
13C signal intensity from one scan to the next. The 13C chemical shifts are given relative
to tetramethylsilane as zero ppm, calibrated using the methine carbon signal of
adamantane assigned to 29.46 ppm as a secondary reference.
CP/MAS was also used to acquire 29Si data at 59.63 MHz. 1H and 29Si ninety-
degree pulse widths of 4.2 µs were used with a CP contact time 7.5 ms. TPPM 1H
decoupling was applied during data acquisition. The decoupling frequency corresponded
to 72 kHz. The MAS spinning rate was 5 kHz. Recycle delays determined from the 13C
CP/MAS experiments were used for the various samples. The 29Si chemical shifts are
referenced to tetramethylsilane as zero ppm, calibrated using the trimethylsilyl silicon in
tetrakis(trimethylsilyl)silane assigned to -9.8 ppm as a secondary reference.
Multiple quantum MAS (MQ/MAS) spectroscopy was used to acquire 11B data at
96.29 MHz (11, 12). The 11B solution-state ninety-degree pulse width was 2 µs. TPPM
1H decoupling was applied during data acquisition. The decoupling frequency
S31
corresponded to 72 kHz. The MAS spinning rate was 14.9 kHz. A recycle delay of 3 s
was used. The 11B chemical shifts are given relative to BF3 etherate as zero ppm,
calibrated using aqueous boric acid at pH = 4.4 assigned to -19.6 ppm as a secondary
reference.

S32
Figure S18: Solid-state 11B NMR spectrum for tetra(4-(dihydroxy)borylphenyl)methane.
The presence of one signal indicates that only one type of boron species is present in the
sample confirming the purity of the starting material.

S33
Figure S19: Solid-state 11B NMR spectrum for triphenylboroxine (model compound).
The presence of only one signal indicates that only one type of boron species is present.
The peak is slightly shifted in position indicating a change in the environment around the
boron, but the similar peak shapes and chemical shift of the boronic acid starting material
and the triphenylboroxine indicates that the boron oxygen bonds are still present.

S34
Figure S20: Solid-state 11B NMR spectrum for COF-102.
The chemical shift position and peak shape of the single signal match the spectra
obtained for the model compound, triphenylboroxine. The single signal indicates that
only one type of boron species is present confirming the purity of the product.

S35
Figure S21: Stack plot comparing the 11B NMR spectra of COF-102, triphenylboroxine,
and tetra(4-(dihydroxy)borylphenyl)methane.
COF-102
Model Compound
C[C6H4B(OH)2]4

S36
Figure S22: Solid-state 13C NMR spectrum for tetra(4-(dihydroxy)borylphenyl)methane.
All the expected signals are present and match the predicted chemical shift values.
Spinning side bands are present as well.
Carbon Chemical Shift
1 65.61
2 149.90
3 128.18
4 133.40
5 128.18
1 2 543
B
B
B
B

S37
Figure S23: Solid-state 13C NMR spectrum for COF-102.
All the signals from the starting boronic acid are present and no other signals are found
except spinning side bands indicating the survival of the backbone and purity of the
material.
Carbon Chemical Shift
1 66.0472
2 151.21
3 128.62
4 134.27
5 130.79
1 2 543
B
B
B
B

S38
Figure S24: Solid-state 11B NMR spectrum for tetra(4-(dihydroxy)borylphenyl)silane.
The presence of one signal indicates that only one type of boron species is present in the
sample confirming the purity of the starting material.

S39
Figure S25: Solid-state 11B NMR spectrum for COF-103.
The chemical shift position and peak shape of the single signal match the spectra
obtained for the model compound, triphenylboroxine. The single signal indicates that
only one type of boron species is present confirming the purity of the product.

S40
Figure S26: Stack plot comparing the 11B NMR spectra of COF-103, triphenylboroxine,
and tetra(4-(dihydroxy)borylphenyl)silane.
COF-103
Model Compound
Si[C6H4B(OH)2]4

S41
Figure S27: Solid-state 13C NMR spectrum for tetra(4-(dihydroxy)borylphenyl)silane.
All the expected signals are present and match the predicted chemical shift values.
Spinning side bands are present as well. The separate carbon signals are too close in
chemical shift to be resolved.
Carbon Chemical Shift
1 136.05
2 133.8
3 133.8
4 133.8
Si 1 432
B
B
B
B
S42
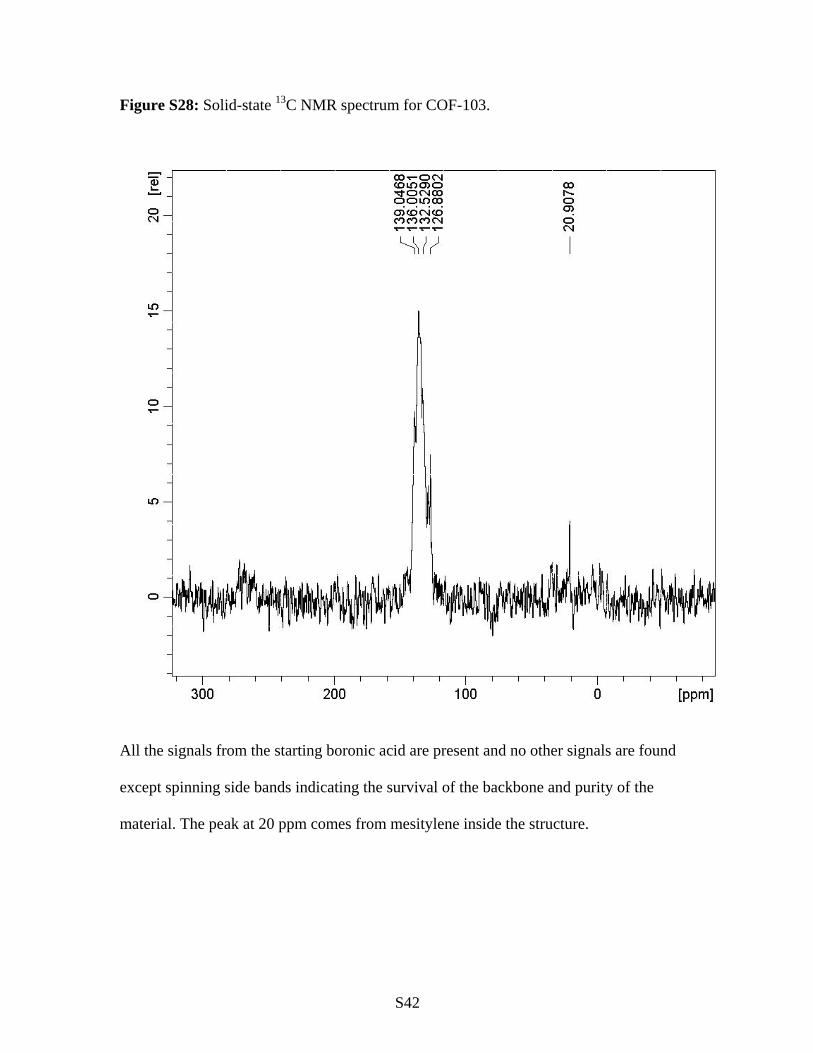
Figure S28: Solid-state 13C NMR spectrum for COF-103.
All the signals from the starting boronic acid are present and no other signals are found
except spinning side bands indicating the survival of the backbone and purity of the
material. The peak at 20 ppm comes from mesitylene inside the structure.

S43
Carbon Chemical Shift
1 139.05
2 126.88
3 136.00
4 132.53
Si 1 432
B
B
B
B

S44
Figure S29: Solid-state 29Si spectra for COF-103 (top) and tetra(4-
(dihydroxy)borylphenyl)silane (bottom). Note that spectrum of COF-103 contains only
one resonance for the silicon nuclei exhibiting a chemical shift very similar to that of the
tetra(4-(dihydroxy)borylphenyl)silane indicating the integrity of the tetrahedral block and
the exclusion of any Si-containing impurities.
COF-103
Si[C6H4B(OH)2]4

S45
Figure S30: Solid-state 29Si NMR spectrum for COF-103.
The single signal at -12.65 ppm indicates that the silicon carbon bond has survived the
reaction.

S46
Figure S31: Solid-state 11B NMR spectrum of COF-5 (model compound).
The single signal present shows only one type of boron species is present. The peak
shape is much different than that obtained for the starting material. This is the expected
result because the model compound should contain BO2C2 boronate esters which create a
different environment around the boron.

S47
Figure S32: Solid-state 11B NMR spectrum of COF-105.
The single peak shows that the product is pure and contains only one type of boron atom.
The distinctive peak shape is very different from the starting material and matches the
peak shape obtained for the model compound (COF-5).
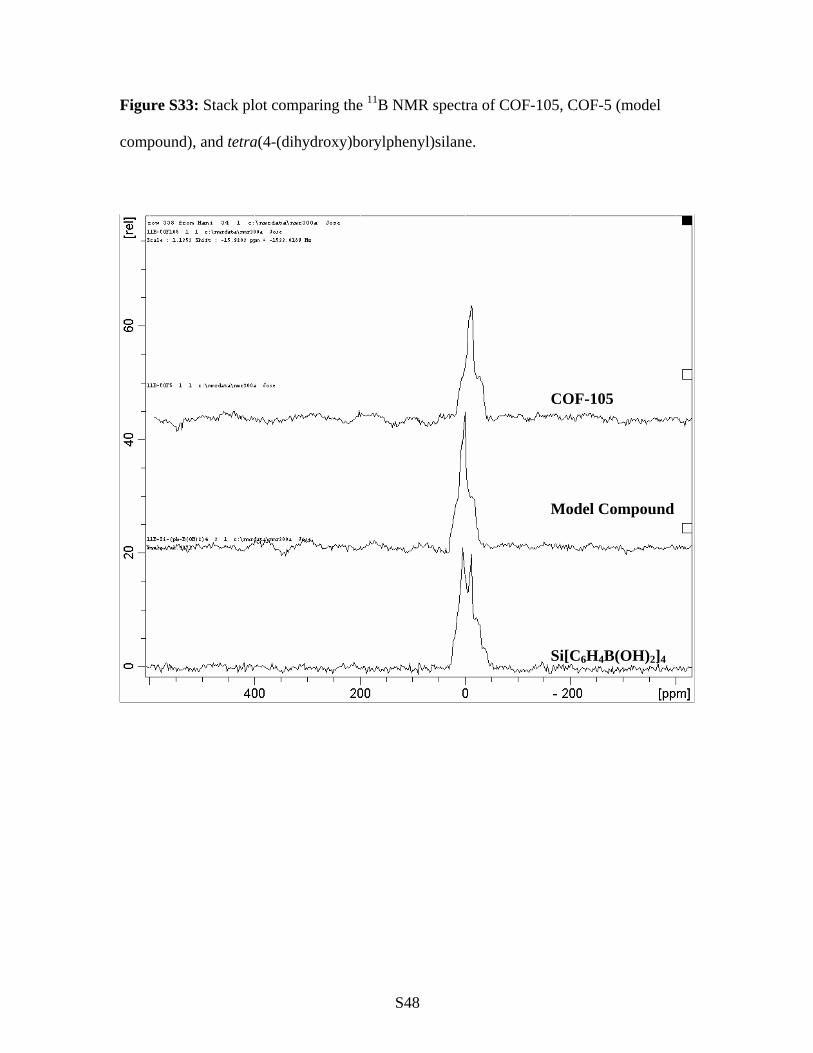
S48
Figure S33: Stack plot comparing the 11B NMR spectra of COF-105, COF-5 (model
compound), and tetra(4-(dihydroxy)borylphenyl)silane.
COF-105
Model Compound
Si[C6H4B(OH)2]4

S49
Figure S34: Solid-state 29Si NMR spectrum for COF-105 showing the expected 29Si
signal for a tetraphenyl bonded Si nucleus at a chemical shift of -13.53 ppm. Note that
spectrum of COF-105 contains only one resonance for the silicon nuclei exhibiting a
chemical shift very similar to that of the tetra(4-(dihydroxy)borylphenyl)silane indicating
the integrity of the tetrahedral block and the exclusion of any Si-containing impurities.

S50
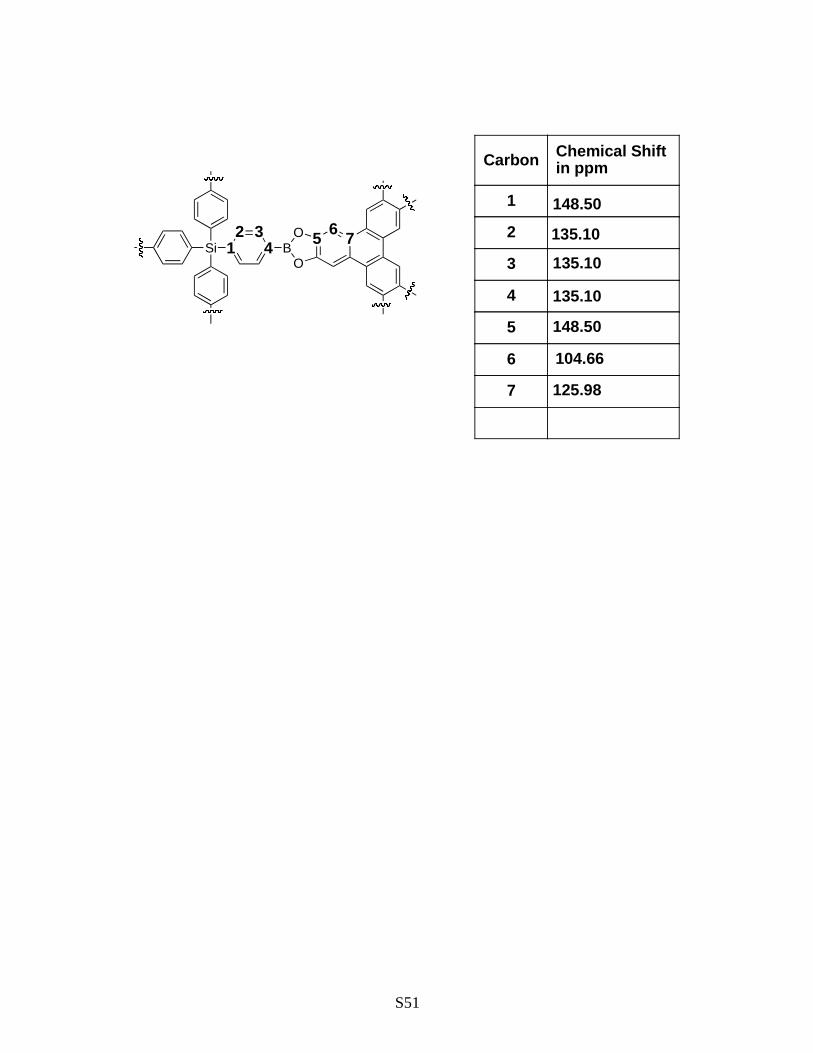
Figure S35: Solid-state 13C NMR spectrum for COF-105. Note the resonances at 104.54
and 148.50 ppm indicate the incorporation of tetraphenylene molecule.
All the expected peaks from the starting material are present showing the survival of the
building block. Peaks arising from incorporation of the HHTP are also present
confirming the identity of the product. Some of the carbon signals are too close in
chemical shift to be resolved.
S51
Si
Carbon Chemical Shift in ppm
1 148.50
2 135.10
3 135.10
4 135.10
5 148.50
6 104.66
7 125.98
1 432
BO
5O 76

S52
Figure S36: Solid-state11B NMR spectrum of COF-108.
The single peak shows that the product is pure and contains only one type of boron atom.
The distinctive peak shape is very different from the starting material and matches the
peak shape obtained for the model compound (COF-5).

S53
Figure S37: Stack plot comparing the solid-state 11B NMR spectra of COF-108, COF-5,
and tetra(4-(dihydroxy)borylphenyl)methane.
COF-108
Model Compound
C[C6H4B(OH)2]4

S54
Figure S38: Solid-state 13C NMR spectrum for COF-108. Note the resonances at 104.66
and 148.96 ppm indicate the incorporation of tetraphenylene molecule.
All the expected peaks from the starting material are present showing the survival of the
building block. Peaks arising from incorporation of the HHTP are also present
confirming the existence of the product.

S55
1
Carbon Chemical Shift in ppm
1 68.15
2 148.96
3 135.10
4 134.35
5 129.97
6 148.96
7 104.66
8 125.98
2 543
BO
6O 87

S56
Materials and Methods Section S6: Scanning Electron Microscopy Imaging (SEM) of COF-102, COF-103, COF-105, and COF-108.
In order to determine the purity of products, SEM was used to scan for all types of
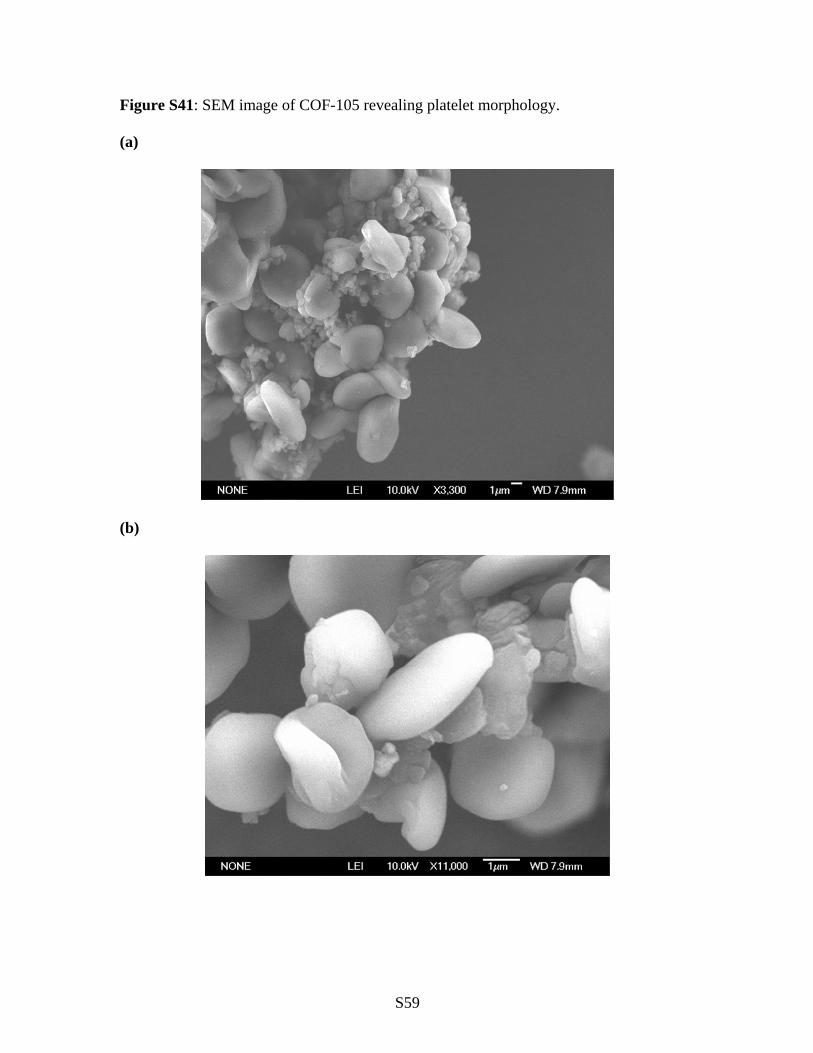
morphologies present in the samples. Multiple samples of each COF material were
subjected to scrutinization under the SEM microscope. Only one type of morphology was
found to exist for each compound confirming the purity of the materials produced.
Samples of all 3-D COFs were prepared by dispersing the material onto a sticky carbon
surface attached to a flat aluminum sample holder. The samples were then gold coated
using a Hummer 6.2 Sputter at 60 millitorr of pressure in an argon atmosphere for 45
seconds while maintaining 15 mA of current. Samples were analyzed on a JOEL JSM-
6700 Scanning Electron Microscope using both the SEI and LEI detectors with
accelerating voltages ranging from 1kV to 15kV.

S57
Figure S39: SEM image of COF-102 revealing a spherical morphology.
(a)
(b)

S58
Figure S40: SEM image of COF-103 revealing a spherical morphology.
(a)
(b)
S59
Figure S41: SEM image of COF-105 revealing platelet morphology.
(a)
(b)

S60
Figure S42: SEM image of COF-108 revealing a deformed spherical morphology.
(a)
(b)

S61
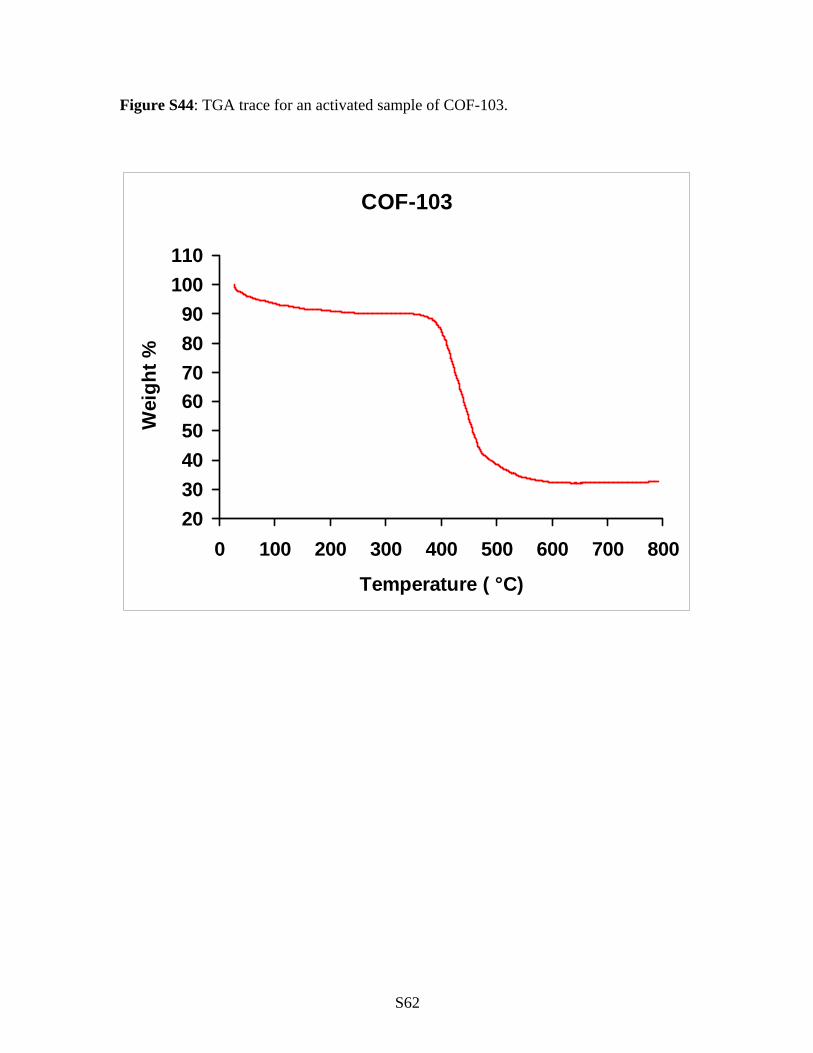
Supplementary Section S7: Thermogravimetric Analysis.
All the COF materials were analyzed by TGA to determine the thermal stability
of the materials produced as well as confirm that all guest have been removed. Samples
were run on a TA Instruments Q-500 series thermal gravimetric analyzer with samples
held in platinum pans under atmosphere of nitrogen. A 5 K/min ramp rate was used.
Figure S43: TGA trace for an activated sample of COF-102.
COF-102
50
60
70
80
90
100
110
0 100 200 300 400 500 600 700 800
Temperature (°C )
Wei
ght %
S62
Figure S44: TGA trace for an activated sample of COF-103.
COF-103
2030405060708090
100110
0 100 200 300 400 500 600 700 800
Temperature ( °C)
Wei
ght %

S63
Figure S45: TGA trace for an activated sample of COF-105.
COF-105
60
70
80
90
100
110
0 100 200 300 400 500 600 700 800
Temperature (°C)
Wei
ght %

S64
Figure S46: TGA trace for an activated sample of COF-108.

S65
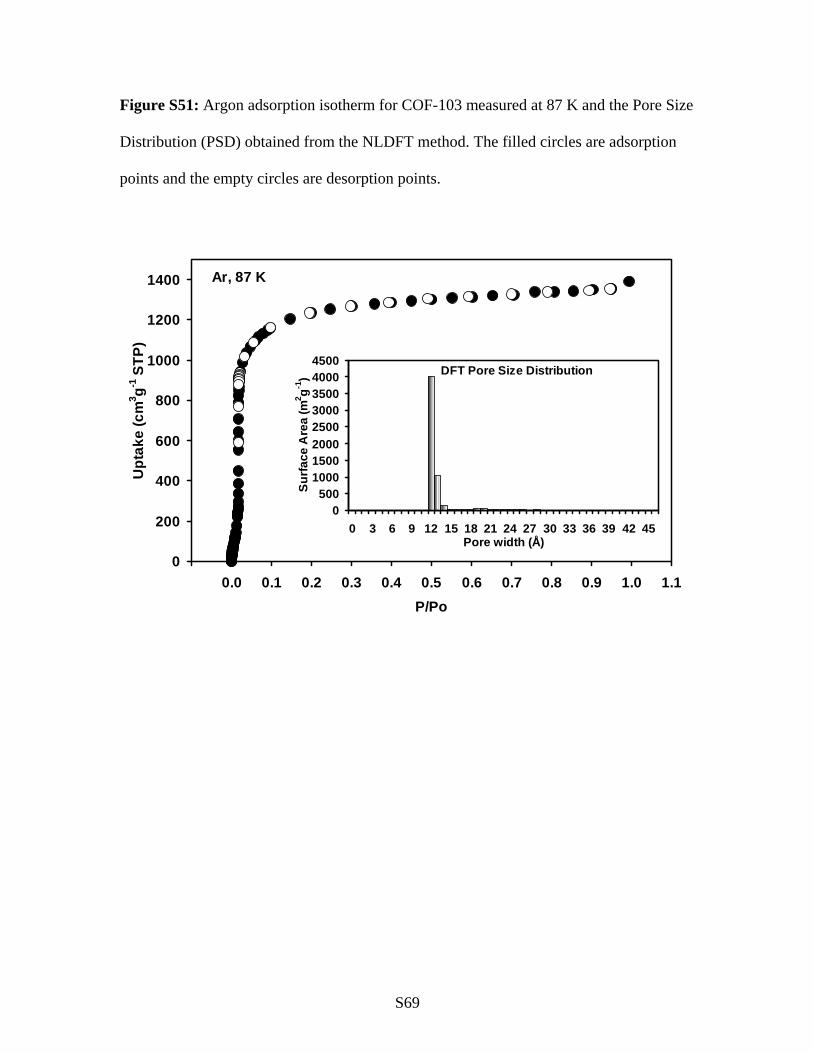
Supplementary Section S8: Low Pressure (0 – 760 mTorr) Argon Adsorption
Measurements for COF-102 and COF-103 at 87 K. The Pore Size Distribution of both
compounds was calculated from these adsorption isotherms by the Non-Local Density
Functional Theory (NLDFT) method using a cylindrical pore model (13).
Figure S47: Argon adsorption isotherm for COF-102 measured at 87 K and the Pore Size
Distribution (PSD) obtained from the NLDFT method. The filled circles are adsorption
points and the empty circles are desorption points.
Ar, 87 K
0
200
400
600
800
1000
1200
-0.1 0.0 0.1 0.2 0.3 0.4 0.5 0.6 0.7 0.8 0.9 1.0 1.1P/Po
Upt
ake
(cm
3 g-1 S
TP)
DFT Pore Size Distribution
0500
10001500200025003000350040004500
0 3 6 9 12 15 18 21 24 27 30 33 36 39 42 45Pore width (Å)
Surfa
ce A
rea
(m2 g-1
)

S66
Figure S48: Experimental Ar adsorption isotherm for COF-102 measured at 87 K is
shown as filled circles. The calculated NLDFT isotherm is overlaid as open circles. Note
that a fitting error of < 1 % indicates the validity of using this method for assessing the
porosity of COF-102. The fitting error is indicated.
Ar, 87KCOF-102
0
200
400
600
800
1000
1200
-0.10 0.00 0.10 0.20 0.30 0.40 0.50 0.60 0.70 0.80 0.90 1.00 1.10
P/Po
Upt
ake
(cm
3 /g S
TP)
OriginalFitting
Fitting error = 0.512%

S67
Figure S49: Langmuir plot for COF-102 calculated from the Ar adsorption isotherm at
87 K. The model was applied from P/Po= 0.04-0.85. The correlation factor is indicated.
(W = Weight of gas absorbed at a relative pressure P/Po)
COF-102Ar-87K
R2 = 0.99958
0.00E+00
5.00E-02
1.00E-01
1.50E-01
2.00E-01
2.50E-01
3.00E-01
3.50E-01
4.00E-01
4.50E-01
0.00 0.10 0.20 0.30 0.40 0.50 0.60 0.70 0.80 0.90
P/Po
(P/P
o)/W
S Langmuir =4452 m 2 /g

S68
Figure S50: BET plot for COF-102 calculated from the Ar adsorption isotherm at 87 K.
The model was applied from P/Po= 0.01-0.10. The correlation factor is indicated. (W =
Weight of gas absorbed at a relative pressure P/Po).
SA = 4411 m2/g
COF-102Ar-87K
R2 = 0.99995
0.00E+00
1.00E-02
2.00E-02
3.00E-02
4.00E-02
5.00E-02
6.00E-02
0.01 0.02 0.03 0.04 0.05 0.06 0.07 0.08 0.09 0.10
P/Po
1/(W
(Po/
P)-1
)
S BET =3472 m 2 /g
S69
Figure S51: Argon adsorption isotherm for COF-103 measured at 87 K and the Pore Size
Distribution (PSD) obtained from the NLDFT method. The filled circles are adsorption
points and the empty circles are desorption points.
Ar, 87 K
0
200
400
600
800
1000
1200
1400
-0.1 0.0 0.1 0.2 0.3 0.4 0.5 0.6 0.7 0.8 0.9 1.0 1.1P/Po
Upt
ake
(cm
3 g-1 S
TP)
DFT Pore Size Distribution
0500
10001500200025003000350040004500
0 3 6 9 12 15 18 21 24 27 30 33 36 39 42 45Pore width (Å)
Surfa
ce A
rea
(m2 g-1
)

S70
Figure S52: Experimental Ar adsorption isotherm for COF-103 measured at 87 K is
showed as filled circles. The calculated NLDFT isotherm is overlaid as open circles. Note
that a fitting error of < 1 % indicates the validity of using this method for assessing the
porosity of COF-103. The fitting error is indicated.
Ar, 87KCOF-103
0
200
400
600
800
1000
1200
1400
-0.10 0.00 0.10 0.20 0.30 0.40 0.50 0.60 0.70 0.80 0.90 1.00 1.10P/Po
Upt
ake
(cm
3 /g S
TP)
OriginalFitting
Fitting error = 0.145%

S71
Figure S53: Langmuir plot for COF-103 calculated from the Ar adsorption isotherm at
87 K. The model was applied from P/Po= 0.04-0.85. The correlation factor is indicated.
(W = Weight of gas absorbed at a relative pressure P/Po)
SA = 5207 m2/g
COF-103Ar-87K
R2 = 0.999770.00E+00
5.00E-02
1.00E-01
1.50E-01
2.00E-01
2.50E-01
3.00E-01
3.50E-01
4.00E-01
0.00 0.10 0.20 0.30 0.40 0.50 0.60 0.70 0.80 0.90
P/Po
(P/P
o)/W
S Langmuir =5207 m 2 /g

S72
Figure S54: BET plot for COF-102 calculated from the Ar adsorption isotherm at 87 K.
The model was applied from P/Po= 0.01-0.10. The correlation factor is indicated. (W =
Weight of gas absorbed at a relative pressure P/Po).
SA = 4210 m2/g
COF-103Ar-87K
R2 = 0.999900.00E+00
5.00E-03
1.00E-02
1.50E-02
2.00E-02
2.50E-02
3.00E-02
3.50E-02
4.00E-02
4.50E-02
0.01 0.02 0.03 0.04 0.05 0.06 0.07 0.08 0.09
P/Po
1/(W
(Po/
P)-1
)
S BET =4210 m 2 /g

S73
Figure S55: Dubinin-Radushkevich plot used for pore volume estimation for COF-102
using argon gas. The Dubinin- Astakhov (DA) was applied and the same results were
found (n=2).
Vp-COF-102Ar-87K
R2 = 0.99867
0.060
0.065
0.070
0.075
0.080
0.085
0.70 1.20 1.70 2.20 2.70 3.20
logn (Po/P), n=2
Wei
ght a
bsor
bed
(g)
Vp=1.345 cm 3 /g

S74
Figure S56: Dubinin-Radushkevich plot used for pore volume estimation for COF-103
using argon gas. The Dubinin- Astakhov (DA) was applied and the same results were
found (n=2).
Vp-COF-103Ar-87K
R2 = 0.99877
0.118
0.120
0.122
0.124
0.126
0.128
0.130
0.132
0.134
0.136
0.138
0.20 0.40 0.60 0.80 1.00 1.20 1.40 1.60
logn (Po/P), n=2
Wei
ght a
bsor
bed
(g)
Vp=1.663 cm3/g

S75
References 1. Cerius2 version 4.2 MatSci (2000 Molecular Simulations Inc., San Diego, CA,
USA).
2. O. Delgado-Friedrichs, M. O'Keeffe, O. M. Yaghi, Acta Crystallogr. A. 59, 515
(2003).
3. A. K. Rappe, C. J. Casewit, K. S. Colwell, W. A. Goddard-III, W. M. Skiff. J.
Am. Chem. Soc. 114, 10024 (1992).
4. W. Kraus, G. Nolze, J. Appl. Cryst. 29, 301 (1996).
5. C. Dong, J. Appl. Crystollogr. 32, 838 (1999)
6. P.-E. Werner,.L. Eriksson, and M. Westdahl, J. Appl. Crystollogr. 18, 367 (1985).
7. J.-H. Fournier, T. Maris, J. D. Wuest, W. Guo, E. Galoppini, J. Am. Chem. Soc.
125, 1002 (2003).
8. A. P. Côté, A. I. Benin, N. W. Ockwig, M. O’Keeffe, A. J. Matzger, O. M. Yaghi,
Science 310, 1166 (2005).
9. J. Schaefer, E. O. Stejskal, J. Am. Chem. Soc. 98, 1031 (1976).
10. A. E. Bennett, C. M. Rienstra, M. Auger, K. V. Lakshmi, and R. G. Griffin. J.
Chem. Phys. 103, 695 (1995).
11. L. Frydman, J. S. Harwood, J. Am. Chem. Soc. 117, 5367 (1995).
12. A. Medik, J. S. Harwood, and L. Frydman, J. Am. Chem. Soc. 117, 12779 (1995).
13. K. Schumacher, P. I. Ravikovitch, A. Du Chesne, A. V. Neimark and Klaus K.
Unger, Langmuir, 22, 4648 (2000).