supporting online material for - · pdf filesalmonella pathogenesis and processing of secreted...
TRANSCRIPT
www.sciencemag.org/cgi/content/full/330/6002/390/DC1
Supporting Online Material for
Salmonella Pathogenesis and Processing of Secreted Effectors by Caspase-3
C. V. Srikanth, Daniel M. Wall, Ana Maldonado-Contreras, Haining Shi, Daoguo Zhou, Zachary Demma, Karen L. Mumy, Beth A. McCormick*
*To whom correspondence should be addressed. E-mail:
Published 15 October 2010, Science 330, 390 (2005) DOI: 10.1126/science.1194598
This PDF file includes:
Materials and Methods Figs. S1 to S6 Tables S1 and S2 References
1
Supporting online material for
Salmonella pathogenesis and processing of secreted effectors by caspase-3
C.V. Srikanth1,2*, Daniel M. Wall1,3,*, Ana Maldonado-Contreras2, Haining Shi1, Daoguo Zhou 4,Zachary Demma 2, Karen L. Mumy1,2, and Beth A. McCormick1,2
1 Department of Pediatric Gastroenterology and Nutrition, Harvard Medical School and
Massachusetts General Hospital, Boston, MA 02129, USA.
2 Department of Molecular Genetics and Microbiology, University of Massachusetts Medical
School, 55 Lake Avenue North, Worcester, MA 01655, USA.
3 Institute of Infection, Immunity & Inflammation, College of Medical, Veterinary and Life
Sciences, University of Glasgow, G12 8QQ, UK.
4 Department of Biological Sciences, Purdue University, West Lafayette, IN 47907
* Contributed equally to this work
To whom corresponding should be addressed:
E-mail: [email protected]

2
Materials and Methods
Tissue culture:
T84 intestinal epithelial cells (American Type Culture Collection, Rockville, Maryland)
(Passages 50-70) were grown in a mixture of Dulbecco’s Modified Eagles Medium and Ham’s
F12 Nutrient mixture supplemented with 14 mM NaHCO3, 15 mM Hepes buffer (pH 7.5), 40
mg/liter penicillin, 8 mg/liter ampicillin, 90 mg/liter streptomycin, and 5% fetal bovine serum.
T84 cell monolayers were grown and maintained on inverted 0.33-cm2 ring-supported, collagen-
coated polycarbonate filters (cell culture inserts) (Costar Corp., Cambridge, MA), as previously
described (1) with modifications (2). Steady state transepithelial resistance (TER) was measured
using Millipore Millicell- TERS with “chopstick” electrodes (World Precision Instruments,
Sarasota, FL). A confluent monolayer corresponded to 400-1500 cells/cm2, consistent with
measurements by Dharmsathaphorn and Madara (1).
Bacterial strains, plasmids and growth conditions:
Strains and plasmids used in this study have been previously described (3). All strains were
grown in Luria broth (LB) as previously described (4). Strains carrying pBH (Roche,
Indianapolis, IN) or its derivatives were cultured in media containing 50 µg/ml ampicillin.
Construction of the caspase site mutant proteins:
The aspartic acid to alanine mutation (DEVD to DEVA in SipA) was performed using the
QuickChange site directed Mutagenesis kit (Stratagene, La Jolla, CA). The pBH-SipA was used
as a template together with the primer pair (Cas3F:
3
5’CTTTTGATGAAGTCGCTGGCGTAACCAGC and Cas3R: 5’
GCTGGTTACGCCAGCGACTTCATCAAAAG) in the mutagenic PCR, according to the
manufacturer’s instructions. The resulting mutants were sequenced to confirm the presence of
the desired mutation. SopA expressing plasmids (pSopA: pZP188) were used as a template to
generate pcsm-SopA (plasmids encoding caspase-3 sites mutant SopA ) using oligos
SopA_mutF: GTGTTGCTGGATTCGTTTGCCAGGAACAGCGCCGCCATG,
SopA_mutR: CATGGCGGCGCTGTTCCTGGCAAACGAATCCAGCAACAC in the 1st
mutagenic PCR. The resulting mutant plasmid was used as a template for a second round of
mutagenesis with the oligo pair SopA_mut_b_F (1448 A-C):
GATTTTACACTGTATGACAGGCGTGGCCTGCACTGATGGCACCCGCCAGAAAGC
SopA_mut_b_R (1448 A-C):
GCTTTCTGGCGGGTGCCATCAGTGCAGGCCACGCCTGTCATACAGTGTAAAA in the
2nd mutagenic PCR. The resultant mutant plasmids were confirmed for the desired mutations by
sequencing.
SDS-PAGE and Western blotting:
Samples were separated through an 8-16 % gradient Tris-HCl Ready Gel (Biorad, Hercules, CA)
by polyacrylamide electrophoresis (SDS-PAGE) and transferred to nitrocellulose. Immunoblots
were performed using a 1:5,000 dilution of murine anti-HA monoclonal antibodies (Covance,
Richmond, CA). Immunoblots for caspase detection were carried out using 1:5,000 dilutions of
antibodies specific for caspase-1, caspase-3, caspase-8 and activated caspase-3 (Cell Signaling
Technology, Danvers, MA). Goat anti-rabbit and goat anti-mouse IgG labeled with horseradish
peroxidase (Santa Cruz Biotechnology, Santa Cruz, CA) and diluted 1:2,000 were used to detect

4
the bands, which were visualized by enhanced chemiluminescence using the Super Signal ECL
kit (Pierce, Rockford, IL). Samples were also electrophoresed on separate gels and Coomassie
stained to confirm equal protein loading between samples. For native SipA detection, SipA
monoclonal antibodies were used (gift from Dr. Eduourd Galyov, University of Leicester, UK)
and for the detection of HA-tagged SipA, anti-HA antibodies were purchased from Cell
Signaling (Danvers, MA). For SopA western blots affinity purified anti-SopA antibodies
generated in Rabbit were used at 1:400 dilution.
PMN transepithelial migration assay:
The physiologically directed (basolateral to apical) PMN transepithelial migration in response to
bacterial stimulus has been previously described in detail (5). Briefly, human peripheral PMNs
were isolated from anti-coagulated human whole blood by a gelatin sedimentation technique as
previously described (6). T84 cells were stimulated at the apical surface with S. enterica serovar
Typhimurium, S. Dublin or E. coli F-18 at a multiplicity of infection (MOI) of 375 for 1 hour.
Formyl-Methionyl-Leucyl-Phenylalanine (fMLP), a neutrophil chemoattractant, was used as a
positive control in all assays. Following extensive washing, neutrophils (PMN; 1 x 10⁶) were
added to the basolateral surface and allowed to transmigrate through the monolayer for 2 hour.
PMN transmigration was quantified by assaying for the PMN specific azurophilic granule
marker myeloperoxidase (MPO), as previously described (6). PMN cell equivalents were
estimated from daily PMN standards as the number of PMN that had completely traversed the
monolayer into the apical chamber.

5
Mouse infections
Six-eight week old female C57BL/6 mice, or C57BL/6 caspase-3 knock out mice were infected
using a modified version of the streptomycin pre-treatment model (7). Water and food were
withdrawn 4 hour prior to treatment with 3.75 mg of streptomycin intragastrically. The following
day, water and food were again withdrawn for 4 hour before the mice were infected with 5 x 10⁷
CFU of S. Dublin (500 µl of a suspension in PBS intragastrically by gavage). S. Dublin was not
induced with IPTG as this strain produces the proteins constitutively. Mice were left for 48 hour
before sacrificing and removal of the colon and cecum for examination. Care of animals is in
accordance with institutional guidelines under protocol number: 1993-08.
Histological procedures:
Proximal colon samples were placed in Tissue Tek optimal cutting temperature compound
(OCT) (Miles, Inc., Elkhart, IN) and snap frozen in liquid nitrogen. Cryosections (5 µm) were
mounted on glass slides before either hematoxylin and eosin (H&E) or fluorescent staining. H&E
staining was carried as previously described (8). Fluorescent staining was carried as follows:
Slides were fixed in acetone on ice for 10 minutes before submerging in a 1% bovine serum
albumin (BSA) solution. Slides were blocked by adding an avidin solution in 1% BSA for 15
minutes, washed, and then biotin in 1 % BSA was added for a further 15 minutes (Vector
Laboratories, Burlingame, CA). Sections were stained using a fluorescein-iso-thiocyanate (FITC)
labeled anti mouse Ly-6G and Ly-6C (Gr-1) antibody (BD Biosciences Pharmingen, Franklin
Lakes, NJ) for neutrophils (PMN). After washing, DNA was stained and mounted using the 4’
6’-diamidino-2-phenylindol (DAPI) containing solution Vectashield (Vector Laboratories,
Burlingame, CA).

6
Histopathological examinations:
At necropsy, colonic tissues were collected and frozen in OCT compound prior to storing at
_80°C. Five-_m sections were cut on a 2800 Frigocut cryostat (Reichert-Jung, Germany) and
were stained with hematoxylin and eosin (H&E). Three tissue samples from the proximal,
middle, and distal parts of the colon were prepared. The sections were analyzed without prior
knowledge of the type of treatment. Colonic pathology was scored by using a modified histology
scoring system based on previously published methods (9, 10). The scoring system consists of
two parts. Part 1 is the determination of the infiltration of inflammatory cells in the colon, with
scores ranging from 0 to 4 (0, normal cell pattern; 1, scattered inflammatory cells in the lamina
propria; 2, increased numbers of inflammatory cells in the lamina propria; 3, confluence of
inflammatory cells extending into the submucosa; and 4, transmural extension of the infiltrative
inflammatory cells). Part 2 is the evaluation of colon tissue damage, with scores that also range
from 0 to 4 (0, normal tissue pattern; 1, minimal inflammation and colonic crypt hyperplasia; 2,
mild colonic crypt hyperplasia with or without focal invasion of epithelium; 3, obvious colonic
crypt hyperplasia, invasion of epithelium, and goblet cell depletion; and 4, extensive mucosal
damage and extension through deeper structures of the bowel wall). The total colon pathology
score equals the inflammatory cell score plus the tissue damage score.
Myeloperoxidase assay:
Myeloperoxidase (MPO) activity was measured using the Mouse MPO ELISA test kit from Cell
Sciences (Canton, MA). Briefly, sections were taken from the proximal colon and snap frozen in
liquid nitrogen until testing. Upon thawing, the sections were weighed and then homogenized in

7
lysis buffer as specified by the manufacturer. An ELISA assay was carried out as per
manufacturer’s instructions and the amount of MPO per section was expressed as ng of MPO per
gram of tissue.
RNA analysis:
Total RNA was isolated from control or infected cells at various time points post infection using
TRIzol Reagent (Invitrogen, Carlsbad, CA) according to the manufacturer’s instructions. RNA
was DNase treated prior to reverse transcription with random hexamers using a GeneAmp Kit
(Roche, Indianapolis, IN). Quantitative real time PCR analysis of caspase-3 and GAPDH mRNA
levels was performed using a SYBR Green master mix (Applied Biosystems, Foster City, CA)
with the following primers; Cas-3For 5’-CAAACTTTTTCAGAGGGGATCG-3’, Cas-3Rev 5’-
GCATACTGTTTCAGCATGGCAC-3’, GAPDH For 5’-AGAACATCATCCCTGCCTC-3’ and
GAPDH Rev 5’-GCCAAATTCGTTGTCATACC-3’. Amplification was carried out on an
iCycler (Bio Rad, Hercules, CA) and the data analyzed using Opticon Monitor 2 software
(Promega, Madison, WI). The amount of caspase-3 transcript was normalized to the amount of
GAPDH transcript and the normalized values of the Salmonella-infected cells versus the control
cells were used to calculate the relative expression using the delta delta Ct method.
Apoptosis Assay (Annexin V): T84 cells grown on 6 well transwell plates (Costar) were either
treated with the apoptosis inducer staurosporine (1mg/ml) or infected with wild-type S.
Typhimurium (SL1344) for 3 hour at 37 ºC. The plates were subsequently treated with 5 mM
EDTA for 10 minutes at 37 °C. Cells were then removed from the plates with cold PBS and
approximately 2 x 10⁶ cells from each sample were prepared for the FACS analysis using the

8
Annexin V-FITC apoptosis detection kit (Sigma Chemical Co., St. Louis, MO) following the
manufacturers protocol.
Generation of small interfering RNAs (siRNA) for suppression of caspase-3 expression:
The plasmid used to generate siRNAs was constructed using the pSUPER vector (Oligoengine,
Seattle, WA), in the method described by Brummelkamp et al (11). Oligonucleotides were
designed incorporating a 19-nt sequence (in italics) from the human gene encoding caspase-3
(Genbank Accession number NM_032991), its reverse complement (in italics) separated by a
short spacer region, and BglII or HindIII restriction sites. For caspase-3: 5’-
GATCCCCTCAATGGACTCTGGAATATTTCAAGAGAATATTCCAGAGTCCATTGATTTTTGGAAA-3’ and 5’-
AGCTTTTCCAAAAATCAATGGACTCTGGAATATTCTCTTGAAATATTCCAGAGTCCATTGAGGG-3’; and for a
random control sequence, 5’-
GATCCCCCCGACAAGCTTGAATTTATTTCAAGAGAATAAATTCAAGCTTGTCGGTTTTTGGAAA-3’ and 5’-
AGCTTTTCCAAAAACCGACAAGCTTGAATTTATTCTCTTGAAATAAATTCAAGCTTGTCGGGGG-3’.
Oligonucleotides were annealed, yielding double-stranded DNAs with overhanging restriction
sites, and ligated into digested pSUPER. Constructs were transformed into competent E. coli
DH5α by standard methods, and plated on LB with ampicillin (50 µg/ml). Plasmids were
extracted (QIAprep Spin Mini-prep Kit, Qiagen, Valencia, CA) and sequenced for confirmation.
Once confirmed, bulk plasmid was prepared for transfection using Qiagen Plasmid Midi Kit
(Qiagen, Valencia, CA).

9
Transfection of HCT8 intestinal epithelial cells:
HCT8 cells (kind gift of Cheleste Thorpe, Tufts University School of Medicine) are a polarizing
intestinal human transformed cell line and were used for this protocol because of their high
transfection efficiency. HCT8 cells were transfected with the modified pSUPER using
Lipofectamine 2000 (Invitrogen, Carlsbad, CA) per manufacturer’s instructions. Briefly, 4 µg of
plasmid was diluted into RPMI 1640 without serum (Invitrogen, Carlsbad, CA). Separately,
Lipofectamine 2000 (Invitrogen, Carlsbad, CA) was diluted into RPMI 1640 with Fetal Bovine
Serum (FBS) and incubated at room temperature for 5 minutes. Following incubation, the two
mixtures were combined and incubated at room temperature for 20 minutes. This cocktail was
added to HCT8 cells with RPMI 1640, and the cells were incubated in RPMI with 8% v/v FBS
without selection. Cells were passaged into fresh media with selection added the next day
(neomycin-G418, 1 mg/mL; Sigma-Aldrich, St. Louis, MO). Cells underwent two additional
cycles of growth/passage in G418 prior to use.
Functional assay for the caspase-1 and caspase-3:
Mucus samples from infected and uninfected mice were extracted by very gentle scraping using
a rubber policeman, as previously described (12). To determine caspase-1 and caspase-3 activity,
the mucus extract was directly mixed with the assay buffer according to the manufacturer’s
instructions (BioVision, Mountain View, CA).
Determination of SipA and SopA processing/cleavage:
In vitro cleavage of SipA and SopA was performed using a recombinant caspase-3 enzyme (20
µg/ml; Axxora, San Diego, CA). This enzyme was directly added to secretory protein extracts
10
(obtained by precipitation of bacterial culture supernatant proteins using 15% TCA precipitation)
of bacteria expressing these proteins and their caspase-3 site mutant forms for an hour at 37oC.
The samples were then immunoblotted with antibodies against SipA or SopA to verify cleavage.
Structural prediction of SopA caspase-3 sites
Software PYMOL (Protein molecule view and edit tool; DeLano Scientific, LLC) was used to
predict and view the three-dimensional structural positioning of the caspase-3 sites of SopA
using the deposited protein structure (ID 2QYU).
Statistics:
Neutrophil isolation was limited to repetitive donations by five different donors over the course
of these experiments. Due to variations in both neutrophils and transepithelial resistance between
monolayers (baseline resistance between 400 and 1,500 Ωcm2), data were analyzed within an
individual experiment and not between experiments. However, the overall trends associated with
these data are reproducible between experiments. All results are expressed as the mean ±
standard deviation of an individual experiment done in triplicate. P values were calculated
according to Student’s t test, and values <0.05 were considered statistically significant.
Invasion assay in primary macrophages
Bone marrow from freshly dissected wild-type and caspase-3 KO mice were collected in
conditioned differential media for bone marrow culture (RPMI with conditioned serum). The
cells were allowed to grow for 5-7 days in Petri plates. Using a 0.02% EDTA solution the cells
were scraped and after normalizing the cell number about 200,000 cells per well of a 24 well
plate. After overnight incubation these cells were washed and infected at a multiplicity of

11
infection of 10 with wild-type Salmonella. The cells were washed and fresh buffer containing
100 microgram /microliter of gentamycin was added. Bacterial cfu were determined 4 hours post
infection.

S1
0 1 2 3 4
SL1344
A-Casp3
Casp3
Hours following infection
A
0 1 2 3 4
vv341
Hours following infection
A-Casp3
Casp3
B
A1/ SipA A1/ csm
A
B
C
S2
* *
ΔSipA/pCSM-SipAΔSipA/pSipA
ΔSipA/pCSM-SipAΔSipA/pSipAΔSipA

S3
SL1344 fMLP HBSS+05
1015202530354045
PMN
Mig
ratio
n (C
E x
10,0
00)
UntreatedCasp3
inhibitor (20 µM)
*
Caspase-1 inhibitor
0
5
10
15
20
25
30
SL13442 20 0
HBSS2 20 0
fMLP2 200
PMN
Mig
ratio
n (C
E x
10,0
00)
A B
(µM)

S4
0
0.2
0.4
0.6
0.8
1
1.2
15 min 30 min 60 min 120 minTime Post Infection
Rel
ativ
e Ex
pres
sion

S5
SL1344 fMLP HBSS+05
1015202530354045
PMN
Mig
ratio
n (C
E x
10,0
00)
*
Untreated
Caspase 3(20 µM)
Caspase 1(20 µM)

0.2
0.4
0.6
0.8
1
1.2
1.4
0.5 1 1.5 2 3 4
Time post infection (h)
LDH
Act
ivity
(uni
ts/m
l)
SL1344SipA-HilA-HBSS+Triton
S6

60- NVWARDYLDLAQNK -73381- KGAGLDIGDNTTVD -394666- TKVHIDMYDGKNIT -679663- FGFRQDIKDGVSVS -676
1032- NKRMGDLRDTQGDA -10451075- RKHELDGVDLFTGA -1088
EspF * None detectedEspG * 157- ALSKMDLTDHKSMH -170EspH * 27- HIPNEDIVDEIQLK -37EspZ None detectedMap * None detected
EspA 2 sites non-conserved among strains
156- SEGIADAADDAAG -169 a
181- ASRTSDVADDIADSAQRA -198 b
EspD None detected
281- SIIDVDANDLQQLG -294410- RLLLDIQDGNQSTN -418
EscD 381- VIDAIDPKDGINIS -394EscF None detectedEscJ None detectedEscN None detectedEscR None detectedEscT 241- ANIHSDIIDRSLPS -254EscU None detectedEscV 191- ILLHHDAGDIIYSF -204SepL None detectedSepQ 257- NAKKDDIIDSTGYH -270SepZ None detected
5- FSSLQDIYDFYQDG -1826- NLTQQDLNDLHSYA -39
EspB*
CesD
Esc/Sep T3SS
Chaperone
EscC
Enteropathogenic Escherichia coli (EPEC)
EspC
Protein translocation apparatus
LEE-effectors protein
Table S1. Caspase-3 recognition and cleavage sites in Enteropathogenic Escherichia coli secreted effectors.
a Human Enteropathogenic strainE2348/69; Serotype O127 : H6(Accession number: CAA79733)b Rabbit diarrheagenic Escherichiacoli RDEC-1; serotype 015:H(Accession number: AAK26729)
* Proteins reported having differentfunctions related to the N and C-terminus or specific protein region
Analysis of the primary acid amino sequence.The caspase-3 motifs are highlighted in red.

203- SLKLDDLVDAQAKLA -217258- NDILEDIKDSHPIQ -270
275- PTPPEDMPDGGPTP -288386- FNHTPDNSDGIGSD -399553- TETNADTIDKNHAI -566590- ELLTDDISDLKNNN -603
IpaB None detectedIpaC* 270- DISLQDKIDTQRRT -283IpaD None detectedIpaJ None detected
OspB 49- EKGFCDSNDVLSIM -6212- TQCNIDSMDNRLHT -25138- HQSNSDLSDKILNI -151221- YMTLTDHFDNAIPP -234
OspC2 12- VQNNIDLVDGKINP -25OspF None detected
49- AEIFEDVNDSSALY -62103- PLSDIDTADIPDNI -116
MxiA None detected20- AMTNSDDGDETADA -3341- NSKYIDSSDEMASA -54
101- LPLDQDFIDRLKRY -114112- KRYFKDPSDQVLAL -125
MxiD * None detectedMxiE 54- FYHENDLRDSCNTE -67
MxiG * None detectedMxiH None detectedMxiI None detected
MxiJ * None detectedMxiK None detectedMxiL None detected
MxiM * None detectedMxiN None detectedSpa9 None detected
Spa13 None detectedSpa15 None detectedSpa24 None detectedSpa29 None detectedSpa32 21- KLSSIDNIDSLVLK -34Spa33 None detectedSpa40 None detectedSpa47 305- LLEDDDFADPLAEE -318IpgD None detected
VirB None detected
IpgC 29- NAIPDDMMDDIYSY -421- MEDLADVICRA -11
13- GIPSIDTDDQAIML -26
Mxi/Spa secreted proteins
OspC1
OspG
IpaA*
Shigella flexneri
Transcriptional activator
Chaperone
IpgE
Mxi/Spa T3SS
MxiC *
Table S2. Caspase-3 recognition andcleavage sites in Enteropathogenic Shigellaflexneri secreted effectors.
* Proteins reported having differentfunctions related to the N and C-terminus or specific protein region
Analysis of the primary acid amino sequence. Thecaspase-3 motifs are highlighted in red.

Figure Legends to Supplemental Data
Fig. S1. Time course of caspase-3 activation. T84 cells were infected with either wild-
type S. Typhimurium (SL1344) or an isogenic invasion deficient strain (vv341) over a
four-hour time course. Immunoblots were performed with anti-caspase-3 antibody (Cell
Signaling Technology). A-Casp3 represents the activated form of the enzyme.
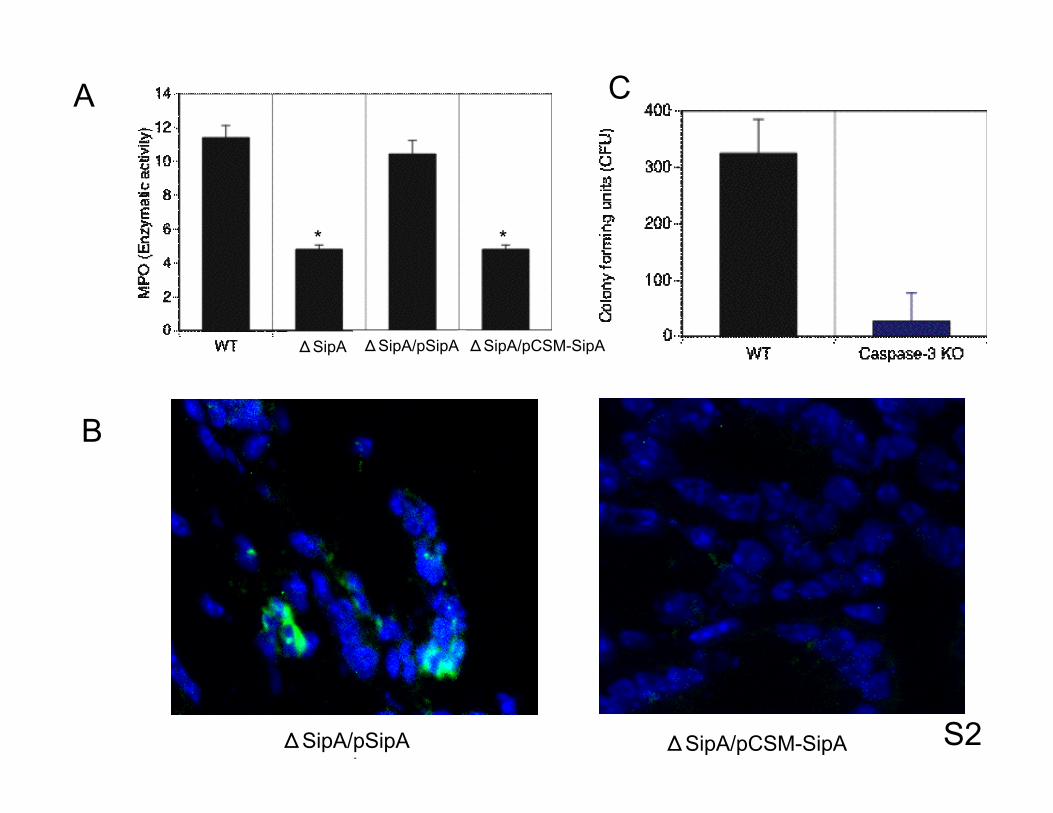
Fig. S2. Analysis of PMN infiltration. A) PMN infiltration into the proximal colon was
quantified by tissue myeloperoxidase activity (MPO) in mice following a 48 hour
infection with the ∆SipA, ∆SipA/pSipA, and ∆SipA/pCSM-SipA strains. MPO activity
was measured using the Mouse MPO ELISA test kit from Cell Sciences. Data are
expressed as the mean ± SD and represent groups of five mice. (*), P < 0.01 when the
data set for a given infection was compared to the wild-type (SL1344) S. Typhimurium.
B) Fluorescently stained proximal colon sections at 20x magnification. Sections were
stained with DAPI (blue) and PMNs were stained using a FITC-labeled antibody (green)
specific for the PMN surface markers Ly-6G and Ly-6C. Shown is a comparison between
the SipA complemented strain (∆SipA/pSipA) and the caspase-3 site mutant
complemented strain (∆SipA/pCSM-SipA). (C) Bone-marrow-derived macrophages from
wild-type and caspase-3-/- (caspase-3 KO) mice were infected (at a multiplicity of
infection of 10) and the bacterial colony forming units (cfu) were determined 4 hour post
infection.
Fig. S3. Pharmacologic inhibition of caspase-3. A) The effect of the specific caspase-3
inhibitor on S . Typhimurium-induced PMN transepithelial migration across T84

monolayers. Prior to infection, T84 monolayers were exposed to buffer only (black bars),
or the caspase-3 inhibitor for 2 hour. (B) The effect of the specific caspase-1 inhibitor on
S. Typhimurium-induced PMN transepithelial migration across T84 monolayers. PMN
migration across uninfected T84 monolayers in the presence of 1 µM PMN
chemoattractant (fMLP), or buffer served as the positive and negative controls,
respectively. The data are expressed as the mean ± SD of triplicate samples and represent
one of at least three independent experiments performed with similar results. (CE), cell
equivalents, (*), P < 0.01.
Fig. S4. Quantitative RT-PCR analysis of caspase-3 expression. Caspase-3 mRNA
production in response to S. Typhimurium infection was monitored over the first 2 hour
of infection. Caspase-3 mRNA levels were normalized to GAPDH transcript levels and
the normalized values of the Salmonella-infected versus the control uninfected cells were
used to calculate and plot caspase-3 mRNA relative expression. The data are expressed as
the mean ± SD of triplicate samples and represent one of at least three independent
experiments performed with similar results.
Fig. S5. The effect of the exogenous addition of caspase-3 on S. Typhimurium-induced
PMN transepithelial migration across T84 monolayers. During S. Typhimurium wild-type
infection, T84 monolayers were exposed to buffer (black bars), caspase-3 (20 µM; white
bars), or caspase-1 (20 µM; gray bars) for 1 hour. PMN migration across uninfected T84
monolayers in the presence of 1 µM PMN chemoattractant (fMLP), or buffer only served
as the positive and negative controls, respectively. The data are expressed as the mean ±
SD of triplicate samples and represent one of at least three independent experiments
performed with similar results. (CE), cell equivalents, (*), P < 0.05.
Fig. S6: Cell lysis in response to infection with S. Typhimurium. Lactate dehydrogenase
(LDH) activity in the supernatant of T84 infected cells was measured over 4 hour as an
indicator of cell lysis in response to infection. Wild-type S. Typhimurium (SL1344) and
the SipA negative mutant strain SipA- and HilA-, an invasion deficient strain, were used
to infect T84 cells for 1 hour and LDH release was quantified using an In Vitro Toxicity
Assay kit (Sigma-Aldrich). One percent Triton and HBSS+ buffer were used as positive
and negative controls, respectively. The data are expressed as the mean ± SD of triplicate
samples and represent one of at least three independent experiments performed with
similar results.
References:
1. K. Dharmsathaphorn, J. L. Madara, Methods Enzymol 192, 354 (1990).2. J. L. Madara et al., J Clin Invest 89, 1938 (Jun, 1992).3. D. M. Wall et al., Cell Microbiol 9, 2299 (Sep, 2007).4. C. A. Lee, S. Falkow, Proc Natl Acad Sci U S A 87, 4304 (Jun, 1990).5. B. A. McCormick, S. P. Colgan, C. Delp-Archer, S. I. Miller, J. L. Madara, J Cell
Biol 123, 895 (Nov, 1993).6. C. A. Parkos, C. Delp, M. A. Arnaout, J. L. Madara, J Clin Invest 88, 1605 (Nov,
1991).7. M. Barthel et al., Infect Immun 71, 2839 (May, 2003).8. C. C. Chen, S. Louie, B. McCormick, W. A. Walker, H. N. Shi, Infect Immun 73,
5468 (Sep, 2005).9. R. C. Burns et al., Gastroenterology 121, 1428 (Dec, 2001).10. F. Loher et al., J Pharmacol Exp Ther 305, 549 (May, 2003).11. T. R. Brummelkamp, R. Bernards, R. Agami, Science 296, 550 (Apr 19, 2002).12. B. A. McCormick, B. A. Stocker, D. C. Laux, P. S. Cohen, Infect Immun 56, 2209
(Sep, 1988).