supporting paper 1: productivity and income — the ... · web viewthe focus of policy makers on...
TRANSCRIPT

anberra, August 2017

ã Commonwealth of Australia 2017ISBN 978-1-74037-624-2 (PDF)
Except for the Commonwealth Coat of Arms and content supplied by third parties, this copyright work is licensed under a Creative Commons Attribution 3.0 Australia licence. To view a copy of this licence, visit http://creativecommons.org/licenses/by/3.0/au. In essence, you are free to copy, communicate and adapt the work, as long as you attribute the work to the Productivity Commission (but not in any way that suggests the Commission endorses you or your use) and abide by the other licence terms.
Use of the Commonwealth Coat of ArmsFor terms of use of the Coat of Arms visit the ‘It’s an Honour’ website: http://www.itsanhonour.gov.au
Third party copyrightWherever a third party holds copyright in this material, the copyright remains with that party. Their permission may be required to use the material, please contact them directly.
AttributionThis work should be attributed as follows, Source: Productivity Commission, Productivity and Income — The Australian Story, Shifting the Dial: 5 year Productivity Review, Supporting Paper No. 1.If you have adapted, modified or transformed this work in anyway, please use the following, Source: based on Productivity Commission data, Productivity and Income — The Australian Story, Shifting the Dial: 5 year Productivity Review, Supporting Paper No. 1.
An appropriate reference for this publication is:Productivity Commission 2017, Productivity and Income — The Australian Story, Shifting the Dial: 5 year Productivity Review, Supporting Paper No. 1, Canberra.
Publications enquiriesMedia and Publications, phone: (03) 9653 2244 or email: [email protected]
The Productivity CommissionThe Productivity Commission is the Australian Government’s independent research and advisory body on a range of economic, social and environmental issues affecting the welfare of Australians. Its role, expressed most simply, is to help governments make better policies, in the long-term interest of the Australian community.The Commission’s independence is underpinned by an Act of Parliament. Its processes and outputs are open to public scrutiny and are driven by concern for the wellbeing of the community as a whole.Further information on the Productivity Commission can be obtained from the Commission’s website (www.pc.gov.au).

Contents
Key points 2
Productivity and income: the Australian story 31 Background 3
2 Australia’s productivity trends 4
3 Explanations for the productivity slowdown 29
4 Implications of productivity for incomes and wages 39
Appendix A International productivity data — which measure to use? 50
References 55
SP 1 – PRODUCTIVITY AND INCOME – THE AUSTRALIAN STORY 1
Key points Productivity is often spoken about as something desirable, but like sustainability, can mean
very different things to different people. It is not about working longer hours, rather it is about making the most of the resources we have available. Productivity grows when we produce more outputs for the same or fewer inputs.
The focus of policy makers on productivity is well justified. Realising productivity growth — improvement in the efficiency of resource use over time — is the most sustainable way of growing incomes, and supporting the consumption of the goods and services desired by the community. This broad approach to productivity includes the ability of the economy to adapt as community desires change (for example with an ageing population), and as resources become more scarce (for example land in cities).
Australia is over five times as productive as we were a century ago — this means that every day, we generate five times as much wealth, on average, for the same amount of input. Within the past 30 years, productivity has more than doubled. This has delivered substantial growth in people’s average incomes and, through both wages growth and one of the most progressive tax and transfer systems in the world, the benefits have been broadly shared across the income spectrum.
Australia has not experienced recession since 1991. But we have benefited from strong terms of trade growth, which has pushed up the value of our exports compared with what we buy from abroad. And while the terms of trade has reversed since 2012, it remains well above long-term historical levels. We have also had strong growth in both the population and in the stock of capital, and the recent trends in per capita income growth paint a less rosy picture. Importantly, productivity growth — outputs per unit inputs — has been flat, on average, for over a decade.
The expansion in the mining industry has brought many benefits since the mid-2000s, but it employs relatively few workers, and much of the capital is foreign owned. Other trade-exposed industries have had to face high exchange rates that eroded their external competitiveness. Those that have survived should have emerged stronger, yet there is little sign of the general pick-up in productivity growth that should have emerged. The Australian economy remains vulnerable to external shocks, with domestic markets affected by a heightened perception of risk after the global financial crisis, and looking forward, it is subject to structural pressures from an ageing population, and an unsustainable fiscal trajectory.
Governments exert significant influence on productivity outcomes through laws, regulations and other institutional ‘rules of the game’. These rules affect the incentives facing businesses and individuals to work and invest. Governments also provide, or influence, much of the necessary infrastructure, including social infrastructure such as education, that provides the services needed to support business. Getting these rules and investments right will help build productivity, getting them wrong can hamper the ability of business to deliver productivity growth.
1 PRODUCTIVITY REVIEW

Productivity and income: the Australian story
1 Background
The productivity slowdown observed across much of the developed world has raised concerns about the future drivers of income growth. While domestic factors such as the recent mining investment boom have driven much of Australia’s productivity performance of late, Australia has not been immune from broader global, and longer term, trends. Across the world, the gains that have come from the opening of economies to trade and globalisation have slowed, in part due to their success, and in part the rise in more protectionist sentiments following the global financial crisis. Moreover, developments in digital and other technologies, while holding out the promise of productivity growth, have yet to deliver. As a relatively small, open and capital importing country, how these developments continue to unfold, and governments’ responses to them — including our own — will have a strong bearing on Australia’s productivity potential.
This supporting paper tells the story of productivity growth in Australia. It focuses mainly on the market sector of the economy — the 16 industries where output and inputs can be measured reliably, which comprise about 80 per cent of GDP.1 The conclusions serve a reminder of the need for ongoing reform efforts by governments. Government policies, through institutions, laws and regulations, and investments have a fundamental influence on the capacities and opportunities for individuals and businesses to respond to new technologies, and to contribute to new forms of growth. As the push and pull of global trends and new technologies continue to affect Australia, continued reforms to policy settings are crucial, if not fundamental, to enabling businesses to deliver growth in the 21st century.
The coverage of this review overlaps with the Commission’s annual Productivity Update publication. Given this, it is proposed that each successive 5 yearly Productivity Review includes the Productivity Update material. The Update will be published as a separate report in the interim years.
The remainder of this paper is structured as follows. Section 1.2 discusses the drivers of productivity growth and explores trends in Australia’s productivity performance, and international trends. Section 1.3 discusses some explanations for the observed international productivity slowdown, and section 1.4 draws implications of recent productivity performance, and international trends, for income and wages growth, and inequality.
1 Supporting Paper 2 explores the challenges in measuring productivity in the non-market sector.
SP 1 – PRODUCTIVITY AND INCOME – THE AUSTRALIAN STORY 2
2 Australia’s productivity trends
Productivity growth is a key source of long-term economic and income growth, and as such, is an important determinant of a country’s average living standards. Conceptually, it seeks to quantity how efficiently resources, such as capital and labour, but also land, energy, environmental services, and other unpriced public goods, are used to produce output — the goods and services we choose to consume every day. In a measured sense, growth in productivity represents growth in outputs over and above the growth of inputs (box 1 outlines the key measurement concepts).
Over the long-term, productivity growth supports the additional consumption of the goods and services desired by the population. Tax and transfer policy settings that tilt the distribution of income to support the less well-off mean that all members of society can benefit from productivity growth. Moreover, productivity improvements that increase the demand for low skilled workers mean higher wages and employment opportunities for those who have fewer skills. For example, if new technologies complement the skills of care workers so that they can provide more services per hour worked, government funding will stretch further and could see an increase in the demand for these workers as the value of their service rises. Productivity growth at this end of the skill spectrum that grows the market reduces the need for welfare payments, to the benefit of these workers and the public budget.
Importantly, productivity growth is essential for sustainable growth, as it is only by delivering more output — the goods and services we consume every day — for less inputs that living standards can rise without eroding the quality of the environment. By making production processes inherently more sustainable, productivity growth improves the intergenerational equality of consumption opportunities.
Productivity growth should not be considered the end policy objective, particularly in the short-term. Policies that, for example, reduce unemployment or enable greater labour force participation could well reduce productivity per hour (because, by definition less productive workers are being brought in, and reducing the average productivity of the labour force), but this clearly represents a socially desirable outcome. It also entails more output per capita. In that broader sense, making better use of the total resources of a society can also be interpreted as a productivity improvement.
The broad definition of productivity is what matters. Skills built through employment increase the quality of the labour force, contributing to higher productivity. And while using natural resources in an unsustainable way can boost productivity growth in the short run (as firms save costs by not having to put environmental management strategies in place), in the long run this will sap productivity growth. Hence using all our resources with a view to long-term productivity will contribute to improved living standards over time through wage and income growth. This is of primary importance to the Australian population and needs to be the focus of continued reform efforts by governments.
3 PRODUCTIVITY REVIEW

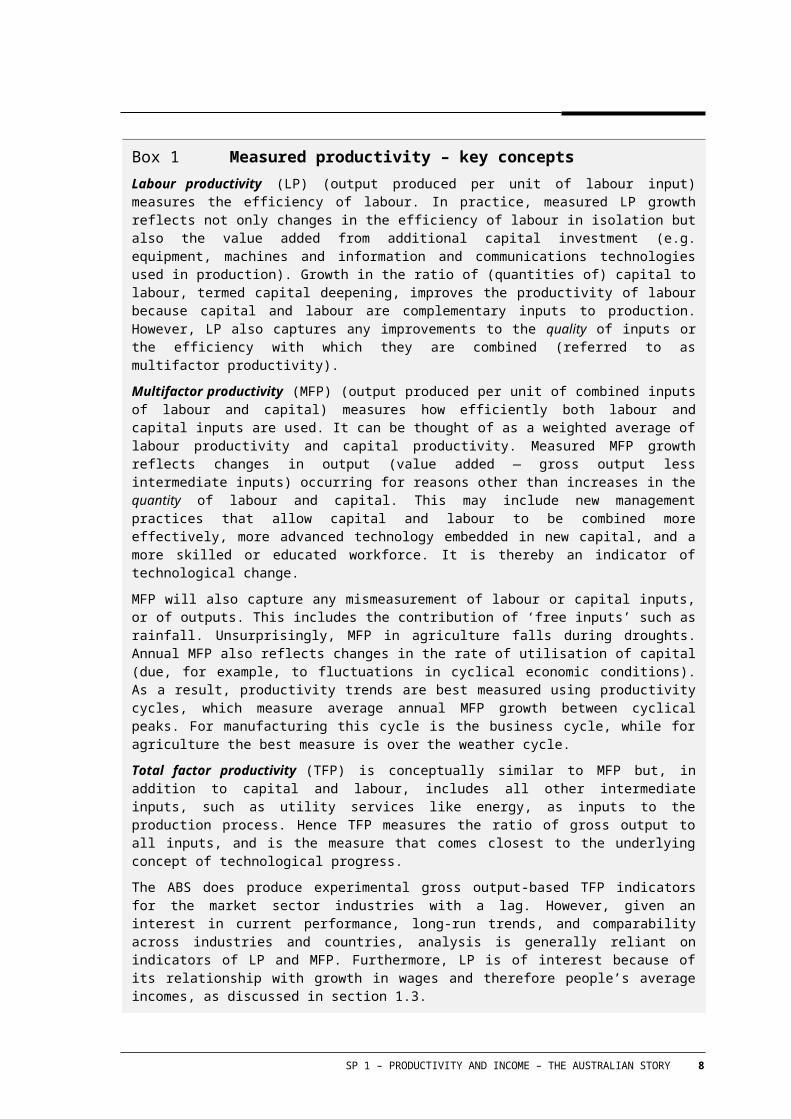
Box 1 Measured productivity – key conceptsLabour productivity (LP) (output produced per unit of labour input) measures the efficiency of labour. In practice, measured LP growth reflects not only changes in the efficiency of labour in isolation but also the value added from additional capital investment (e.g. equipment, machines and information and communications technologies used in production). Growth in the ratio of (quantities of) capital to labour, termed capital deepening, improves the productivity of labour because capital and labour are complementary inputs to production. However, LP also captures any improvements to the quality of inputs or the efficiency with which they are combined (referred to as multifactor productivity).
Multifactor productivity (MFP) (output produced per unit of combined inputs of labour and capital) measures how efficiently both labour and capital inputs are used. It can be thought of as a weighted average of labour productivity and capital productivity. Measured MFP growth reflects changes in output (value added — gross output less intermediate inputs) occurring for reasons other than increases in the quantity of labour and capital. This may include new management practices that allow capital and labour to be combined more effectively, more advanced technology embedded in new capital, and a more skilled or educated workforce. It is thereby an indicator of technological change.
MFP will also capture any mismeasurement of labour or capital inputs, or of outputs. This includes the contribution of ‘free inputs’ such as rainfall. Unsurprisingly, MFP in agriculture falls during droughts. Annual MFP also reflects changes in the rate of utilisation of capital (due, for example, to fluctuations in cyclical economic conditions). As a result, productivity trends are best measured using productivity cycles, which measure average annual MFP growth between cyclical peaks. For manufacturing this cycle is the business cycle, while for agriculture the best measure is over the weather cycle.
Total factor productivity (TFP) is conceptually similar to MFP but, in addition to capital and labour, includes all other intermediate inputs, such as utility services like energy, as inputs to the production process. Hence TFP measures the ratio of gross output to all inputs, and is the measure that comes closest to the underlying concept of technological progress.
The ABS does produce experimental gross output-based TFP indicators for the market sector industries with a lag. However, given an interest in current performance, long-run trends, and comparability across industries and countries, analysis is generally reliant on indicators of LP and MFP. Furthermore, LP is of interest because of its relationship with growth in wages and therefore people’s average incomes, as discussed in section 1.3.
Sources: Gordon, Zhao, and Gretton (2015); PC (2016b). Note that the EU- and World-KLEMS projects do not produce current TFP data for Australia, instead pointing to the ABS MFP statistics.
Over the short to medium term, growth in productivity is only one source of improvement in living standards. Over the course of the mining boom, strong growth in Australia’s terms of trade (ToT) — the prices of products exported relative to the prices of products imported — has supported increased incomes. This is despite a relatively lacklustre productivity growth performance over the same period. But Australia has little control over the ToT. Its rise reflected the good fortune of having resources that were in high demand in the rest of the world — and what goes up can come down. Hence the continued need for a focus on productivity by policy makers.
SP 1 – PRODUCTIVITY AND INCOME – THE AUSTRALIAN STORY 4

The income growth driven from the rise in the ToT illustrates a key distinction between productivity and economic efficiency. Allocative efficiency improves when people, capital and physical resources move to the businesses and industries that value them most. As relative prices change, resources shift to where they earn a higher rate of return, raising income. For example, the mining boom drove up wages in mining so that labour shifted, along with capital, into mining and supporting industries. This raised Australia’s income but, for reasons to do with long project lead times and the costs of greenfield developments, lowered its productivity growth. Yet, not allowing resources to move would have reduced the growth in income in Australia.
Social and environmental factors also come into play. Governments play a central role in providing social and health insurance, reducing income inequality, and providing opportunities for people through the education system. Notwithstanding that taxes must be raised to fund such activities (with the adverse impacts that taxes can have on investment and labour supply), these investments are important to promote productivity overall. Some such investments can, however, be misdirected and public funds wasted. Ensuring good returns on public investment in health and education are themes pursued in the Productivity Review. This Review does not recommend subordinating a nation’s social and political values to raise productivity at all costs — such a policy focus would misunderstand what matters for community wellbeing. In considering policy reforms, this Productivity Review recognises that productivity is just one of many factors, albeit a critically important one, that contributes to growing national welfare.
CONCLUSION 1.1
Productivity improvements are essential to achieving growth in average incomes and living standards over time. Doing more with the available resources, and reinvesting back in these resources, helps to improve social and environmental, as well as, economic outcomes. Policy frameworks that focus solely on a narrowly defined view of productivity (outputs per unit inputs) risk operating at the detriment of optimal resource allocation and the broader social and environmental domains, which all contribute strongly to community wellbeing.
Drivers of productivity growth
The drivers of productivity reflect not only policy settings, but also a mix of deeper historical and path-dependent factors, many of which governments are unable to affect. PC (2009) outlines a framework for conceptualising the immediate, underlying, and fundamental causes of productivity growth.
Immediate causes have close and tangible links to input/output relationships in production, often at the level of businesses or the individual. They may be necessary to bring about productivity improvement, but they may be difficult to engender without policy change at the other levels.
5 PRODUCTIVITY REVIEW

Underlying factors can have an indirect effect on productivity by promoting the immediate causes. They help to determine the extent to which the immediate causes change and bring about an improvement in productivity.
Fundamental influences involve deeper policy, social and institutional factors that affect productivity in very general and indirect fashion. They set the ‘environmental’ conditions that can affect productivity, especially over the long term.
Productivity improvements from immediate causes reflect technological advances, such as better products and bringing into operation better production techniques. The accumulation of physical capital and human capital (the health, education and skills of the workforce) and accumulation of knowledge (such as through research and development and learning by doing) are seen as central and interrelated in the development, application and refinement of new technologies (innovation). Specialisation in production (economies of scale and scope) are also important in bringing about improvements to productivity by, for example, allowing more efficient technologies to be adopted. Not just new technologies improve productivity. Improvements in firm organisation, management practices and work arrangements can be a major source of productivity improvement. Continuous review processes, improvement of production systems and supply arrangements (like procurement), inventory management, quality assurance, team-based work and other elements of organisational structure are investments by firms to improve productivity. Immediate causes are generally the domain of businesses and individuals, but also apply to government-provided services in the non-market sector.
The general feature of the underlying factors — competition, openness of the economy to trade and investment, and demand and supply conditions — is that they help to condition the extent to which the immediate causes of productivity growth come into play. A change in firm organisation might not happen without the incentive provided by competition. Access to overseas technologies and management expertise may not be possible without openness to foreign trade and investment. Inaccurate price signals and other distortions to labour demand and supply outcomes can impede the accumulation of human capital. Regulations can inhibit the adoption of different production methods and new technologies. Better resource allocation through competition (for example, facilitating the entry of new innovative businesses or the exit of ‘unproductive’ ones) can improve productivity through reallocating resources to more productive activities. These underlying causes generally interact with government policy and policy reforms.
Fundamental factors condition productive potential and its long-term realisation. The emphasis given by policy makers to different economic objectives affects the development of productivity-enhancing capabilities, such as investment in education and infrastructure. The stability of policy settings affects the risks involved in making long-term investment decisions. Formal and informal institutional ‘rules of the game’ affect the costs of coordinating production activities and conducting business. These rules influence, and sometimes limit, the incentives that firms and individuals have to raise productivity. Cultural and social factors also shape the orientation of people toward change of the kind
SP 1 – PRODUCTIVITY AND INCOME – THE AUSTRALIAN STORY 6

required to achieve further development. For example, new technology always comes with risks, so the risk appetite of the community will affect the rates of adoption.
Measures of productivity at the aggregate and industry level are useful to provide an ex post indication of what is likely to have contributed to shifts in productivity performance at the macroeconomic level. For example, broad trends in capital deepening, human capital development, and technological progress can often be discerned. However, measured aggregate productivity indicators — which is a residual (growth in aggregate output less growth in aggregate inputs) — means that little, if anything, can be discerned about the immediate or underlying drivers of productivity. At the microeconomic level, these are drivers like skills development, innovation, research and development, managerial practises, and so on. Ultimately, any policy relevant observations or recommendations based on judgements about productivity must also consider the theoretical drivers of productivity growth at a detailed level, ideally alongside other indicators of performance. As discussed in section 1.3 below, there is significant scope in Australia to improve firm-level productivity analysis to illuminate some of these factors, and in particular, to determine how the theoretical drivers matter in practice and how this may differ across firms and industries.
Policy’s impact on productivity levels and growth rates
Policy changes that improve the settings in which businesses and individuals make decisions (including decisions on the function and actions of governments themselves), can permanently increase the level of productivity. The gains in income from a higher level of productivity are enduring and result in a higher level of income than would otherwise be the case. However, it is possible that policy reform could sometimes permanently improve productivity growth, relative to what it would otherwise be. For example, reforms that indelibly increase the propensity of businesses to innovate can structurally improve productivity growth because successive innovations should, over time, continuously raise the level of output able to be produced from existing labour and capital resources (PC 2009).
The desirability of MFP versus capital deepening – what role for investment?
Both MFP and capital deepening are desirable sources of LP growth. MFP growth is particularly desirable because, unlike capital deepening, it does not require consumption to be forgone. That is, capital deepening brought about by investment requires expenditure on capital, which could have been spent on other consumables, whereas MFP growth ultimately requires no such trade-off. Furthermore, MFP growth over the long-term usually signals advancement in technology and overall economic efficiency.
This is not to say that investment is not needed to drive advances in technology. Investment in R&D, skills and new capital can be critical. The key is that these investments return far more than their cost. And even moving closer to the frontier by
7 PRODUCTIVITY REVIEW

adopting the technologies developed elsewhere is not costless, often requiring organisational change. Again, the key is that the return exceeds the cost of the investment required. Hence investment, widely construed to include education and facilitating infrastructure, can be inextricably linked to productivity growth. Low investment can be the death knell for MFP growth.
As the appreciation of the exchange rate associated with the improvement in the ToT lowered prices for imported consumption goods, less consumption was forgone to support the higher aggregate capital deepening through the mining boom (and as much of this expansion in capital was funded with foreign capital inflow, domestic consumption was little affected). The subsequent decline in commodity prices and the depreciation of the exchange rate have contributed to lower rates of income growth. This serves as a reminder that large amounts of capital investment, which respond to cyclical factors, cannot be relied upon as a sustained source of income growth. Large capital inflows from overseas can raise national income in the short term, but may detract from resources available to other sectors of the economy, potentially lowering output in the longer term.
More generally, whether productivity growth in the future improves through capital deepening and investment-driven innovation will depend on the prudence of the investment decisions and subsequent management of assets — that is, whether investments have been based on sound judgment of net benefits, and whether the new capacity is used efficiently over the lives of the assets. For example, infrastructure capacity that is poorly utilised will, all else being equal, detract from productivity (and income) growth. As discussed in chapter 4 in the main report and supporting paper 9, there are continuing instances of poor, major, investment decisions. Any improvement in the selection and use of infrastructure will, other things equal, increase output and average incomes in Australia.
Policy settings that encourage investment at the firm level can also have positive productivity impacts that are difficult to measure. Capital investments that embody new technologies can be a catalyst for improvement where they drive more innovative ways of doing things. In a dynamic setting, if the return on capital exceeds the cost of capital, the gains will be captured in measured MFP growth. Policy ought not to skew decision making away from capital investment where there are expected net benefits to the firm taking into account the risks inherent in the investment. It is difficult to imagine, for example, how business processes today would have evolved, were it not for the gradual adoption of new and untested information and communication technologies in the 1980s and 1990s (many of which have been superseded).2
Private and public capital investment decisions also interact in crucial ways. Governments have a key role in the provision (and regulation) of key infrastructure like transport (such as roads and rail) and utilities (for example gas and water pipelines, sewerage and
2 While estimates of the effects of ICT on productivity and output differ, there is a general view that its contribution is positive. For a review of the impact of ICT investment on productivity, see (PC 2004) and (Tisdell 2017). Also see Shahiduzzaman, Layton and Alam 2015 for a more recent econometric analysis of the relationship and complementarities between ICT investment, ICT and non-ICT capital deepening, and LP and MFP growth in Australia.
SP 1 – PRODUCTIVITY AND INCOME – THE AUSTRALIAN STORY 8
electricity transmission networks) on which most businesses and individuals rely. Public capital investment decisions can also affect the investment decisions of firms. The current debate on energy costs and their impact on businesses’ viability is a case in point. Beyond the initial capital deepening effect that large public investments provide, they can also facilitate access to, or lower the cost of, intermediate or factor inputs. For example, effective transport and communications systems can lead to reduced freight and business travel costs, allowing greater production with the same inputs.
Public infrastructure projects may also have broader economic effects. For example, the proximity of workers to jobs can improve labour market matching, and increase labour force participation. Greater effective proximity of suppliers, customers and competitors can also lead to more competitive markets, while generating knowledge spillovers from the application of technology. Businesses and individuals can also benefit from infrastructure even if they do not use it. For example, a business might not use a new road, but nonetheless benefits from reduced congestion on the part of the network they do use. Where public infrastructure decisions are poorly planned, the net benefits of these investments can be negative. This emphasises the need for robust settings to determine public infrastructure investment priorities, rigorous analysis of project business cases, and the sound management of assets over time.
CONCLUSION 1.2
Governments can exert influence on both MFP performance and capital deepening over time, both of which are desirable sources of productivity growth. Governments can aid productivity growth by supporting education and skills development, updating regulatory settings over time so as not to impede private sector investment, and ensuring the wider benefits of public infrastructure are realised through prudent project selection and sound asset management.
Productivity growth – what do the measures tell us?
The long-run view
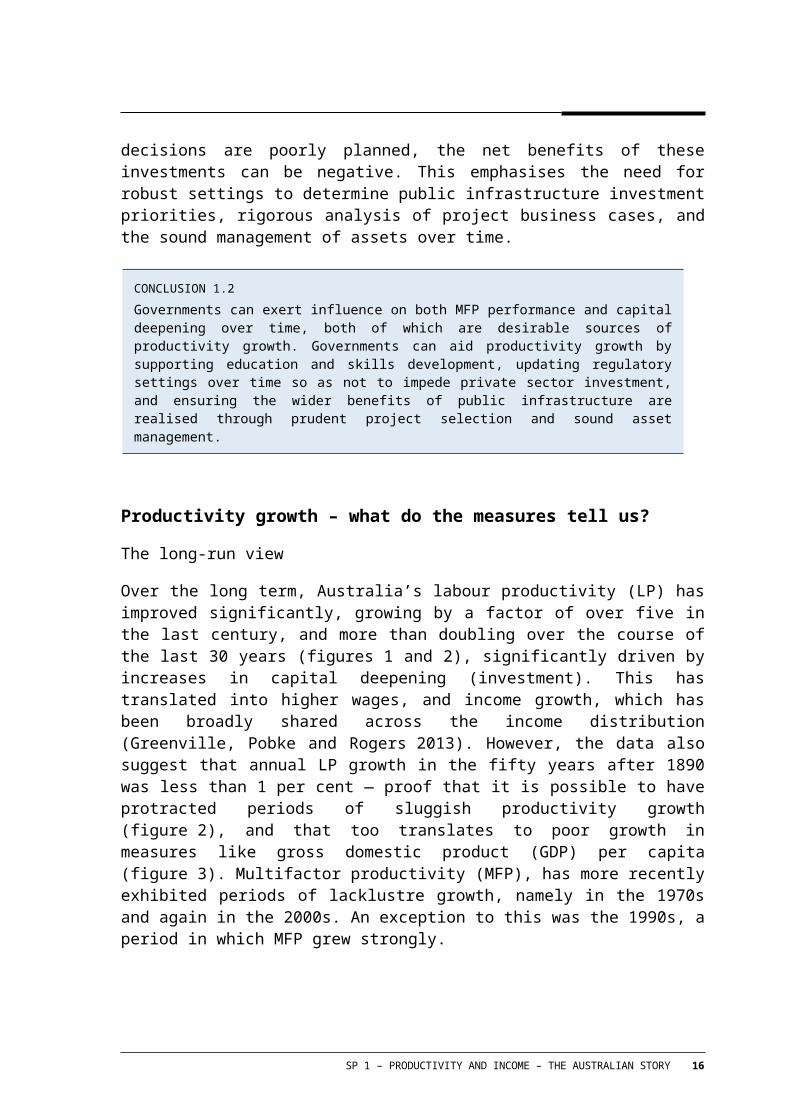
Over the long term, Australia’s labour productivity (LP) has improved significantly, growing by a factor of over five in the last century, and more than doubling over the course of the last 30 years (figures 1 and 2), significantly driven by increases in capital deepening (investment). This has translated into higher wages, and income growth, which has been broadly shared across the income distribution (Greenville, Pobke and Rogers 2013). However, the data also suggest that annual LP growth in the fifty years after 1890 was less than 1 per cent — proof that it is possible to have protracted periods of sluggish productivity growth (figure 2), and that too translates to poor growth in measures like gross domestic product (GDP) per capita (figure 3). Multifactor productivity (MFP), has more recently exhibited periods of lacklustre growth, namely in the 1970s and again in the 2000s. An exception to this was the 1990s, a period in which MFP grew strongly.
9 PRODUCTIVITY REVIEW
Figure 1 Australia’s long run productivity trendsa,b
Growth rates are for aggregate productivity cycles
0
50
100
150
200
250
300
1973-74 1979-80 1985-86 1991-92 1997-98 2003-04 2009-10 2015-16
Inde
x (1
973-
74=1
00)
Labour productivity Multifactor productivity
1973-741981-82
1984-851988-89
1993-94
1998-992003-04
2007-08
LP 2.1 2.3 1.3 2.4 3.9 2.3 1.6 2.2MFP 0.4 0.6 0.6 1.0 2.6 1.1 0.0 0.2
a 12-industry market sector (ANZSIC Divisions A to K and R). The latest cycle remains incomplete and therefore may be subject to changes in capacity utilisation. b The 12 industry MFP series is used as the 16 industry series has only been calculated since 1994-95.
Source: ABS (2016d), Estimates of Industry Multifactor Productivity, 2015-16, Cat. no. 5260.0.55.002, December 2016, and Productivity Commission estimates.
Much of the marked MFP growth during the 1990s has been attributed to the macroeconomic and microeconomic reforms of the 1970s and 1980s, combined with the adoption and effective use of information and communications technologies (ICT) (Parham 2004).
These reforms included movement toward medium-term frameworks for monetary and fiscal policy (namely the shift to inflation targeting, and aiming for budget balance over the cycle through more prudent taxation and spending decisions), floating the exchange rate, liberalisation of capital market flows and removal of interest rate controls, reductions in industry assistance measures and tariffs, reform of taxation, privatisation of government business enterprises, the shift away from centralised wage determination to enterprise bargaining, and other elements of regulatory and competition policy (Banks 2005).
Among other things, these reforms opened up the economy to overseas resources and competition, improved the efficiency and flexibility of domestic industries, and delivered much greater macroeconomic stability (Australian Treasury 2009).
SP 1 – PRODUCTIVITY AND INCOME – THE AUSTRALIAN STORY 10
Figure 2 Australia’s (long) long run productivity trendsa
1890 to 2015
0
50
100
150
200
250
300
350
400
450
500
550
1890 1915 1940 1965 1990 2015
Inde
x 18
90=1
00
LP TFP
a The series diverge from that presented above due to different methods for interpolating data, though the results are not markedly different for the overlapping time periods.
Source: Bergeaud, Cette and Lecat (2016).
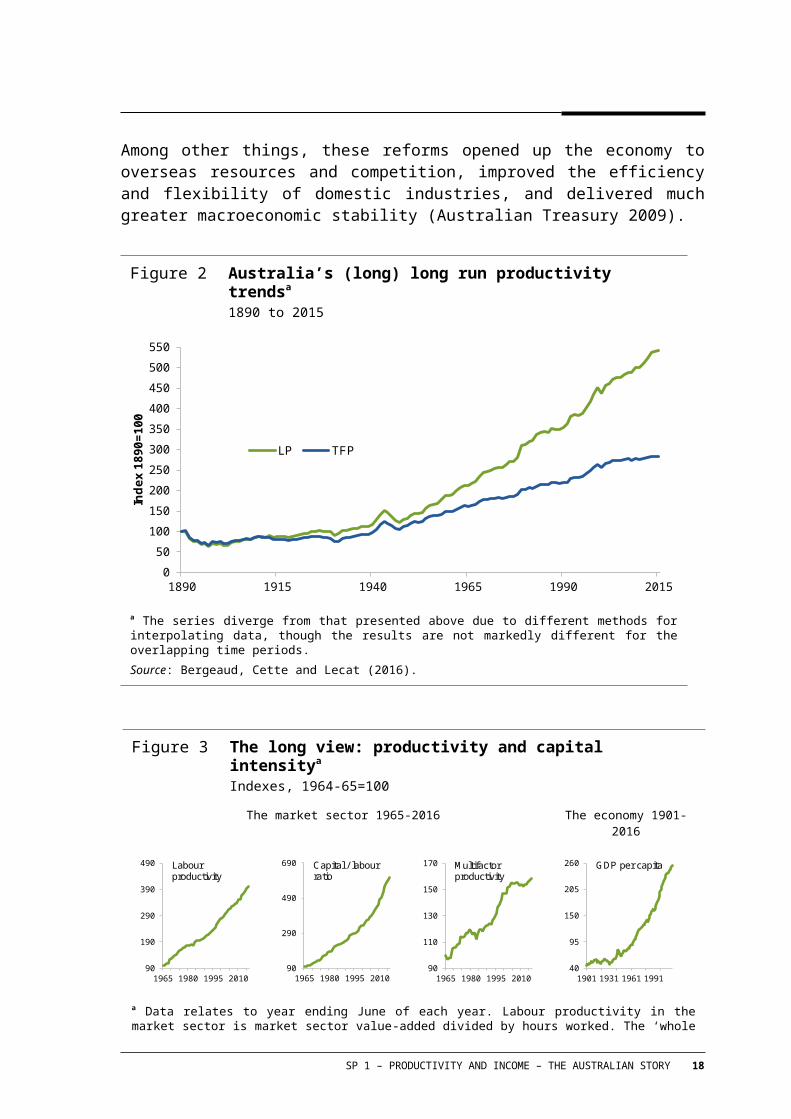
Figure 3 The long view: productivity and capital intensitya
Indexes, 1964-65=100
The market sector 1965-2016 The economy 1901- 2016
90
190
290
390
490
1965 1980 1995 2010
Labourproductivity
90
290
490
690
1965 1980 1995 2010
Capital / labour ratio
90
110
130
150
170
1965 1980 1995 2010
Multifactorproductivity
40
95
150
205
260
1901 1931 1961 1991
GDP per capita
a Data relates to year ending June of each year. Labour productivity in the market sector is market sector value-added divided by hours worked. The ‘whole economy’ data series involves assumptions about the relationship between hours worked and employment.
Sources: ABS 2008 and 2016, Australian System of National Accounts, Cat. no. 5204.0; Butlin (1977) and Foster (1996).
About two-thirds of annual LP growth (or 1.5 per cent per year) has been historically attributable to capital deepening and the remainder to MFP growth (figure 4). Between 1993-94 to 1998-99, however, at about two-thirds of annual LP growth, the contribution of
11 PRODUCTIVITY REVIEW

MFP growth was significantly greater than historical averages. LP growth averaged 3.9 per cent a year during this period.
Figure 4 Market sector labour productivity decompositiona
Measured using aggregate market sector productivity cycles
2.1 2.3
1.3
2.4
3.9
2.3
1.6
2.2
-0.5
0.5
1.5
2.5
3.5
4.5
1973-74to 1981-82
1981-82to 1984-85
1984-85to 1988-89
1988-89to 1993-94
1993-94to 1998-99
1998-99to 2003-04
2003-04to 2007-08
2007-08to 2015-16
perc
enta
ge p
oint
s
Capital deepening contribution
Multifactor productivity contribution Labour productivitygrowth rates
a 12-industry market sector (ANZSIC Divisions A to K and R). The latest cycle remains incomplete and therefore may be subject to changes in capacity utilisation.
Source: ABS (2016d), Estimates of Industry Multifactor Productivity, 2015-16, Cat. no. 5260.0.55.002, December, and Productivity Commission estimates.
LP growth during the 1990s was led by service sector industries, such as wholesale trade, business and financial services that drew on new advances in ICT to transform the way they did business. This was supported by continued productivity growth in industries like telecommunications and utilities. As a result, productivity levels in these industries rose towards international best practise (Dolman and Gruen 2012).
‘The nothing era’ and more recent performance
After the 1990s, aggregate productivity performance was determined by different sets of underlying forces. In the early 2000s, Australia entered the largest ToT boom in its history. This has had a number of fundamental impacts on the economy, including strengthening the exchange rate, lowering the cost of imported goods and boosting the purchasing power of Australian incomes. It also gave rise to rapid growth in mining investment, and strong growth in a range of related domestic services industries. Conversely, manufacturers and other export-competing industries came under pressure from competitors in China and other emerging markets as a result of the high exchange rate (Dolman and Gruen 2012). In addition, surviving manufacturers took advantage of the exchange rate to import capital, but subdued demand limited its utilisation, further reducing productivity growth in the sector (Barnes et al. 2013).
SP 1 – PRODUCTIVITY AND INCOME – THE AUSTRALIAN STORY 12

The impact of mining investment (which rose from approximately 2 per cent of GDP in 2002-03 to over 9 per cent in 2012-13) on measured productivity has been profound. There is often a lag between capital investment and output growth for large lumpy investments. This is particularly the case for capital investment in the mining industry, where new projects, such as developing new iron ore mines, can involve lengthy construction periods before any output is generated. High commodity prices witnessed during the boom also created incentives for firms to pursue more marginal reserves of commodities, which further reduced measured productivity (Topp et al. 2008).
However, the fall in productivity growth over the first half of the 2000s was not only observed in the mining sector, with multiple observers highlighting the ‘broad-based’ nature of the decline. There is no single explanation for why productivity performance levelled off across industries. It likely reflects a number of industry specific factors. For instance, the contribution of ICT technologies in services industries that make significant use of them, began to ebb (Connolly and Gustafsson 2013; Jorgenson, Ho and Stiroh 2008). The early to mid-2000s also saw a prolonged period of drought, which affected production in much of the agriculture industry (PC 2005). This was also a time of significant investment in the utilities sector, which is characterised by long and ‘lumpy’ investment cycles with capital-output lags similar to those in mining (Topp and Kulys 2012).
More broadly, it has been suggested that the impact of the reforms of the 1970s and 1980s themselves amounted to a level shift in productivity in the 1990s (Dolman 2009; Eslake 2011). Australia had fallen well behind other countries in terms of productivity and the reforms forced firms, and public sector providers, to ‘catch-up’. While some expected the higher growth rates of the period of catch-up to be permanent, logic suggests that rates of productivity growth would fall back to the rate at which advanced countries are expanding productivity at the frontier.
Unfortunately, productivity growth slowed in the developed countries well before the onset of the global financial crisis (GFC) in 2007, worsened during the GFC, and has only recently has begun to rebound (Fernald 2014a). Domestically, the GFC had the impact of reducing the utilisation of capital and labour as businesses waited for better conditions to return. Overall, the effect of the GFC on global productivity growth is likely still playing out, and it remains an active area of economic research (these issues are further explored below).
Over the productivity cycle from 2003-04 to 2007-08, measured MFP growth was, on average, zero and the LP growth that was observed in aggregate was entirely due to capital deepening (figure 4). Recent observations are, however, somewhat more encouraging. Since the beginning of the most recent (and incomplete) productivity cycle in 2007-08, average annual LP growth for the 12-industry market sector, at 2.2 per cent, is close to its long-term average of 2.3 per cent a year.3 Accelerating output from the mining sector
3 As measured by the 12-industry market sector. The long-term (30-year) average annual growth rate for the whole economy is 1.6 per cent. Trends in LP growth are similar regardless of the industry
13 PRODUCTIVITY REVIEW
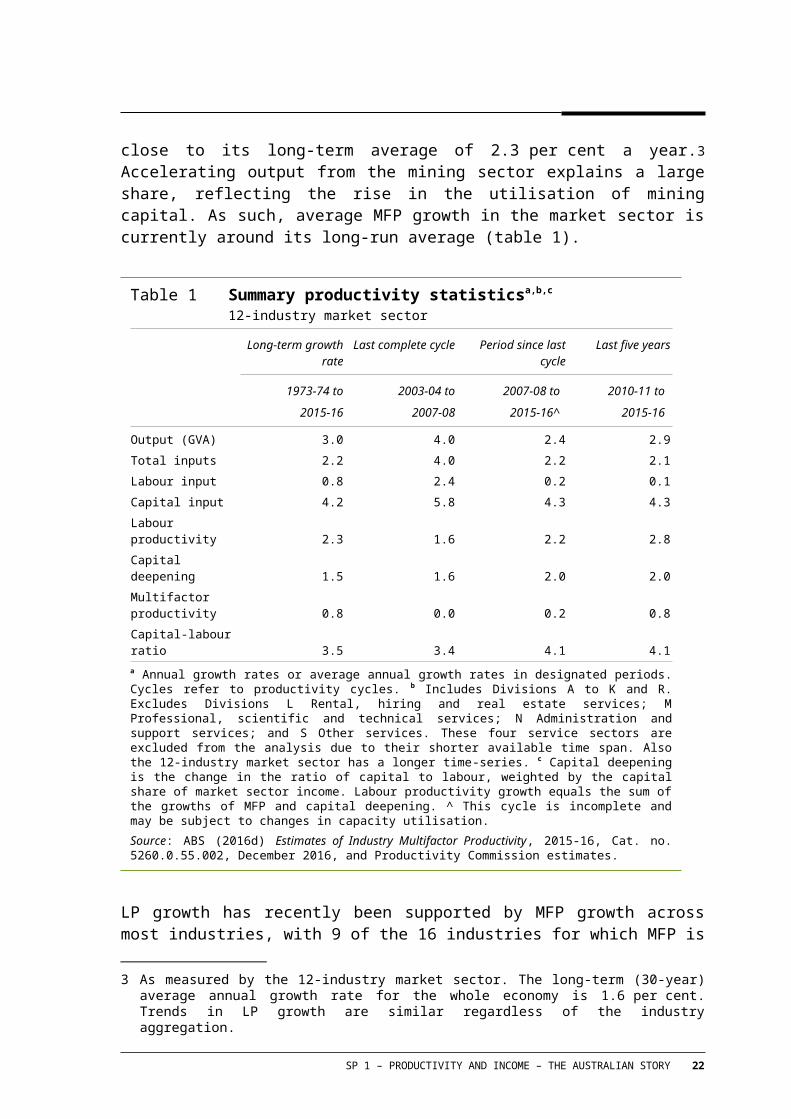
explains a large share, reflecting the rise in the utilisation of mining capital. As such, average MFP growth in the market sector is currently around its long-run average (table 1).
Table 1 Summary productivity statisticsa,b,c
12-industry market sector
Long-term growth rate
Last complete cycle
Period since last cycle
Last five years
1973-74 to2015-16
2003-04 to2007-08
2007-08 to2015-16^
2010-11 to2015-16
Output (GVA) 3.0 4.0 2.4 2.9Total inputs 2.2 4.0 2.2 2.1Labour input 0.8 2.4 0.2 0.1Capital input 4.2 5.8 4.3 4.3Labour productivity 2.3 1.6 2.2 2.8Capital deepening 1.5 1.6 2.0 2.0Multifactor productivity 0.8 0.0 0.2 0.8Capital-labour ratio 3.5 3.4 4.1 4.1a Annual growth rates or average annual growth rates in designated periods. Cycles refer to productivity cycles. b Includes Divisions A to K and R. Excludes Divisions L Rental, hiring and real estate services; M Professional, scientific and technical services; N Administration and support services; and S Other services. These four service sectors are excluded from the analysis due to their shorter available time span. Also the 12-industry market sector has a longer time-series. c Capital deepening is the change in the ratio of capital to labour, weighted by the capital share of market sector income. Labour productivity growth equals the sum of the growths of MFP and capital deepening. ^ This cycle is incomplete and may be subject to changes in capacity utilisation.
Source: ABS (2016d) Estimates of Industry Multifactor Productivity, 2015-16, Cat. no. 5260.0.55.002, December 2016, and Productivity Commission estimates.
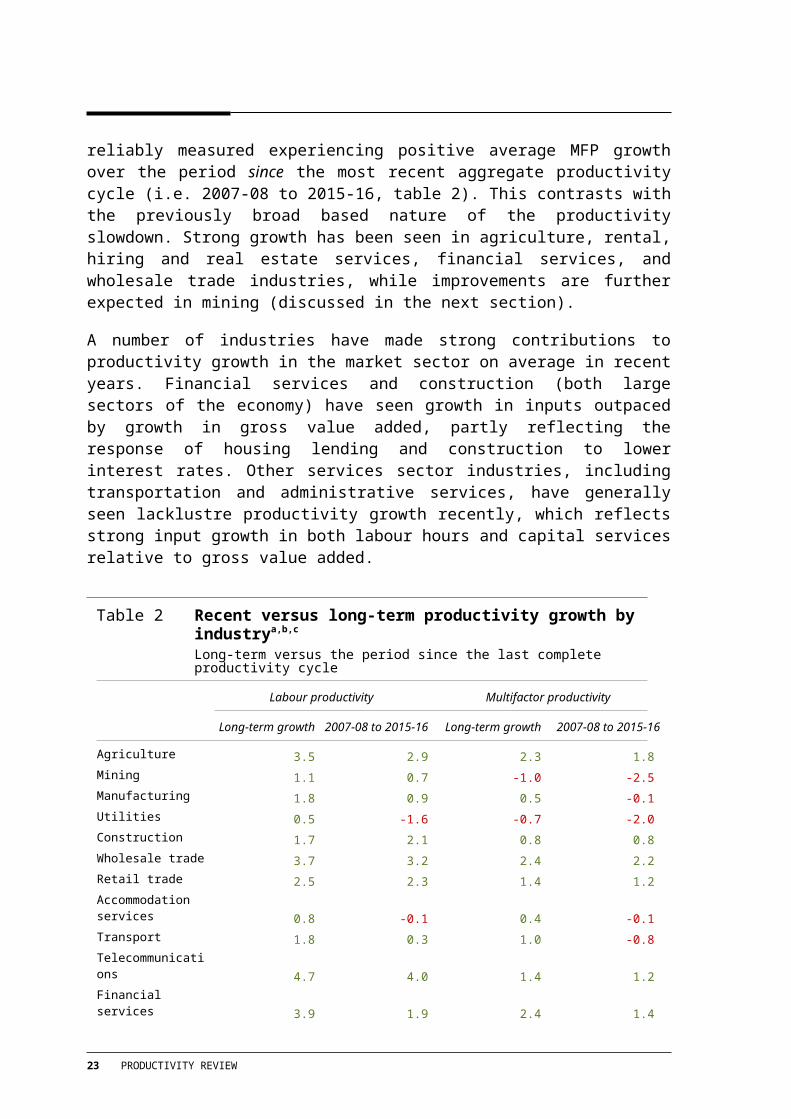
LP growth has recently been supported by MFP growth across most industries, with 9 of the 16 industries for which MFP is reliably measured experiencing positive average MFP growth over the period since the most recent aggregate productivity cycle (i.e. 2007-08 to 2015-16, table 2). This contrasts with the previously broad based nature of the productivity slowdown. Strong growth has been seen in agriculture, rental, hiring and real estate services, financial services, and wholesale trade industries, while improvements are further expected in mining (discussed in the next section).
A number of industries have made strong contributions to productivity growth in the market sector on average in recent years. Financial services and construction (both large sectors of the economy) have seen growth in inputs outpaced by growth in gross value added, partly reflecting the response of housing lending and construction to lower interest rates. Other services sector industries, including transportation and administrative services, have generally seen lacklustre productivity growth recently, which reflects strong input growth in both labour hours and capital services relative to gross value added.
aggregation.
SP 1 – PRODUCTIVITY AND INCOME – THE AUSTRALIAN STORY 14
Table 2 Recent versus long-term productivity growth by industrya,b,c
Long-term versus the period since the last complete productivity cycle
Labour productivity Multifactor productivity
Long-term growth 2007-08 to 2015-16 Long-term growth 2007-08 to 2015-16
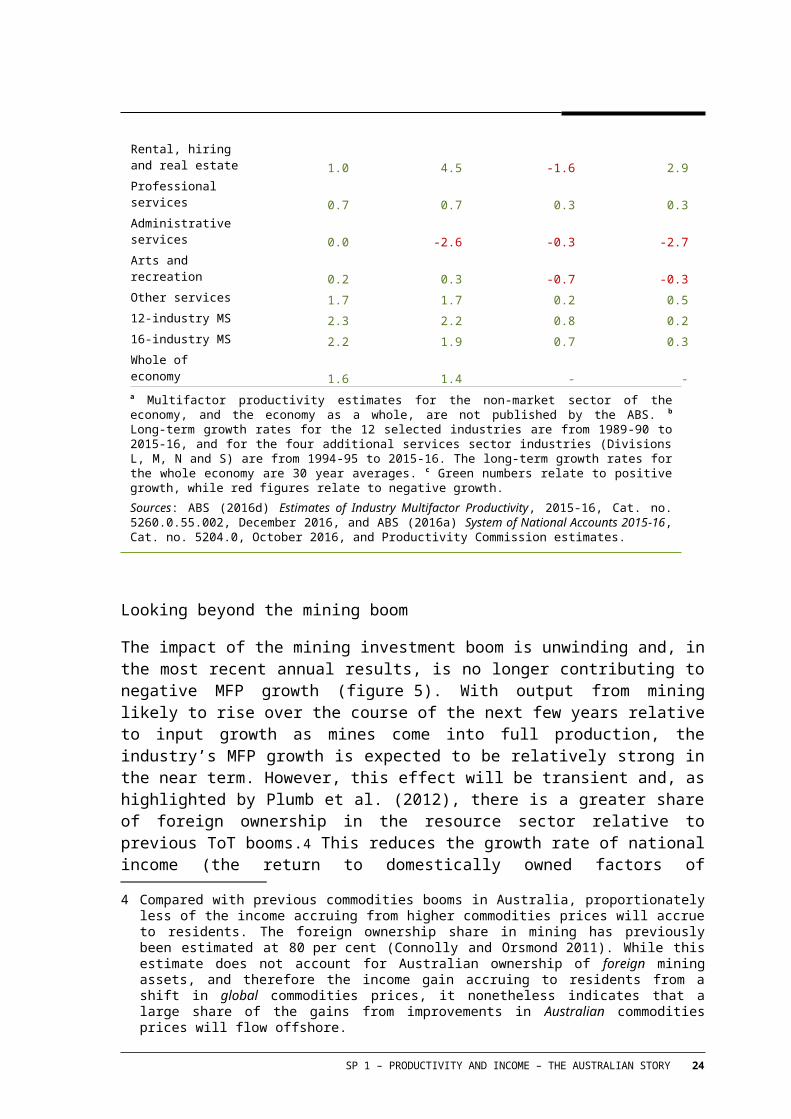
Agriculture 3.5 2.9 2.3 1.8Mining 1.1 0.7 -1.0 -2.5Manufacturing 1.8 0.9 0.5 -0.1Utilities 0.5 -1.6 -0.7 -2.0Construction 1.7 2.1 0.8 0.8Wholesale trade 3.7 3.2 2.4 2.2Retail trade 2.5 2.3 1.4 1.2Accommodation services 0.8 -0.1 0.4 -0.1Transport 1.8 0.3 1.0 -0.8Telecommunications 4.7 4.0 1.4 1.2Financial services 3.9 1.9 2.4 1.4Rental, hiring and real estate 1.0 4.5 -1.6 2.9Professional services 0.7 0.7 0.3 0.3Administrative services 0.0 -2.6 -0.3 -2.7Arts and recreation 0.2 0.3 -0.7 -0.3Other services 1.7 1.7 0.2 0.512-industry MS 2.3 2.2 0.8 0.216-industry MS 2.2 1.9 0.7 0.3Whole of economy 1.6 1.4 -a Multifactor productivity estimates for the non-market sector of the economy, and the economy as a whole, are not published by the ABS. b Long-term growth rates for the 12 selected industries are from 1989-90 to 2015-16, and for the four additional services sector industries (Divisions L, M, N and S) are from 1994-95 to 2015-16. The long-term growth rates for the whole economy are 30 year averages. c
Green numbers relate to positive growth, while red figures relate to negative growth.
Sources: ABS (2016d) Estimates of Industry Multifactor Productivity, 2015-16, Cat. no. 5260.0.55.002, December 2016, and ABS (2016a) System of National Accounts 2015-16, Cat. no. 5204.0, October 2016, and Productivity Commission estimates.
Looking beyond the mining boom
The impact of the mining investment boom is unwinding and, in the most recent annual results, is no longer contributing to negative MFP growth (figure 5). With output from mining likely to rise over the course of the next few years relative to input growth as mines come into full production, the industry’s MFP growth is expected to be relatively strong in the near term. However, this effect will be transient and, as highlighted by Plumb et al. (2012), there is a greater share of foreign ownership in the resource sector relative to
15 PRODUCTIVITY REVIEW
previous ToT booms.4 This reduces the growth rate of national income (the return to domestically owned factors of production) relative to that of GDP, as a large share of the return on mining flows back to the foreign owners of the capital. Similarly, while the responsiveness of investment to commodity prices remains as ever uncertain, the contribution from capital deepening to overall LP growth will eventually fall.
Figure 5 Industry contributions to LP growtha,b
LP decomposed into MFP and capital deepening (K/L)
-1.5
-1.0
-0.5
0.0
0.5
1.0
1.5
2.0
2.5
3.0
3.5
1999-00 2003-04 2007-08 2011-12 2015-16
Per
cent
Mining MFP Mining K/L Non-mining K/L Non-mining MFP LP
a Based on the 16-industry market sector (Divisions A to N, R and S). MFP includes a contribution from human capital development (‘labour composition’). b Growth rates are estimated as 5-year weighted moving averages, so will not align with ABS annual estimates.
Source: ABS (2016d), Estimates of Industry Multifactor Productivity, 2015-16, Cat. no. 5260.0.55.002, December 2016, and Productivity Commission estimates.
As the total contribution of mining to LP growth continues to revert toward a historical norm, LP growth will again be determined predominantly by the non-mining sector (the sum of the blue columns in figure 5). While non-mining MFP growth has recently improved somewhat, the contribution from non-mining capital deepening remains notably below its observable average, having roughly halved since the turn of the century. Were this to continue, the outlook for LP growth, and therefore growth in incomes, would also be lower than what people have recently become accustomed to.
4 Compared with previous commodities booms in Australia, proportionately less of the income accruing from higher commodities prices will accrue to residents. The foreign ownership share in mining has previously been estimated at 80 per cent (Connolly and Orsmond 2011). While this estimate does not account for Australian ownership of foreign mining assets, and therefore the income gain accruing to residents from a shift in global commodities prices, it nonetheless indicates that a large share of the gains from improvements in Australian commodities prices will flow offshore.
SP 1 – PRODUCTIVITY AND INCOME – THE AUSTRALIAN STORY 16
CONCLUSION 1.3
Periods of sluggish productivity growth have been observed in Australia in the past, leading to sustained periods of weak income growth. It is likely that the contributions to income growth of past major reforms and the mining investment boom are largely behind us. Looking ahead, it is growth in the non-mining sector that will largely determine prospects for income growth.
Capital investment
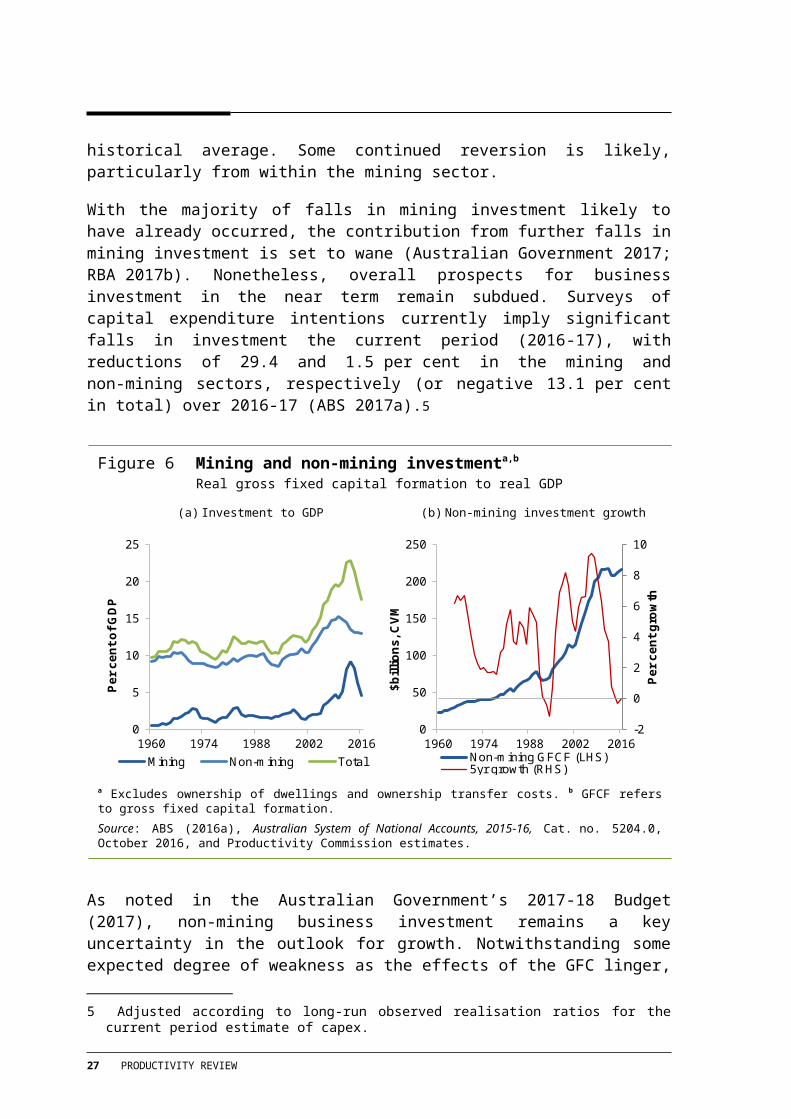
The picture of business investment in Australia over the past 15 years is striking. Total business investment (that is, excluding housing investment), rose to almost 23 per cent of real GDP in 2012-13 (figure 6, panel a). This increase was overwhelmingly driven by mining. However, growth in investment also occurred in mining-related industries (reflecting additional demand for services and other inputs to the mining industry itself). As mentioned above, industries like manufacturing also took advantage of a high exchange rate to import capital goods. Overall investment in the non-mining sector rose from 10 to 15 per cent of real GDP from the start of the boom in 2002 until the GFC in 2008.
While the recent fall in investment is again being driven predominantly by the mining industry, it is notable that non-mining investment has been falling as a proportion of GDP, and there has not been significant growth in volume terms since 2009-10 (figure 6, panel b). This amounts to the most prolonged stagnation in non-mining investment activity in recent history, with sustained falls in growth only matched during the 1990s recession. Part of this reflects the unwinding of the previously strong exchange rate and weakness in business conditions in the resource-rich states of Queensland and Western Australia (RBA 2017b). However, it remains notable that rates of investment have, on average, fallen in the other states relative to what they were prior to the GFC. To the extent that non-mining investment was linked to the mining boom itself, some further weakness could be expected. Overall, business investment as a proportion of GDP is coming off record highs, and remains well above its historical average. Some continued reversion is likely, particularly from within the mining sector.
With the majority of falls in mining investment likely to have already occurred, the contribution from further falls in mining investment is set to wane (Australian Government 2017; RBA 2017b). Nonetheless, overall prospects for business investment in the near term remain subdued. Surveys of capital expenditure intentions currently imply significant falls in investment the current period (2016-17), with reductions of 29.4 and 1.5 per cent in the mining and non-mining sectors, respectively (or negative 13.1 per cent in total) over 2016-17 (ABS 2017a).5
5 Adjusted according to long-run observed realisation ratios for the current period estimate of capex.
17 PRODUCTIVITY REVIEW
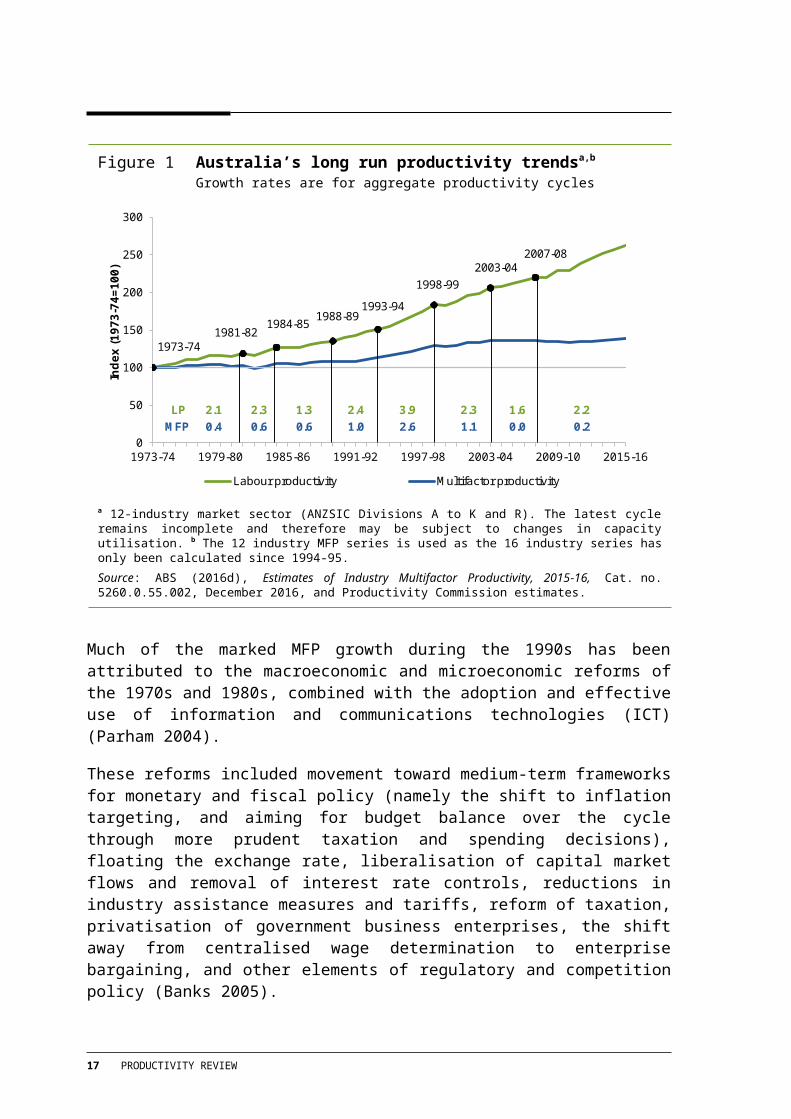
Figure 6 Mining and non-mining investmenta,b
Real gross fixed capital formation to real GDP
(a) Investment to GDP (b) Non-mining investment growth
0
5
10
15
20
25
1960 1974 1988 2002 2016
Per c
ent o
f GD
P
Mining Non-mining Total
-2
0
2
4
6
8
10
0
50
100
150
200
250
1960 1974 1988 2002 2016
Per c
ent g
row
th
$bill
ions
, CVM
Non-mining GFCF (LHS)5yr growth (RHS)
a Excludes ownership of dwellings and ownership transfer costs. b GFCF refers to gross fixed capital formation.
Source: ABS (2016a), Australian System of National Accounts, 2015-16, Cat. no. 5204.0, October 2016, and Productivity Commission estimates.
As noted in the Australian Government’s 2017-18 Budget (2017), non-mining business investment remains a key uncertainty in the outlook for growth. Notwithstanding some expected degree of weakness as the effects of the GFC linger, and the downside of the mining boom, the muted responsiveness of business investment to improved business conditions and lower interest rates remains somewhat of a puzzle. Indicators of business confidence and conditions, and capacity utilisation have generally been above average in recent years. Such indicators of business sentiment can be seen as necessary but insufficient conditions for investment.6 As noted by Kent (2014), among others, ‘hurdle’ rates of return required for investments to go ahead have neither increased nor decreased in recent years, despite significant falls in interest rates and hence in businesses’ weighted average cost of capital. A growing gap between the hurdle rates and the average cost of capital implies a reduction in businesses’ appetite for risk. This suggests businesses are likely to be waiting for improved demand conditions (and the accompanying output price growth it brings), before significant new investments are made.
One way of assessing prospects for investment is to contrast industries’ observed investment rates (the ratio of new investment to the industry capital stock) with the sum of industry specific depreciation rates and output growth. That is, the overall rate of investment in an industry should broadly account for depreciation of existing assets, and the rate of growth in that industry to keep up with competitors. While this relationship
6 See Lane and Rosewall (2015) for a discussion of these indicators, how different businesses interpret surveys, and what this may imply for overall investment.
SP 1 – PRODUCTIVITY AND INCOME – THE AUSTRALIAN STORY 18
ought not correlate perfectly in the short run, it provides an indication of any significant deviation in aggregate investment activity from an implied trend.7 On this basis, current investment positions indicate that demand conditions may currently be insufficient to spur additional investment (figure 7). This implies limited scope for a turnaround in the near term. Notwithstanding some encouraging recent quarterly investment results in the non-mining sector, when current investment intentions are scaled conservatively, they imply an investment shortfall relative to what would otherwise be required to return to projected average rates of economic growth over five years.8
There are other structural explanations for subdued investment activity. One is that the composition of the economy is changing toward sectors that are less capital intensive in production, namely services sectors, which are more reliant on skilled labour. To the extent that the economy continues to shift toward services, it could imply structural reductions in overall rates of capital investment relative to GDP (Elias and Evans 2014). These industries also tend to invest more in intangible capital, such as research and development and software, which have relatively higher rates of depreciation than physical capital assets.
Following work by Corrado, Hulten and Sichel (2005, 2006), there is also evidence that measured capital investment in national account collections fails to account for many forms of intangibles investment, such as computerised information, brand equity and organisational capital, which ultimately affect businesses’ productivity and output. Studies estimating intangible capital in Australia have found that it is significant. Barnes and McClure (2009) estimated that intangible investment was almost half the size of tangible investment in the market sector of the Australian economy; that 80 per cent of such investment is not treated as investment in the national accounts; and that average annual growth in intangible investment was about 1.3 times that of tangibles since 1974-75.
7 Analysis of trend versus actual investment positions provides a picture of where current rates of investment are, compared with a theoretical benchmark, and is indicative only. That actual and trend investment should track each other over time assumes that the ratio of the capital stock to output is constant, and that investment will account for the rate of economic growth in a given industry and the rate of depreciation on currently held assets.
8 Indicative estimates of this shortfall are about $40 billion in 2016-17. This is based on a projection framework that assumes a return, over the five years from 2015-16, to the productivity and output growth rates witnessed on average over the last 30 years. It assumes reversion to a constant aggregate capital-output ratio, and allows investment (gross fixed capital formation) to fall out as a slack variable from a projection of the implied aggregate net capital stock. It assumes constant depreciation at the rates observed in 2015-16. The implied shortfall in 2016-17 is based on a conservative scaling of the ratio of whole of economy investment to that implied by the capex survey, acknowledging that some reversion of its industry coverage is likely in the years ahead.
19 PRODUCTIVITY REVIEW
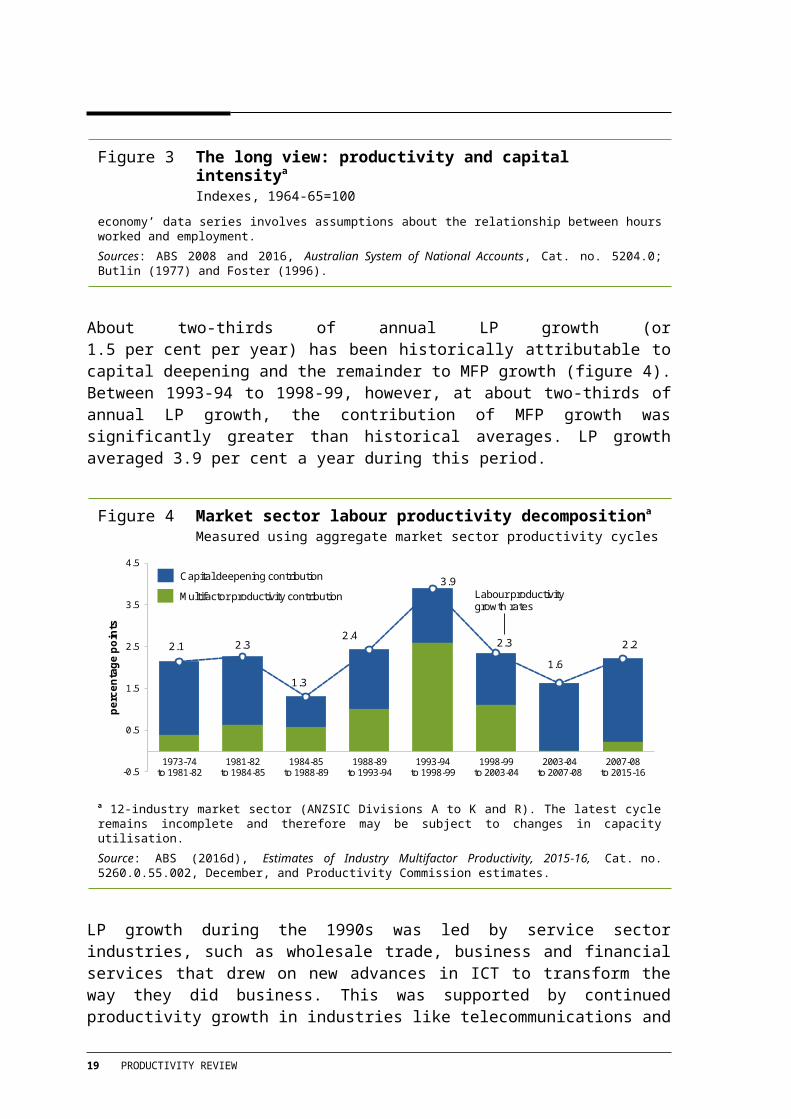
Figure 7 Trend vs. actual capital investment positionsa
Mining Non-mining
0.00
0.05
0.10
0.15
0.20
0.25
1991 1996 2001 2006 2011 2016
Rat
io
δ+g I/K
0.00
0.05
0.10
0.15
0.20
0.25
1991 1996 2001 2006 2011 2016R
atio
δ+g I/K
a Trend investment (green lines) are the summation of real industry specific depreciation rates (δ) and smoothed real GVA growth (g). GVA is smoothed using a HP-filter (λ=50). Actual investment (blue lines) are the ratio of industry real gross fixed capital formation to industry net capital stocks.
Source: ABS (2016a), Australian System of National Accounts, 2015-16, Cat. no. 5204.0, December 2016, and Productivity Commission estimates.
Updates to this work generally find that the ratio of intangible to tangible investment has fallen somewhat since the early to mid-2000s. Elnasri and Fox (2014) found that the ratio of intangibles to tangibles increased continuously from 0.29 in 1974-75 to 0.53 in 2004-05; however, it decreased to 0.38 by 2012-13. Bucifal and Bulic (2016) also found that the ratio of organisational capital stock to aggregate machinery and equipment capital stock peaked around the early 2000s and subsequently declined to 2012-13. These results suggest that intangible investment is underpinned by technological disruption in a complementary way. This is consistent with theories suggesting that the productivity potential of ICT is only realised when matched by complementary organisational and managerial changes (OECD 2013).
However, this is not to suggest that the importance of intangibles has decreased over time. Elnasri and Fox (2014) found that between 1974-75 and 2012-13, the total stock of intangibles grew at an average annual growth rate of 5 per cent, while the real tangible capital stock over the same period grew at an average annual growth rate of 3 per cent. Intangible investment increased in importance relative to tangible investment over this period. The percentage of intangible capital in total capital grew from 9 per cent in 1974-75 to 14 per cent in 2012-13, about 55 per cent of which is currently accounted for in the national accounts. Bucifal and Bulic (2016) also suggest that organisational capital investment in the Australian market sector as a whole is sizable and growing at above the rate of investment in tangible capital (machinery and equipment). Furthermore, given the aggregate nature of these studies, aggregate tangible investment figures are significantly
SP 1 – PRODUCTIVITY AND INCOME – THE AUSTRALIAN STORY 20
influenced by the extraordinary rates of mining investment over the same period, suggesting that the importance of intangible investment at a sectoral level is likely to be understated.
Looking forward, continued capital investment is crucial to realising economic growth. As one indicator, the cumulative real value of (whole of economy) investment required from 2016-17 to 2059-60 is about $40 trillion (in real terms). This is roughly four times the real value of investment made in the preceding comparable period between 1969-70 and 2015-16.9 The size of this investment emphasises the importance of policy settings conducive to prudent investment in both the public and private sectors.
CONCLUSION 1.4
Current rates of investment are likely to be driven partly by cyclical factors. However, industry structural change toward (less capital intensive) services industries, weak growth in demand (and with this little pressure on output prices), changes in the investment choices of businesses themselves, and enduring perceptions of risk from the GFC are also likely to be affecting the rates of measured capital investment. Thus, while rates of investment should ultimately adjust somewhat and help support output and LP growth, the adjustment period may continue for some time.
The impact of structural change on productivity
Structural change, or the change in industry composition over time, can affect productivity growth, depending on the distribution of resources in the economy and the level of productivity in each industry. As noted above, Australia has seen a long-term shift of economic activity toward more labour-intensive service sectors, which on average have a lower level of productivity (figure 8).
With the end of the investment boom in mining, labour has begun shifting back to industries that have lower levels of productivity. This compositional change towards more labour-intensive industries is likely to reduce LP growth during the adjustment period. Looking longer term, shifts in industry composition are a major factor influencing the Commission’s current modelling reference case, which projects that the contribution from aggregate LP to real GDP growth to 2059-60 will be lower, at 1.3 percentage points on average, than the historical average from 1974-75 to 2013-14 of 1.7 percentage points (Gabbitas and Salma 2016).10
9 Based on the projection framework described in footnote 7 above.10 It is worth noting that historical average rates of productivity growth capture a period in which a number
of large one-off productivity enhancing reforms clearly influenced measured productivity growth at the industry level. It is difficult to explicitly quantify the impact these reforms had at an industry level. If, having moved closer to the frontier, Australia’s relative position has remained constant, the level shift in productivity that such reforms delivered is unlikely to be repeated.
21 PRODUCTIVITY REVIEW
Figure 8 Shares of nominal outputa
1974-75 to 2015-16
0.65
0.70
0.75
0.80
0.85
0.90
0.00
0.05
0.10
0.15
0.20
0.25
1974-75 1979-80 1984-85 1989-90 1994-95 1999-00 2004-05 2009-10 2014-15
Prop
ortio
n of
nom
inal
GVA
Prop
ortio
n of
nom
inal
GVA
Agriculture (LHS) Mining (LHS) Manufacturing (LHS) Services (RHS)
a Shares prior to 1989-90 have been backcast.
Sources: ABS (2016a), Australian System of National Accounts, 2015-16, Cat. no. 5204.0, December 2016, and PC VUMR Modelling Reference case, 2009-10 to 2059-60 (Gabbitas and Salma 2016).
This lower projected contribution primarily reflects compositional change in the structure of the economy, namely a continuation of the long-term trend away from industries in the traded-goods sector, which have higher measured LP, towards those in the less capital-intensive non-traded service sector, which have lower measured LP.11 Thus, over time, industries with lower measured LP growth account for more economic activity. This trend is seen across the developed economies as the share of services rises, and partially explains the decline in the rate of investment as less capital is used per unit of output.
CONCLUSION 1.5
Continued compositional changes toward lower productivity services industries in Australia is projected to detract from long-run labour productivity growth in future.
11 Industries that have a higher capital to labour ratio need a higher level of LP to remain profitable, as they have to fund their capital. Hence, the level of LP reflects capital intensity, and is neither inherently good nor bad. This is why the focus is on the growth of LP, and more generally why MFP is a better measure of productivity.
SP 1 – PRODUCTIVITY AND INCOME – THE AUSTRALIAN STORY 22
Where does Australia’s productivity stand internationally?
As a small open economy and net importer of technology and other innovation, Australia’s productivity growth has been strongly influenced by international developments.12 Aside from instances where Australian industries are global leaders (such as in mining), it is technological progress in other countries that largely determines Australia’s potential productivity — that is, it sets the frontier for Australian firms and industries. Given this, Australia’s position relative to international peers tells us how much higher our productivity could be if we get our policy and business settings right.
This section considers Australia’s productivity performance relative to the international frontier, both in aggregate and at the industry level. It concludes that Australian productivity largely follows the broad trends in productivity growth at the frontier observed across comparable countries.
The international productivity frontier
Frontier analysis is a way of identifying and comparing performance against the most productive countries or industries internationally. Businesses in countries behind the frontier can seek to catch up by emulating practices of the best-performing businesses in their own country or in other countries, or at least move with the frontier as it shifts outwards. The United States has long been considered a reasonable proxy for the international productivity frontier, as it has consistently had one of the highest levels of aggregate labour productivity in the world.13 It is also a desirable comparator for Australia due to its institutional and cultural similarity and its similar industrial composition.14
Australia underwent a sustained period of catch up to the international frontier in the post-war era (even though this process was less rapid than in some other countries). As depicted in figure 9, from the early 1950s to the late 1970s, the ratio of Australian to US labour productivity rose from around 70 to 80 per cent. Strong labour productivity growth among advanced economies over this period has been attributed to the use of technologies not fully exploited during the Great Depression and World War II, and economies becoming open to trade, investment and diffusion of technology (Maddison 2001).
In the 35 years since, this ratio has fluctuated around 80 per cent, within a band of a few percentage points. In this period, there have been three distinct periods of rise in the ratio — the late 1970s to early 1980s, the early 1990s to 2000, and the most recent few years to 2017 (figure 9).
12 There are reasons, such as distance from markets and the small size of our domestic market, which mean that Australia is unlikely to be able to be at the frontier of every industry.
13 Other countries with higher measured labour productivity tend to have skewed industrial compositions (e.g. oil production in Norway).
14 Comparison of countries that are compositionally similar implies less of a role for allocative efficiency gains through resource redistribution, and more of a role for technological progress within industries in driving further relative productivity gains. GGDC KLEMS data generally indicate a high correlation between industrial compositions in Australia and the United States. Other countries that have similarly high correlations tend to have lower labour productivity levels (e.g. the United Kingdom).
23 PRODUCTIVITY REVIEW
The rise in the early 1990s to 2000 has generally been attributed to the structural reforms implemented in Australia over the 1980s and 1990s, combined with the adoption and diffusion of new ICTs in Australia. During this period, US productivity growth was quite strong, but Australia’s was even stronger, implying this was a period when Australia underwent a period of technological ‘catch up’.
However, there are limits to how much can be inferred from aggregate frontier analysis, particularly in the short run, as it reflects changes in both US and Australian LP growth, including over business cycles that are not necessarily aligned across countries. For instance, the most recent period of relative catch up has coincided with weaker growth in US productivity, itself a byproduct of strong growth in hours worked driven by a cyclical recovery in employment post the GFC. This does not represent an improvement in Australia’s underlying progress.
Figure 9 Australia’s productivity relative to the frontiera
Ratio of aggregate Australian to US labour productivity levels
0.65
0.70
0.75
0.80
0.85
0.90
1950 1961 1972 1983 1994 2005 2016
Annual 5yr moving average
a GDP per hour worked, in millions of 2016 US$ (using 2011 EKS PPPs).
Source: The Conference Board (2017) Total Economy Database, May 2017.
What is the scope for catch up?
Past studies have attributed a large part of the persistent productivity gap of around 20 percentage points to differences in historical and geographic circumstances. These include Australia’s large and sparsely populated land mass and geographic distance from the global centres of trade, which limit opportunities to specialise and to access economies of scale. Battersby (2006), for example, suggests that these factors could explain around
SP 1 – PRODUCTIVITY AND INCOME – THE AUSTRALIAN STORY 24
40 per cent of the observed gap in productivity. By their nature, the effect of these factors is unlikely to change materially over time.
Dolman, Parham and Zheng (2007) noted that differences in industry composition appear to explain little of the observed difference in aggregate productivity levels between Australia and the United States.15 It is therefore instructive to compare industry productivity levels, and to analyse international trends in MFP.
Using the US as a benchmark, international data at the industry level imply a large spread of industry performance, implying that there is likely to be scope for advances in several Australian industries that remain at some distance from international best practice (figure 10).16
More detailed industry-level data are unavailable, but data presented in figure 10 nonetheless suggests there may be scope for technological catch up, particularly in areas of telecommunications, distribution activities, wholesale and retail trade, and transport. This result mirrors analysis by the IMF (2015), which highlighted that improvements to Australia’s ‘distribution’ sector, covering transport and domestic trade, could generate significant gains by moving to international best practice.
Although some Australian industries, notably mining, are among the most productive internationally, the evidence suggests that there is likely to be scope for catch-up among others. However, attaining the US aggregate labour productivity level is an unrealistic ambition. In the long run, and in many industries, Australia’s prospects for productivity growth will be determined by advances in technology at the frontier (be that in the United States, Australia, or elsewhere) and its diffusion. There is also a clear role for policy in enabling businesses and industries to become more productive by removing regulatory impediments and incentivising more efficient resource use.
15 They note that Australia’s industry composition is similar to that of the US, and to the extent that there are differences, they offset each other. For example, Australia had a larger share of employment in some below average productivity industries such as agriculture and construction, but this was offset by its larger share of employment in industries like mining. This point is also made in Davis and Rahman (2006).
16 While these data are dated, they provide indicative evidence of whether, and to what extent, Australia may be able to improve its performance relative to the frontier.
25 PRODUCTIVITY REVIEW
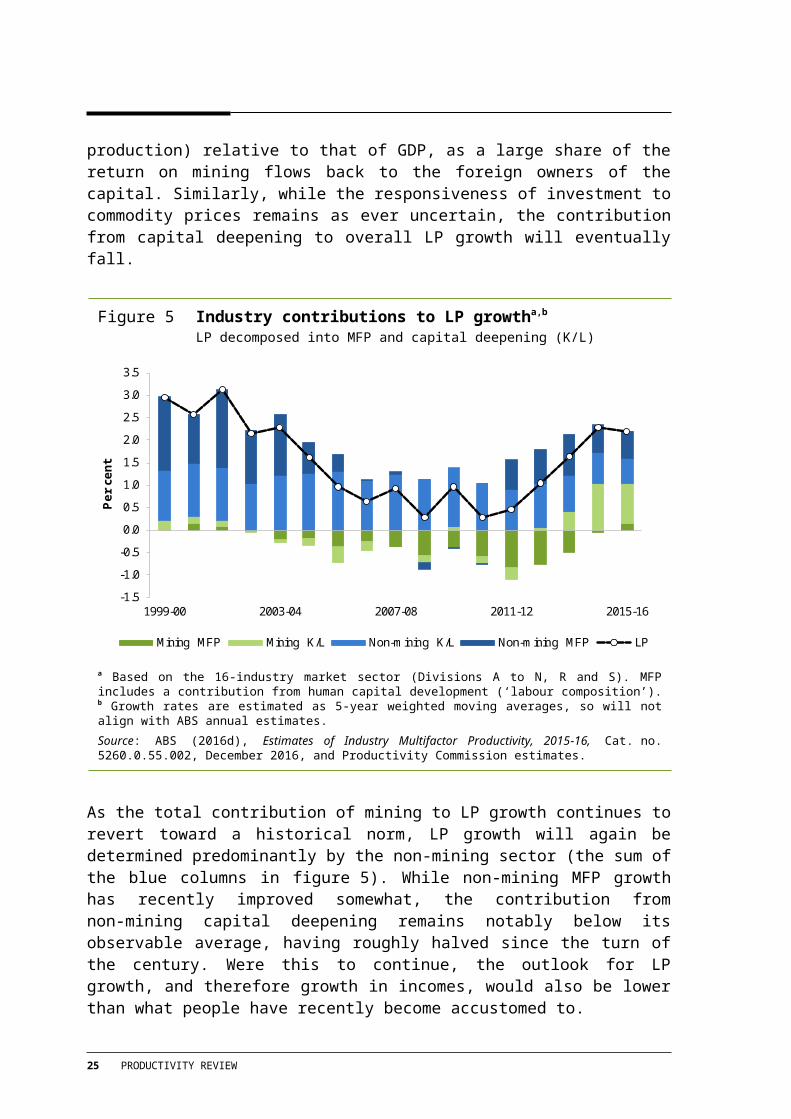
Figure 10 Industry MFP levels relative to the United Statesa,b
Average MFP levels between 1997 and 2005 (ratios to US=1)
0.0
0.5
1.0
1.5
2.0
2.5
Rel
ativ
e M
FP le
vels
(USA
=1)
Frontier Australia
USA USA USA
SWE
GER
AUS
NLD DNK
NLD
AUS
a Classification based on the 10-sector ISIC. Market sector aggregate excludes public administration, education and health. Telecomms includes electrical and optical equipment, post and telecommunications. Other production includes mining, utilities, construction and agriculture. USA industry data is based on the NAICS. b USA = United States, SWE = Sweden, GER = Germany, AUS = Australia, NLD = Netherlands, DNK = Denmark.
Sources: GGDC EU-KLEMS Benchmark 1997 matched with the 2005 extrapolation, from Inklaar and Timmer (2009).
Has expansion in the international frontier slowed down?
Growth in MFP is a reasonable proxy for technological progress over long periods of time.17 Australia has not been alone in experiencing a MFP slowdown. As noted in PC (2016b), negative rates of MFP growth have been observed across a number of advanced economies in the post-GFC period. For some economies, this may reflect a process of recovering from the GFC. While the effect of the GFC on productivity growth has been notable, there are nascent signs of a rebound (table 3). The extent of this rebound indicates that a large portion of the slowdown experienced over the late 2000s is likely to have been driven by lower rates of capacity utilisation during that period.
17 MFP growth will also reflect changes in the real cost of production, which is affected both by the rate of technical progress, and changes in quality of any unpriced (natural resource) inputs.
SP 1 – PRODUCTIVITY AND INCOME – THE AUSTRALIAN STORY 26
Table 3 MFP growth for selected advanced countriesa
Average annual growth rates
Period average growth rates Percentage point changes in growth rates
2000–05 2005–10 2010–16 2000–05 to 2005–10 2005–10 to 2010–16
Canada 0.00 -0.90 0.13 -0.91 1.03United States 1.16 -0.04 0.02 -1.20 0.06Australia 0.04 -0.81 -0.01 -0.85 0.80Japan -0.15 -0.49 0.22 -0.34 0.71Denmark 0.28 -0.70 0.15 -0.98 0.85Finland 0.89 -0.66 -0.57 -1.54 0.08France 0.22 -0.56 -0.08 -0.78 0.48Germany 0.01 -0.16 0.52 -0.17 0.68Italy -0.75 -1.13 -0.28 -0.38 0.86Netherlands 0.15 -0.26 0.16 -0.40 0.41Sweden 1.38 -0.36 0.33 -1.74 0.70United Kingdom 1.19 -0.72 0.10 -1.91 0.82
a MFP growth estimated as a Tornqvist index. Output is in millions of 2016 US$ (converted to 2016 price level with updated 2011 EKS PPPs). Green numbers relate to positive figures, red numbers relate to negative figures.
Sources: The Conference Board (2017) Total Economy Database, May 2017.
In addition to the common pattern across advanced economies, the slowdown predates the GFC, implying that it is not a purely cyclical phenomenon. Across the OECD, with the exception of Australia, LP growth was lower in the decade to 2017 than in any decade from 1950.18
The fall in productivity growth among advanced economies, including Australia, is observable over several decades (Bergeaud, Cette and Lecat 2016; Carmody 2013). Even accounting for the impact of the GFC, and differential capital intensities of different economies, the rate of expansion in the international technological frontier (as measured by MFP growth) has been notably slower in recent years than in preceding decades (figure 11). The low, zero, or indeed negative rates of MFP growth observed across countries in recent years represents something of a puzzle, because it implies that, at least in aggregate, these economies have not become any more efficient, or may have become less efficient in producing output. This is notwithstanding significant technological changes — especially in areas that exploit information technologies — such as mobile technologies, machine learning, and artificial intelligence (chapter 1 in the main report).19 This raises questions about the pace of global technological change — a concern for Australia given our reliance on others’ technological advances.
18 Based on data from the Conference Board Total Economy Database (adjusted version), May 2017 for the 22 OECD countries where there is a full record of GDP per hour (in PPP terms) from 1950 to 2017.
19 Obtaining a grasp on the diffusion of such technologies is difficult. One indicator is the number of internet searches for products and services that embody such technologies. As an illustration, the rise in internet searches for Hadoop, a program often used for machine learning rose spectacularly from June 2004 to June 2017 (based on PC analysis of data from Google Trends).
27 PRODUCTIVITY REVIEW
A number of ideas have been put forward as potential reasons for the observed secular slowdown. These are explored in section 3.
Figure 11 MFP productivity growth in advanced economiesa
HP-filtered annual growth
-1
0
1
2
3
4
5
6
1955 1965 1975 1985 1995 2005 2015
Per c
ent
BEL ITL GERFRA NLD JAP
-1
0
1
2
3
4
5
6
1955 1965 1975 1985 1995 2005 2015Pe
r cen
t
USA CAN GRBDNK SWE AUS
a Converted to US price levels with 2010 $USD PPPs. Data are filtered using a Hodrick-Prescott smoothing parameter of λ=500 in line with Bergeaud, Cette, and Lecat (2016).
Source: Long Term Productivity Database from Bergeaud, Cette, and Lecat (2016).
CONCLUSION 1.6
Notwithstanding some recent improvements in productivity growth internationally, advanced economies globally have seen a slowdown in productivity growth dating back to before the global financial crisis. While this may partly reflect a number of structural factors, there remains scope for Australian businesses and industries to leverage international best practice to move closer to the productivity frontier for their industry.
3 Explanations for the productivity slowdownThis section summarises the predominant explanations for the observed slowdown in productivity growth internationally.
Measurement issues
There has been some recent debate over whether measurement issues can explain at least a part of the observed productivity slowdown. If national accounts frameworks used to measure real output fail to adequately capture output attributable to new products and technologies that have emerged since the turn of the century, such as cloud computing and other digital services, then this could explain at least some of the measured slowdown.
SP 1 – PRODUCTIVITY AND INCOME – THE AUSTRALIAN STORY 28
There are two possible explanations. The first is that an increasingly smaller share of the utility these products provide is embodied in their prices (that is consumer surplus is rising, and this is not captured in national accounts). The second, and related, explanation is that the price deflators used for these goods do not adequately reflect improvements in their quality, so output measures understate quantity growth as they are derived from nominal sales data adjusted for the effect of changes in prices (which are typically falling).
However, there is a growing body of evidence that measurement issues are not able to explain the full extent of the slowdown (Albrizio and Nicoletti 2017). For example, Bryne et al. (2016) found no evidence that such errors have worsened since the 1990s. Syverson (2016) suggests there is reasonable prima facie argument, based on the timing and scale of observed effects, that much of the slowdown is indeed real, as opposed to a byproduct of mismeasurement.
There is also a question as to whether measurement issues matter in the context of national accounts collections given that many of the digital services driving consumer benefits (like map services in smartphones, or vehicle sharing schemes) pertain to the use of non-market time or resources. Even if consumer surplus is rising, the gain is in the household sector of the economy, rather than in measured production. Another potential explanation (explored further below) is that it may simply take time for new technologies to translate into measurable productivity improvements. If this is true, it would take time for output growth to respond to large and swift technological changes such as has occurred in the last decade or so, as businesses need time to assess risks, develop complementary processes and develop human capital to take advantage of them. This is not a measurement problem, and suggests that it is the rate at which (and how) technologies diffuse through an economy that should be of interest to policy makers.
That said, the importance of measurement issues to productivity statistics will likely grow on account of continued shifts in economic activity toward sectors of the economy where the measurement of real output is more problematic, namely the non-market and services sectors. These sectors both make more intensive use of intangible capital in production and produce more intangible outputs, on average. Accordingly, the ABS is working to improve several aspects of non-market sector productivity measurement (supporting paper 2).
Technology diffusion between frontier and non-frontier firms
The diffusion of new technologies and business practices from the most productive firms globally to the most advanced firms nationally, and then on to other domestic firms, is a key source of productivity growth (Conway 2016; OECD 2015). As identified in the Commission’s inquiry into Business Set-up, Transfer and Closure, the uptake of previously introduced goods, services and processes facilitates the diffusion of new ideas and efficient business practices across the economy (PC 2015a). However, the diffusion of innovations at the global frontier to domestic economies by national frontier firms, and onwards within a country to non-frontier firms, does not happen immediately, nor in fact, inevitably. (OECD 2015). This is important, because as the OECD notes, ‘ … future growth will
29 PRODUCTIVITY REVIEW
depend on harnessing the forces of knowledge diffusion, which propelled productivity growth for much of the 20th century’ (OECD 2015).
Internationally, frontier firms are those firms that are the most productive firms in their industry year by year. Domestic frontier firms, the most productive firms by industry, adapt global frontier technologies to the specific circumstances of their country, and these are subsequently diffused throughout the local economy. Frontier firms are typically: larger; more profitable; more likely to be part of a multinational group; more capital-intensive; patent more intensively; and younger (although they are getting older) (Andrews, Criscuolo and Gal 2015).
Some recent microeconomic analysis suggests that the way in which frontier and non-frontier firms interact may have changed. Evidence at the firm level suggests that productivity growth among international frontier firms has remained robust through the 21st century, while that for other firms has generally been low (Andrews and Criscuolo 2015). This raises questions about the availability of technologies and knowledge developed at the frontier to other firms, as well as the effectiveness of firms in adopting new technologies.20
The OECD posits that the recent productivity slowdown reflects a slowing of the pace at which innovations spread throughout the economy. They describe this as a ‘breakdown of the diffusion machine’, which has seen the gap between high productivity firms and the rest increasing over time (OECD 2015). This is problematic in the sense that such a ‘breakdown’ could imply a growing tail of relatively poorly performing firms, which would have direct implications for aggregate productivity growth, and may also exacerbate inequality to the extent that a growing proportion of workers may see only marginal productivity improvements, and therefore low wage growth. The OECD also find that the growing dispersion of wages appears related to the dispersion of productivity itself, with workers in high productivity firms receiving higher wages (a finding that holds over all industries).
There is other compelling evidence that a significant share of Australian businesses have poor management practices, and while this is true for all countries, Australia lags behind the leading countries (figure 12).
20 The precise extent of this effect is not actually clear from the Andrews and Criscuolo analysis. Firms tend not to stay at the global frontier. In fact, only about half of global frontier firms remain at the global frontier from one year to the next and less than 20 per cent of firms remain at the global frontier after 5 years. The authors estimate the frontier as the top 5 per cent of firms by productivity level within each industry and each year. This enables ‘churn’ of firms into and out of the frontier group. The observed divergence of frontier versus non-frontier firms could be overstated depending on the underlying distribution of firm productivity levels and/or the pace at which individual firms transition into or out of the frontier group, as well as managerial decisions (such as to reduce capacity utilisation during a period of poor demand conditions).
SP 1 – PRODUCTIVITY AND INCOME – THE AUSTRALIAN STORY 30
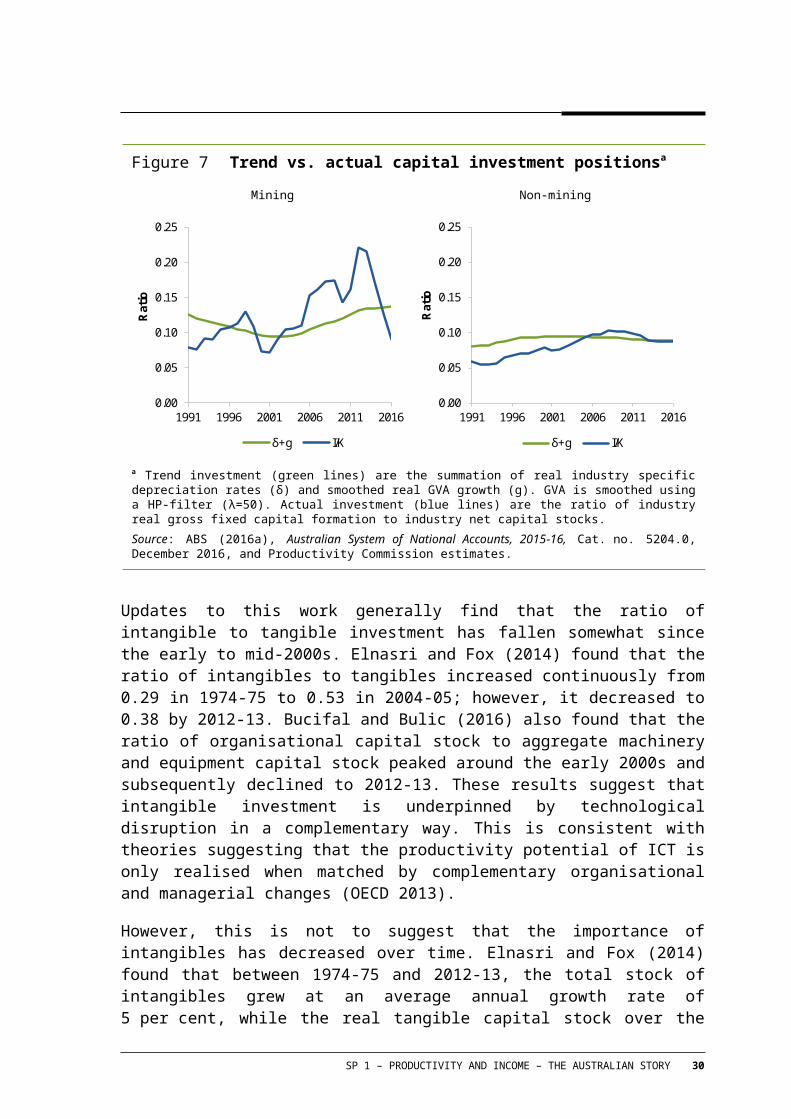
Figure 12 Many firms are well below the frontierManagement performance scores around the world
There are large within and across country differences in management
performance at the firm levela
Average management scores by selected OECD and other
countriesb
% difference in total factor productivity gap with US explained
by management scoresb
0.0
0.2
0.4
0.6
0.8
1 2 3 4 5
Freq
uenc
y (d
ensi
ty)
Average management performance indicator
US
AU
2.5 3.0 3.5Average management
score
AU
0 25 50% TFP explained
AU
a Data mainly relate to 2008. Grey lines relate to various other countries. b Pooled data from 2004 to 2014. AU is Australia.
Sources: PC calculations based on World Management Survey (http://worldmanagementsurvey.org/) and Bloom et al. (2016).
There are, of course, some businesses for whom this may not warrant a policy response. The motives and expectations that underpin starting a business are many and varied. At one end of the spectrum are businesses that are highly innovative, have ambitious growth expectations and a desire ‘to change the way things are done’. At the other end are those businesses that satisfy a lifestyle choice and/or primarily seek to provide stable employment and income for the owners and their families (PC 2015a).
Nonetheless, any slowing or reduction in the diffusion of good ideas, technologies and practices between businesses is clearly a concern for policymakers. A rising gap between high productivity firms and other firms raises key questions about the obstacles that prevent all firms from adopting seemingly well-known and replicable innovations (the role of government regulation in the digital age is discussed in supporting paper 13).
Other commentators have made similar observations on the nature of production and technology in the digital era, and characterise such changes as new forms of excludable and tacit intellectual capital, implying a structural reduction in technology diffusion in the form of capital-embedded technological change. For example, Brynjolfsson and McAfee (2014) contrasts Instagram, which was started by 14 people, required no unskilled labour and very little physical capital, and was sold after only a year and a half for about $1 billion USD, with the contemporaneous bankruptcy of Kodak, which at its peak, employed around 145 000 people and held billions of dollars in capital assets globally.
31 PRODUCTIVITY REVIEW
There are also a number of recent studies that analyse market governance structures, contending that they may have reduced the value to firms in engaging in activities that generate positive spillovers to other firms (box 2).
These issues all raise the importance of better understanding the microeconomic drivers of productivity performance. However, unfortunately little is known in Australia about firm-level productivity dynamics because of data limitations. Better policy design requires that these limitations be resolved through more concerted and well-targeted data collection and analysis. Better data are needed to discover the causal links between individual policies, business and individual behaviour or incentives, and measured productivity and living standards.
As noted in chapter 5, new tools like the Business Longitudinal Analysis Data Environment (BLADE) will help to make more comprehensive evaluations of the effectiveness of industry programs and other policies, including those aimed at stimulating innovation. The Australian Government provided additional funding in the 2017-18 Budget toward data-related initiatives, including BLADE, which should help facilitate improvements in development of firm level databases going forward.
As is the case in New Zealand, greater availability of data could usefully be accompanied by a coordinated body designed to shape and resource a productivity research agenda across government, academia and interested non-government parties. The New Zealand model, known as the ‘Productivity Hub’, serves as a potentially useful model for such a body in the Australian context (NZPC 2013).
New Zealand’s Productivity Hub is a partnership of public sector agencies that aims to improve the contribution of policy to improving productivity growth by connecting people, shaping research agendas, and sharing research. The Hub Board comprises representatives from the New Zealand Productivity Commission, the Ministry of Business, Innovation and Employment, Statistics New Zealand and the New Zealand Treasury, with secretariat functions in the New Zealand Productivity Commission.
CONCLUSION 1.7
Understanding the microeconomic drivers of productivity performance is important to improve policy design. Recent improvements in data collections in Australia are an important first step in improving the evidence base. The Australian Government could further consider a coordinated approach to productivity research to leverage new data, as seen in New Zealand.
SP 1 – PRODUCTIVITY AND INCOME – THE AUSTRALIAN STORY 32

Box 2 Some explanations for poor productivity growthRecent papers have sought to link the productivity slowdown to an evolution in market governance that has eroded competition and reduced the value to firms of generating positive spillovers.
Bartlett (2015) argues that the shift in focus to shareholder value has undermined any implicit social contract that had been in place between joint stock firms and the community in exchange for limited liability. But forgoing this social contract has also not delivered on shareholder value. Rather, power has been concentrated in the hands of management, with a consequent focus on short-term rather than long-term returns. This, encouraged further by differential tax treatment of stock options, has made share price the target, reducing the payment of dividends. Share buy-backs have reduced scope for the market to allocate capital efficiently and lowers the dynamism of the market.
Lazonick (2014) calculated that in the United States 54 per cent of earnings form the top 500 S&P companies ($2.4 trillion) was used to buy back their own stock over the period 2003 to 2012, while only 37 per cent was paid out as dividends. He made the case that firms had adopted a ‘downsize and distribute’ model, as management extracts value from the firm rather than reinvesting in employees and new capital. Hence, in rewarding the financial interests, value creation is harmed. Rule changes in the United States in 2003 that allow safe harbour on share repurchases below 25 per cent appear to have enabled this trend.
Erixon and Weigel (2016) suggest that the passive behaviour of the large pension funds, which look for and reward stable returns at the firm level, reduces the incentive of joint-stock firms to take risks. This results in a mismatch of the incentives facing firm management and those that would provide overall benefits to the broader community.
Berger (2014) attributed much of the downsizing of manufacturing in the United States to changes in corporate structures. These involved a move away from vertical integration to single business lines in response to the pressures from the financial market. Berger explained the reduced resilience of manufacturing firms to external events as a reflection of loss of vertical integration, which had formerly allowed firms to control the entire value chain when scaling up innovation through production to market. The separation of R&D and manufacturing has been facilitated by digital technologies, which Berger acknowledges has been highly rewarding for the United States. But her point is that it was vertically integrated firms that created more spillovers by providing ‘semi-public goods through apprenticeships, basic research, funding to bring innovation to scale, and diffusion of new technologies to suppliers. The downsized firms ‘could not keep these activities in house or pay for them’. (p. 5)
Azar, Schmalz and Tecu (2017) also point to the effects of financial markets in lowering productivity, but through reduced competition. Their contention is that firms owned by overlapping sets of investors have reduced incentives to compete. Profits are higher in industries where there is higher ownership concentration and price competition is weaker. For example, the authors estimate that 44 per cent of shares in the airline industry in the United States are owned by just five investors, and fares are 3-5 per cent higher than they would be if ownership were more diverse.
Sources: Bartlett (2015), Lazonick (2014), Erixon and Weigel (2016), Berger (2014), Azar, Schmalz and Tecu (2017).
33 PRODUCTIVITY REVIEW
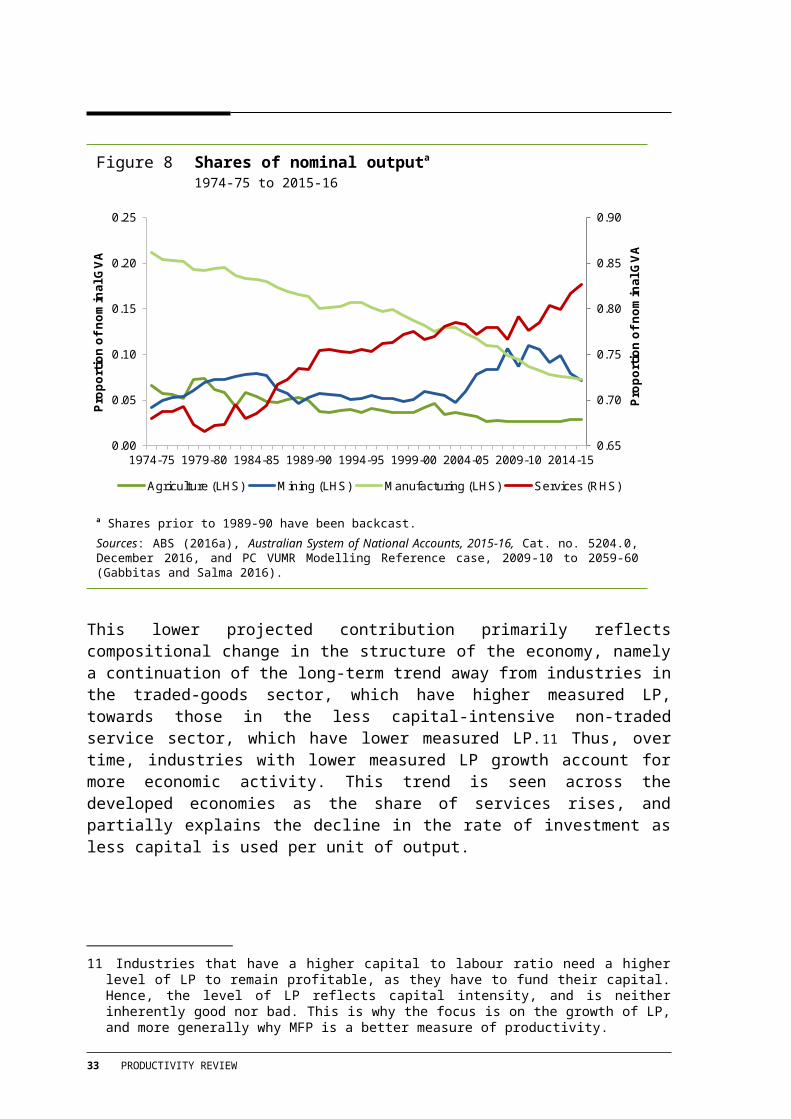
The effects of globalisation on industry composition
The integration of global input and product markets has seen the development of global value chains (GVCs), which are a significant source of structural adjustment in many advanced economies. Improvements in telecommunications, logistics and transport technologies have reduced the significance of geographical distances as a factor determining production methods or access to consumption goods. Among other things, this means that producers have been able to take advantage of lower-cost production in developing economies.
On one hand, closer international integration can facilitate the diffusion of innovations at the global frontier to national frontier firms through trade openness, participation in GVCs and the mobility of skilled workers. However, a number of studies have found that access to overseas (input) markets creates downward pressure on employment in the tradeable sector of advanced economies, which tends to have higher measured productivity on average (Bassanini and Manfredi 2012). In the United States, for example, Hlatshwayo and Spence (2014) found that nearly all employment creation since 1990 has occurred in the non-tradeable sector of the economy. In New Zealand since the late 1970s, much of employment growth has been in the ‘non-measured’ sector of the economy; and employment growth in the measured market sector over the entire period averaged only 0.1 per cent a year (Conway, Meehan and Parham 2015).
In Australia, as in other advanced economies, globalisation is likely to have contributed to a shift in employment from manufacturing activities to services. Further compositional shifts away from lower- to medium-skilled manufacturing activities are likely to continue to take place in Australia because of continued development in lower-cost economies. These structural changes in industry composition can also partly explain lower rates of capital investment. Services industries are, on average, less capital intensive, and require less capital per unit of labour to produce a given unit of output. As services grow as a proportion of the economy, this places further downward pressure on rates of investment over time (Elias and Evans 2014).
However, as discussed in PC (2016a), this particular aspect of globalisation may have reached, or may soon reach, its peak. As production becomes more automated and specialised, relative labour costs across countries will factor into production decisions less, with potential implications for the extent and value derivable from GVCs. With lower or zero labour costs, moving production centres closer to consumers will help to minimise transportation and storage costs. While this could benefit consumers in some countries, there are considerations for employment and future forms of international economic development in yet to be industrialised countries that beg consideration.21
21 See the discussion of ‘premature deindustrialisation’ in Rodrick (2015). While this process is beyond the scope of this inquiry, the process also has implications for employment prospects in advanced countries.
SP 1 – PRODUCTIVITY AND INCOME – THE AUSTRALIAN STORY 34
Investment in knowledge-based capital
MFP growth is underpinned by innovation, which in turn, is underpinned by investment in different forms of knowledge-based capital (or KBC, otherwise termed intangible investment, including R&D, intellectual property, new organisational processes and systems, and so on). Benefits flowing from investment in KBC often spill over to other firms over time. However, there has been some concern that productivity performance has suffered recently because of lower rates of KBC investment. For example, lower rates of KBC accumulation have been linked with lower rates of productivity growth among ICT-intensive industries in the United States (Fernald 2014b).
The overall impact of KBC investment on productivity, while significant, is however, neither simple to isolate nor necessarily unidirectional. Rates of KBC investment are likely to accompany broad technological shifts that also necessitate other changes in organisational and management practise for firms to compete and survive. Some reduction in KBC investment rates and productivity growth is therefore unsurprising in the post-ICT revolution era, as most firms are likely to have adapted (to the extent required) and invested in digital technologies. For example in 1997-98, 29 per cent of Australian businesses made use of the internet. By 2015-16, this had grown to over 95 per cent (ABS 1999, 2017b).22 It may be that there are diminishing returns to productivity associated with such investments in ICT — particularly in industries making significant use of ICTs.
This being the case, future rates of KBC investment should broadly correspond to new forms of general-purpose technologies as they become available. Exactly what form these technologies will take is uncertain, but because of the intangible nature of most KBC, certain policy settings in the fields of taxation, innovation, competition, and intellectual property need to be updated. Specific enabling roles for the government are clear, such as policies that enable the exploitation of data as an economic asset. However, the rising importance of KBC also suggests that policy frameworks applicable to, for example, education, will also be crucial in facilitating the abilities and competencies of future workers to generate the forms of KBC and innovations valued by an ever-evolving and complex economic environment.
Ensuring the robustness of competition and intellectual property frameworks is crucial in facilitating spillovers of knowledge between firms. This is important because some studies have linked falls in MFP growth to declining KBC investment over the past two decades. This is based on a decline in rates of business start-ups and dynamism (Andrews and Criscuolo 2015), and at least in the United States, a declining proportion of employment in so-called ‘advanced’ industries that generate domestic and international spillovers (Muro et al. 2015).
22 For many industries in 2015-16, the saturation of internet access/use is closer to 100 per cent. Certain industries bring the average down, namely Accommodation and Food Services (at 84 per cent, up from 14 per cent in 1997-98), and Agriculture (at 91 per cent, up from 11 per cent in 1997-98).
35 PRODUCTIVITY REVIEW
Changes in the nature of technological progress
Technological advances interact with productivity performance in different ways. In and of themselves, new technologies are insufficient to drive productivity growth — they must be diffused and used through the economy. For example, Syverson (2013) notes that productivity gains from electrification (initially mass produced and consumed from the late 19th century) were considerable throughout the first half of the 20 th century, and showed multiple decades-long waves of slowdown and acceleration on account of their general purpose nature. The United States also saw an earlier acceleration in productivity from electrification than other countries because of their more rapid diffusion of electricity-based general-purpose technologies in production (Ristuccia and Solomou 2002).
This is true of many forms of technology that disrupt or change common ways of doing things, as was the case with the ICT revolution of the 1990s.23 Adoption and utilisation of ICT technology, such as computers, boosted productivity growth in Australia in the 1990s (Parham 2004). But exactly where productivity performance is at and how it relates to various technological shifts occurring at any given point in time is difficult to know with precision. It is evident that many of the major technological discoveries in the 20 th century constitute ‘one-offs’ that cannot be repeated, or at least cannot materially be improved upon, such as near-instantaneous global telecommunications technology, installation of widespread electrification and plumbing systems, transcontinental transport networks, and indeed the internet.
On the basis that further technological innovations are likely to be more marginal in nature, Gordon (2012, 2014, 2015) contends that technological progress is unlikely to yield the sorts of productivity gains as it has in the past (an issue compounded by a number of supply-side ‘headwinds’ including environmental challenges, economic inequality, and demographic changes). In a similar vein, Cowen (2011) propounds a process of diminishing returns from previous sources of growth, including from mass-education of the population, the application and spread of large one-off technological breakthroughs, and the exploitation of largely free land, implying more incremental growth in future.
Prognostications about the future of technology, and its impact on growth, are ultimately a matter of judgment. There are equally optimistic assessments of the effects of future technological developments on productivity and people’s living standards. Brynjolfsson and McAfee (2014), for example, suggest there is significant growth potential stemming from advances in digital technologies (like machine learning, artificial intelligence, robotics, and networked communication) that are simply yet to be seen. This would imply that what may be nascent technologies today could result in large (measured or unmeasured) productivity gains in future.
23 Syverson (2013) also notes that the pattern of labour productivity gains from ICT exhibit remarkably similar patterns to that of electrification almost a century earlier.
SP 1 – PRODUCTIVITY AND INCOME – THE AUSTRALIAN STORY 36
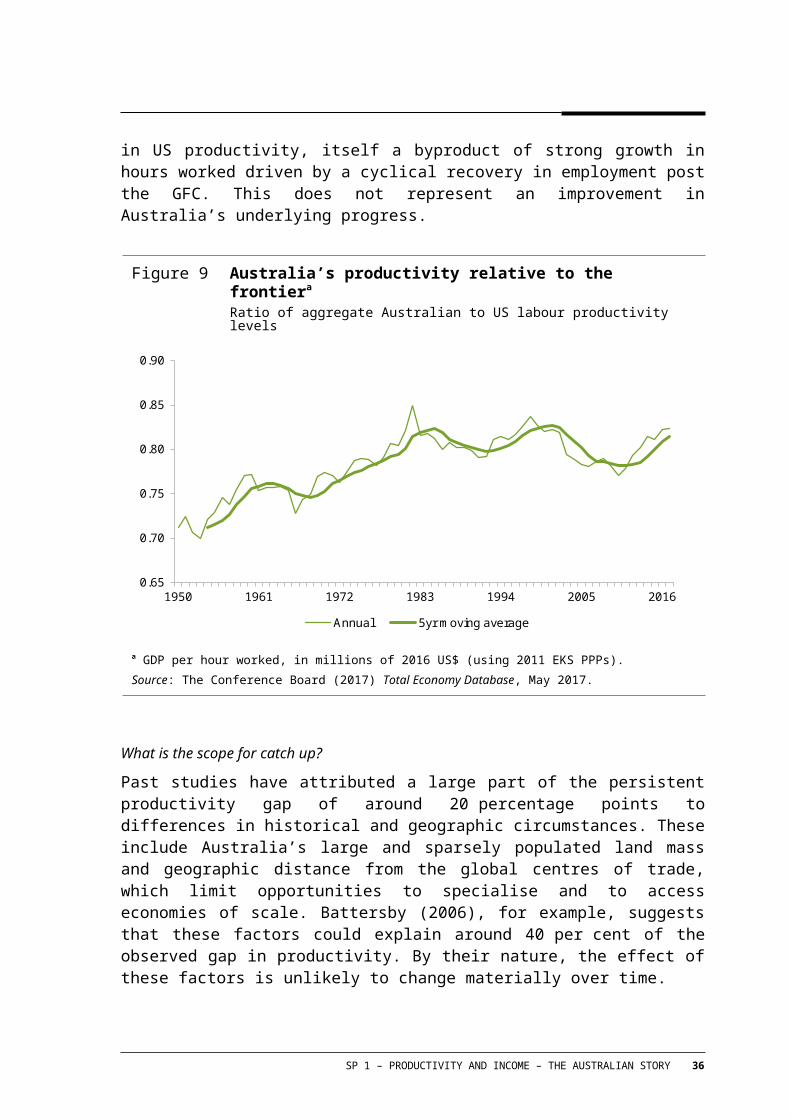
An explanation for the prevailing productivity growth slowdown is therefore that we are simply at the end of one technological revolution (i.e. ICT), and that the benefits from new technologies are just yet to materialise in any widespread fashion. Part of the optimism attributed to the Brynjolfsson and McAfee worldview rests on an assumption that new technologies will benefit consumers through lower prices and/or greater leisure time.24 This assumes that policy settings that facilitate competition feed through to lower prices, that technology is diffused, and that capital income is redistributed (that is, that the owners of new capital-embodied technologies will be taxed on the capital income they generate). Such optimism about the capacity of policy and taxation to adapt to technological shifts is not shared by Robert Gordon, and other technological ‘pessimists’.
That many new areas of technological development are characterised by increasing degrees of complexity and excludable intellectual property pose a challenge for policy makers. However, this is not mutually exclusive with the idea that future discoveries could be revolutionary (as opposed to evolutionary or more marginal) in nature. The confluence of nanotechnology and biomedical sciences is one example where frequent and significant advances are being made (for example, see the review in Chan and Xu (2016)).
Macroeconomic environment
Beyond the thesis of supply-side limitations proposed by the likes of Gordon (2012, 2014) and Cowen (2011), a number of additional theories have been proposed to explain the prolonged malaise experienced in advanced economies. These include deleveraging following an excessive buildup of private and public debt (Reinhart, Reinhart and Rogoff 2012; Reinhart and Rogoff 2010); the ramifications of a global savings ‘glut’ emanating from developing economies (Bernanke 2007); the presence of a ‘liquidity trap’ (Krugman and Eggerston 2012); and the effects of a long-run increase and decrease in the propensity to save and invest, respectively, coined ‘secular stagnation’ (Summers 2016).25
These theories differ in important ways, including the extent to which low growth can be attributed to domestic versus international factors (for example, foreign savings and international capital flows), and to structural factors (such as population ageing) versus policy settings. The IMF has also observed that the prolonged period of uncertainty and sluggish private investment after the Global Financial Crisis has further held back productivity growth, especially in advanced economies, and that this slow growth is likely to make challenges such as population ageing harder to address (IMF 2017). In the Australian context, a further major factor that may affect medium-term growth is the mining investment boom and associated increases in Australia’s terms of trade and
24 If indeed technological progress does translate to greater leisure, it is notable that wellbeing will rise rather than GDP, but wellbeing will only rise in aggregate if this leisure is voluntary and widespread across the population.
25 As in periods of abnormal economic conditions, theories (both new and old) abound as to an explanation. The theories of a liquidity trap and secular stagnation, for example, both date to the Great Depression of the 1930s, initially propounded in the classic works of John Maynard Keynes (1936) and Alvin Hansen (1938, 1939), respectively.
37 PRODUCTIVITY REVIEW
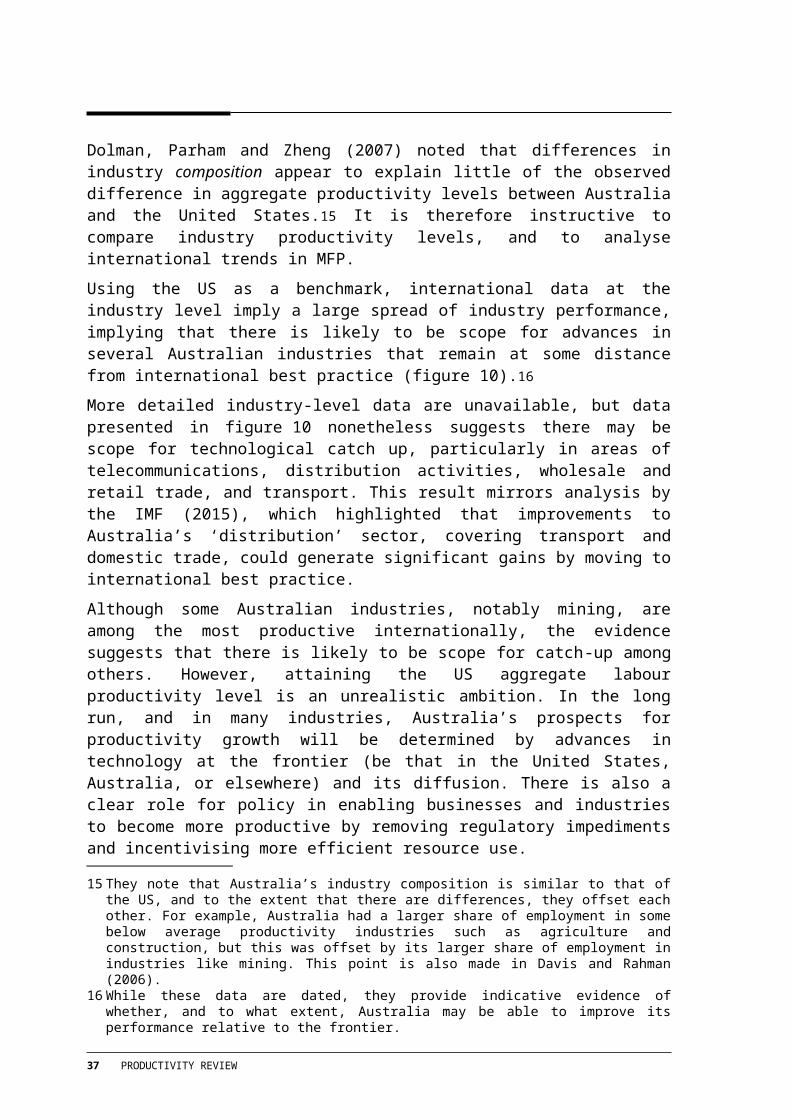
exchange rate, which made it uneconomic to invest in non-resources sector industries for a time.
Monetary policy has been accommodative in most advanced economies, including Australia. It remains part of the arsenal (along with prudential safeguards and fiscal interventions) to support investment and growth, though it has had limited impacts over the past 10 years.
4 Implications of productivity for wages and incomes
Income growth
Exactly how future technologies, policy settings and investment activity interacts to drive productivity is open to debate. However, if expectations of income growth are guided by the experience of the recent past, it is clear that productivity growth will need to play a significant role.
The main sources of national income growth are growth in productivity (from improved MFP and capital deepening), changes in the prices of goods and services we trade with other countries (that is, the ToT), changes in output from increased labour utilisation (due to lower unemployment, higher participation, and reduced underemployment), growth in net foreign income, and any change in the amount of income needed to replace depreciated capital. Figure 13 shows the contribution of each of these sources to growth in real net national disposable income per person in Australia over the past half century.
In the most recent year, 2015-16, annual per capita disposable income growth fell by 1.3 per cent, which contrasts with the positive average annual income growth since the 1960s. The main contributor to the negative growth was the falling ToT, while depreciation also contributed to a decline in real disposable income growth per capita. The growth of net foreign income and MFP were positive but more than offset by the deterioration in the ToT and depreciation.
In the Australian economy, periods of negative income growth have been infrequent. However, per capita incomes have declined in four consecutive years since 2012-13 due to large declines in the ToT. In 2015-16, the ToT was still 10 per cent above its long-term historical average. If the ToT continues its current downward trend, it will exert further pressure on Australians’ incomes and place greater emphasis on increasing productivity in the decades ahead (PC 2016b).
SP 1 – PRODUCTIVITY AND INCOME – THE AUSTRALIAN STORY 38
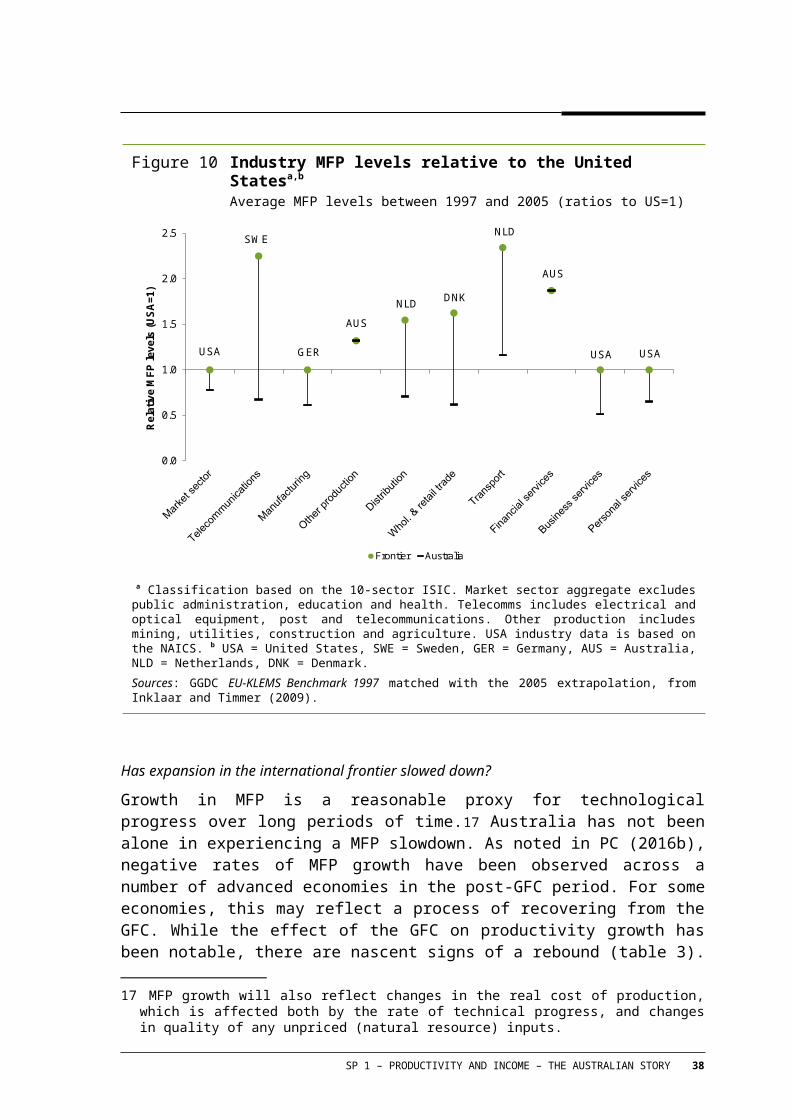
Figure 13 Contributions to average income growtha
Percentage points contribution
-2
-1
0
1
2
3
4
1973-74 to 1981-82
1981-82 to 1988-89
1988-89 to 1998-99
1998-99 to 2007-08
2007-08 to 2015-16
Perc
enta
ge p
oint
s
MFP Labour inputCapital input Terms of tradeNet foreign income Depreciationper capita disposable income
a Measured as average annual per capita real net national disposable income growth. MFP based on 12 selected market industries (Divisions A to K and R). The contributions of MFP have been scaled from the 12-industry to the whole economy and are therefore different from the figures above.
Sources: ABS (2016a), Australian System of National Accounts, 2015-16, Cat. no. 5204.0 and ABS (2016d), Estimates of Industry Multifactor Productivity, 2015-16, Cat. no. 5260.0.55.002, December 2016.
Looking ahead, the ToT cannot be relied upon as a source of income growth. The 2017-18 Australian Government Budget forecast that despite higher commodity prices in 2016-17, the ToT will fall in 2017-18 and 2018-19, and eventually return to its 2005 level from 2020-21. This implies continued falls over the medium term from its current level (Bullen, Kouparitsas and Krolikowski 2014).
Net foreign income inflows depend on the past balance between saving and investment (which in any year determines how much Australia relies on foreign borrowing) and on the relative returns on these two-way investments. The inflow can increase for any net debt position (for example, if the dividend and interest income from investments held by Australians abroad rise relative to the return on investments in Australia held by foreigners). While the inflows have been positive (but modest) in recent years, Australia has continued to rely on financing of investment from overseas, which suggests future negative inflows.
Growth in capital inputs has been the most consistent factor behind growing per capita incomes over time. However, depreciation offsets, in part, investment’s influence on incomes. Future contributions from capital investment will depend, in part, on the quality of investment decisions, how fast the assets depreciate, and how well long-lived assets are
39 PRODUCTIVITY REVIEW
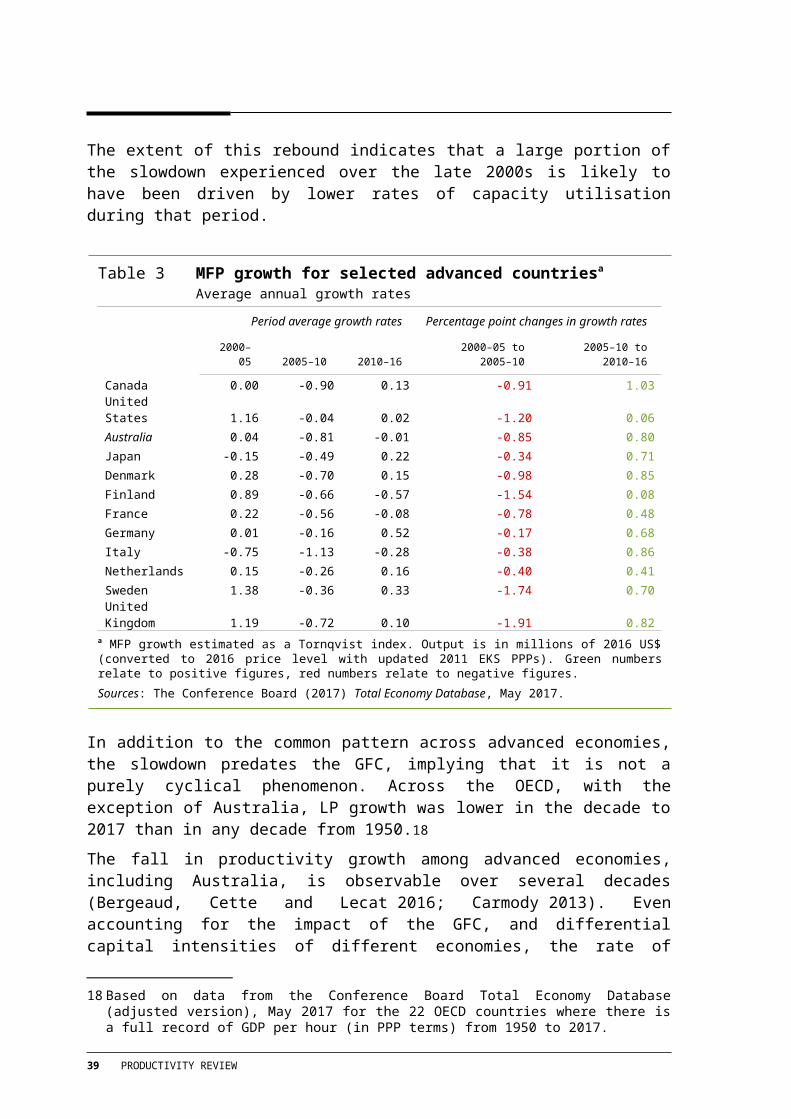
managed. It will also depend on the extent of investment itself. Compositional shifts to less capital-intensive industries suggest, if anything, some downside risk to capital input growth in future. Investment in human capital however, through education, training, and learning by doing, can complement capital and other KBC investment and contribute to higher productivity.
Labour inputs can vary over time (increasing, for example, through longer working hours per employee, lower unemployment or higher participation rates). Notwithstanding cyclical variation in average hours and unemployment, average incomes have generally grown significantly as labour force participation has increased in Australia (particularly for females). However the ageing population implies that, overall, more of the population will be in age brackets where participation rates are lower (as a higher share of people are in retirement), suggesting that population ageing will, on average, reduce per capita income growth (Australian Government 2015). This is already beginning to play out as labour input has had a negligible role in income growth in recent years. Future reductions in labour inputs per capita appear inevitable, with associated negative income effects.
CONCLUSION 1.8
Productivity improvement will be the primary determinant of income growth in the future. In the absence of material improvement in productivity performance, the prospects for income and wage growth remain subdued, given likely reversion of the terms of trade, and population ageing.
Wages and aggregate demand
Falling rates of average income growth are also directly captured in lower growth in peoples’ wages. Nominal wages growth (that is, growth in take-home pay) is currently the lowest since records began in 1998, at 1.9 per cent in the most recent year (figure 14, panel a). When adjusted for growth in the prices of consumables, real wage growth has also been low, growing on average by 0.2 per cent over the last three years (figure 14, panel b).
LP growth is not sufficient for growth in real wages. For LP improvements to translate to improved real wages, it must be the case that there is some overall increase in output prices (inflation) to compensate producers for higher labour input costs, and that workers have the capacity to bargain with employers for increases in remuneration in line with observable productivity improvements.
If output prices do not rise, including due to non-wage related factors, this can place downward pressure on wage increases.26 Company profits can, however, still be
26 A hypothetical rate of nominal wage growth of 3.6 to 4.6 per cent, with growth in labour productivity at its 30 year average of 1.6 per cent, implies that labour costs would be rising 2 to 3 per cent, and if labour income costs are stable as a share of overall income, this implies prices overall would be rising at 2 to 3
SP 1 – PRODUCTIVITY AND INCOME – THE AUSTRALIAN STORY 40
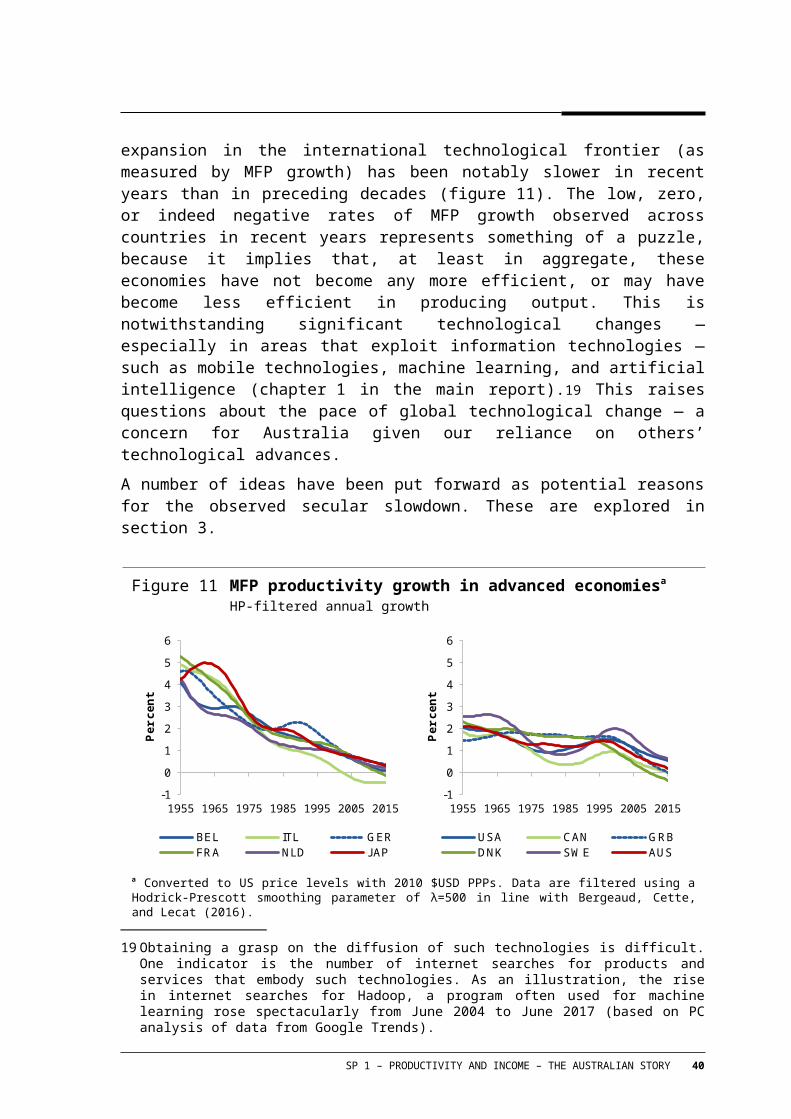
maintained if the cost of capital (the other main input to production besides labour) is low or falling. This has generally occurred in Australia in recent years with the assistance of lower domestic (and global) interest rates.
A key question therefore remains about whether there is scope for a significant pick up in the rate of growth in output prices. There are, of course, numerous drivers of prices over time. Wages growth itself is obviously a key determinant, but it is also driven by factors like competition (domestic and international), market structure, government regulations, fluctuations in the exchange rate (for those businesses operating in the traded sector), as well as advances in technology that make production processes cheaper by lowering the cost of capital inputs over time.
Capital and labour input prices can have important impacts on employers’ choices about how much capital and labour to employ in production, particularly in instances where they are substitutes for each other (rather than complements). For example, advances in technology that enables automation of production lines have seen marked disruption in employment in automotive manufacturing and retail distribution. This is not to say however, that advances in technology are incompatible with growth in employment.
Figure 14 Annual growth in hourly wagesa
Total hourly rates of pay excluding bonuses (trend)
(a) Nominala (b) Realb
0.00.51.01.52.02.53.03.54.04.55.0
1999
2001
2003
2005
2007
2009
2011
2013
2015
2017
Per c
ent
Private Public All industries
-1.0-0.50.00.51.01.52.02.53.03.5
1999
2001
2003
2005
2007
2009
2011
2013
2015
2017
Per c
ent
Private Public All industries
a Nominal wages have been deflated using RBA year-ended inflation excluding volatile items.
Sources: ABS (2017c), Wage Price Index, Australia Cat. no. 6345.0, and RBA (2017a) Consumer Price Inflation (table G1).
Previous waves of technological advance, for example during the Industrial Revolution, have tended to ultimately improve both labour productivity and employment (via the
per cent, consistent with the RBA’s inflation target. However, core inflation and nominal wages growth remain notably below these rates.
41 PRODUCTIVITY REVIEW
creation of new markets and opportunities that did not formerly exist). This suggests that current technological change may create as many or more jobs than it destroys. This idea is supported by a number of theoretical and applied analyses. For example, in a theoretical framework, Acemoglu (2011) finds that the short-run and long-run impacts of technological advances on wages typically differ and that there is no tension between technological changes that increase wages and technology being strongly labour-saving. Recent evidence on the impact of robotics on employment reaches similar conclusions. In a study of 17 countries over 1993 to 2007, Graetz and Michaels (2015) find that the use of robots increases growth, wages, and total factor productivity. However, there can be distributional effects, and they found that growth in hours worked and wages of low- and middle-skilled workers may have suffered from ‘robot densification’. In a similar vein to the impacts of globalisation, further technological advance (in areas such as robotics and artificial intelligence) would seem to imply structural changes in employment composition towards areas of the economy that are comparatively high-skilled, or that require innately human traits like adaptability, creativity and common sense (Frey and Osborne 2013).27
Of course, discussion of the impact of technology on the nature of work (including unemployment, but also the quality and quantity of work itself) is not new. However, recent concerns reflect a view (which may or may not be subject to cognitive biases) that individuals, firms, entire regions, and indeed governments (vis-à-vis policy settings) are insufficiently adaptable to the pace of current technological change. Some see this change as greater than in the past and with the potential for large unforeseen impacts (see, for example, the discussion in Hajkowicz et al. (2016)).
While the extent of this mismatch cannot be known with precision, there is likely to be, as ever, some degree of frictional unemployment arising from reductions in the costs of capital (relative to wages) over time. Any faster pace of technological change could, however, risk frictional unemployment transmuting to long-term unemployment. As indicated by past experience in Australia during the 1990s recession, delayed policy response (even in the absence of technological factors) heightens the risk of lasting damage to individuals’ job prospects, reducing the probability of being matched to a vacant job (Chapman and Kapuscinski 2000). Workers unemployed for longer might see a deterioration of their skills and productivity (Ljungqvist and Sargent 1998; Pissarides 1992) or be regarded as less employable, reducing their chances of finding further employment (Blanchard and Diamond 1994). This emphasises the need for policy settings to ensure that such workers are able to have their skills recognised and be able to transfer them to new fields of work (see chapter 3 in the main report and supporting paper 8).
27 The work by Frey and Osbourne (2013) has met some criticism as it does not account for future jobs and work that may be created because of technology, which are currently not known (and not necessarily predictable), and thus may overstate the potential risk of unemployment.
SP 1 – PRODUCTIVITY AND INCOME – THE AUSTRALIAN STORY 42
CONCLUSION 1.9
Technology creates jobs at the same time as it makes others redundant. To the extent that technological shifts require more advanced or new skills from workers, there is a role for government to ensure education and labour market policy settings enable upskilling and retraining.
Labour’s share of income
Over the course of the 1990s and 2000s, the aggregate labour income share (LIS) fell by about 4 percentage points, with most of this occurring during the 2000s.28 This implies that the share of income accruing to capital owners in the form of profits rose by a commensurate amount. This has given rise to some degree of concern about a ‘decoupling’ of real wages and labour productivity, for example in Cowgill (2013), and most recently in Cooney (2016), who both examined trends in the LIS up until around the peak of the mining boom. However, income shares, and their interpretation, can be skewed by structural changes in the economy, particularly when they occur quickly and on a large scale, as they did during the boom (box 3). And the LIS has risen in recent years to be close to its long-term average.
As noted in Parham (2013), the period of apparent decoupling evident in aggregate measures was almost entirely driven by additional capital income from strong mining-related investment over the 2000s, as opposed to lower labour incomes. Updated analysis reveals that in the period since (to 2016), the aggregate LIS has strongly reversed its downward trend. Moreover, excluding the mining industry, the LIS has on average been flat (figure 15, panel b), and actually rose slightly over the period 2010–16.
A shift-share decomposition of the LIS also confirms that mining has overwhelmingly contributed to its movements, both on the up- and downside of the boom. This reflects the shift in the composition of economic activity back to sectors of the economy that are less capital intensive, and thereby have higher labour income shares (figure 16). The decomposition also suggests that recent improvements in the LIS were driven by within-industry growth in the majority of industries.
28 In an income accounting framework, labour’s share of income includes income from compensation of employees (or COE; a function of hourly wages and hours worked, plus employers’ social contributions (or superannuation)), and an imputed income for the self-employed (proprietors) called gross mixed income (GMI). The capital share of income represents gross operating surplus (or GOS; namely profits).
43 PRODUCTIVITY REVIEW
Figure 15 Labour and capital income sharesHistorical and recent perspectives
(a) Long-run income sharesa (b) The impact of the mining boom on the LISb
0
0.1
0.2
0.3
0.4
0.5
0.6
0.7
1960 1974 1988 2002 2016
Rat
io
COE GOS GMI
0.58
0.60
0.62
0.64
0.66
0.68
0.70
0.72
1990 2000 2010R
atio
LIS (excl. mining) LIS
a Dotted lines are income shares in 2015-16. COE = compensation of employees, GOS = gross operating surplus, GMI = gross mixed income. b GMI for all 19 industries has been apportioned to labour in line with ABS practise (including the three non-market sectors for which less detailed data on factor incomes is available).
Sources: ABS (2016a) System of National Accounts, 2015-16, Cat. no. 5204.0 and ABS (2016d) Estimates of Industry Multifactor Productivity, 2015-16, Cat. no. 5260.0.55.002 and PC calculations.
This suggests, prima facie, that the ‘decoupling’ hypothesised by Cowgill (2013) and Cooney (2016), which has been observed in the United States, is unlikely to reflect a structural reduction in the capacity for real wage growth to reflect improvements in labour productivity in Australia. This partly reflects that wage setting institutions and regulations in Australia have generally prevented real wages from falling in any sustained fashion.29
The framework of looking at income shares does not, however, convey anything about the distribution of labour incomes that generate it, or the consequences of substitution of labour for capital, which could come about because of further technological advances lowering prices for capital inputs relative to wages.
29 The efficacy of minimum wage setting practices in Australia remains an area of debate. While small minimum wage increases are unlikely to have measurable employment impacts during ‘good economic times’, and are an important component of the incomes of the lowest paid, there are interactions between the minimum wage and other tax/transfer settings which should be considered in wage determinations and more broadly in the consideration of tax/transfer policies (PC 2015c).
SP 1 – PRODUCTIVITY AND INCOME – THE AUSTRALIAN STORY 44

Box 3 Productivity, real wages, the LIS and RULCsThe neoclassical growth accounting framework proposed in Solow (1956) and Swan (1956) is useful to analyse the drivers of the labour income share, productivity and real wages. Assuming a Cobb Douglas production function, constant returns to scale and competitive factor markets, output grows according to the following production function.
Y=A . f (K , L )=A . K∝ . L(1−∝ )
Where the partial derivatives with respect to K and L give their respective real prices – the rental price of capital and the real producer wage.
∂ Y∂ K
=∝ . YK
=r∧, ∂Y∂ L
= (1−∝ ) . YL
=w
A key interpretation of the above is that the real producer wage w will grow in proportion to labour productivity Y/L, assuming that labour’s share of income (1−∝ ) (the LIS) remains roughly constant. Rearranging the above, we find that:
∝=r . KY
∧ , (1−∝ )=w . LY
Note the right hand side of the latter equation represents the cost of labour per unit of output. Growth in (1−∝ ) is therefore equivalent to growth in real unit labour costs (RULCs). Another result can be shown by rearranging the above, and expressing in growth terms. We find that:
(̂1−∝ )−∝̂=^
(wr )−^
( KL )
In this equation, the left hand side is equal to zero, given that the capital and labour shares sum to one. For this condition to hold for the right hand side of the equation, changes in capital intensity must be matched by changes to the relative prices of capital and labour. This result stems from an assumption that K and L are perfectly substitutable. Persistent falls in the LIS can be explained in this framework. This can arise, for example, when technology manifests in a lower rental price of capital, which incentivises capital investment. In this case, capital intensity rises due to lower relative costs of capital, and this is offset by a commensurate fall in the LIS.
Since the mining boom, RULCs have risen in aggregate, as activity shifted back to industries with higher RULCs. The relevance of changes in RULCs for policy is not always clear. As in Australia’s case in recent years, the fall and subsequent rise in the LIS can be a natural development reflecting structural changes in the economy. In other situations, it could be driven by the erosion of bargaining power of employees placing persistent downward pressure on real wages. This might stem from labour market laws, declining unionisation, or simply competition from lower wage countries. Some suggest this partly explains the situation in the United States, and that restoration of employee bargaining powers may ameliorate inequality there.
To reiterate, standard growth theory predicts that growth in RULCs should average out to zero. The reversion in the LIS over recent years toward its historical average should not be considered a problem. Provided higher RULCs are not accompanied by increased unemployment, they can be in the national interest, as (in Australia’s case) they represent shifts in employment composition, and the attainment of allocative efficiency in labour markets. Domestically, this emphasises the importance of labour market flexibility, rather than concerns over international competitiveness, in the interpretation of recent RULC developments.
Sources: Solow (1956) and Swan (1956).
45 PRODUCTIVITY REVIEW
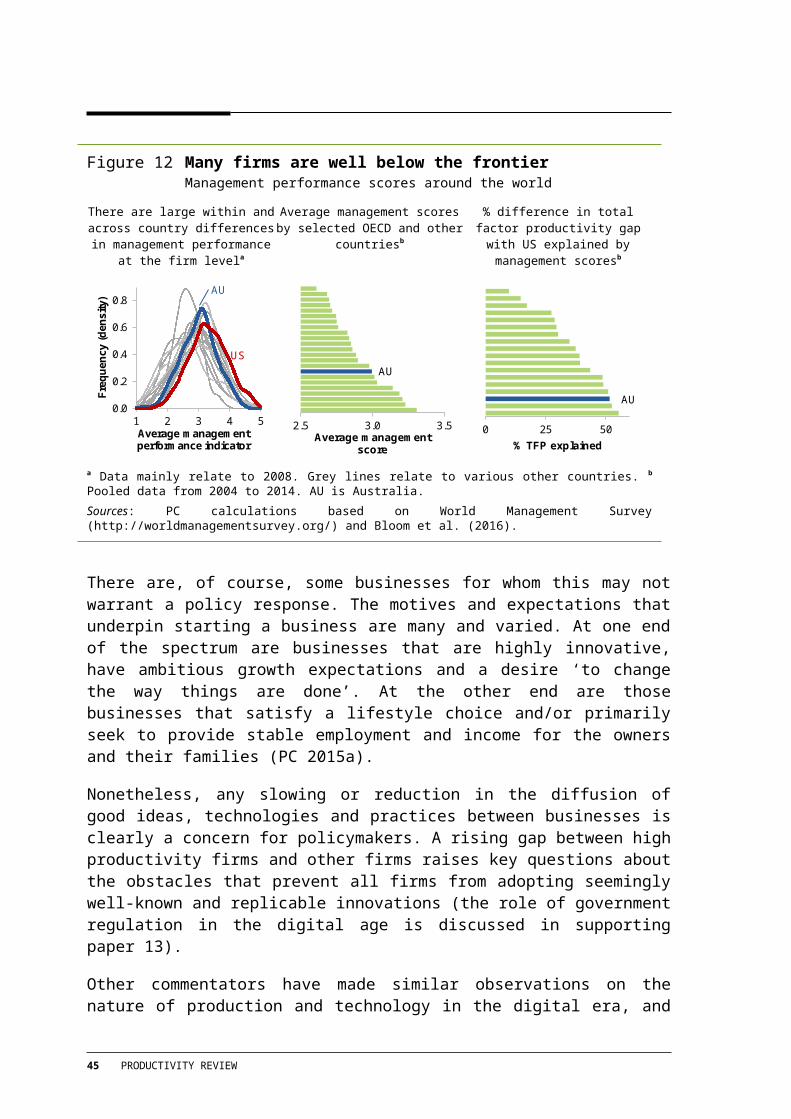
Figure 16 Labour income share decompositiona
Whole of economy (19-industry sector)
-3
-2
-1
0
1
2
3
4
1990s 2000s 2010-2016
Perc
enta
ge p
oint
cha
nge
Within-industry effect Between-industry effect Change in aggregate LIS
a For a description of the methodology, see Parham (2013), appendix A, section A.4.
Sources: ABS (2016a) System of National Accounts, 2015-16, Cat. no. 5204.0 and ABS (2016d) Estimates of Industry Multifactor Productivity, 2015-16, Cat. no. 5260.0.55.002 and Productivity Commission estimates.
Inequality, productivity, and incomes
Inequality and fiscal sustainability
Australia has performed well on various indicators of inequality. A number of studies have found that measures of inequality have not significantly changed over recent years (Dollman et al. 2015; Fletcher and Guttman 2013; Greenville, Pobke and Rogers 2013; Wilkins 2016, 2017). This is because Australia’s tax and transfer system has generally been successful in redistributing income to support those on low incomes, and that growth in wage income for those on low incomes has generally been strong compared with growth in other countries (OECD 2011).
That the tax and transfer system has successfully supported those in genuine need is undeniably positive. However, it can potentially distract from observable increases in wage income inequality in Australia (that is, a function of the wage rate and hours worked, taken before tax and not including transfers) (figure 17). Such inequality is not necessarily problematic if those on low incomes continue to experience growth in real incomes (either
SP 1 – PRODUCTIVITY AND INCOME – THE AUSTRALIAN STORY 46
as a function of growth in wages, or average hours) and the tax and transfer system itself is sustainable.
Figure 17 Wage income growth by percentilea
Real average weekly earnings (non-managerial, adult employees only)
90
100
110
120
130
140
150
160
170
180
1975
1977
1979
1981
1983
1985
1987
1989
1991
1993
1995
1997
1999
2001
2003
2005
2007
2009
2011
2013
2015
Inde
x (1
975=
100)
10th percentile 25th percentile 50th percentile
75th percentile 90th percentile Mean earnings
a Average weekly earnings represent average gross (before tax) earnings of employees and do not relate to average award rates nor to the earnings of the ‘average person’. Estimates of average weekly earnings are derived by dividing estimates of weekly total earnings by estimates of number of employees.
Sources: Leigh (2013), ABS (2016c) Employee Earnings and Hours, Australia (various issues), Cat. no. 6306.0.
The ability of the transfer system to continue to support those on low income rests on the ability and willingness of the community to continue to support the system. The cost of the system is determined by the individual policy settings dictating eligibility for different kinds of government transfers (provided either as direct cash transfers or in kind), the size of those transfers, the progressive nature of the taxation system, and the broader revenue raising capacity of governments.
Despite, or perhaps because of, significant growth in average incomes over the past two decades, the goods and services provided by governments have grown (recent examples include the National Disability Insurance Scheme and increases in school funding).30 This, in addition to the demand for health services with an ageing population, imply a transfer system that will continue to grow faster than output (Parkinson 2012). If this occurs, either expectations will have to be adjusted or output and productivity will need to grow to fund
30 Total government payments to households and individuals from 1995 to 2014 (the period over which consistent data are available) grew at roughly 1.21 times the rate of income growth (as measured by GDP). This excludes transfers relating to active labour market programs and unemployment benefits.
47 PRODUCTIVITY REVIEW
public services (including welfare transfers). It may even require both given the need for otherwise significant outperformance of growth on its own.
The transfer system will of course continue to perform a key function in supporting those on low incomes in Australia, providing social insurance to all members of the community. But inevitable constraints on revenue are at odds with funding the growing cost of providing social insurance — something has to give. The best path out of this growing problem is to raise income growth — both overall (raising revenue), and at the bottom end of the income spectrum (reducing need). This highlights the importance of policy settings that facilitate wage earnings growth at all points of the income spectrum (either through growth in wages and/or hours). This will help to reduce reliance on income redistribution for working age households on low incomes. It also emphasises the importance of honing transfer eligibility settings to ensure that they are targeted to recipients in genuine need.
CONCLUSION 1.10
Governments must confront a mismatch between revenue growth and the community’s expectations on government services provision. Income growth at all points in the income spectrum is key to fiscal sustainability as it contributes to government revenue and reduces the need for social assistance.
Inequality and productivity
The focus on inequality is not just relevant from the perspective of the sustainability of the transfer system. Following the widespread impacts of the GFC on employment and growth, there has been increasing interest in the interaction between economic inequality, and overall productivity and economic growth. Not only does improved productivity increase the scope for income growth across all household income groups, there is evidence that higher levels of inequality can adversely affect productivity growth (OECD 2011, 2016b; Ostry, Berg and Tsangarides 2014). This is not to suggest primacy of an economic over a social outcome, but simply to recognise that, in many cases, the barriers to realising greater productivity are also those contributing to widening inequalities.
Importantly, the observed rise in wage inequality appears to partly reflect the increasing dispersion in average wages paid across firms, suggesting that raising the productivity of laggard firms could promote improvements in wage equality (OECD 2015). This points to the importance of policy settings that assist individuals, firms, industries and regions to adapt to new technologies and opportunities, as well as preventing them from falling into a position of low-growth and/or disadvantage, which aggravates both inequality and the potential for future productivity growth.
Another channel through which inequality directly effects productivity is that it undermines opportunities for education and human capital development of disadvantaged individuals, lowering their productive potential, and hampering skills development. In this
SP 1 – PRODUCTIVITY AND INCOME – THE AUSTRALIAN STORY 48

sense, combating any inequality in educational attainment could potentially reverse the supposedly exhausted labour supply gains posited in Cowen (2011).
49 PRODUCTIVITY REVIEW

Appendix A: International productivity data — which measure to use?
There are several sources of productivity data for Australia, including from international datasets. The four analysed in this review are:
the Australian Bureau of Statistics (ABS) System of National Accounts
the Organisation for Economic Cooperation & Development (OECD) Productivity Database
The Conference Board (TCB) Total Economy Database (TED), and
Bergeaud, Cette and Lecat’s Long Term Productivity Database (LTPD).
While ABS data are the authoritative source on productivity trends for Australia taken in isolation, it is often useful to compare productivity between countries, including over longer time frames. In such cases, additional data are needed to measure productivity across countries in a consistent and comparable way. The sources listed above each employ different assumptions, which can give rise to different productivity indicators for each country. Key differences include how the measures adjust (or do not adjust) for price levels between countries and how they measure labour and capital inputs. This appendix provides a brief overview of the logic for adjusting for prices, the methodologies of the different sources, as well as some guidance for what measures to use and when.
The need to adjust for prices
To make valid comparisons of productivity across countries, both in terms of productivity levels and their growth rates, nominal estimates of output need to be adjusted for the impact of price movements (inflation) both within countries across time, and differences in price levels between countries. Differences in prices between countries matter because the quantity of (real) goods and services you can consume with a given unit of currency (for example $1 USD) is different in different countries. As such, comparisons of productivity between countries are only valid if the measure of output both removes the impact of inflation (changes in the price level within a country), and the difference in purchasing power between the countries (differences between the price levels across countries).
There are a number of ways of correcting for prices between countries. These are often based on market exchange rates or purchasing power parity (PPP) conversions. For international comparisons of productivity, PPPs are preferred because market exchange rates tend to fluctuate for reasons other than underlying price movements, such as interest rate differentials, and currency speculation (ONS 2012). Market exchange rates also fail to account for price movements in the non-traded sector, which generally comprises a large proportion of final consumption expenditure for households.
SP 1 – PRODUCTIVITY AND INCOME – THE AUSTRALIAN STORY 50
The process of calculating PPPs across countries involves collecting significant volumes of data on the individual prices of products constituting final demand (according to expenditure classes that are comparable across countries), and using them to produce ratios of prices, with which the GDPs and component expenditures being compared are deflated to obtain real expenditures. The process of using PPPs to deflate nominal output of each country therefore provides an estimate of output for which a unit of currency in all countries in the sample has the same purchasing power.
Reflecting the administrative complexity of such a task, calculation of PPPs tend to be conducted at intervals. The joint Eurostat-OECD PPP Programme (OECD 2016a) (for a subset of countries) is one of the main sources of PPP data, which feed into the (global level) World Bank International Comparison Program (World Bank 2014). The most recent ICP round was in 2011, and prior to that 2005. The ICP round is just at one point in time, and by definition, a measure of the growth of productivity across time must measure a change in the ratio of a volume measure of output to a volume measure of inputs over time. In order to do this, TCB use PPPs based on the World Bank-ICP 2011 round, but dynamically adjust them each year using the change in countries’ national implicit GDP deflator, relative to the US implicit GDP deflator. This provides a measure of output that can be used to analyse volume estimates both across countries and time, facilitating comparisons of productivity growth rates in addition to levels.
The 2011 ICP round indicates Australia’s aggregate price level was about 1.6 times the aggregate price level of the United States (price level index value of 155.9/100). A consequence of PPP adjustment for Australia is therefore that aggregate nominal output values are adjusted downwards when converted into USD. Because this reduces the quantity of output relative to inputs, productivity level estimates will be lower than implied by ABS statistics. If, however, the PPP adjustment is constant (or does not change significantly over time), it will have no (or little) effect on growth rates. Differences in implied productivity growth rates therefore tend to reflect other differences in the methodologies employed in different data sources (see next section).
Different productivity data for Australia
A summary of the assumptions and methods of the four main international data sources — those including aggregate level data for Australia — is presented in table 4, and the implied MFP growth rates for each are in figure 18. The methods for measuring output in the four different measures are similar, indicating that any significant difference in productivity growth is more an artefact of input measurement. As shown in figure 18, MFP growth rates across the ABS, OECD and LTPD are similar, whereas the TED data imply systematically lower MFP growth rates.
51 PRODUCTIVITY REVIEW
Table 4 Summary of international productivity data sourcesa
Databases that include aggregate indicators for Australia
Output (Y) Capital (K) Labour (L) Sectoral coverage
Periodicity PPP adjusted?
Australian Bureau of Statistics (ABS): System of National Accounts
Gross value added (GVA)
at basic prices† (for the market
sector industries),
and GDP at market prices†
(whole of economy)
Detailed industry
specific asset breakdown
(PIM method, hyperbolic
age-efficiency, and a mix of
exogenous and
endogenous rate of return)
Hours from the ABS Labour
Force Survey
Market sector (12 or 16 industry), and whole of economy (19 industry plus ownership of
dwellings and net
taxes)
Fiscal year (1 July to 30 June)
No, expressed in
domestic currency
Organisation for Economic Cooperation & Development (OECD): Productivity Database
GDP at market prices†
(whole of economy)
Internationally harmonised 8-way asset breakdown,
ICT deflators, age efficiency
profiles (exogenous
rate of return).
Hours from the OECD
National Accounts Database (adjusted from the
ABS Labour Force
Survey)
Whole of economy (19 industry plus ownership of
dwellings and net
taxes)
Calendar year (1 January to
31 December)
No, expressed in
domestic currency
The Conference Board (TCB): Total Economy Database
GDP at market prices†
(whole of economy)
Internationally harmonised 3-way asset breakdown
(PIM method, geometric
age-efficiency, endogenous
rate of return)
Hours are adjusted from the
ABS Labour Force
Survey
Whole of economy (19 industry plus ownership of
dwellings and net
taxes)
Calendar year (1 January to
31 December)
Yes, expressed in
2016 US dollars (EKS PPPs based
on 2011 World
Bank-ICP round)
Bergeaud, Cette, and Lecat (2016): Long Term Productivity Database
GDP at market prices†
(whole of economy
from OECD). Historical data from
Bolt and van Zanden (2013)
updating Maddison
(2001)
Internationally harmonised 2-way asset breakdown
(simple age efficiency and depreciation).
Historical data from Mitchell
(1998) and Butlin (1977).
Hours are from TCB
and the OECD.
Historical data from
Huberman and Minns (2007) and
Clark (1957)
Whole of economy (19 industry plus ownership of
dwellings and net
taxes)
Calendar year (1 January to
31 December)
Yes, expressed in
2005 US dollars
(PPPs based on 2005
Penn World Tables)
a Excludes GGDC data because the EU-KLEMS project is no longer running. † Basic prices do not take into account net taxes (taxes less subsidies) on production of goods and services, while market prices include the additional cost attributable to net taxes – that is, market prices are the actual prices people pay for goods and services.
Sources: ABS (2016b), OECD (2017a), The Conference Board (2017), and Bergeaud, Cette, and Lecat (2016).
SP 1 – PRODUCTIVITY AND INCOME – THE AUSTRALIAN STORY 52
Figure 18 Australia’s whole-of-economy MFP growtha
Implied by four available measures
-3.0
-2.0
-1.0
0.0
1.0
2.0
3.0
4.0
1995 1997 1999 2001 2003 2005 2007 2009 2011 2013 2015
Per c
ent
OECD (annual) OECD (HP)TCB TED (annual) TCB TED (HP)BCL (annual) BCL (HP)ABS (Implied, annual) ABS (Implied, HP)
a The ABS ‘implied’ series has been derived from national accounts data on a whole of economy basis for consistency with how the other measures are calculated.
Sources: OECD (2017b) Productivity Database, The Conference Board (2017) Total Economy Database – May 2017, Long Term Productivity Database from Bergeaud, Cette and Lecat (2016), ABS (2016a, 2016d) Estimates of Industry Multifactor Productivity, 2015-16, Cat. no. 5260.0.55.002 ABS Australian System of National Accounts, 2015-16, Cat. no. 5204.0, and Productivity Commission estimates.
Conceptually, systematically lower MFP growth rates implied by TCB data are due to methodological assumptions that have the overall effect of raising the rate of input growth relative to output growth. The TCB make a number of assumptions that differ from the other measures. These include explicitly accounting for human capital (or labour quality) in the measurement of hours worked, and different treatment of ICT capital goods (that they depreciate at a faster rate, implying a higher rate of capital services for the ICT capital stock). TCB also directly estimate labour’s share of income by assuming the wage rate of the self-employed is equal to that of other employees, meaning the labour (and capital) income shares are different from those measured by the ABS.
What measure to use and when
In international comparisons of productivity performance, dynamically PPP-adjusted measures such as TCB TED are most suitable, given that they facilitate comparisons of productivity levels and growth rates both across countries and through time. As such, the Commission generally presents the TCB TED data in instances where international comparisons are being made, such as the Productivity Update. However, it is useful to bear
53 PRODUCTIVITY REVIEW
in mind TCB’s methodology for measuring capital and labour inputs, and the impact this has on implied productivity growth rates relative to ABS measures.
For longer-run analysis, databases such as the LTPD compiled by Bergeaud, Cette and Lecat (2016) are a useful starting point, although the assumptions inevitably needed to enumerate the historical components of data series of that length introduce more uncertainty into the estimates. The authors note, nonetheless, that their results are consistent with other analyses usually produced on one or a limited number of countries, and over shorter periods. Indeed their MFP growth estimates in figure 19 are not dissimilar in trend terms from ABS estimates.
In any domestic-level analysis, ABS statistics are the authoritative source, though again, it is useful to bear in mind the impact of the ABS’ principal methodology for estimating capital and labour inputs on productivity statistics. The ABS produces a number of additional experimental productivity estimates that explore the effect of different methodological assumptions.
SP 1 – PRODUCTIVITY AND INCOME – THE AUSTRALIAN STORY 54
References
ABS 1999, Business Use of Information Technology, Australia, 1997-98, Cat. no. 8129.0, Canberra, 5 October.
—— 2016a, Australian System of National Accounts, 2015-16, October, Cat. no. 5204.0.
—— 2016b, Australian System of National Accounts: Concepts, Sources and Methods, 2015, March, Cat. no. 5216.0.
—— 2016c, Employee Earnings and Hours, May 2016, Cat. no. 6306.0.
—— 2016d, Estimates of Industry Multifactor Productivity, 2015-16, Cat. no. 5260.0.55.002, Canberra.
—— 2017a, Private New Capital Expenditure and Expected Expenditure, Australia, Mar 2017, Cat. no. 5625.0, Canberra.
—— 2017b, Summary of IT Use and Innovation in Australian Business, 2015-16, Cat. no. 8166.0, Canberra, 15 June.
—— 2017c, Wage Price Index, Australia, Mar 2017, Cat. no. 6345.0, Canberra.
Acemoglu, D. 2011, ‘When does labor scarcity encourage innovation?’, Journal of Political Economy, vol. 118, no. 6, pp. 1037–1078.
Albrizio, S. and Nicoletti, G. 2017, Boosting productivity: A framework for analysis and a checklist for policy, Background Paper, GFP Annual Conference 2017, OECD.
Andrews, D. and Criscuolo, C. 2015, The Future of Productivity, OECD Publishing.
——, —— and Gal, P. 2015, Frontier firms, technology diffusion and public policy: Micro evidence from OECD countries, Productivity Working Paper No. 2, November, OECD Publishing, Paris.
Australian Government 2007, Intergenerational Report 2007, April.
—— 2010, Intergenerational Report 2010: Australia to 2050 - Future challenges, January.
—— 2015, 2015 Intergenerational Report: Australia in 2055, March.
—— 2017, Budget 2017-18 - Budget Paper No. 1, May.
Australian Treasury 2009, Raising the level of productivity growth in the Australian economy, Submission to the House of Representatives Standing Committee on Economics Inquiry into raising the level of productivity growth in the Australian economy, August.
Azar, J., Schmalz, M.C. and Tecu, I. 2017, Anti-Competitive effects of common ownership, Social Science Research Network Scholarly Paper, 23 March, ID 2427345, Rochester, NY.
Banks, G. 2005, ‘Structural reform Australian-style: lessons for others?’, Presentation to the IMF, World Bank and OECD.
SP 1 – PRODUCTIVITY AND INCOME – THE AUSTRALIAN STORY 56
Barnes, P. and McClure, A. 2009, Investments in Intangible Assets and Australia’s Productivity Growth, Staff Working Paper, Productivity Commission, Canberra.
——, Soames, L., Li, C. and Munoz, M. 2013, Productivity in Manufacturing: Measurement and Interpretation, Staff Working Paper, Productivity Commission.
Bartlett, B. 2015, Is the only purpose of a corporation to maximise profit?, The Big Picture.
Bassanini, A. and Manfredi, T. 2012, Capital’s grabbing hand? A cross-country/cross-industry analysis of the decline of the labour share, OECD Social, Employment and Migration Working Papers, 133, OECD Publishing.
Battersby, B. 2006, Does distance matter? The effect of geographic isolation on productivity levels, Treasury Working Paper, 2006–03, Australian Treasury, Canberra.
Bergeaud, A., Cette, G. and Lecat, R. 2016, ‘Productivity trends in advanced countries between 1890 and 2012’, Review of Income and Wealth, vol. 62, no. 3, pp. 420–440.
Berger, S. 2014, How finance gutted manufacturing, Boston Review, 1 April.
Bernanke, B. 2007, ‘Global imbalances: recent developments and prospects’, speech at the Bundesbank Lecture, Berlin, Germany, 11 September.
Bernstein, J. 2013, The Impact of Inequality on Growth, December, Center for American Progress, Washington.
Blanchard, O. and Diamond, P. 1994, ‘Ranking, unemployment duration, and wages’, Review of Economic Studies, vol. 61, no. 3, pp. 417–434.
Bloom, N., Brynjolfsson, E., Foster, L., Jamin, R., Patnaik, M., Saporta-Eksten, I. and Van Reenen, J. 2016, What drives differences in management?, Stanford University Mimeo.
Brynjolfsson, E. and McAfee, A. 2014, The Second Machine Age: Work, Progress, and Prosperity in a Time of Brilliant Technologies, W.W. Norton & Company, Inc.
Bucifal, S. and Bulic, F. 2016, Updating investment estimates for Australia’s organisational capital, Staff Research Paper, 2/2016, Department of Industry, Innovation and Science, Canberra.
Bullen, J., Kouparitsas, M. and Krolikowski, M. 2014, Long-run forecasts of Australia’s terms of trade, Working Paper, May, The Treasury.
Butlin, M.W. 1977, A preliminary annual database 1900-01 to 1973-74, Research Discussion Paper, May, Reserve Bank of Australia.
Byrne, D.M., Fernald, J. and Reinsdorf, M. 2016, Does the United States have a productivity slowdown or a measurement problem, Finance and Economics Discussion Series, 2016–017, Board of Governors of the Federal Reserve System, Washington.
Carmody, C. 2013, Slowing productivity growth — A developed economy comparison, Economic Roundup, Issue 2, 2013, The Treasury.
Chan, J. and Xu, C. 2016, Perspectives in Micro- and Nanotechnology for Biomedical Applications, Imperial College Press.
57 PRODUCTIVITY REVIEW
Chapman, B. and Kapuscinski, C.A. 2000, Avoiding recessions and Australian long-term unemployment, Discussion Paper, June, 29, The Australia Institute.
Connolly, E. and Gustafsson, L. 2013, ‘Australian productivity growth: trends and determinants’, The Australian Economic Review, vol. 46, no. 4, pp. 473–482.
—— and Orsmond, D. 2011, The mining industry: From bust to boom, Research Discussion Paper, 2011–08, Reserve Bank of Australia, Sydney.
Conway, P. 2016, Achieving New Zealand’s productivity potential, New Zealand Productivity Commission.
——, Meehan, L. and Parham, D. 2015, Who benefits from productivity growth? – The labour income share in New Zealand, Working Paper 2015/1, New Zealand Productivity Commission Working Paper, New Zealand Productivity Commission, Wellington.
Cooney, M. 2016, Inequality: The Facts and the Future, Chifley Research Centre Inclusive Prosperity Commission.
Corrado, C., Hulten, C. and Sichel, D. 2005, ‘Measuring capital and technology: An expanded framework’, Studies in Income and Wealth, vol. 65, Measuring Capital in the New Economy, pp. 11–41.
——, —— and —— 2006, Intangible capital and economic growth, NBER Working Paper, 11948, National Bureau of Economic Research, Cambridge, Massachusetts.
Cowen, T. 2011, The Great Stagnation: How America Ate All the Low-Hanging Fruit of Modern History, Got Sick, and Will (Eventually) Feel Better, Dutton Adult.
Cowgill, M. 2013, A shrinking slice of the pie, The Working Australia Papers, 1, Australian Council of Trade Unions.
Davis, G. and Rahman, J. 2006, Perspectives on Australia’s productivity prospects, Working Paper, Treasury Working Paper, The Treasury.
Dollman, R., Kaplan, G., La Cava, G. and Stone, T. 2015, Household economic inequality in Australia, Research Discussion Paper, December, Reserve Bank of Australia.
Dolman, B. 2009, ‘What happened to Australia’s productivity surge?’, The Australian Economic Review, vol. 42, no. 3, pp. 243–263.
—— and Gruen, D. 2012, ‘Productivity and structural Change’, Address to the Australian Conference of Economists, Melbourne, 10 July, Australian Treasury
——, Parham, D. and Zheng, S. 2007, Can Australia Match US Productivity Performance?, Staff Working Paper, Productivity Commission.
Elias, S. and Evans, C. 2014, ‘Cycles in non-mining business investment’, Bulletin, December Quarter 2014, Reserve Bank Australia, Sydney.
Elnasri, A. and Fox, K. 2014, The contribution of research and innovation to productivity and economic growth, Australian School of Business Research Paper, No. 2014 ECON 08, Sydney.
SP 1 – PRODUCTIVITY AND INCOME – THE AUSTRALIAN STORY 58
Erixon, F. and Weigel, B. 2016, The Innovation Illusion: How so Little is Created by so Many Working so Hard, Yale University Press, New Haven.
Eslake, S. 2011, Productivity: The lost decade, presented at the Australian economy in the 2000s, Sydney, Reserve Bank of Australia.
Fernald, J. 2014a, Productivity and potential output before, during and after the Great Recession, Federal Reserve Bank of San Francisco Working Paper Series, Federal Reserve Bank of San Francisco.
—— 2014b, ‘Productivity and potential output before, during, and after the Great Recession’, NBER Macroeconomics Annual 2014, Volume 29, National Bureau of Economic Research.
Fletcher, M. and Guttman, B. 2013, ‘Income inequality in Australia’, Economic Roundup, December, Australian Government Treasury.
Foster, R.A. 1996, Australian Economic Statistics 1949-50 to 1994-95, Occasional Paper No. 8, Reserve Bank of Australia.
Frey, C. and Osborne, M. 2013, The Future of Employment: How Susceptible are Jobs to Computerisation?, Oxford Martin Programme on Technology and Employment, September.
Gabbitas, O. and Salma, U. 2016, VUMR Modelling Reference Case, 2009-10 to 2059-60, Staff Working Paper, 28 November, Productivity Commission.
Gordon, J., Zhao, S. and Gretton, P. 2015, On Productivity: Concepts and Measurement, February, Productivity Commission.
Gordon, R. 2012, Is U.S. economic growth over? faltering innovation confronts the six headwinds, NBER Working Paper 18315.
—— 2014, The demise of U.S. economic growth: Restatement, rebuttal, and reflections, NBER Working Papers 19895.
—— 2015, ‘Secular stagnation on the supply side: US productivity growth in the long run’, Digiworld Economic Journal, vol. 100, no. 4, pp. 19–45.
Graetz, G. and Michaels, G. 2015, Robots at work, CEP Discussion Paper, March, 1335, Centre for Economic Performance LSE.
Greenville, J., Pobke, C. and Rogers, N. 2013, Trends in the Distribution of Income in Australia, Staff Working Paper, Productivity Commission, Canberra.
Hajkowicz, S., Reeson, A., Rudd, L., Bratanova, A., Hodgers, L., Mason, C. and Boughen, N. 2016, Tomorrow’s Digitally Enabled Workforce: Megatrends and Scenarios for Jobs and Employment in Australia over the Coming Twenty Years, January, CSIRO, Brisbane.
Hansen, A.H. 1938, Full Recovery or Stagnation?, Norton, New York.
—— 1939, ‘Economic progress and declining population growth’, The American Economic Review, vol. 29, pp. 1–15.
59 PRODUCTIVITY REVIEW
Hlatshwayo, S. and Spence, M. 2014, ‘Demand and defective growth patterns: The role of the tradable and non-tradable sectors in an open economy’, American Economic Review, vol. 104, no. 5 , May 2014, pp. 272–277.
IMF (International Monetary Fund) 2015, Australia, Staff Report for the Article IV Consultation, IMF Country Report No. 15/274, 3 August.
—— 2017, ‘The Managing Director’s Global Policy Agenda — A More Inclusive and Resilient Global Economy’, Policy Papers, Spring 2017.
Inklaar, R. and Timmer, M. 2009, ‘Productivity convergence across industries and countries: The importance of theory-based measurement’, Macroeconomic Dynamics, vol. 13, no. 2, pp. 218–240.
Jorgenson, D., Ho, M. and Stiroh, K. 2008, ‘A tetrospective look at the U.S. productivity growth resurgence’, Journal of Economic Perspectives, vol. 22, no. 1, pp. 3–24.
Kent, C. 2014, Non-mining business investment — Where to from here?’, Address to the Bloomberg Economic Summit, Sydney, 16 September.
Keynes, J.M. 1936, The General Theory of Employment, Interest and Money, Macmillan, London.
Krugman, P. and Eggerston, G. 2012, ‘Debt, deleveraging, and the liquidity trap: A Fisher-Minsky-Koo approach’, Quarterly Journal of Economics, vol. 127, no. 3, pp. 1469–1513.
Lane, K. and Rosewall, T. 2015, ‘Firm-level capacity utilisation and the implications for investment, labour and prices’, Bulletin, December Quarter 2015, Reserve Bank Australia, Sydney.
Lazonick, W. 2014, ‘Profits without prosperity’, Harvard Business Review, September issue
Leigh, A. 2013, Battlers and Billionaires: The Story of Inequality in Australia, Black Inc. Publishing, Melbourne.
Ljungqvist, L. and Sargent, T. 1998, ‘The European unemployment dilemma’, Journal of Political Economy, vol. 106, no. 3, pp. 514–550.
Maddison, A. 2001, The World Economy : A Millennial Perspective, OECD Development Centre Studies, OECD.
Muro, M., Rothwell, J., Andes, S., Fikri, K. and Kulkarni, S. 2015, America’s Advanced Industries: What They Are, Where They Are, and Why They Matter, The Brookings Institution.
NZPC 2013, Productivity Hub: Purpose and Governance, March, Wellington, NZ.
OECD 2011, Divided We Stand: Why Inequality Keeps Rising, Paris, December.
—— 2013, New Sources of Growth: Knowledge-based Capital, OECD Directorate for Science, Technology and Innovation, Paris.
SP 1 – PRODUCTIVITY AND INCOME – THE AUSTRALIAN STORY 60
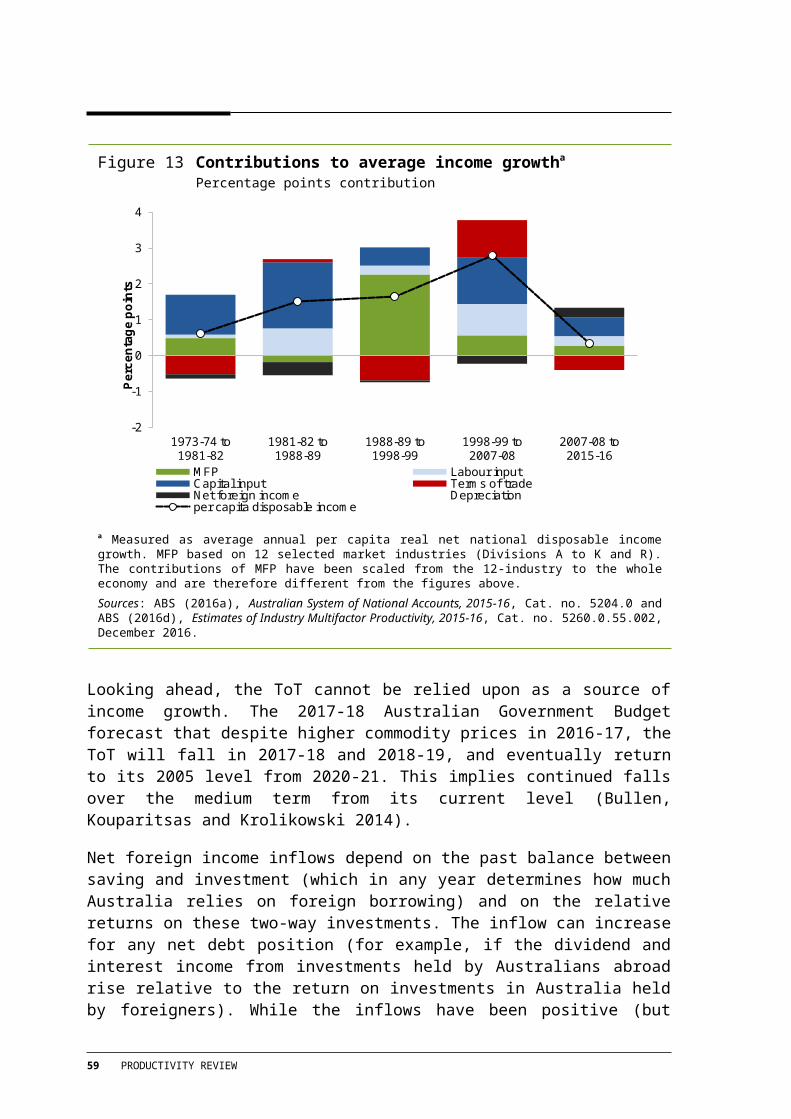
—— 2015, The future of productivity, July, Joint Economics Department and the Directorate for Science, Technology and Innovation Policy Note, Paris.
—— 2016a, Eurostat-OECD Methodological Manual on Purchasing Power Parities, 2012 edition, Paris.
—— 2016b, The productivity-inclusiveness nexus, Meeting of the OECD Council at Ministerial Level, 1-2 June, OECD Publishing, Paris.
—— 2017a, Measuring Productivity — Measurement of Aggregate and Industry Level Productivity Growth, Paris.
—— 2017b, OECD Productivity Database, Compendium of Productivity Indicators, 2017.
ONS 2012, International comparisons of productivity, Information Paper, United Kingdom.
Ostry, J., Berg, A. and Tsangarides, C. 2014, Redistribution, Inequality and Growth, IMF Staff Discussion Note, April, SDN/14/02, United States.
Parham, D. 2004, ‘Australia’s 1990s productivity surge and its determinants’, NBER-East Asia Seminar on Economics, Volume 13, Growth and Productivity in East Asia.
Parkinson, M. 2012, Challenges and opportunities for the Australian economy, Speech to the John Curtin Institute of Public policy Breakfast Forum, October.
PC (Productivity Commission) 2004, ICT Use and Productivity: A Synthesis from Studies of Australian Firms, Research Paper.
—— 2005, Trends in Australian Agriculture, Commission Research Paper, Canberra.
—— 2009, Submission to the House of Representatives Standing Committee on Economics: Inquiry into Raising the Level of Productivity Growth in Australia, Submission.
—— 2015a, Business Set-up, Transfer and Closure, Final Report, no. 75, Canberra.
—— 2015b, Tax and Transfer Incidence in Australia, Commission Working Paper.
—— 2015c, Workplace Relations Framework, Final Report, no. 76, Canberra.
—— 2016a, Digital Disruption: What do governments need to do?, Commission Research Paper, Canberra.
—— 2016b, PC Productivity Update, April
Pissarides, C. 1992, ‘Loss of skill during unemployment and the persistence of unemployment shocks’, Quarterly Journal of Economics, vol. 107, no. 4, pp. 1371–1391.
Plumb, M., Kent, C. and Bishop, J. 2012, Implications for the Australian economy of strong growth in Asia, presented at Structural Change and the Rise of Asia, Sydney, 19 September.
RBA 2017a, Consumer price inflation, table G1, Sydney.
—— 2017b, Statement on monetary policy, May 2017, Sydney.
61 PRODUCTIVITY REVIEW
Reinhart, C., Reinhart, V. and Rogoff, K. 2012, ‘Public debt overhangs: Advanced-economy episodes since 1800’, Journal of Economic Perspectives, vol. 26, no. 3, pp. 69–86.
—— and Rogoff, K. 2010, ‘Growth in a time of debt’, The American Economic Review, vol. 100, no. 2, pp. 573–578.
Ristuccia, C.A. and Solomou, S. 2002, Electricity diffusion and trend acceleration in inter-war manufacturing productivity, Economics Working Paper, 202, University of Cambridge, Cambridge.
Rodrick, D. 2015, Premature deindustrialisation, NBER Working Paper, 20935.
Shahiduzzaman, M., Layton, A. and Alam, K. 2015, ‘On the contribution of information and communication technology to productivity growth in Australia’, Economic Change and Restructuring, vol. 48, no. 3–4, pp. 281–304.
Solow, R.M. 1956, ‘A contribution to the theory of economic growth’, Quarterly Journal of Economics, vol. 70, no. 1, pp. 65–94.
Summers, L. 2016, Secular stagnation and monetary policy, Federal Reserve Bank of St. Louis Review, Second Quarter 2016, Federal Reserve Bank of St. Louis.
Swan, T.W. 1956, ‘Economic growth and capital accumulation’, Economic Record, vol. 32, no. 63, pp. 334–361.
Syverson, C. 2013, Will history repeat itself? Comments on ‘Is the information technology revolution over’, International Productivity Monitor, No. 25.
—— 2016, Challenges to mismeasurement explanations for the US productivity slowdown, NBER Working Paper, February, National Bureau of Economic Research, United States.
The Conference Board 2017, Total Economy Database - May 2017.
Tisdell, C. 2017, ‘Information technology’s impacts on productivity and welfare: A review’, International Journal of Social Economics, vol. 44, no. 3, pp. 400–413.
Topp, V. and Kulys, T. 2012, Productivity in Electricity, Gas and Water: Measurement and Interpretation, Productivity Commission Staff Working Paper, Canberra.
——, Soames, L., Parham, D. and Bloch, H. 2008, Productivity in the Mining Industry: Measurement and Interpretation, Staff Working Paper, Productivity Commission, Canberra.
Wilkins, R. 2016, The Household, Income and Labour Dynamics in Australia Survey: Selected Findings from Waves 1 to 14, the 11th Annual Statistical Report of the HILDA Survey, Melbourne Institute of Applied Economic and Social Research, University of Melbourne.
—— 2017, ‘Income inequality exists in Australia, but the true picture may not be as bad as you thought’, The Conversation, 20 June.
SP 1 – PRODUCTIVITY AND INCOME – THE AUSTRALIAN STORY 62
World Bank 2014, Purchasing Power Parities and the Real Size of World Economies, A Comprehensive Report of the 2011 International Comparison Program, Washington, DC, 20 November.
63 PRODUCTIVITY REVIEW