surface and deep structures in graphics … and deep structures in graphics comprehension wolfgang...
TRANSCRIPT
Surface and deep structures in graphics comprehension
Wolfgang Schnotz & Christiane Baadte
Published online: 3 December 2014# Psychonomic Society, Inc. 2014
Abstract Comprehension of graphics can be considered as aprocess of schema-mediated structure mapping from externalgraphics on internal mental models. Two experiments wereconducted to test the hypothesis that graphics possess a per-ceptible surface structure as well as a semantic deep structureboth of which affect mental model construction. The samecontent was presented to different groups of learners bygraphics from different perspectives with different surfacestructures but the same deep structure. Deep structures werecomplementary: major features of the learning content in oneexperiment became minor features in the other experiment,and vice versa. Text was held constant. Participants wereasked to read, understand, and memorize the learning materi-al. Furthermore, they were either instructed to process thematerial from the perspective supported by the graphic orfrom an alternative perspective, or they received no furtherinstruction. After learning, they were asked to recall thelearning content from different perspectives by complet-ing graphs of different formats as accurately as possible.Learners’ recall was more accurate if the format ofrecall was the same as the learning format which indi-cates surface structure influences. However, participantsalso showed more accurate recall when they remem-bered the content from a perspective emphasizing thedeep structure, regardless of the graphics format present-ed before. This included better recall of what they hadnot seen than of what they really had seen before. Thatis, deep structure effects overrode surface effects. De-pending on context conditions, stimulation of additionalcognitive processing by instruction had partially positiveand partially negative effects.
Keywords Comprehension of graphics . Perspectives .
Structuremapping . Schemata . Surface structure of graphics .
Deep structure of graphics
Visual communication with graphics plays an increasinglyimportant role in education. In the course of growing readingliteracy, students are expected to learn from texts that includegraphics such as realistic pictures, diagrams, or graphs, andintegrate information from these external representations intocoherent knowledge structures.
Text comprehension has received much attention duringthe last decades. Generative linguistics suggested thatsentences have a surface structure and a deep structure(Chomsky, 1965). The surface structure is the outward formof a sentence which is actually spoken and heard (or writtenand read). It includes phonemic or graphemic features as wellas lexical and syntactic characteristics. The deep structure of asentence is a theoretical construct whichmakes the underlyinglogical and semantic relations explicit and from which theactual form of the sentence (i.e., its surface structure) isderived. Theorists such as Fillmore (1968) and Chafe (1970)considered the deep structure a semantic construct that ex-presses the meaning of a sentence. Psycholinguistic studiesdemonstrated that texts are indeed mentally represented in adeep structure rather than a surface structure format (Sachs,1967). Further research on text comprehension refined theseconcepts. It is now broadly accepted that text comprehensionincludes the formation of multiple mental representations.Readers are assumed to construct a mental representation ofthe text surface structure and a representation of its semanticdeep structure. The latter, often referred to as the text base,consists of propositions representing the ideas expressed in thetext. These propositions serve as a data base for constructing amental model of the text content (cf. Graesser, Millis, &Zwaan, 1997; Kintsch, 1998; McNamara, 2007; van Dijk, &Kintsch, 1983; Weaver, Mannes, & Fletcher, 1995).
In view of the fact that far less research has been investedinto comprehension of graphics (cf. Cleveland, 1985;Glenberg & Langston, 1992; Schnotz & Kulhavy, 1994), this
W. Schnotz (*)Faculty of Psychology, University of Koblenz-Landau, Fortstrasse 7,76829 Landau, Germanye-mail: [email protected]
C. BaadteInstitute of Psychology, University of Mainz, Binger Str. 14-16,Mainz 55122, Germany
Mem Cogn (2015) 43:605–618DOI 10.3758/s13421-014-0490-2

paper aims to analyze how people mentally represent instruc-tional graphics. More specifically, it addresses the followingresearch questions:
– Is the distinction between surface and deep structures alsoapplicable to the comprehension of graphics?
– If yes, is the distinction associated with differences incognitive processing which result in different recall ofthe presented information?
– To what extent can these differences be manipulated byinstruction?
We will first describe a theoretical framework of graphicscomprehension. Thereafter we will report on two experimentstargeting these questions.
Theory
Structural features of graphics
A graphic is a two-dimensional object with a visuo-spatialstructure that represents some content based on structuralcommonalities between the representing graphic and the rep-resented content. In order to understand a graphic, a learnerneeds to perceive it. However, this is not sufficient for under-standing. Understanding requires the learner to grasp themeaning of the graphic by constructing a mental model ofits content (Kosslyn, 1994; Lowe, 1996; Pinker, 1990). Ac-cordingly, one can distinguish between a surface structure anda deep structure also with regard to graphics. Similar to thesurface structure of texts, the surface structure of graphics isthe outward form of the graphic, which can be actually per-ceived. It includes graphic elements such as dots, lines, areas,and their visual features (Bertin, 1981) as well as the spatialrelations between these elements (Gentner, 1989; Schnotz,1993). In contrast, the deep structure of a graphic is a semanticconstruct which expresses the meaning of the graphic. In otherwords, the deep structure directly represents the contentof the graphic.
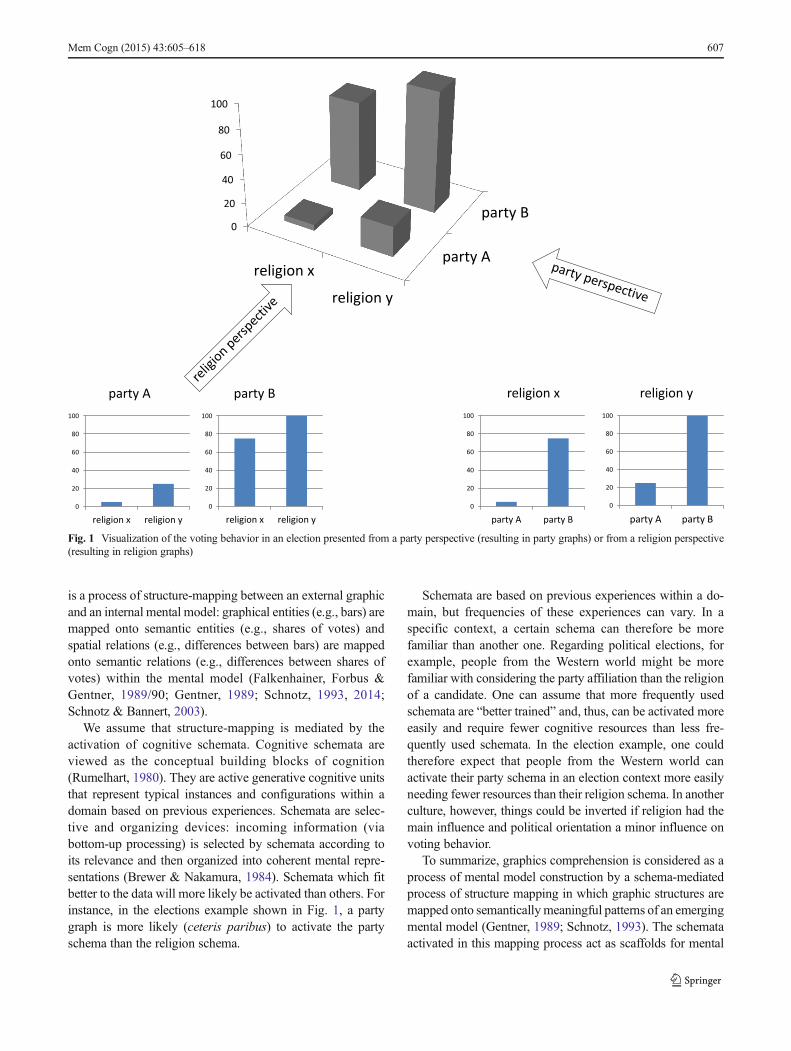
The difference between surface and deep structure ofgraphics can be illustrated by the following example. Let usassume that people’s voting behavior during an electionshould be displayed. In most Western countries, voters pri-marily choose a candidate who conforms to their own politicalorientation. Thus, political orientation is a major influence onvoting behavior. In contrast, the influence of religion is con-siderably weaker, although voters may also tend to vote for acandidate with the same religion. Thus, religion is a minorinfluence on voting behavior. Fig. 1 shows a fictitious exam-ple of voters with different political orientations (party Aversus party B) and with different religions (religion x versusreligion y). The three-dimensional (3D) bar chart reveals the
percentages of votes for the party B candidate (who hasreligion y) within voter categories Ax, Ay, Bx and By.
These data can be displayed from different perspectives.Data displayed from the party perspective results in two two-dimensional (2D) graphs. These graphs compare voters withparty A affiliation and voters with party B affiliation, onegraph referring to religion x voters and the other to religiony voters. These graphs are shown at the bottom right of Fig. 1.They are henceforth called “party graphs.”. Data display fromthe religion perspective results in two other 2D graphs. Thesegraphs compare voters with religion x and voters with religiony, one graph referring to party A’s affiliation and the other toparty B’s affiliation. The corresponding graphs are shown atthe bottom left of Fig. 1. They are henceforth called “religiongraphs.”. The party graphs and the religion graphs look dif-ferent and, thus, have different surface structures. However,they convey exactly the same data and, thus, are information-ally equivalent (Larkin & Simon, 1987). They can thereforebe assumed to have the same deep structure, which in this caseis characterized by the dominance of political orientationrather than religion with respect to voting behavior.
Perceptual and cognitive processing of graphics
We assume that similar to text comprehension, graphics com-prehension includes the formation of multiple mental repre-sentations based on perceptual and cognitive processing(Kosslyn, 1994; Lowe, 1996; Sadoski & Paivio, 2001). Per-ceptual processing is largely pre-attentive, bottom-up, anddata-driven (Neisser, 1976; Winn, 1994). Incoming visualdata are organized by highly automated visual routines(Ullman, 1984) according to the gestalt laws (Wertheimer,1938). This processing results in organized perceptual repre-sentations (i.e., visual images) which include figure-grounddistinctions (e.g., dark bars on a white background) as well asspatial relations between figures (e.g., one bar being higherthan another bar). Cognitive processing, on the contrary, ismore attentive and concept driven. It depends on the learner’sintentions as well as his/her prior knowledge and it includesboth bottom-up processes and top-down processes driven byconceptual schema which comprise the individual’s priorknowledge (Shah, Mayer & Hegarty, 1999). This processingresults in mental models that are assumed to possess aninherent structure corresponding to the structure of the subjectmatter (Johnson-Laird, 1983; Johnson-Laird & Byrne, 1991).In the election example mentioned above, the mental modelwould represent the dominance of political orientation withregard to voting behavior. Mental models are more abstractthan visual images because they can integrate informationfrom different modalities.
Graphics and mental models have in common that theyrepresent some content via structural commonalities. Accord-ingly, mental model construction via graphics comprehension
606 Mem Cogn (2015) 43:605–618
is a process of structure-mapping between an external graphicand an internal mental model: graphical entities (e.g., bars) aremapped onto semantic entities (e.g., shares of votes) andspatial relations (e.g., differences between bars) are mappedonto semantic relations (e.g., differences between shares ofvotes) within the mental model (Falkenhainer, Forbus &Gentner, 1989/90; Gentner, 1989; Schnotz, 1993, 2014;Schnotz & Bannert, 2003).
We assume that structure-mapping is mediated by theactivation of cognitive schemata. Cognitive schemata areviewed as the conceptual building blocks of cognition(Rumelhart, 1980). They are active generative cognitive unitsthat represent typical instances and configurations within adomain based on previous experiences. Schemata are selec-tive and organizing devices: incoming information (viabottom-up processing) is selected by schemata according toits relevance and then organized into coherent mental repre-sentations (Brewer & Nakamura, 1984). Schemata which fitbetter to the data will more likely be activated than others. Forinstance, in the elections example shown in Fig. 1, a partygraph is more likely (ceteris paribus) to activate the partyschema than the religion schema.
Schemata are based on previous experiences within a do-main, but frequencies of these experiences can vary. In aspecific context, a certain schema can therefore be morefamiliar than another one. Regarding political elections, forexample, people from the Western world might be morefamiliar with considering the party affiliation than the religionof a candidate. One can assume that more frequently usedschemata are “better trained” and, thus, can be activated moreeasily and require fewer cognitive resources than less fre-quently used schemata. In the election example, one couldtherefore expect that people from the Western world canactivate their party schema in an election context more easilyneeding fewer resources than their religion schema. In anotherculture, however, things could be inverted if religion had themain influence and political orientation a minor influence onvoting behavior.
To summarize, graphics comprehension is considered as aprocess of mental model construction by a schema-mediatedprocess of structure mapping in which graphic structures aremapped onto semanticallymeaningful patterns of an emergingmental model (Gentner, 1989; Schnotz, 1993). The schemataactivated in this mapping process act as scaffolds for mental
party A
party B0
20
40
60
80
100
religion xreligion y
religion x religion y
0
20
40
60
80
100
party A party B0
20
40
60
80
100
party A party B0
20
40
60
80
100
religion x religion y0
20
40
60
80
100
religion x religion y
party A party B
Fig. 1 Visualization of the voting behavior in an election presented from a party perspective (resulting in party graphs) or from a religion perspective(resulting in religion graphs)
Mem Cogn (2015) 43:605–618 607

model construction. The mediating function of schemata inmental model construction means that they shape the emerg-ing mental model by imposing their inherent structure on themodel according to their degree of activation.
Transparency of deep structures
As the deep structure of a graphic expresses the graphic’smeaning, it corresponds to the structure of the mental modelto be established. However, the deep structure may becomemore or less transparent depending on the congruence orincongruence with the surface structure. Tversky has pro-posed the congruence principle for the design of instructionalgraphics (Tversky, Heiser, Mackenzie, Lozano & Morrison,2008; Tversky, Morrison & Betrancourt, 2002). Accordingly,graphics should match the structure of the content and of thedesired mental representation in order to be effective forlearning. In terms of the present conceptual framework, thesurface structure should be attuned to the underlying deepstructure. If surface and deep structure are congruent, thesurface structure emphasizes the major features of the content.In this case, transparency of the deep structure is high. Ifsurface and deep structure are incongruent, the surface struc-ture emphasizes the minor features and, thus, obscures themajor ones. In this case, transparency of the deep structure islow. In the elections example shown in Fig. 1, political orien-tation is the major influence on voting behavior. Accordingly,party graphs are congruent with the underlying deep structureas they emphasize the major influence on voting behavior.Religion graphs, on the contrary, are incongruent as theyemphasize minor influence. If religion were the major influ-ence on voting behavior, however, religion graphs would becongruent and party graphs incongruent with the underlyingdeep structure.
Hypotheses regarding deep structure effects
Various studies have shown that the surface structure ofgraphics has an impact on the mental model construction oflearners (Ainsworth & Loizou, 2003; Tversky et al., 2008).Shah, Mayer and Hegarty (1999) showed that perceptualgrouping of information affects visual pattern association,which makes interpretation of graphics easier or more diffi-cult. Keehner, Hegarty, Cohen, Khooshabeh and Montello(2008) found that participants' performance was better whenthey had seen objects from a task-relevant perspective thanfrom another perspective. In other studies, graphics enhancedcomprehension only if the content was visualized in a task-appropriate way. Otherwise, the graphics interfered with theconstruction of a task-appropriate mental model (Rasch &Schnotz, 2009; Schnotz & Bannert, 2003; Schnotz &Kürschner, 2008). Various scholars have developed design
principles for graphics as practical guidelines (Cleveland,1985; Tufte, 1983, 1990, 1997; Wainer, 1997).
Up to now, however, no attempts have been made to ourknowledge to demonstrate deep structure effects on graphicscomprehension beyond surface structure effects. Differencesin mental representations generally manifest themselves indifferent achievements with specific tasks. The fact that amental model has been affected by the deep structure of agraphic becomes apparent if learners remember the learnedinformation better in a format making the deep structuretransparent than in another format, provided that surfacestructure effects have been controlled for. In the above-mentioned election example, one can hypothesize that indi-viduals remember the learned information better in a partygraph format than a religion graph format even if party graphsand religion graphs have been presented during learning withthe same frequency. To put it into more general terms:
(H1) Individuals remember the learned information in agraph format associated with the major influence betterthan in a format associated with the minor influence,even if both formats have been presented with the samefrequency during learning.
Deep structure features of a mental model become espe-cially apparent if learners remember the information better in aformat making the deep structure transparent although theyhave not seen it before than in a format they actually haveseen. In the above-mentioned election example, one can hy-pothesize that individuals remember the learned informationbetter in a party graph format than a religion graph formateven if they have actually seen religion graphs before. To put itinto more general terms:
(H2) Individuals remember the learned information in agraph format associated with the major influence betterthan in a format associated with the minor influence,even if they have actually seen graphs with the minorinfluence format before. In other words, they paradox-ically remember better what they have not seen thanwhat they actually have seen.
Hypotheses regarding instructional effects
Cognitive processing, contrary to pre-attentive perceptual pro-cessing, is influenced by the individual’s intentions which canin turn be affected by instruction. As for text processing,Pichert and Anderson (1977) demonstrated that readersinstructed to process text (e.g., about a house) from differentperspectives (e.g., burglar’s vs. broker’s perspective) con-structed different mental representations and had differentrecall. It should be noted that processing perspectives are
608 Mem Cogn (2015) 43:605–618
closely related to cognitive schemata. Displaying contentfrom a specific perspective means that some features arebrought to the foreground whereas others are moved tothe rear. Likewise, a cognitive schema emphasizes spe-cific features and ignores others. A burglar’s schema,for example, will emphasize valuables in a house butignore the quality of the roof, whereas a broker’s sche-ma will do the opposite.
The question arises whether instructions to process infor-mation from specific perspectives will have similar effects inlearning from graphics. In the above-mentioned electionsexample, an instruction to focus on voters with differentpolitical orientations should activate the party schema leadingto a mental model construction from the party perspective.Conversely, an instruction to focus on voters with differentreligions should activate the religion schema leading to amental model construction from the religion perspective.However, activation of schema might be moderated by addi-tional influences. First, schemata associated with a more fa-miliar perspective might be activated more easily by instruc-tion than other schemata. Second, because the cognitive ca-pacity for mental model construction is limited (Gyselinck,Meneghetti, De Beni & Pazzaglia, 2009), one can assume thata schema will be activated at the expense of the activation ofanother competing schema. This leads to a trade-off betweenschema activations due to interference. Third, as schemataassociated with less familiar perspectives might requiremore mental capacity (i.e., impose a higher cognitiveload on working memory; Chandler & Sweller, 1991),they might cause higher interference than schemata withmore familiar perspectives. Fourth, a schema will onlybe activated by a corresponding instruction if it has notbeen activated yet by other influences. Fifth, a schemacan only be inhibited by interference from another sche-ma if it has been activated by other influences before.Taking these moderating effects into account, one canmake the following predictions:
(H3) A cognitive schema will be inhibited by incongruentinstruction if it has been already activated and if theperspective suggested by the instruction is unfamiliarto the learner.
(H4) A cognitive schema will be activated by a congruentinstruction if it has not been activated yet and if theschema corresponds to a familiar, frequently usedperspective.
In order to test these hypotheses about deep structuremappings and about instructional effects in graphicscomprehension, two experiments were conducted. Theexperiments were complementary because features ofmajor importance in Experiment 1 became minor inExperiment 2, and vice versa.
Experiment 1
Participants
One hundred and fifty-seven students (116 females) fromdifferent faculties of a university in Germany participated inthis study. Their average age was 23.8 years (SD = 5.0).Participants were paid 10 Euros for participation. They wererandomly assigned to six different treatment groups to receivedifferent learning material with different instructions. Thegroups did not differ significantly in terms of their proportionof gender, χ2(5) = 7.21, p = .21. They did also not differsignificantly in terms of age, F(5,150) = 1.306, p = .26,η2 = .04).
Learning material
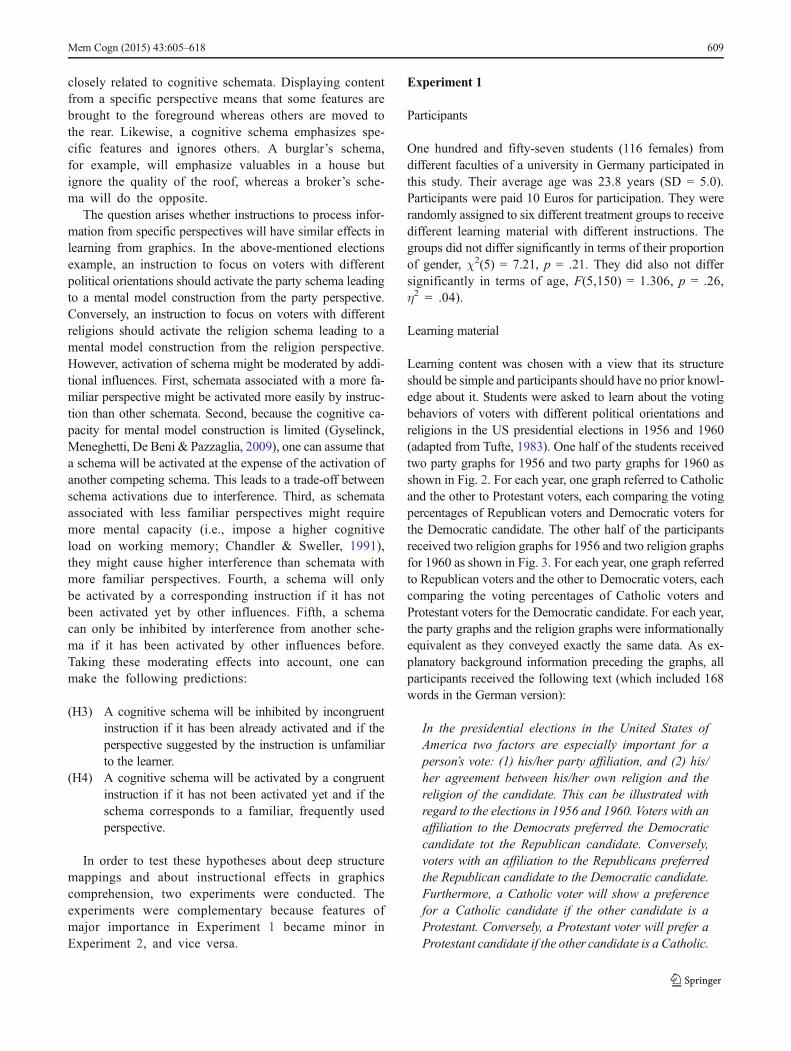
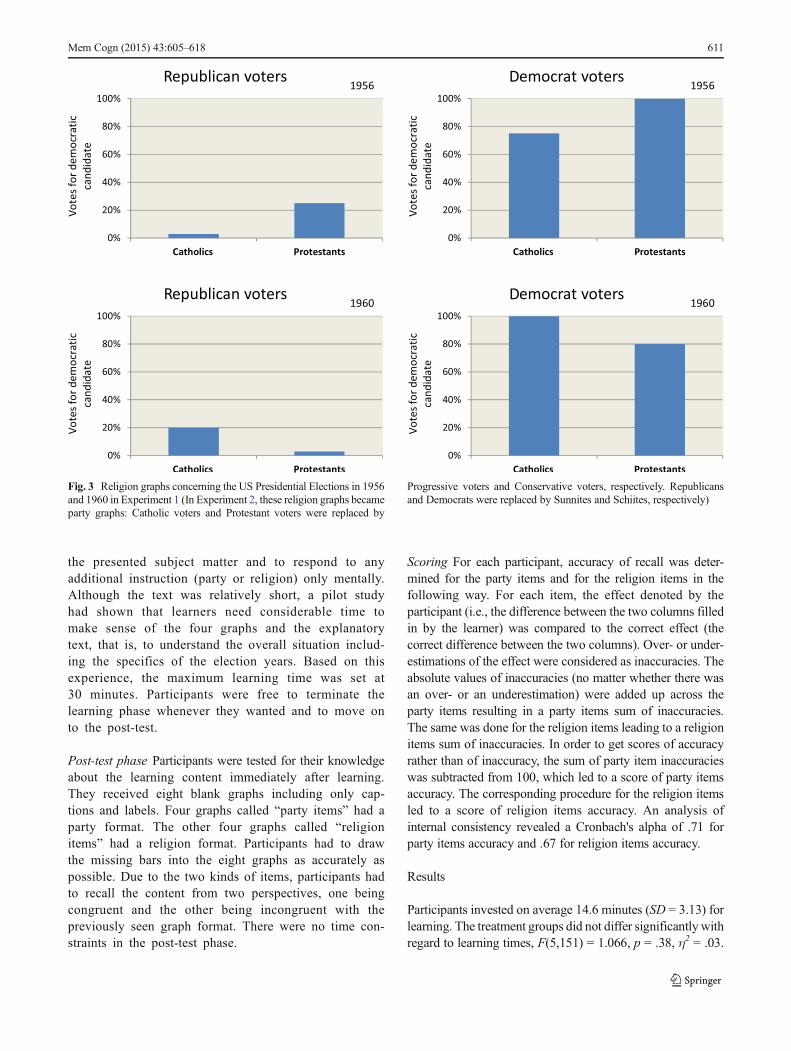
Learning content was chosen with a view that its structureshould be simple and participants should have no prior knowl-edge about it. Students were asked to learn about the votingbehaviors of voters with different political orientations andreligions in the US presidential elections in 1956 and 1960(adapted from Tufte, 1983). One half of the students receivedtwo party graphs for 1956 and two party graphs for 1960 asshown in Fig. 2. For each year, one graph referred to Catholicand the other to Protestant voters, each comparing the votingpercentages of Republican voters and Democratic voters forthe Democratic candidate. The other half of the participantsreceived two religion graphs for 1956 and two religion graphsfor 1960 as shown in Fig. 3. For each year, one graph referredto Republican voters and the other to Democratic voters, eachcomparing the voting percentages of Catholic voters andProtestant voters for the Democratic candidate. For each year,the party graphs and the religion graphs were informationallyequivalent as they conveyed exactly the same data. As ex-planatory background information preceding the graphs, allparticipants received the following text (which included 168words in the German version):
In the presidential elections in the United States ofAmerica two factors are especially important for aperson’s vote: (1) his/her party affiliation, and (2) his/her agreement between his/her own religion and thereligion of the candidate. This can be illustrated withregard to the elections in 1956 and 1960. Voters with anaffiliation to the Democrats preferred the Democraticcandidate tot the Republican candidate. Conversely,voters with an affiliation to the Republicans preferredthe Republican candidate to the Democratic candidate.Furthermore, a Catholic voter will show a preferencefor a Catholic candidate if the other candidate is aProtestant. Conversely, a Protestant voter will prefer aProtestant candidate if the other candidate is a Catholic.
Mem Cogn (2015) 43:605–618 609

The difference between voters’ behavior in 1956 and in1960 can be explained by the fact that in 1956 theDemocrat candidate was a Protestant and the Republi-can candidate was a Catholic, whereas in 1960 bothcandidates were Catholics. The corresponding votingpercentages are shown in the following graphics.(Adapted from Tufte, 1983).
The two groups of participants were further subdivided intothree subgroups which received different instructions in orderto trigger different kinds of processing. The first subgroupreceived no instruction. The second subgroup received a partyinstruction (congruent to party graphs and incongruent toreligion graphs):
How much did voters with a Democrat affiliation differfrom those with a Republican affiliation in their prefer-ence for the Democrat candidate?
A third subgroup received a religion instruction (con-gruent to religion graphs and incongruent to partygraphs):
How much did Protestant voters differ from Cath-olic voters in their preference for the Democratcandidate?
These questions were expected to be applied to each of thefour presented graphs.
Procedure
Pretest phase Because graphics-based mental model con-struction from different perspectives might require spatialskills, participants were tested for their spatial cognitive abil-ities with the 3D cube test of Gittler (1990) as a controlvariable. The treatment groups did not differ significantly interms of their spatial abilities, F(5,151) = 1.713, p = .14, η2 =.05. Furthermore, participants were interviewed regardingtheir prior knowledge about the US Presidential Elections in1956 and 1960. None of them reported any knowledge aboutthese elections.
Learning phase All participants received the 168-word textpresented above combined either with party graphs or religiongraphs – either with no instruction, party instruction, or reli-gion instruction. Accordingly, the study followed a 2 × 3design with the between factors graph (party graphs/religion graphs) and instruction (no instruction, party instruc-tion, or religion instruction). The participants were requestedto understand and memorize the learning material. They werenot allowed to take notes but asked to concentrate on
Fig. 2 Party graphs concerning theUS Presidential Elections in 1956 and1960 in Experiment 1 (In Experiment 2, these party graphs becamereligion graphs: Catholic voters and Protestant voters were replaced by
Progressive voters and Conservative voters, respectively. Republicansand Democrats were replaced by Sunnites and Schiites, respectively)
610 Mem Cogn (2015) 43:605–618
the presented subject matter and to respond to anyadditional instruction (party or religion) only mentally.Although the text was relatively short, a pilot studyhad shown that learners need considerable time tomake sense of the four graphs and the explanatorytext, that is, to understand the overall situation includ-ing the specifics of the election years. Based on thisexperience, the maximum learning time was set at30 minutes. Participants were free to terminate thelearning phase whenever they wanted and to move onto the post-test.
Post-test phase Participants were tested for their knowledgeabout the learning content immediately after learning.They received eight blank graphs including only cap-tions and labels. Four graphs called “party items” had aparty format. The other four graphs called “religionitems” had a religion format. Participants had to drawthe missing bars into the eight graphs as accurately aspossible. Due to the two kinds of items, participants hadto recall the content from two perspectives, one beingcongruent and the other being incongruent with thepreviously seen graph format. There were no time con-straints in the post-test phase.
Scoring For each participant, accuracy of recall was deter-mined for the party items and for the religion items in thefollowing way. For each item, the effect denoted by theparticipant (i.e., the difference between the two columns filledin by the learner) was compared to the correct effect (thecorrect difference between the two columns). Over- or under-estimations of the effect were considered as inaccuracies. Theabsolute values of inaccuracies (no matter whether there wasan over- or an underestimation) were added up across theparty items resulting in a party items sum of inaccuracies.The same was done for the religion items leading to a religionitems sum of inaccuracies. In order to get scores of accuracyrather than of inaccuracy, the sum of party item inaccuracieswas subtracted from 100, which led to a score of party itemsaccuracy. The corresponding procedure for the religion itemsled to a score of religion items accuracy. An analysis ofinternal consistency revealed a Cronbach's alpha of .71 forparty items accuracy and .67 for religion items accuracy.
Results
Participants invested on average 14.6 minutes (SD = 3.13) forlearning. The treatment groups did not differ significantly withregard to learning times, F(5,151) = 1.066, p = .38, η2 = .03.
Fig. 3 Religion graphs concerning the US Presidential Elections in 1956and 1960 in Experiment 1 (In Experiment 2, these religion graphs becameparty graphs: Catholic voters and Protestant voters were replaced by
Progressive voters and Conservative voters, respectively. Republicansand Democrats were replaced by Sunnites and Schiites, respectively)
Mem Cogn (2015) 43:605–618 611
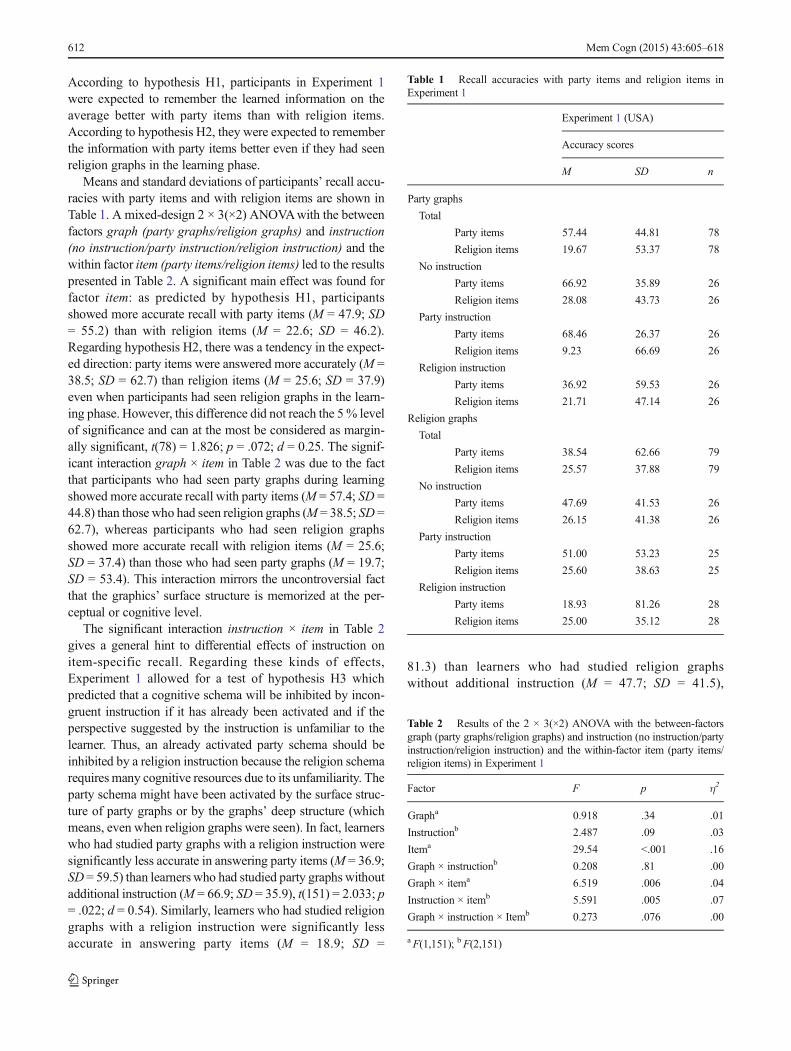
According to hypothesis H1, participants in Experiment 1were expected to remember the learned information on theaverage better with party items than with religion items.According to hypothesis H2, they were expected to rememberthe information with party items better even if they had seenreligion graphs in the learning phase.
Means and standard deviations of participants’ recall accu-racies with party items and with religion items are shown inTable 1. A mixed-design 2 × 3(×2) ANOVAwith the betweenfactors graph (party graphs/religion graphs) and instruction(no instruction/party instruction/religion instruction) and thewithin factor item (party items/religion items) led to the resultspresented in Table 2. A significant main effect was found forfactor item: as predicted by hypothesis H1, participantsshowed more accurate recall with party items (M = 47.9; SD= 55.2) than with religion items (M = 22.6; SD = 46.2).Regarding hypothesis H2, there was a tendency in the expect-ed direction: party items were answered more accurately (M =38.5; SD = 62.7) than religion items (M = 25.6; SD = 37.9)even when participants had seen religion graphs in the learn-ing phase. However, this difference did not reach the 5% levelof significance and can at the most be considered as margin-ally significant, t(78) = 1.826; p = .072; d = 0.25. The signif-icant interaction graph × item in Table 2 was due to the factthat participants who had seen party graphs during learningshowed more accurate recall with party items (M = 57.4; SD =44.8) than those who had seen religion graphs (M = 38.5; SD =62.7), whereas participants who had seen religion graphsshowed more accurate recall with religion items (M = 25.6;SD = 37.4) than those who had seen party graphs (M = 19.7;SD = 53.4). This interaction mirrors the uncontroversial factthat the graphics’ surface structure is memorized at the per-ceptual or cognitive level.
The significant interaction instruction × item in Table 2gives a general hint to differential effects of instruction onitem-specific recall. Regarding these kinds of effects,Experiment 1 allowed for a test of hypothesis H3 whichpredicted that a cognitive schema will be inhibited by incon-gruent instruction if it has already been activated and if theperspective suggested by the instruction is unfamiliar to thelearner. Thus, an already activated party schema should beinhibited by a religion instruction because the religion schemarequires many cognitive resources due to its unfamiliarity. Theparty schema might have been activated by the surface struc-ture of party graphs or by the graphs’ deep structure (whichmeans, even when religion graphs were seen). In fact, learnerswho had studied party graphs with a religion instruction weresignificantly less accurate in answering party items (M = 36.9;SD = 59.5) than learners who had studied party graphs withoutadditional instruction (M = 66.9; SD = 35.9), t(151) = 2.033; p= .022; d = 0.54). Similarly, learners who had studied religiongraphs with a religion instruction were significantly lessaccurate in answering party items (M = 18.9; SD =
81.3) than learners who had studied religion graphswithout additional instruction (M = 47.7; SD = 41.5),
Table 1 Recall accuracies with party items and religion items inExperiment 1
Experiment 1 (USA)
Accuracy scores
M SD n
Party graphs
Total
Party items 57.44 44.81 78
Religion items 19.67 53.37 78
No instruction
Party items 66.92 35.89 26
Religion items 28.08 43.73 26
Party instruction
Party items 68.46 26.37 26
Religion items 9.23 66.69 26
Religion instruction
Party items 36.92 59.53 26
Religion items 21.71 47.14 26
Religion graphs
Total
Party items 38.54 62.66 79
Religion items 25.57 37.88 79
No instruction
Party items 47.69 41.53 26
Religion items 26.15 41.38 26
Party instruction
Party items 51.00 53.23 25
Religion items 25.60 38.63 25
Religion instruction
Party items 18.93 81.26 28
Religion items 25.00 35.12 28
Table 2 Results of the 2 × 3(×2) ANOVA with the between-factorsgraph (party graphs/religion graphs) and instruction (no instruction/partyinstruction/religion instruction) and the within-factor item (party items/religion items) in Experiment 1
Factor F p η2
Grapha 0.918 .34 .01
Instructionb 2.487 .09 .03
Itema 29.54 <.001 .16
Graph × instructionb 0.208 .81 .00
Graph × itema 6.519 .006 .04
Instruction × itemb 5.591 .005 .07
Graph × instruction × Itemb 0.273 .076 .00
aF(1,151); bF(2,151)
612 Mem Cogn (2015) 43:605–618

t(151) = 1.985; p = .025; d = 0.52.). Accordingly,hypothesis H3 was supported by the results.
Discussion
As a whole, the results provided limited support for theassumption that the graphic’s deep structure is mapped onthe structure of the emerging mental model. In this experi-ment, the deep structure reflected the fact that the politicalorientation had a major influence and religion a minor influ-ence on voting behavior. As predicted by hypothesis H1,learners recalled the content with party items significantlymore accurately than with religion items, although the re-quired item responses were informationally equivalent andalthough both kinds of graphs were presented during learningwith the same frequency. Hypothesis H2 predicted that evenparticipants who had seen religion graphs in the learningphase would have more accurate recall with party items thanwith religion items. This effect was not statistically significant.There was only a difference in the expected direction whichcould at most be considered as marginally significant. Fur-thermore, the results confirmed the noncontroversial assump-tion that the surface structure of graphics is also mentallypresented (Ainsworth & Loizou, 2003; Glenberg & Langston,1992; Schnotz & Bannert, 2003; Schnotz & Kürschner, 2008;Tversky et al., 2008). Participants who had learned with partygraphs showed on average more accurate recall with partyitems than with religion items. Those who had learned withreligion graphs showed on the average more accurate recallwith religion items than with party items.
Given the limited support for the abovementioned hypoth-eses, the findings should at this point be interpreted verycarefully. They can be considered as a tentative hint that thedeep structure of graphics is mentally represented due to aprocess of structure mapping. This is noteworthy insofar asrecall took place in this study immediately after learning,which should favor mental representations of the surfacestructure compared to mental representations of the deepstructure. From a broader point of view, the findings suggestthat graphics comprehension is not a mechanical mapping ofsurface features onto a mental model but a process of activesense-making (Mayer, 2009; Wittrock, 1989). Learners en-gage in active cognitive processing to construct coherentknowledge structures in the form of an appropriate mentalmodel based on information including the graphic’s surfacestructure as well as its deep structure.
Regarding instructional effects, the data supported the as-sumption that a cognitive schema will be inhibited by anincongruent instruction if it has already been activated and ifthe perspective suggested by the instruction is unfamiliar tothe learner (hypothesis H3). In the present study, the partyschema might have been activated anyway by the graphics’deep structure, and the religion perspective might have been
unfamiliar in the context of elections. Accordingly, learnerswho were instructed to adopt the unfamiliar religion perspec-tive showed significantly lower recall accuracy with partyitems than learners without instruction. It seems that theunfamiliar religion perspective interfered with the activationof the party schema. Additional cognitive activation doesobviously not necessarily result in better learning (cf. Spiro,Feltovich, Jacobson & Coulson, 1991). Further moderatingfactors have to be taken into account in order to predictinstructional effects. Such factors might include the currentamount of schema pre-activation. It might also include thefamiliarity of the corresponding perspective, which impliesthat some schemata can be activated more easily than others.There is obviously a possibility that activation of one schemainhibits the activation of another schema. A schemarepresenting a less familiar perspective might cause moreinterference as it requires higher cognitive effort than a sche-ma with a more familiar perspective (cf. Chandler & Sweller,1991). These topics need further investigation.
The participants of Experiment 1 came from a Westernculture. In the context of elections, a party perspective mighthave been more familiar to them than a religion perspective.The learning content of this study also implied that the polit-ical orientation was of major influence on voting behavior. Inorder to control for this confounding factor, a second experi-ment was conducted in which the graphics’ deep structure wasmanipulated in a way that the roles of the religion perspectiveand the party perspective were reversed.
Experiment 2
Participants
One hundred and thirty-four students (96 women) from dif-ferent faculties of a university in Germany participated in thisstudy. Their average age was 23.0 years (SD = 4.45). Partic-ipants were randomly assigned to six treatment groups. Thegroups did not differ either in terms of gender proportion orage significantly; χ2(5) = 3.18, p = .67 and F(5,128) = 0.419,p = .84, η2 = .02, respectively. Students were paid 10 Euros forparticipation.
Learning material
Participants were required to learn about voting behaviorduring the elections in 1956 and in 1960 in a fictitious foreigncountry, the Republic of Ustan, where the religious orientation(Schiites vs. Sunnites) is the most important influence onvoting behavior, whereas the party affiliation (conservativesversus progressives) has only secondary influence. One half ofthe participants received two religion graphs for 1956 and two
Mem Cogn (2015) 43:605–618 613

religion graphs for 1960. These graphs were identical withthose shown in Fig. 2, except that Republicans and Democratswere replaced by Sunnites and Schiites, and Catholic votersand Protestant voters were replaced by Progressive voters andConservative voters, respectively. So, the party graphs ofExperiment 1 became religion graphs in Experiment 2. Theother half of the participants received two party graphs for1956 and two party graphs for 1960. These graphs wereidentical with those in Fig. 3, except for the abovementionedreplacements. So, the religion graphs of Experiment 1 becameparty graphs in Experiment 2. All participants received thefollowing text (which included 171 words in the Germanversion) preceding the graphs as background information:
In the presidential elections in the Republic of Ustan,two factors are especially important for a person’s vote:(1) his/her agreement between his/her own religion andthe religion of the candidate, and (2) his/her partyaffiliation. This can be illustrated with regard to theelections in 1956 and 1960. Schiite voters preferredthe Schiite candidate to the Ssunnite candidate. Con-versely, Sunnite voters preferred the Sunnite candidateto the Schiite candidate. Furthermore, a voter with anaffiliation to the Progressive party shows a preferencefor the Progressive candidate, if the other candidate isConservative. Conversely, a voter with an affiliation tothe Conservative party prefers the Conservative candi-date, if the other candidate is Progressive.The difference between voters’ behavior in 1956 and in1960 can be explained by the fact that in 1956 a con-servative Schiite candidate competed with a Progressivesunnite candidate, whereas in 1960 the Schiite candi-date and the Sunnite candidate were both members ofthe Progressive party. The corresponding voting per-centages are shown in the following graphics.
Just as in Experiment 1, both groups were furthersubdivided into three subgroups. The first subgroup receivedno instruction, the second subgroup received a religion in-struction, and the third subgroup received a party instruction.
Procedure and scoring
The procedure of Experiment 2 was exactly the same as inExperiment 1, except that participants were not asked abouttheir prior knowledge, because the content was fictitious.Scoring was also done in exactly the same way as in theprevious study.
Results
Participants invested on average 18.4 minutes (SD = 5.08) forlearning. The treatment groups did not differ significantly with
regard to learning times, F(5,128) = 0.244, p = .95, η2 = .01.According to hypothesis H1, learners in Experiment 2 wereexpected to remember the information on average better withreligion items than with party items. According to hypothesisH2, they were expected to remember the information withreligion items better even if they had seen party graphs in thelearning phase.
Means and standard deviations of participants’ recall accu-racies with party items and with religion items are shown inTable 3. A mixed-design 2 × 3(×2) ANOVAwith the betweenfactors graph (party graphs/religion graphs) and instruction(no instruction/party instruction/religion instruction) and thewithin factor item (party items/religion items) led to the resultspresented in Table 4. A significant main effect was found forfactor item: as expected according to hypothesis H1, partici-pants showed more accurate recall with religion items (M =62.3; SD = 47.7) than with party items (M = 32.6; SD = 35.5).
Table 3 Recall accuracies with party items and religion items inExperiment 2
Experiment 2 (Ustan)
Accuracy scores
M SD n
Party graphs
Total
Party items 37.93 24.53 67
Religion items 58.58 52.21 67
No instruction
Party items 41.30 24.18 23
Religion items 56.30 58.95 23
Party instruction
Party Items 40.00 24.88 22
Religion items 63.64 45.18 22
Religion instruction
Party items 32.32 24.69 22
Religion items 55.91 53.36 22
Religion graphs
Total
Party items 27.31 43.33 67
Religion items 65.97 42.89 67
No instruction
Party items 25.22 41.76 23
Religion items 69.35 30.87 23
Party instruction
Party items 40.00 20.24 22
Religion items 56.14 60.32 22
Religion instruction
Party items 16.82 58.10 22
Religion items 72.27 31.46 22
614 Mem Cogn (2015) 43:605–618

As predicted by hypothesis H2, recall accuracy was signifi-cantly higher with religion items (M = 58.6; SD = 52.2) thanwith party items (M = 37.9; SD = 24.5) even when participantshad seen party graphs in the learning phase, t(66) = 3.83; p <.001; d = 0.51. In other words, these students paradoxicallyshowed better recall of what they had not seen than of whatthey really had seen before.
The significant interaction graph × item in Table 2 mirrorsthe fact that participants who had seen religion graphs showedon average more accurate recall with religion items (M = 66.0;SD = 42.9) than participants who had seen party graphs (M =58.6; SD = 52.2), whereas participants who had seen partygraphs showed more accurate recall with party items (M =37.9; SD = 24.5) than participants who had seen religiongraphs (M = 27.3; SD = 43.3). Once again, this interactionsuggests that besides graphics’ deep structures, their surfacestructures are also mentally represented.
Experiment 2 allowed for a test of hypothesis H4 whichpredicted that a cognitive schema will be activated by acongruent instruction if it has not been activated yet and ifthe schema corresponds to a familiar, frequently used perspec-tive. In the present study, where religion had a major effect onvoting, religion graph learners had no reason to activate theirparty schema. Under these conditions, a party instructionshould be effective because the party perspective is familiarto the learners. In fact, religion graph learners with partyinstruction showed more accurate party items recall (M =40.0; SD = 20.2) than religion graph learners without instruc-tion (M = 25.2; SD = 41.8). However, this difference did notreach the 5 % level of significance and can despite a moderateeffect strength only be considered as marginally significant,t(32.1) = 1.521; p = .069; d = 0.42).
Discussion
In this experiment, the roles of religion and party affiliationwere reversed compared to the previous Experiment 1:
religion became the major effect, whereas party affiliationwas of minor importance for voting behavior. Although theparticipants still came from a Western culture, where a partyperspective might be more familiar in the context of electionsthan a religion perspective, the result pattern changed funda-mentally. As predicted by hypothesis H1, learners recalled thecontent with religion items significantly more accurately thanwith party items, although the required item responses wereinformationally equivalent and although both kinds of graphswere presented with the same frequency during learning.Hypothesis H2 had predicted that even participants who hadseen only party graphs in the learning phase would neverthe-less have more accurate recall with religion items than withparty items. This hypothesis was also confirmed by a highlysignificant effect. That is, students showed better recall ofwhat they had not seen than of what they really had seenbefore. Furthermore, the findings showed once again thatbesides their deep structure, the surface structure of graphicsaffects the mental representation too (cf. Ainsworth & Loizou,2003; Schnotz & Bannert, 2003; Schnotz & Kürschner, 2008;Tversky et al., 2008).
As a whole, the findings support the assumption that duringgraphics comprehension, the graphic’s deep structure affectsthe structure of the emerging mental model. At a general level,the findings suggest once again that graphics comprehensionis an active process of sense-making based on surface anddeep structure information rather than a mechanical mappingof surface features onto a mental model (Mayer, 2009;Wittrock, 1989).
A tendency was found only according to hypothesis H4,which had predicted that religion graph learners who wereinstructed to adopt the (highly familiar) party perspectivewould show more accurate recall with party items than thosewho were not. There was only a marginally significant effectwhich should be interpreted very cautiously. As there was nosignificant main effect of instruction, one can once againsuspect that additional cognitive activation per se does notgenerally result in better learning. However, it would bepremature to draw definite conclusions on the basis of thecurrent data regarding the moderation of instructional effectsby schema activation, familiarity and competing schemata.Further research is needed on this issue.
General discussion
After decades of intensive text processing research, compre-hension of graphics receives increased interest in multimediaresearch. Graphics have usually been viewed as a complementto texts: they provide an additional code (Paivio, 1986;Sadoski & Paivio, 2001), allow elaborate conjoint processing(Kulhavy, Stock & Caterino, 1994), or enable the construction
Table 4 Results of the 2 × 3(×2) ANOVAwith between-factors graph(party graphs/religion graphs) and instruction (no instruction/partyinstruction/religion instruction) and the within-factor item (party items/religion items) in Experiment 2
Factor F p η2
Grapha 0.076 .78 .00
Instructionb 0.315 .73 .01
Itema 46.645 <.001 .27
Graph × iInstructionb 0.042 .96 .00
Graph × itema 4.215 .021 .03
Instruction × itemb 1.679 .19 .03
Graph × instruction × itemb 2.116 .13 .03
aF(1,128); bF(2,128)
Mem Cogn (2015) 43:605–618 615
of an additional mental model (Mayer, 2009). The structuralaspect of graphics, however, received little attention so far (cf.Glenberg & Langston, 1992).
In this article, we have argued that graphics have a percep-tual surface structure and a semantic deep structure. Whendifferent graphics convey the same information in differentways they look different and have therefore different surfacestructures. Because they are informationally equivalent(Larkin & Simon, 1987), however, they possess the samedeep structure. Graphics comprehension is considered a pro-cess of structure mapping from a graphic onto a correspondingmental model based on surface structure as well as deepstructure characteristics (cf. Falkenhainer et al., 1989, 1990;Gentner, 1989; Schnotz, 2014; Schnotz & Bannert, 2003).The mapping process is assumed to take place under theguidance of cognitive schemata as building blocks of cogni-tion (Brewer &Nakamura, 1984; Rumelhart, 1980). Activatedschemata serve as scaffolds for mental model construction (cf.Eitel, Scheiter & Schüler, 2012).
The idea that graphics comprehension implies perceptualsurface structure and semantic deep structure mappings is inline with the research by Knauff and Johnson-Laird (2002)who showed that mental models can differ from visual imagesand that different brain areas are involved in creating visualimages and spatially organized mental models (Knauff,Fangmeier, Ruff & Johnson-Laird, 2003; Knauff, Mulack,Kassubek, Saligh & Greenlee, 2002). Evidence for a distinc-tion between visual and spatial components in processing ofverbal and pictorial information was also found by Gyselinckand her colleagues (Gyselinck, Ehrlich, Cornoldi, de Beni andDubois, 2000; Gyselinck, Cornoldi, Ehrlich, Dubois, & deBeni, 2002).
Two experiments were conducted in order to test the as-sumptions about deep structure mappings in graphics com-prehension. Surface structure as well as deep structure char-acteristics were systematically varied across the two studies.The cultural background of participants was kept constant. Itcould therefore not account for different results between theexperimental conditions. Both studies confirmed that thestructure of the emerging mental model during graphics com-prehension is affected not only by the graphic’s surface struc-ture but also by its deep structure. In both studies, participantsrecalled the learned information significantly more accuratelyif the item format was congruent (rather than incongruent)with the deep structure, although the required item responseswere informationally equivalent and although the differentkinds of graphs were presented with the same frequencyduring learning. If surface structure and deep structure wereincongruent, participants had nevertheless more accurate re-call with item formats congruent to the deep structure thanitem formats congruent to the surface structure. In this case,students showed paradoxically better recall of what they hadnot seen than of what they really had seen before during
learning. This effect was only marginally significant in thefirst experiment, but highly significant in the second experi-ment. It should be kept in mind that the participants had torecall the information immediately after learning, whichshould favor recall of the surface rather than the deepstructure.
These findings rule out the idea of graphics comprehensionas a mechanical one-on-one mapping of surface graphicalfeatures onto features of the mental model. Instead, it corrob-orates the view that humans are active sense makers (Mayer,2009; Wittrock, 1989) who engage in constructing coherentmental representations from the available information. Ac-cordingly, graphics comprehension is an adaptive process ofmapping perceptual surface structures as well as semanticdeep structures onto an emerging mental model in whichlearners can compensate to some extent for inappropriatevisualization formats.
In both studies, some participants were instructed to answera question from a specific perspective in order to triggeradditional cognitive processing. The findings did not supportthe view that this leads generally to a more elaborated mentalrepresentation. Asking questions was admittedly only a weakinstructional manipulation. Nevertheless, it seems that theactivation of cognitive schemata which guide the process ofmental model construction is affected by multiple factors thathave to be taken into account. The activation of a schema byinstruction can interfere with the activation of another schema,whereby the amount of interference would depend on thecognitive load imposed by the interfering schema (Chandler& Sweller, 1991). Schemata representing a more familiarperspective might be easier to activate, whereas less familiarperspectives might impose a higher cognitive load on workingmemory resulting in stronger interference effects. These topicsdeserve further investigation.
The two experiments varied both the perceptual surfacestructure and the semantic deep structure of graphics, butconfined themselves to one graph format: bar graphs. Accord-ingly, future investigations should also deal with other types ofgraphics. Furthermore, learners’ prior knowledge was notsystematically varied in the two experiments. This might alsobe an important issue for further research, because learners donot necessarily possess all relevant cognitive schemata forunderstanding graphs (Pinker, 1990).
As for the practical implications, the above findings cor-roborate the importance of adequate design of graphics interms of congruence between semantic content, visualizationformat, and intended usage of the emerging mental represen-tation (Tversky et al., 2008). It is not sufficient to delivercorrect information via graphics. It is also important to choosean appropriate perceptual format for the display of informa-tion corresponding to a perspective that makes the intendedsemantic deep structure as transparent as possible (cf.Ainsworth & Loizou, 2003; Rasch & Schnotz, 2009; Schnotz
616 Mem Cogn (2015) 43:605–618

& Bannert, 2003). In other words, one has to avoid thatperceptually salient but thematically irrelevant features dom-inate cognition via perception (Lowe, 1996).
The above findings suggest that enhancing graphics com-prehension by visual design and learners’ cognitive activationinduced by instruction is not a matter of simple rules of thumb.It seems to be a matter of complex interactions betweenperceptual surface structures, semantic deep structures, per-spectives of different familiarity, cognitive schemata associat-ed with these perspectives, and interference between schema-ta, whereby interference depends on the cognitive load im-posed by the interfering schema. All these interactions seem toco-determine the process of construction of mental models ingraphics comprehension. A deeper understanding of theseprocesses will improve our chances to develop adequateguidelines of using graphics for visual knowledgecommunication.
Acknowledgments We are grateful to Christian Kürschner for hisconceptual input and his support for both experiments. We also thankTina Seufert for her help in preparing Experiment 1 and Alexander Frey,Niccola Soccodato, and Angelika Sommer for their support in running theexperiments. Furthermore, we want to thank Amy Johnson for her criticalremarks and suggestions based on a former version of this paper.
References
Ainsworth, S., & Loizou. (2003). The effects of self-explaning whenlearning with text or diagrams. Cognitive Science, 27, 669–681.
Bertin, J. (1981). Graphics and graphic-information-processing. Berlin/New York: Walter de Gruyter.
Brewer, W. F., & Nakamura, G. V. (1984). The nature and functions ofschemas. In R. S. Wyer & T. K. Srull (Eds.), Handbook of socialcognition (Vol. 1, pp. 119–160). Hillsdale, N.J.: Erlbaum.
Chafe, W. L. (1970). Meaning and the structure of language. Chicago:University of Chicago Press.
Chandler, P., & Sweller, J. (1991). Cognitive load theory and the formatof instruction. Cognition and Instruction, 8(4), 293–332.
Chomsky, N. (1965). Aspects of the theory of syntax. Cambridge MA:MIT Press.
Cleveland, W. S. (1985). The elements of graphing data. New York:Chapman and Hall.
Eitel, A., Scheiter, K., & Schüler, A. (2012). The time course of infor-mation extraction from instructional diagrams. Perceptual andMotor Skills: Learning & Memory, 115(3), 677–701.
Falkenhainer, B., Forbus, K.D., & Gentner, D. (1989/90). The structure-mapping enginge: Algorithm and examples. Artificial Intelligence,41, 1–63.
Fillmore, C. J. (1968). The case for case. In E. Bach & R. Harms (Eds.),Universals in linguistic theory (pp. 1–88). NewYork: Holt, Rinehart& Winston.
Gentner, D. (1989). The mechanisms of analogical learning. In S.Vosniadou & A. Ortony (Eds.), Similarity and analogical reasoning(pp. 197–241). Camebridge: Camebridge University Press.
Gittler, G. (1990). Dreidimensionaler Würfeltest (3DW). Ein Rasch-s k a l i e r t e r Te s t z u r M e s s u n g d e s r ä u m l i c h e nVorstellungsvermögens. [3D cube test. A Rasch-scaled test for mea-suring spatial imaginative ability.] Weinheim: Beltz Test GmbH.
Glenberg, A.M., &Langston,W. E. (1992). Comprehension of illustratedtext: Pictures help to build mental models. Journal of Memory andLanguage, 31, 129–151.
Graesser, A. C., Millis, K. K., & Zwaan, R. A. (1997). Discoursecomprehension. Annual Review of Psychology, 48, 163–189.
Gyselinck, V., Cornoldi, C., Ehrlich, M.-F., Dubois, V., & deBeni, R. (2002). Visuospatial memory and phonological loopin processing texts and illustrations. Applied CognitivePsychology, 16, 665–685.
Gyselinck, V., Ehrlich, M.-F., Cornoldi, C., de Beni, R., & Dubois, V.(2000). Visuospatial working memory in learning from multimediasystems. Journal of Computer Assisted Learning, 16, 166–176.
Gyselinck, V., Meneghetti, C., De Beni, R., & Pazzaglia, F. (2009). Therole of working memory in spatial texts processing: What benefit ofimagery strategy and visuospatial abilities? Learning and IndividualDifferences, 19, 12–20.
Johnson-Laird, P. N. (1983).Mental Models. Towards a cognitive scienceof language, inference, and consciousness. Cambridge: CambridgeUniversity Press.
Johnson-Laird, P. N., & Byrne, R.M. J. (1991).Deduction. Hillsdale, NJ:Lawrence Erlbaum.
Keehner, M., Hegarty, M., Cohen, C. A., Khooshabeh, P., &Montello, D.R. (2008). Spatial reasoning with external visualizations: Whatmatters is what you see, not whether you interact. CognitiveScience, 32, 1099–1132.
Kintsch, W. (1998). Comprehension: A paradigm for cognition. NewYork: Cambridge University Press.
Knauff, M., & Johnson-Laird, P. N. (2002). Visual imagery can impedereasoning. Memory & Cognition, 30(3), 363–371.
Knauff, M., Fangmeier, T., Ruff, C. C., & Johnson-Laird, P. N. (2003).Reasoning, models, and images: Behavioral measures and corticalactivity. Journal of Cognitive Neuroscience, 15(4), 559–573.
Knauff, M., Mulack, T., Kassubek, J., Salih, H. R., & Greenlee, M. W.(2002). Spatial imagery in deductive reasoning: A functional MRIstudy. Cognitive Brain Research, 13, 203–212.
Kosslyn, S. M. (1994). Image and brain. Cambridge, MA: MIT Press.Kulhavy, R. W., Stock, W. A., & Caterino, L. C. (1994). Reference maps
as a framework for remembering text. In W. Schnotz & R. W.Kulhavy (Eds.), Comprehension of graphics (pp. 153–162).Amsterdam: Elsevier Science B.V.
Larkin, J. H., & Simon, H. A. (1987). Why a diagram is (sometimes)worth ten thousand words. Cognitive Science, 11, 65–99.
Lowe, R. K. (1996). Background knowledge and the construction of asituational representation from a diagram. European Journal ofPsychology of Education, 11, 377–397.
Mayer, R. E. (2009). Multimedia learning. New York: CambridgeUniversity Press.
McNamara, D. S. (Ed.). (2007). Reading comprehension strategies:Theories, interventions, and technologies. New York: LawrenceErlbaum.
Neisser, U. (1976). Cognition and reality. San Francisco: Freeman.Paivio, A. (1986). Mental representations: A dual coding approach.
Oxford, England: Oxford University Press.Pichert, J.W., &Anderson, R. C. (1977). Taking different perspectives on
a story. Journal of Educational Psychology, 69, 309–315.Pinker, S. (1990). A theory of graph comprehension. In R. Freedle (Ed.),
Artificial intelligence and the future of testing (pp. 73–126).Hillsdale, NJ: Erlbaum.
Rasch, T., & Schnotz, W. (2009). Interactive and non-interactive picturesin multimedia learning environments: Effects on learning outcomesand learning efficiency. Learning and Instruction, 19, 411–422.
Rumelhart, D. E. (1980). Schemata: The building blocks of cognition. InR. J. Spiro, B. C. Bruce, &W. F. Brewer (Eds.), Theoretical issues inreading comprehension (pp. 33–58). Hillsdale, N.J.: Erlbaum.
Sachs. (1967). Recognition memory for syntactic and semantic aspects ofa connected discourse. Perception and Psychophysics, 2, 437–442.
Mem Cogn (2015) 43:605–618 617
Sadoski, M., & Paivio, A. (2001). Imagery and text. A dual coding theoryof reading and writing. Mahwah NJ: Erlbaum.
Schnotz, W. (1993). On the relation between dual coding and mentalmodels in graphics comprehension. Learning and Instruction, 3,247–249.
Schnotz, W. (2014). Integrated model of text and picture comprehension.In R. E. Mayer (Ed.), Cambridge handbook of multimedia learning(2nd ed., pp. 72–103). Cambridge: Cambridge University Press.
Schnotz, W., & Bannert, M. (2003). Construction and interference inlearning from multiple representations. Learning and Instruction,13, 141–156.
Schnotz, W., & Kulhavy, R.W. (1994). Comprehension of graphics.Volume in the series Advances in Psychology. Amsterdam:Elsevier Publishers.
Schnotz, W., & Kürschner, C. (2008). External and internal representa-tions in the acquisition and use of knowledge: Visualization effectson mental model construction. Instructional Science, 36, 175–190.
Shah, P., Mayer, R. E., & Hegarty, M. (1999). Graphs as aids to knowl-edge construction: Signaling techniques for guiding the process ofgraph comprehension. Journal of Educational Psychology, 91(4),690–702.
Spiro, R. J., Feltovich, P. J., Jacobson, M. J., & Coulson, R. L. (1991).Knowledge representation, content specification, and the develop-ment of skill in situation-specific knowledge assembly: Someconstructvist issues as they relate to cognitive flexibility theoryand hypertext. Educational Technology, 31(9), 22–25.
Tufte, E. R. (1983). The visual display of quantitative information.Cheshire CT: Graphics Press.
Tufte, E. R. (1990). Envisioning information. Cheshire CT: GraphicsPress.
Tufte, E. R. (1997). Visual explanations. Images and quantities, evidenceand narrative. Cheshire CT: Graphics Press.
Tversky, B., Heiser, J., Mackenzie, R., Lozano, S., &Morrison, J. (2008).Enriching animations. In R. K. Lowe&W. Schnotz (Eds.), Learningwith animation. Research implications for design (pp. 263–285).New York: Cambridge University Press.
Tversky, B.,Morrison, J. B., &Betrancourt,M. (2002). Animation: Can itfacilitate? International Journal of Human-Computer Studies, 57,247–262.
Ullman, S. (1984). Visual routines. Cognition, 18, 97–159.Van Dijk, T. A., & Kintsch, W. (1983). Strategies of discourse
comprehension. New York: Academic Press.Wainer, H. (1997). Visual revelations. Graphic tales of fate and deception
from Napoleon Bonaparte to Ross Perot. Mahwah, NJ: LawrenceErlbaum.
Weaver, C. A., III, Mannes, S., & Fletcher, C. R. (Eds.). (1995).Discourse comprehension. Hillsdale, NJ: Erlbaum.
Wertheimer, M. (1938). Laws of organization in perceptual forms in asource book for Gestalt Psychology. London: Routledge &Kegan Paul.
Winn, W. D. (1994). Contributions of perceptual and cognitive processesto the comprehension of graphics. In W. Schnotz & R. Kulhavy(Eds.), Comprehension of graphics (pp. 3–27). Amsterdam:Elsevier.
Wittrock, M. C. (1989). Generative processes of comprehension.Educational Psychologist, 24, 345–376.
618 Mem Cogn (2015) 43:605–618