surface chemistry of coal by flow microcalorimetry
TRANSCRIPT

Energy 8~ Fuels 1989, 3, 97-105 97
Surface Chemistry of Coal by Flow Microcalorirrietry
Frederick M. Fowkes,* Kenneth L. Jones, Guozhen Li, and Thomas B. Lloyd Department of Chemistry, Lehigh University, Bethlehem, Pennsylvania 18015
Received July 29, 1987. Revised Manuscript Received October 12, 1988
The surface of powdered coal is rich in acidic and basic sites, which have been characterized by heats of adsorption of test acids and bases from isooctane solutions pumped through a flow micro- calorimeter and a downstream UV concentration detector. In each run the measurements determine (1) rates of adsorption onto powdered coal of test acids and bases, (2) the molar heats of adsorption of these test acids and bases, and (3) the number of moles of test acids or bases adsorbed per gram of coal powder. Pyridine and phenol adsorb from isooctane onto coal surfaces but then penetrate into the interior and are only partially desorbed when pure solvent is pumped through the bed. However, acid-base probes with tert-butyl groups have such limited penetration that they desorb quantitatively, and the specific surface areas calculated from the amount of such probes adsorbed per gram (by using molecular surface areas estimated from molecular models) agree much better with specific surface areas determined with nitrogen gas adsorption than those determined from the adsorption of carbon dioxide or other coal-soluble gases. In gas adsorption studies for determining the specific surface areas of coal powders, 2,2-dimethylbutane is a limited-penetration adsorbate that has negligible penetration into coal because of its tert-butyl group. The specific surface areas for coal powders determined with this adsorbate at 25 OC are rather close to those measured with nitrogen at liquid-nitrogen temperatures. We conclude that nitrogen gas and tert-butylated surface probes measure only the outer surface of coal powders, while coal-soluble probes such as carbon dioxide also measure the surface of inner pores accessible only to coal-soluble probes.
Introduction Coal is now thought to be an elastomer in which strong
internal hydrogen bonding gives it high glass transition temperatures.’t2 The same acidic hydrogen donors and basic hydrogen receptors that provide strong hydrogen bonds in the bulk structure populate the surface of coal powders. The acidity of the hydrogen-donating sites and the basicity of the hydrogen-accepting sites in the surface region can be ass,essed with calorimetric measurement of their heats of acid-base interaction with test acids and bases of known strength adsorbing onto the surface sites from a neutral organic solvent such as isooctane. Isooctane was chosen as the carrier solvent because the methyl branches are known to provide limited penetration of hydrocarbons into coal.3
Calorimetric determinations of the exothermic heats of acid-base interactions of organic acids and bases (AHab) in neutral organic solvents have been explored in much detail by Drago and co-workers, and these have been correlated quantitatively with their E and C e q u a t i ~ n : ~ ~ ~
(1)
where the C constants relate to the covalent character of the bond and the E constants relate to their electrostatic character. The E and C equation is found to hold for all acid-base interactions, whether of a Lewis or Brcansted nature, and allows quantitative prediction of AHab. The E and C constants for each acid or base allow us to dis- tinguish between “hard” and “soft” acids or bases, for the CIE ratio is a measure of “softness”. Oxygen bases are
-AH = CACB + E A E B
hard (with a C/E of about 21, nitrogen bases are softer (C/E of 5-12), and sulfur bases are much softer (C/E of about 20); all of these are found in coal. Heats of acid-base interaction also can be correlated with Gutmann’s donor numbers and acceptor numbers;6 these are conceptually simpler but do not distinguish between hard and soft acids or bases, and the method used for determining acceptor numbers is unable to distinguish acids from bases (e.g., the acceptor number for pyridine predicts it to be a fairly strong acid).
Drago has shown that heats of acid-base interactions are measurable by calorimetry or by infrared spectral shifts of OH or NH stretching frequencies,4i7 and we have found that the infrared spectral shifts of the carbonyl stretching frequencies of esters, ketones, and amides are directly proportional to their heats of acid-base interaction.8 We have also shown that all heats of adsorption onto inorganic surfaces from neutral organic solvents are acid-base in- teractions that can be predicted with eq 1 by using E and C constank3 determined for the acidic or basic surface sites of the inorganic s u b ~ t r a t e . ~
Experimental Details Flow Microcalorimetry. We have chosen to use flow mi-
crocalorimetry with a downstream concentration detector to determine the heats and amounts of adsorption of test acids and bases onto coal powders in order to explore the concentrations, strengths, and natures of the acidic and basic sites in coal surfaces. Flow microcalorimetry with a downstream concentration detector is a liquid chromatographic technique, requiring syringe pumps to deliver a smooth steady flow of solution through a small ad- sorption bed in a constant-temperature metal block. In our
(1) Green, T.; Kovac, J.; Brenner, D.; Larsen, J. W. In Coal Structure;
(2) Peppas, N. A.; Lucht, L. M. Chem. Eng. Commun. 1984,30,291. (3) Metcalfe, J. E., III; Kawahat, M.; Walker, P. L., Jr. Fuel 1963,42,
(4) Drago, R. S.; Vogel, G. C.; Needham, T. E. J. Am. Chem. SOC. 1971,
(5) Drago, R. S.; Parr, L. B.; Chamberlain, C. S. J . Am. Chem. SOC.
Academic Press: New York, 1982; pp 199-282.
233.
93, 6014.
1977,99, 3203.
(6) Gutmann, V. The Donor-Acceptor Approach to Molecular Inter- actions; Plenum Press: New York, 1978.
(7) Nozari, M. S.; Drago, R. S. J. Am. Chem. SOC. 1970, 92, 7086. (8) Fowkes, F. M.; Tischler, D. 0.; Wolfe, J. A.; Lannigan, L. A.;
Ademu-John, C. M.; Halliwell, M. J. J. Polym. Sci., Polym. Chem. Ed. 1984, 22, 541.
(9) Fowkes, F. M.; McCarthy, D. C.; Tischler, D. 0. In Molecular Characterization of Composite Interfaces; Ishida, H., Kumar, G., Eds.; Plenum Press: New York, 1985; pp 401-411.
0887-0624/89/2503-0097$01.50/0 0 1989 American Chemical Society
98 Energy & Fuels, Vol. 3, No. 1, 1989
TWIN MICROPUMPS
Fowkes et al.
solvent plus adsorbate in syringe
pure s,olvent in syringe
P f low loop
t I I I n
pre-evacuation - of adsorbent COMPUTER
I N T E R F A C E
U V DETECTOR
1 I L--,-
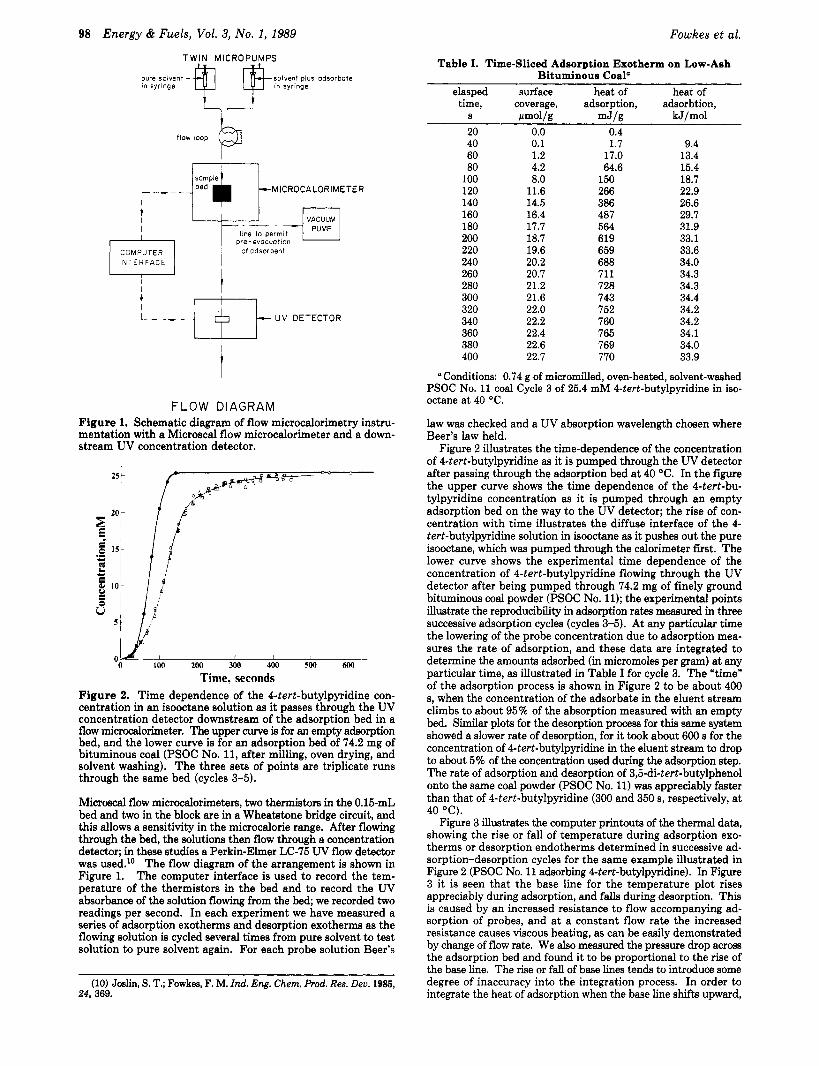
F L O W DIAGRAM Figure 1. Schematic diagram of flow microcalorimetry instru- mentation with a Microscal flow microcalorimeter and a down- stream UV concentration detector.
E * O h
g ISr .- Y
E l
0 K.- I I I I I
0 100 200 300 400 500 M)o
Time, seconds Figure 2. Time dependence of the 4-tert-butylpyridine con- centration in an isooctane solution as it passes through the UV concentration detector downstream of the adsorption bed in a flow microcalorimeter. The upper curve is for an empty adsorption bed, and the lower curve is for an adsorption bed of 74.2 mg of bituminous coal (PSOC No. 11, after milling, oven drying, and solvent washing). The three sets of points are triplicate runs through the same bed (cycles 3-5).
Microscal flow microcalorimeters, two thermistors in the 0.15-mL bed and two in the block are in a Wheatstone bridge circuit, and this allows a sensitivity in the microcalorie range. After flowing through the bed, the solutions then flow through a concentration detector; in these studies a Perkin-Elmer LC-75 W flow detector was used.1° The flow diagram of the arrangement is shown in Figure 1. The computer interface is used to record the tem- perature of the thermistors in the bed and to record the UV absorbance of the solution flowing from the bed; we recorded two readings per second. In each experiment we have measured a series of adsorption exotherms and desorption exotherms as the flowing solution is cycled several times from pure solvent to test solution to pure solvent again. For each probe solution Beer’s
(IO) Joslin, S. T.; Fowkea, F. M. Znd. Eng. Chem. Prod. Res. Deu. 1985, 24, 369.
Table I. Time-Sliced Adsorption Exotherm on Low-Ash Bituminous Coal”
elasped surface heat of heat of time, coverage, adsorption, adsorbtion,
S m ” l g mJ/g kJ/mol 20 0.0 0.4 40 0.1 1.7 9.4 60 1.2 17.0 13.4 80 4.2 64.6 15.4
100 8.0 150 18.7 120 11.6 266 22.9 140 14.5 386 26.6 160 16.4 487 29.7 180 17.7 564 31.9 200 18.7 619 33.1 220 19.6 659 33.6 240 20.2 688 34.0 260 20.7 711 34.3 280 21.2 728 34.3 300 21.6 743 34.4 320 22.0 752 34.2 340 22.2 760 34.2 360 22.4 765 34.1 380 22.6 769 34.0 400 22.7 770 33.9
a Conditions: 0.74 g of micromilled, oven-heated, solvent-washed PSOC No. 11 coal Cycle 3 of 25.4 mM 4-tert-butylpyridine in iso- octane at 40 OC.
law was checked and a UV absorption wavelength chosen where Beer’s law held.
Figure 2 illustrates the time-dependence of the concentration of 4-tert-butylpyridine as it is pumped through the UV detector after passing through the adsorption bed a t 40 OC. In the figure the upper curve shows the time dependence of the 4-tert-b~- tylpyridine concentration as it is pumped through an empty adsorption bed on the way to the UV detector; the rise of con- centration with time illustrates the diffuse interface of the 4- tert-butylpyridine solution in isooctane as it pushes out the pure isooctane, which was pumped through the calorimeter first. The lower curve shows the experimental time dependence of the concentration of 4-tert-butylpyridine flowing through the UV detector after being pumped through 74.2 mg of finely ground bituminous coal powder (PSOC No. 11); the experimental points illustrate the reproducibility in adsorption rates measured in three successive adsorption cycles (cycles 3-5). At any particular time the lowering of the probe concentration due to adsorption mea- sures the rate of adsorption, and these data are integrated to determine the amounts adsorbed (in micromoles per gram) at any particular time, as illustrated in Table I for cycle 3. The “time” of the adsorption process is shown in Figure 2 to be about 400 s, when the concentration of the adsorbate in the eluent stream climbs to about 95% of the absorption measured with an empty bed. Similar plots for the desorption process for this same system showed a slower rate of desorption, for it took about 600 s for the concentration of 4-tert-butylpyridine in the eluent stream to drop to about 5% of the concentration used during the adsorption step. The rate of adsorption and desorption of 3,5-di-tert-butylphenol onto the same coal powder (PSOC No. 11) was appreciably faster than that of 4-tert-butylpyridine (300 and 350 s, respectively, at 40 “C).
Figure 3 illustrates the computer printouts of the thermal data, showing the rise or fall of temperature during adsorption exo- therms or desorption endotherms determined in successive ad- sorption-desorption cycles for the same example illustrated in Figure 2 (PSOC No. 11 adsorbing 4tert-butylpyridine). In Figure 3 it is seen that the base line for the temperature plot rises appreciably during adsorption, and falls during desorption. This is caused by an increased resistance to flow accompanying ad- sorption of probes, and a t a constant flow rate the increased resistance causes viscous heating, as can be easily demonstrated by change of flow rate. We also measured the pressure drop across the adsorption bed and found it to be proportional to the rise of the base line. The rise or fall of base lines tends to introduce some degree of inaccuracy into the integration process. In order to integrate the heat of adsorption when the base line shifts upward,

Surface Chemistry of Coal
30
20
10
Energy & Fuels, Vol. 3, No. 1, 1989 99
-
-
-
ADSOR PTI 0 N DESORPTION
I - I
I I
0 400 SEC 0 400 SEC 800
Figure 3. Computer printouts of adsorption exotherms and desorption endotherms for 4-tert-butylpyridine (25 mM in iso- octane) interacting with a low-ash bituminous coal powder (PSOC No. 11). Cycles 3-5 (as in Figure 2) are shown.
we have arbitrarily drawn a straight base line from the start of an exotherm or endotherm to the curve a t the "adsorption time" estimated from the time dependence of the concentration of adsorbate in the eluent stream, as discussed in the preceding paragraph (400 s for 4-tert-butylpyridine, and 300 s for 3,5-di- tert-butylphenol adsorbing onto PSOC No. 11). In the desorption cycle, the concentration of 4-tert-butylpyridine passing through the UV detector took about 600 s to return nearly to zero, so in Figure 3 the falling base lines are drawn with a duration of 600 s. The magnitude of possible error in integration due to rise or fall of the base line was found to decrease with powders of higher specific surface area, for the magnitude of the calorimetric signal increased much more than the magnitude of the base-line cor- rection.
Each individual adsorption exotherm such as those shown in Figure 3 can be dissected into many small time increments so that the time dependence of heats of adsorption in kilojoules per mole of probe and of surface coverage in micromoles per gram of coal can be averaged for each 10 or 20 s of each experiment. Table I and Figure 4 illustrate such "time slicing" for one of the exot- herms of Figure 3. Figure 4 compares the rates of adsorption and the time dependence of the molar heats of adsorption for 20-s intervals in the three successive adsorption cycles (cycles 3-5; the same runs as in Figure 2) for rl-tert-butylpyridine adsorbing onto a low-ash bituminous coal. The reproducibility increases with successive cycles, and often the adsorption exotherm of the initial cycle is the smallest.
FTIR Spectral Measurements of the Strength of Test Acids and Bases. The effect of tert-butyl substituents on the strength of candidate test bases was determined by the shift of vibrational spectral peaks resulting from acid-base complexation with test acids or bases of established strengths. The infrared shift resulting from complexation of the acidic OH groups of phenol or of butanol with bases was calibrated with calorimetric heats of acid-base complexation in dilute solutions in cyclohexane or carbon tetrachloride by Drago and co-w~rkers:~Jl for butanol
AH = 12.55 kJ/mol + 0.0439Av kJ mol-'/cm-l
for phenol
AH = 6.86 kJ/mol + 0.0452Av kJ mol-'/cm-'
Micro Moles/g
l0I 4 i -A- Cycle 3 + Cycle 4 x Cycle 5
0 I I 1 I I I
0 50 100 150 200 250 300 350 400 Elapsed Time (seconds)
K Joules/Mole
- - I
.A- Cycle 3 + Cycle 4 +I+ Cycle 5
0' I I I I I I -I
Elapsed Time (seconds)
Figure 4. Upper plot: Time dependence of the amount of 4-tert-butylpyridine adsorbed onto PSOC No. 11 bituminous coal (in pmol/g) as solution is pumped through the adsorption bed. Lower plot: Time dependence of the molar heats of adsorption (in kJ/mol) of 4-tert-butylpyridine in PSOC No. 11 coal in the same three adsorption cycles illustrated above.
In a recent joint project with the Materials Laboratory of Wright-Patterson Air Force Base we made a similar calibration with the infrared shift of carbonyl groups Av- resulting from complexation with acids:8
AH = 1.00Av- kJ mol-'/cm-l
In this study we also make use of the CD stretching frequency of deuteriated chloroform and its shift upon complexation with bases.12
The spectral shifts were determined with a Mattson FTIR spectrometer used in the transmission mode, operated to provide resolutions of 1 wavenumber for OH and CD shifts and about 0.3 wavenumber for carbonyl shifts.
Surface Areas by Gas Adsorption. The specific surface areas of all coal samples were determined by nitrogen and carbon dioxide adsorption with the BET analysis, by using the gas chromatog- raphy method with a Quantichrome Monosorb surface area an- alyzer and the static equilibrium method with a Numinco-Orr surface area-pore volume analyzer. A classical BET apparatus was used for adsorption studies at 25 "C with 2,2-dimethylbutane and with carbon dioxide and, a t -196 "C, with nitrogen. The adsorption data for dimethylbutane and nitrogen were analyzed with the BET method, and the carbon dioxide data were analyzed by both the BET and the Dubinin-Polanyi method.13
Materials Used in This Investigation. Coal powders pre- pared from five different coal samples were investigated. Four came from The Pennsylvania State University coal bank, and one was a more recently mined bituminous coal from Bethlehem Steel Co. (Van-131). The properties of these coals are listed in Table 11.
0 50 100 150 200 250 300 350 400
(11) Drago, R. S.; O'Bryan, N.; Vogel, G. C . J. Am. Chem. SOC. 1970,
(12) Shurvell, H. F.; Bulmer, J. T. Vib. Spectra Struct. 1977,6,91. (13) Dubinin, M. M. Chem. Rev. 1960,60, 235.
92, 3924.

100 Energy dt Fuels, Vol. 3, No. 1, 1989 Fowkes et al.
rank composition
% carbon % ash % moisture % volatiles
% ash % carbon % hydrogen % nitrogen % sulfur % oxygen
ultimate analysis (dry)
bituminous
81.6 2.04 1.5 35.6
2.07 82.86 5.49 1.47 0.44 7.66
bituminous
65.1 8.52 8.9 35.9
9.36 71.51 5.16 1.56 3.82 8.59
Table 11. Properties of Coals Studied in This Investigation identification PSOC No. 11 PSOC No. 213 PSOC No. 870 PSOC No. 868 Van-131
anthracite anthracite bituminous
89.5 2.46 3.8 2.9
63.3 80.4 25.0 5.0 3.8 4.06 39.6
2.56 26.0 93.09 67.93 1.82 1.77 0.69 0.63 0.50 0.60 1.33 3.07
The coals were obtained as coarse powders, were riffled to provide more uniform samples, and were stored in the dark in argon-filled glass desiccators. They were subsequently ground to enhance the amount of surface available in the adsorption bed. Most of the grinding was done with a micromill from Technilab Instruments; the coal was micromilled in air for 2 min in the water-cooled chamber. Other samples were ball-milled, and some Van-131 samples were vibratory-milled to much higher specific surface areas. The milled coal was sieved to 170 or 230 mesh sizes. Some of the coal powders were dried in a vacuum oven for 3-4 h at 105-115 "C, and some were washed free of extractable components in an ultrasonic bath of acetone followed with di- chloromethane for 30-80 min each.
A major consideration in the selection of the carrier solvent and of the test acids and bases was their tendency to penetrate into the bulk region of the coal particles; we wished to sample only the surface region. This point will be discussed in more detail, but we have chosen to use isooctane as carrier solvent and tert-butylated acids and bases as "limited penetration" teat probes for surface acidity and basicity. The isooctane was Purified grade from Fisher, the pyridine and phenol were ACS Reagent grade from Fisher, and the tert-butylated acid-base probes (4-tert- butylphenol, 3,5-di-tert-butylphenol, 2,6-di-tert-butylphenol, 4- tert- butylpyridine, 2,6-di- t ert -butylpyridine and 4-tert-butyl- cyclohexanone) were all Aldrich Reagent grade. Some gas ad- sorption studies were made with 2,2-dimethylbutane (98%) ob- tained from Aldrich Chemical Co.
In other flow microcalorimetry studies with inorganic solids in non-aqueous media we have found that the magnitude of the heats of adsorption was strongly dependent on the water content of the carrier solvent, but since coal particles tend to carry several percent of water, the water content of the coal powder was found to be much more important than the water content of the iso- octane solutions in controlling the acidic or basic strength of the surface sites. It was found that drying coal powders in a vacuum oven for 4 h at 115 O C increased the heats of sorption of pyridine on the low-ash coals by 3- to 4-fold and increased the heats of adsorption of phenol by about 2-fold. Consequently all of the experimental data reported in this paper were measured with coal powders which had been so dried.
Results and Discussion Limited-Penetration Acid-Base Probes. Pyridine is
known to swell coal very considerably, but in studies of the equilibrium swelling of coal by pyridine and its de- rivatives, Larsen and co-workers found that the derivatives with side chains cause less swelling and that tert-butyl derivatives cause the least swelling, about 10% of that observed with pyridine.' The effect of the tert-butyl groups on the rates of swelling is even more important to flow microcalorimetric studies; Aida and Squires found that tert-butyl groups retarded the rates of penetration by a factor of a thousand or more.14
An important consideration is the effect of tert-butyl substitution on the strength of the acidity'or basicity of
(14) Aida, T.; Squires, T. G.; Prepr. Pap.-Am. Chem. SOC. Diu. Fuel Chem. 1985,30,95.
Absorbance 0.04
4.06 j
_T -'.. r, -_ --.--_ - - -il 3500 3300 3100 2900
Wavenumbers
4.
Figure 5. Difference FTIR spectrum for the interaction of ex- pyridine with 3,5di-tert-butylphenol. The shift of the peak from 3612 to 3163 cm-I corresponds to a heat of acid-base interaction of -32.3 kJ/mol.
a test molecule, so we investigated the heats of acid-base complexation of the candidate test acids and bases in a neutral organic solvent. The heats of acid-base interaction were determined from the magnitude of the chemical shift of infrared spectral peaks measured in the presence of various excess concentrations of reactant. Figure 5 is an illustration of the spectral shift for the OH stretching peak of 3,5-di-tert-butylphenol upon complexation with an ex- cess of pyridine. This is a difference spectrum obtained by subtracting the spectra of all components from the spectrum of a solution of 3,5-di-tert-butylphenol in the presence of the excess of pyridine. The concentration of the phenol is low enough (17.5 mM in CClJ that no self- association occurs, as evidenced by the very sharp negative peak at 3612 cm-l for the OH stretch of the uncomplexed phenol. The peak for the OH stretch of the phenol in acid-base complexation with pyridine is very broad, but its location (3163 cm-') can be determined with excellent repeatability, as evidenced in Table 111. In Figure 5 the peak shift of 3,5-di-tert-butylphenol was measured in the presence of a 13-fold excess of pyridine; as shown in Table 111, which lists the effect of the excess of reactant on the magnitude of the chemical shift, the chemical shift for various excesses of pyridine was found to be -449 cm-l in each case, showing none of the concentration dependence reported by Drago and co-workers? This shift corresponds to a heat of interaction of -32.3 kJ/mol. From these studies it is concluded that substitution of tert-butyl groups in the 2-, 4-, or 3,5-poeitions does not affect the acid or base strength of phenol or pyridine appreciably, but in the 2,6-position the tert-butyl groups completely blocked any reactions of the phenol or pyridine sites. The heats of adsorption observed with the 2,6-di-tert-butyl deriva- tives of phenol or pyridine were about 5 kJ/mol, charac- teristic of the weak acid-base interaction of the aromatic

Surface Chemistry of Coal Energy & Fuels, Vol. 3, No. 1, 1989 101
Table 111. Heats of Acid-Base Complexation Determined from F'TIR Spectra Shifts
base acid bond Av, cm-' AH, kJ/mol Av, cm-' AH, kJ/mol in cyclohexane in CCl,
pyridine phenol OH -467 -1.89 -488 -8.11 4- tert-butylphenol OH -450 -1.71 -462 -7.84 3.5-di- tert-butylphenol OH -434 -1.55 -449 -1.10
n-butylamine ethyl acetate
4- tert-butylcyclohexanone
4-tert-butylpyridine pyridine 4- tert-butylpyridine 2,6-di-tert-butylpyridine n- butylamine pyridine 4-tert-butylpyridine pyridine 4-tert-butylpyridine ethyl acetate
4- tert-butylcyclohexanone
2- tert-butylphenol 2,6-di- tert-butylphenol 4-tert-butylphenol phenol 4-tert-butylphenol 2-tert-butylphenol 3,5-di- t ert - but ylphenol phenol 2- tert-butylphenol 4-tert-butylphenol 3,5-di-tert-butylphenol phenol n-butyl alcohol n-butyl alcohol n-butyl alcohol n-butyl alcohol tert-butyl alcohol tert-butyl alcohol chloroform-d chloroform-d chloroform-d chloroform chloroform-d chloroform
OH OH OH OH OH OH OH OH OH OH OH OH OH OH OH OH OH OH CD CD co co co co
0 -465
-256 -251 -236 -231
-250 -210
0 -301 -231 -241
-12 -12
-1.81
-5.72 -5.61 -5.51 -5.46
-4.3 -4.5 0
-4.9 -4.16 -4.21
-2.9 -2.9
-461
-185 -168 -161 -166
-489
-29 -34 -10 -10 -6 -6
-1.83
-4.99 -4.81 -4.74 -4.19
-8.12
-2.4 -2.4 -1.4 -1.4
Table IV. AdsorDtion and DesorDtion of Acid-Base Probes on Low-Ash Anthracite Coal Powders (PSOC No. 870)
acid-base probe
~ ~ ~~~~~
heats of adsorption and desorption *, amt adsorbed,
cycle mmol/kg adsorbed desorbed kJ/mol .~ Dhenol 1 37.2 -2438 +1295 -65
2
2 3 4 5
2 3 4 5
2 3 4
2 3 4 5
3,5-di-tert-butylphenol 1
2,6-di- tert-butylphenol 1
pyridine 1
4-tert-butylpyridine 1
21.8 1.8 6.8 6.5 8.1 1.3
16.9 26.2 26.4 26.3 20.5
34.6 38.1 31.0 31.4 28.1 21.0 31.1 31.5
rings with acidic surface sites. In these flow microcalorimetry measurements the bed
of powdered coal was exposed to test acid or base solutions for only about 10 min. In another few minutes pure solvent was pumped through the bed to desorb the adsorbed probe. When the probe was pyridine or phenol some of it tended to penetrate into the coal during the 5-10 min of exposure, but with tert-butyl derivatives the degree of penetration was negligible. Table IV (for anthracite coal) and Table V (for bituminous coal) illustrate this effect by comparing heats of adsorption and desorption in several successive adsorption-desorption cycles with phenol, pyridine, and their tert-butyl derivatives adsorbing from isooctane at 40 OC. The heat of adsorption of pyridine into low-ash anthracite (PSOC No. 870) was so excessive that the recorder went off scale on the first adsorption cycle, and the subsequent heat of desorption was still quite large
-1808 -232 -238 -237 -242 -236 -111 -112 -135 -123 -91
-???? -1411 -1392 -1432 -871 -815 -709 -862 -868
+1100 +242 +265 +243 +229 +249 +119 +129 +114 +139 +125
+2130 +1375 +1210 +1242 +863 +864 +811 +782 +809
-65 -30 -35 -36 -30 -32 -7 -4 -5 -5 -5
-43 -31 -39 -23 -28 -26 -28 -23
(+2130 J/kg); in the successive cycles only about half as much heat was evolved, with the heats of adsorption ex- ceeding the heats of desorption by about 10%. On the same anthracite powder 4-tert-butylpyridine is seen to desorb quantitatively, with an average heat of adsorption of -825 J/kg and an average heat of desorption of +827 J/kg. Phenol and its tert-butyl derivatives performed similarly; for the first adsorption-desorption cycle on the anthracite coal of Table IV the heat of adsorption was twice the heat of desorption and about 10 times the heat of adsorption of 3,5-di-tert-butylphenoL On anthracite coal the desorption of 3,5-di-tert-butylphenol was also quan- titative, as evidenced by average heats of -237 J/kg for adsorption and +246 J/kg for desorption (Table IV).
The heats of desorption of limited penetration probes onto bituminous coal powders (Table V) were not quite as close a match to the heats of adsorption as o b s e ~ e d with

102 Energy & Fuels, Vol. 3, No. 1, 1989 Fowkes et al.
Table V. Adsorption and Desorption of Acid-Base Probes on Low-Ash Bituminous Coal Powders
coal acid-base Drobe
heats of adsorotion and AH*, amt adsorbed, desorption, J/kg
cycle mmol/ke adsorbed desorbed kJ/mol PSOC No. 11 4-tert-butylpyridine 1
2 3 4 5
2 3 4
2
2 3
3,5-di-tert-butylphenol 1
4-tert-butylphenol 1
4-tert- butylcyclohexanone 1
Vm-131T
anthracite coal but were usually within 10% of the heats of adsorption. Thus for 4-tert-butylpyridine adsorbing onto PSOC No. 11 low-ash bituminous coal powders, the average heats of adsorption and desorption were -720 and +656 J/kg. However, for 3,5-di-tert-butylphenol adsorbing onto the same coal powders the average heats of adsorption and desorption were -315 and +323 J/kg, respectively.
Strength of Acidic and Basic Surface Sites of Coal. The heats of adsorption from neutral non-aqueous solvents have been shown to be heats of acid-base interaction, predictable from the Drago E and C e q ~ a t i o n . ~ Thus the molar heats of adsorption of the limited-penetration acid-base probes are a measure of the strength of acidic or basic surface sites, and hence such heats of adsorption can be used to estimate the chemical nature of the acidic and basic surface sites of coal powders. The acidic surface sites of oven-dried PSOC No. 11 low-ash bituminous coal are shown in Figure 3 and in Table V to have heats of adsorption of 4-tert-butylpyridine of about -35 kJ/mol, nearly identical with the -34 kJ/mol heat of acid-base interaction observed for the same probe interacting in solution with phenol (Table 111), indicating that the acidic surface sites are probably phenolic. The same conclusions are evidenced from the heats of adsorption of 4-tert-bu- tylcyclohexanone onto the acidic sites of Van-131, the more freshly mined bituminous coal; the observed values of about -19 kJ/mol are close to the -23 kJ/mol determined for this basic probe interacting with substituted phenols (Table 111). The acidic surface sites of oven-dried an- thracite coal (PSOC No. 870) also had a heat of adsorption of 4-tert-butylpyridine of about -34 kJ/mol, so even though these coals are very different in other respects, the acidic surface sites appear to be phenolic in either case.
The strength of the basic sites can be estimated from the heats of adsorption of 3,5-di-tert-butylphenol. Table IV shows heats of adsorption of about -33 kJ/mol on oven-dried anthracite coal PSOC No. 870, indicating that the basic sites must have a base strength equal to pyridine. However, the basic strength of the basic surface sites of the two low-ash bituminous coals differed. The recently mined bituminous coal Van-131 had heats of adsorption of 4tert-butylphenol of -34 and -35 kJ/mol, just like thme of the PSOC No. 870 anthracite coal, but the older (and perhaps more oxidized) bituminous coal PSOC No. 11 had much lower heats of adsorption of 3,5-di-tert-butylphenol (-9 to -18 kJ/mol). Thus the freshly mined bituminous coal had basic surface sites with the same strength as pyridine, and possibly the weaker basicity observed with the older sample of bituminous coal is the result of oxi- dation.
Relative Surface Concentrations of Acidic and
28.8 22.8 22.7 23.3 24.1 22.9 25.1 24.6 22.9 22.7 21.0 20.4 23.0 24.6
-477 -679 -770 -847 -825 -206 -281 -361 -413 -795 -711 -411 -427 -427
+506 +618 +684 +704 +758 +266 +288 +353 +385 +561 +502 +413 +427 +297
-17 -30 -34 -36 -34 -9
-11 -15 -18 -35 -34 -20 -19 -17
Basic Sites. The relative surface population of acidic and basic sites is shown in the flow microcalorimetry studies of Tables IV and V, for in these experiments the acidic and basic surface sites are titrated as part of the procedure. The amount of 3,5-di-tert-butylphenol adsorbed on the low-ash anthracite coal powder (about 8 mmol/kg of coal) is far less than the amount of 4-tert-butylpyridine adsorbed on the same powder (about 32 mmol/kg of coal). Even when some of this difference is discounted as due to mo- lecular areas of the probes (0.71 nm2 for the 4-tert-b~- tylpyridine versus 1.25 nm2 for the 3,5di-tert-butylphenol), it is clear that the low-ash anthracite coal has far more acidic surface sites than basic surface sites. On the other hand, the calorimetric data suggest that for both low-ash bituminous coal powders the surface population of acidic and basic sites were about equal, but because of its larger molecular area, the 3,5-di-tert-butylphenol may underes- timate the density of basic surface sites. However, with the Van-131 butiminous coal powder the acidic and basic probes (4tert-butylphenol and 4tert-butylcyclohexone) should have about the same molecular area, and we observe (in Table v) that the surface concentrations of both acidic and basic sites were about 22 mmol/kg of coal, again in- dicating that our bituminous coal powders had about equal numbers of acidic and basic surface sites, in marked con- trast to the much higher ratio of acidic to basic sites ob- served with the PSOC No. 870 anthracite coal.
Surface Effects of Inorganic Constituents. The presence of inorganic solids in coals is shown in Table VI to dominate the nature of the surface sites in high-ash coals. A marked difference is observed in the degree of reversibility of the adsorption of the limited-penetration acid-base probes, for the heats of desorption are in most cases much less than the preceding heats of adsorption, and in successive adsoEption-desorption cycles the heats of adsorption are observed to decline very appreciably. These findings show that the inorganic surface sites have stronger acidic and basic sites than the organic constituents of coal, so strong that the adsorption is no longer reversible.
Statistical Significance of the Flow Microcalori- metric Measurements. The data in Figure 3 and in Tables IV and V illustrate the statistical significance of the flow microcalorimetric measurements. With the lim- ited-penetration probes the heats of desorption are seen to be very close in magnitude to the heats of adsorption; the average difference in Tables IV and V is only 2.7%. The standard deviations in the heats of adsorption and desorption (measured in joules per kilogram) in repeat runs were found to be about 5% in all cases for the low-ash anthracite coal and about 15% for the PSOC No. 11 low- ash bituminous coal. The larger standard deviations in

Surface Chemistry of Coal Energy & Fuels, Vol. 3, No. 1, 1989 103
Table VI. Heats of Adsorption of Test Probes on High-Ash Coal Powders heats of adsorption and
amt adsorbed, desorption, J/ kg AI+&, Coal acid-base probe cycle mmol/kg adsorbed desorbed kJ/mol
PSOC No. 213 3,5-di-tert-butylphenol 1 36.6 -1351 +933 -37.9 2 3 4
2 3
2 3
2 3
4-tert-butylpyridine 1
PSOC No. 868 3,5-di-tert-butylphenol 1
4- tert-butylpyridine 1
35.4 29.8 32.7 34.0 58.9 60.3 26.0 37.5 30.6 80.9 53.1 71.9
-1021 -1067 -1092 -1745 -1251 -1318 -916 -607 -619
-1975 -736 -619
+874 +824
+lo96 +1163 +1276
+385 +523 +444 +594 +590 +540
-28.8 -35.8 -33.4 -51.5 -21.3 -21.8 -35.2 -16.2 -20.3 -24.2 -13.8 -8.6
the heats of adsorption or desorption observed with PSOC No. 11 bituminous coal resulted from regularly increasing heats of adsorption and desorption in successive adsorp- tion-desorption cycles, which are believed to be real trends and not statistical deviations. In fact, much smaller de- viations are observed with the Van-131 bituminous coal powders.
The measurements of amounts adsorbed determined from the UV absorption appear sometimes to be less re- peatable, but we have overcome some of these problems by making plots such as Figure 2 from the UV detector data. Figure 2 shows excellent repeatability, and similar results have been obtained for 4-tert-butylpyridine and for 3,5-di-tert-butylphenol adsorbing onto PSOC No. 11 bi- tuminous coal or onto PSOC No. 870 anthracite coal, both having a low inorganic content. In much of the work in this paper the accuracy of the calculations of concentra- tions of acid-base probes adsorbed depended on the dif- ferences in absorption between runs with empty beds versus powder-filled beds. The accuracy of the time alignment was subject to as much as 15 s misalignment when attempted with a light-pen-operated computer pro- gram. Figure 2 illustrates an improved method of align- ment of the UV traces that will minimize the former dif- ficulties.
A second source of error is that some coals exude enough aromatics into the isooctane to give an interfering UV absorption at the wavelength selected for the probe mol- ecules. When such aromatics are extracted from the coal, the concentrations of probe molecules in the effluent stream calculated from the UV absorbtivity are lower than they really are, the calculated amounts adsorbed are too small, and the calculated molar heats of adsorption are too great. The institution of vacuum-oven drying and washing in acetone and dichloromethane minimized extractable aromatics considerably.
In other flow microcalorimetric studies with the same ins t r~ment , ’~ we have achieved standard deviations be- tween the heats of adsorption in successive repeat runs of about 2%, so the standard deviations of about 5% with anthracite coal in Table IV and of about 15% with bitu- minous coal in Table V are probably coal-related analytical difficulties. Fortunately it is very easy to make many successive adsorption-desorption cycles on the same bed of adsorbent, and the added statistical population improves the accuracy of the experimental average. Another prob- lem with the UV flow detector is the sensitivity to air bubbles, and as the solution flows through the calorimeter bed at 40 “C, there is a tendency for bubble formation; we
recently have switched to 30 “C, and this helps. There is also a tendency for small coal particles to be carried out of the bed and through the UV detector cell; we have introduced a micropore filter a t the base of the bed, and this helps a lot to minimize the bubble problem. It might be better to use a higher molecular weight carrier solvent than isooctane in the flow microcalorimeter to minimize bubble problems and to extract less aromatics from the powdered coal; perhaps squalane would be better.
Surface Area Determination with Limited-Pene- tration Adsorbates. There has been much discussion in the literaturele of discrepancies in specific areas deter- mined by gas adsorption with nitrogen at liquid-nitrogen temperatures versus carbon dioxide at 25 “C. So much more carbon dioxide than nitrogen is picked up by the coal that it was proposed that hundreds of square meters per gram of surface is accessible to carbon dioxide but not to nitrogen. However, in modern studies it is becoming quite clear that carbon dioxide (like other small reactive organic molecules) dissolves to some extent into the causing some swelling and allowing access to inner surfaces by a solution route. Carbon dioxide is a self-associated acid- base complex that readily dissolves into and swells any acidic or basic polymer. Coal is just one of the many polymers that picks up carbon dioxide vapors appreciably at 1 atm and at room temperature. If one uses the Pola- nyi-Dubinin equation to elucidate the “specific surface areas” from such gas absorption measurements, the plots give very satisfying straight lines and high correlation coefficients, predicting over a hundred square meters of surface per gram for optically clear polymers such as poly- (methyl methacrylate) or for coal. However, the swelling of coal by carbon dioxide” is not sufficient to account for more than a fraction of its uptake; clearly coal must have inner pores of appreciable surface area that are accessible only to molecules which can dissolve in coal. The classical explanation was that the inner pores in coal have openings that are too narrow for nitrogen to pass through at liquid nitrogen temperatures but that a t room temperature carbon dioxide can pass through. The idea of inner pores of appreciable surface area appears correct, but the proof that these pores are accessible only by molecules which dissolve in coal gives a more plausible explanation than the old “ink-bottle” pore hypothesis.
The use of tert-butyl derivatives to determine specific surface areas of coal powders has merit, for the tert-butyl groups block penetration into the coal and no solution occurs. We have tried this approach with gas adsorption, using 2,2-dimethylbutane, which has a tert-butyl group,
(15) Fowkes, F. M.; Huang, Y. C.; Shah, B. A,; Kulp, M. J.; Lloyd, T. B. Colloids Surf. 1988,29, 243.
(16) Reucroft, P. J.; Patel, K. B. Fuel 1983, 62, 279. (17) Reucroft, P. J.; Sethuraman, A. R. Energy Fuels 1987, 1, 72.
104 Energy & Fuels, Vol. 3, No. 1, 1989 Fowkes et al.
Table VII. Surface Areas versus Particle Size of Ground Bituminous Coala
mesh size adsorbate <325 nitrogen
nitrogen 2,2-dimethylbutane 4- tert-butylcyclo-
3,5-di-tert-butyl-
carbon dioxide carbon dioxide
((325 nitrogen nitrogen 2,Zdimethylbutane 4-tert-butylcyclo-
4-tert-butylphenol 3,5-di-tert-butyl-
carbon dioxide carbon dioxide
hexanone
phenol
hexanone
phenol
-196 -196
25 40
40
25 25
-196 -196
25 40
40 40
25 25
surface area,
method analysis m2/g dynamic BET 2.82 static BET 2.76 static BET 3.52 flow calor 3.3
flow calor 3.4
static BET 56.6
dynamic BET 14.0 static BET 20.5 static BET 14.7 flow calor 9.5
static D-P 94.6
flow calor 9.2 flow calor 7.1
static BET 57.8 static D-P 99.8
OConditions: Van-131 coal ground in rotary grinder and then vibratory mill; area/molecule of adsorbates, 0.405 nm2 for 2,2-di- methylbutane, 1.25 nm2 for 3,5-di-tert-butylphenol, and 0.71 nm2 for 4-tert-butylpyridine.
and measured the adsorption of this vapor at 25 "C and calculated the specific surface areas with the BET method, using 0.40 nm2 for the area per molecule. As can be seen in Table VII, the specific surface areas measured with 2,2-dimethylbutane at 25 "C are very much closer to those measured by nitrogen adsorption at -196 "C than those measured by carbon dioxide adsorption at 25 "C. Table VI1 compares specific surface areas for powdered Van-131 coal that was ground and classified to two particle sizes. The specific surface areas determined from adsorption of nitrogen or 2,2-dimethylbutane increased upon grinding to smaller particle sizes, but the "areas" determined with carbon dioxide remained at about 100 m2/g. The specific surface area of the coarsest powder was measured to be 2.76-2.82 m2/g by nitrogen adsorption and 3.52 m2/g by 2,2-dimethylbutane adsorption, and the finest powder was found to have a 14.0-20.5 m2/g area by nitrogen adsorption and a 14.7 m2/g area by 2,2-dimethylbutane adsorption. It appears that the best agreement is found for the finer powders.
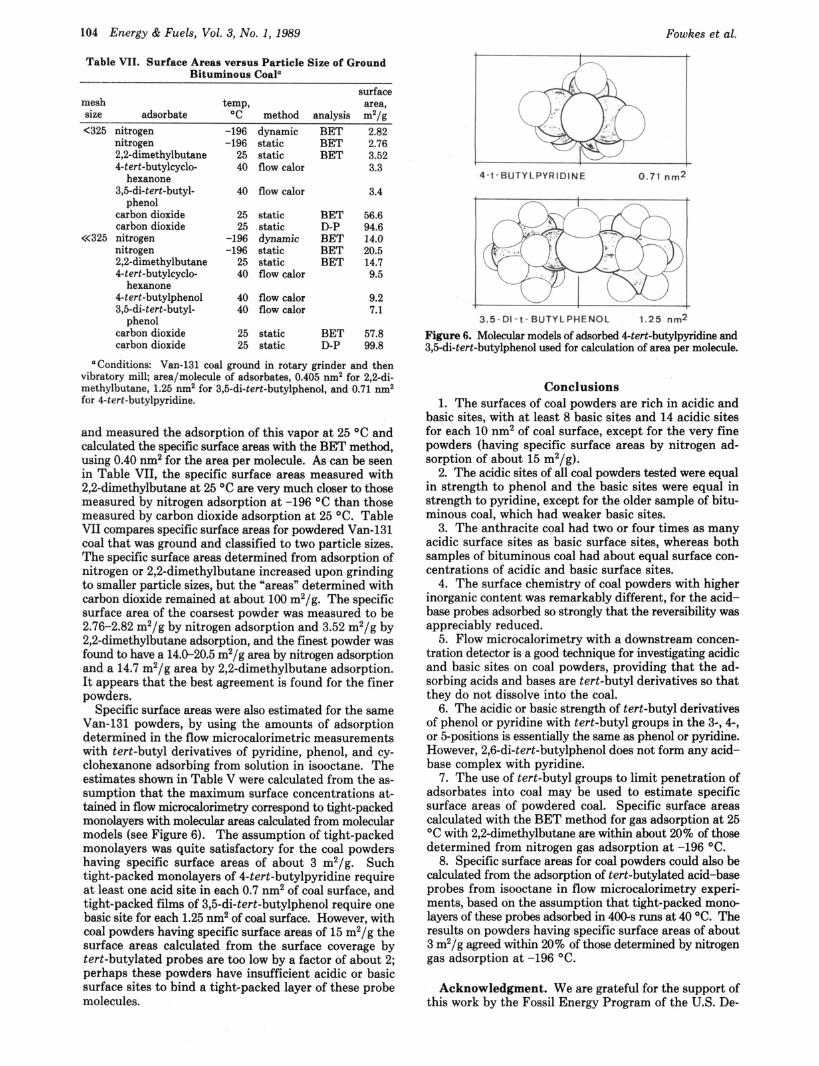
Specific surface areas were also estimated for the same Van-131 powders, by using the amounts of adsorption determined in the flow microcalorimetric measurements with tert-butyl derivatives of pyridine, phenol, and cy- clohexanone adsorbing from solution in isooctane. The estimates shown in Table V were calculated from the as- sumption that the maximum surface concentrations at- tained in flow microcalorimetry correspond to tight-packed monolayers with molecular areas calculated from molecular models (see Figure 6). The assumption of tight-packed monolayers was quite satisfactory for the coal powders having specific surface areas of about 3 m2/g. Such tight-packed monolayers of 4-tert-butylpyridine require at least one acid site in each 0.7 nm2 of coal surface, and tight-packed films of 3,5-di-tert-butylphenol require one basic site for each 1.25 nm2 of coal surface. However, with coal powders having specific surface areas of 15 m2/g the surface areas calculated from the surface coverage by tert-butylated probes are too low by a factor of about 2; perhaps these powders have insufficient acidic or basic surface sites to bind a tight-packed layer of these probe molecules.
4- t - BUTY L PY R I D I N E 0.71 nrn2
3 ,5-DI - t -BUTYLPHENOL 1.25 nm2
Figure 6. Molecular models of adsorbed Ctert-butylpyridine and 3,5-di-tert-butylphenol used for calculation of area per molecule.
Conclusions 1. The surfaces of coal powders are rich in acidic and
basic sites, with at least 8 basic sites and 14 acidic sites for each 10 nm2 of coal surface, except for the very fine powders (having specific surface areas by nitrogen ad- sorption of about 15 m2/g).
2. The acidic sites of all coal powders tested were equal in strength to phenol and the basic sites were equal in strength to pyridine, except for the older sample of bitu- minous coal, which had weaker basic sites.
3. The anthracite coal had two or four times as many acidic surface sites as basic surface sites, whereas both samples of bituminous coal had about equal surface con- centrations of acidic and basic surface sites.
4. The surface chemistry of coal powders with higher inorganic content was remarkably different, for the acid- base probes adsorbed so strongly that the reversibility was appreciably reduced.
5. Flow microcalorimetry with a downstream concen- tration detector is a good technique for investigating acidic and basic sites on coal powders, providing that the ad- sorbing acids and bases are tert-butyl derivatives so that they do not dissolve into the coal.
6. The acidic or basic strength of tert-butyl derivatives of phenol or pyridine with tert-butyl groups in the 3-, 4-, or 5-positions is essentially the same as phenol or pyridine. However, 2,6-di-tert-butylphenol does not form any acid- base complex with pyridine.
7. The use of tert-butyl groups to limit penetration of adsorbates into coal may be used to estimate specific surface areas of powdered coal. Specific surface areas calculated with the BET method for gas adsorption at 25 "C with 2,2-dimethylbutane are within about 20% of those determined from nitrogen gas adsorption at -196 "C.
8. Specific surface areas for coal powders could also be calculated from the adsorption of tert-butylated acid-base probes from isooctane in flow microcalorimetry experi- ments, based on the assumption that tight-packed mono- layers of these probes adsorbed in 400-s runs at 40 "C. The results on powders having specific surface areas of about 3 m2/g agreed within 20% of those determined by nitrogen gas adsorption a t -196 "C.
Acknowledgment. We are grateful for the support of this work by the Fossil Energy Program of the U.S. De-

Energy & Fuels 1989, 3, 105-108 105
acetate, 141-78-6; 4-tert-butylcyclohexanone, 98-53-3; 4-tert-bu- tylpyridine, 3978-81-2; 2,6-di-tert-butylpyridine, 585-48-8; 4- tert-butylphenol, 98-54-4; 3,5-di-tert-butylphenol, 1138-52-9; 2-tert-butylphenol, 88-18-6; 2,6-di-tert-butylphenol, 128-39-2; phenol, 108-95-2; butyl alcohol, 71-36-3; chloroform-d, 865-49-6; chloroform, 67-66-3; tert-butyl alcohol, 75650; nitrogen, 7727-37-9; 2,2-dimethylbutane, 75-83-2; carbon dioxide, 124-38-9.
partment of Energy, Grant DE-FG22-82PC50809. The FTIR spectral studies and some flow microcalorimetry were done by G.L., Visiting Professor from Zhejiang University, China. Most of the flow microcalorimetric studies are from the Ph.D. Thesis of K.L.J. (1985).
Registry No. Ppidine, 110-86-1; butylamine, 109-73-9; ethyl
Evaluation of Systematic Error Incurred in the Plug Flow Idealization of Tubular Flow Reactor Data
Sundaresh Venkat Ramayya and Michael Jerry Antal, Jr.* Department of Mechanical Engineering, University of Hawaii at Manoa,
Honolulu, Hawaii 96822
Received July 11, 1988. Revised Manuscript Received November 7, 1988
When the plug flow idealization is used to treat tubular flow reactor data, systematic error can be introduced into calculated values of the reaction rate constant K and apparent activation energy E . In the worst case (when the plug flow idealization is (mis)used to evaluate data taken from an ideal, laminar flow reactor), the magnitude of the systematic error in K and E can be evaluated in closed form. In all cases the systematic error reduces the calculated values of K and E below their true values. For single-step, irreversible reactions of order ll2, 3/41 1, 3/2, and 2 at moderate conversions, the fractional systematic error in K does not exceed 20% of its true value, whereas the fractional systematic error in E remains below 10%. Thus, in the worst case the fractional systematic error in K and E due to a misuse of the plug flow idealization is comparable in magnitude to random errors introduced into K and E from uncertainties in analytic techniques and the measurement of residence time a t reaction conditions.
Introduction Tubular flow reactors are used by many chemists and
engineers to make kinetic studies of combustion,' pyroly- sis: and photolysis3 chemistry. Bench scale, tubular flow reactors usually operate in the laminar flow regime. In spite of the fluid's parabolic velocity profile within the tubular reactor, chemical kinetic parameters are almost always obtained from tubular flow reactor data by use of the plug flow idealization. Many experimental and theo- retical examinations of the validity of the plug flow idealization have appeared in the literature."18 The re-
(1) Fontijin, A.; Felder, W. In Reactive Intermediates in the Gas Phase; Setaer, D. W., Ed.; Academic: New York, 1979.
(2) Come, G. M. In Pyrolysis: Theory and Industrial Practice; Al- bright, L. F., Crynes, B. L., Corcoran, W. H., Eds.; Academic: New York, 1983. ~ .~
(3) Howard, C. J. J. Phys. Chem. 1979,83,3. (4) Cleland, F. A.; Wilhelm, R. H. MChE J. 1956,2, 489. (5) Gilbert, M. Combust. Flame 1958,2, 149. (6) Dickens, P. G.; Could, R. D.; Linnett, J. W.; Richmond, A. Nature
(7) Walker, R. E. Phys. Fluids 1961, 4, 1211. (8) Vignes, J. P.; Trambouze, P. J. Chem. Eng. Sci. 1962,17,73. (9) Mulcahy, M. F. R.; Pethard, M. R. Aust. J. Chem. 1963,16, 527. (10) Pokier, R. V.; Carr, R. W., Jr. J. Phys. Chem. 1971, 1953. (11) Azatyan, V. V. Dokl. Adad. Nauk. SSSR 1972,203, 177. (12) Ogren, P. J. J. Phys. Chem. 1975, 79, 1749. (13) Lede, J.; Villermaux, J. Chem. Phys. 1977, 74, 459. (14) Lede, J.; Villermaux, J. Chem. Phys. 1977, 74, 468. (15) Dang, V. D.; Steinberg, M. Chem. Eng. Sci. 1977, 32, 326. (16) Brown, R. L. J. Res. Natl. Bur. Stand., Sect. A 1978, A83, 1. (17) Furue, H.; Pacy, P. D. J. Phys. Chem. 1980,84, 3139.
(London) 1960,187,686.
.~
(3) Howard, C. J. J. Phys. Chem. 1979,83,3. (4) Cleland, F. A.; Wilhelm, R. H. MChE J. 1956,2, 489. (5) Gilbert, M. Combust. Flame 1958,2, 149. (6) Dickens, P. G.; Could, R. D.; Linnett, J. W.; Richmond, A. Nature
il,nndnn\ 1QkO. 1R7. RIlR \__.___._, ____, __., (7) Walker, R. E. Phys. Fluids 1961, 4, 1211. (8) Vignes, J. P.; Trambouze, P. J. Chem. Eng. Sci. 1962,17,73. (9) Mulcahy, M. F. R.; Pethard, M. R. Aust. J. Chem. 1963,16, 527. (10) Pokier, R. V.; Carr, R. W., Jr. J. Phys. Chem. 1971, 1953. (11) Azatyan, V. V. Dokl. Adad. Nauk. SSSR 1972,203, 177. (12) Ogren, P. J. J. Phys. Chem. 1975, 79, 1749. (13) Lede, J.; Villermaux; J. Chem. Phys. 1977, 74, 459. (14) Lede, J.; Villermaux, J. Chem. Phys. 1977, 74, 468. (15) Dang, V. D.; Steinberg, M. Chem. Eng. Sci. 1977, 32, 326. (16) Brown, R. L. J. Res. Natl. Bur. Stand., Sect. A 1978, A83, 1. (17) Furue, H.; Pacy, P. D. J. Phys. Chem. 1980,84, 3139.
sulb of these examinations were recently su"arizedlg in the form of criteria (based on characteristic times de- scribing the operating conditions of the flow reactor) that ensure the validity of the plug flow idealization. In our experience, it is usually possible to design a tubular flow reactor intended for kinetic studies that satisfies these criteria.20 Such reactors may be used in research con- cerning homogeneous catalytic, pyrolytic, photolytic, or solvolytic phenomena.
Although a tubular flow reactor may be initially designed to operate in the plug flow regime, it is not unusual for researchers to extend its use to regimes beyond those or- iginally envisaged. Under such circumstances, significant departures from the intended plug flow regime may occur. This possibility prompts the question: In the worst pos- sible case, how much systematic error will be introduced into kinetic parameters when the plug flow idealization is used to treat laminar flow reactor data? The purpose of this brief paper is to answer this question for single-step, irreversible chemical reactions of order lI2, 3/4, 1, 3/2, and 2. Methods outlined here can be used to evaluate the magnitudes of this systematic error for any other reaction order that may be of interest.
(18) Dang, V. D.; Stenberg, M. J. Phys. Chem. 1980,84, 214. (19) Cutler, A. H.; Antal, M. J.; Jones, M. I d . Eng. Chem. Res. 1988,
(20) Leaney, P. W.; Kershenbaum, L. S. Znd. Eng. Chem. Res. 1987, 27, 691-697.
26,369-373.
0 1989 American Chemical Societv