surface morphology - cornell university · it is important to distinguish between two aspects of...
TRANSCRIPT

Chapter 6
Surface Morphology
We start , in this chapter, by treat ing surface morphology. At the outset, it is important to distinguish between two aspects of surface morphology: structure, the crystallography of defect-free surfaces, and micro structure, the distribution of point and line defects tha t interrupt tha t perfect crystal-lography. In this chapter we will be mainly concerned with microstructure and, to a much lesser extent, s tructure.
It is also important to distinguish between two kinds of surfaces: high-symmetry singular surfaces, at whose orientations surface free energies are cusped and have discontinuous first derivatives; and vicinal surfaces miscut slightly from singular orientations, composed of singular terraces separated by steps. In this chapter we will be concerned with both of these kinds of surfaces.
We first ask, in Section 6.1: what are the statistics of defects on singular and vicinal surfaces in equilibrium with their vapor, i.e., in the absence of net growth? We will find, not surprisingly, tha t those statistics depend both on temperature as well as on the average orientation of the surface. More-over, those statistics are themselves a major determinant of the orientation dependences of surface free energies.
We then ask, in Section 6.2: given full knowledge of surface free energies, what is the equilibrium morphology of crystals, surfaces, and thin films? On the one hand, in one-material systems, e.g., "homoepitaxial" films of one material on substrates of the same material, morphology is determined by the orientation dependence of the surface free energy. On the other hand, in two-material systems, e.g., for "heteroepitaxial" films of one material on substrates of a different material, morphology is also determined by interface and volume free energies.
We finally ask, in Section 6.3: what is the defect microstructure of
201

202 Chapter 6. Surface Morphology
Terrace
Step
Kink Adatom
Step
Kink
Adatom Cluster
Advacancy Cluster
Advacancy
Figure 6.1: Terraces, ledges, kinks, adatoms, adatom clusters, advacancies, and advacancy clusters on a Kossel crystal.
surfaces not in equilibrium with their vapor, i.e., in the presence of net growth? We will find tha t growth is essentially a competition between surface defects of various kinds for adatoms arriving from the vapor. This competition results in a rich and often oscillatory t ime evolution to the overall microstructure of the surface.
6.1 Statistics of Adatoms, Kinks, and Steps
Let us start , in this section, by discussing defects on surfaces. Consider the idealized (001) surface of a cubic elemental crystal. For simplicity, we suppose it to be "unreconstructed," in tha t bonds dangling into free space do not rehybridize into pairs or higher order a tom arrangements. The important microstructural features of the idealized surface of such a "Kossel" crystal1 are illustrated in Figure 6.1.
At low to medium temperatures , the dominant microstructural features are terraces, steps and kinks. The terraces can be considered planar defects in a bulk three-dimensional crystal. Separating terraces of different heights are ledges, or steps, which are line defects on a two-dimensional surface. Finally, along these steps there may also be kinks, which are point defects on one-dimensional steps.
XW. Kossel, Nachr. Ges. Wiss. Gottingen, p. 135 (1927); I.N. Stranski, Z. Phys. Chem. 136, 259 (1928).
6.1. Statistics of Adatoms, Kinks, and Steps 203
At higher temperatures , or away from equilibrium, microstructural fea-tures such as adatoms and ad vacancies, either isolated or clustered into two-dimensional islands, become important . We will begin, in Subsection 6.1.1, by treating adatoms on singular surfaces. Then, in Subsection 6.1.2, we treat kinks in isolated steps. Finally, in Subsection 6.1.3, we treat interact-ing steps on vicinal surfaces.
6.1.1 Adatoms on Singular Surfaces Let us start , in this subsection, by considering adatoms, which we imagine adding one by one to a flat, singular surface. There are two extreme ways in which the adatoms can be distributed on this surface. First , they can cluster together predominantly into a half sheet, as illustrated at the bot tom of Figure 6.2, so as to maximize the number of lateral in-plane bonds and hence minimize energy. Second, they can distribute randomly, as illustrated at the top of Figure 6.2, so as to maximize configurational entropy.
To describe qualitatively the competition between these two kinds of distributions,2 consider the number of bonds formed as a new adatom ar-rives on the surface. The new adatom has four dangling lateral bonds and one dangling vertical bond, but has also "annihilated" the dangling vertical bond of the a tom underneath it. Therefore, the adatom has associated with it four "missing" bonds. If each bond has an energy w, then the adatom has associated with it an energy 4w.
Note, though, tha t as the adatom coverage, Θ, on the surface builds up, adatoms will occasionally find themselves next to other adatoms. If the adatoms are distributed randomly, then the sites adjacent to a given adatom have a probability Θ of being occupied. Since there are four such sites, the energy associated with tha t adatom decreases by 4w6. The energy per adatom is therefore Aw — Ανοθ, or Aw{\ — Θ). Altogether, the energy per surface site is the adatom coverage times the energy per adatom, or
U a d a t = 4 t i ; 0 ( l - 0 ) . (6.1)
This energy is exactly tha t (see Table 3.1 on page 50) associated with a two-component strictly regular solution in which the two components are considered to be adatoms and "missing" adatoms. Viewed in this way, the
2See, e.g., K.A. Jackson, "Theory of crystal growth," in Treatise on Solid State Chem-istry, Vol. 5, N.B. Hannay, Ed. (Plenum Press, New York, 1975), pp. 233-282; and D.E. Temkin, "O molekulyarnoi sherokhovatosti granitsy kristall-rasplav (On molecular roughness of the crystal-melt interface)," in Mekhanizm i kinetika kristallizatsii (Mech-anism and Kinetics of Crystallization), N.N. Sirota, Ed. (Nauka i Tekhnika, Minsk, 1964), p. 86.

204 Chapter 6. Surface Morphology
Phase Separated
0.0 0.2 0.4 0.6 0.8 Adatom coverage (-$)
Figure 6.2: x-T phase diagrams for surface roughening. Above and below each phase diagram are also shown the normalized molar free energies of the adlayer phases at kT/w — 2.5 and kT/w = 1.5, their common tangents, and the critical compositions (open circles) determined by those common tangents.
ideal configurational entropy of mixing per surface site is, by analogy to Equation 3.24,
^adat k = 01n0 + ( l - 6 > ) l n ( l - 6 > ) . (6.2)
The free energy per surface site, normalized to the bond strength, is then
/adat ^adat — -* s adat W
kT 4(9(1 - Θ) + — [Θ In Θ + (1 - θ) 1η(1 - Θ)]. (6.3)
This normalized free energy is shown in Figure 6.2 for two different nor-malized temperatures.

6.1. Statistics of Adatoms, Kinks, and Steps 205
At low temperatures , the bond energy contribution dominates, and the free energy curve is basically concave down. Hence, an adlayer having an average coverage of 1/2 can minimize its free energy by "phase-separating" into regions having near-zero coverage and other regions having near-unity coverage. Note tha t , just as in the discussion of Section 3.1, the Θ = 0 and Θ = 1 intercepts of the tangents to the free energy curve are the chemical potentials of the missing adatoms and adatoms, respectively. Therefore, the two phases can only be in equilibrium on the surface if the chemical potentials of their two components are equal. In other words, again follow-ing the discussion of Section 3.1, the "compositions" of the two phases are determined by the familiar common tangent construction. Physically, the adlayer minimizes its free energy if most of the adatoms condense into a smooth sheet having a large number of lateral in-plane bonds, with a few stray adatoms to increase configurational entropy.
At high temperatures , the entropy contribution dominates, and the free energy is everywhere concave up. Then, adlayers of any composition are stable against phase separation into clusters of adatoms and clusters of missing adatoms. The adatoms are distributed randomly and the surface appears microscopically "rough."
The critical temperature separating smooth, phase-separated adlayers from microscopically rough adlayers is the so-called roughening tempera-ture. It is essentially the critical temperature above which the miscibility gap in this two-component solution vanishes. Since the miscibility gap van-ishes when the free energy curve at Θ = 0.5 just becomes concave up, the critical temperature is tha t temperature at which [d2f/d62]0=0.5 = 0, or 2T,adat = 2w/k. Note tha t the enthalpy of sublimation for this Kossel crys-tal is the bond energy (w) times the number of bonds per a tom (6), divided by the number of atoms per bond (2). Therefore, A/isub = 3w, and we have
2 ^r,adat ~ - A / l s u b . (6.4)
We emphasize tha t this equation can only give a crude indication of the actual roughening temperature of real crystal surfaces. Its derivation neglected, among other things, multilayer roughness, next-nearest-neighbor and longer-range adatom-adatom interactions, and possible dependences of adatom energies on cluster sizes due to surface reconstruction effects, all of which will tend to decrease Tr^at. Nevertheless, the main idea is tha t a critical temperature exists above which the equilibrium surface is rough. In some cases, though, this temperature may be above the melting temperature of the crystal, and hence will be unobservable.
206 Chapter 6. Surface Morphology
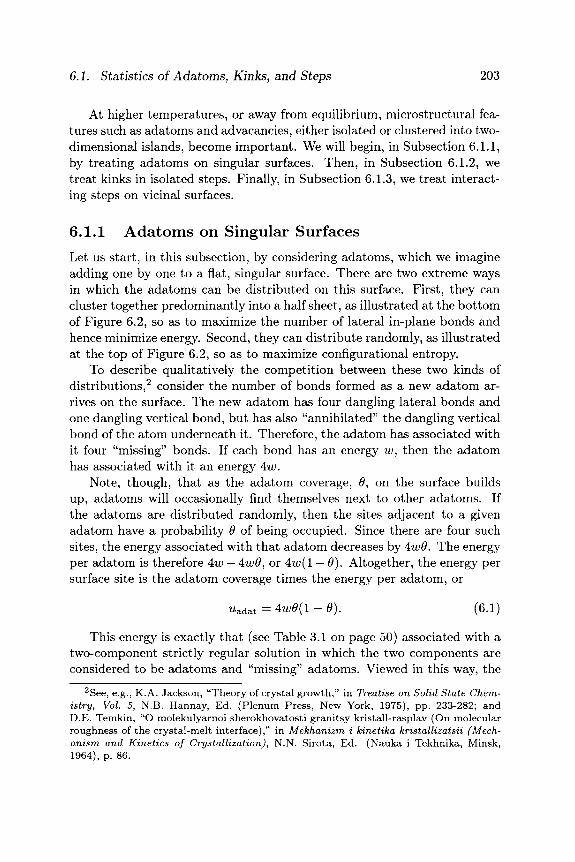
Figure 6.3: A step wandering on the surface of a Kossel crystal due to randomly distributed kinks.
6.1.2 Kinks in Isolated Steps In Subsection 6.1.1, we considered adatom "excitations" on a singular sur-face. In practice, real surfaces nearly always contain steps. If the steps are far enough apar t not to interact, then their energetics are determined by kink "excitations" along their length. In this subsection, we consider such kink excitations in isolated steps.
Consider the isolated step shown in Figure 6.3. Along this step there may be positive or negative kinks tha t cause the step to wander randomly.3
On the one hand, this kink-induced step wandering is favorable, in tha t it increases the entropy of the step. On the other hand, the kinks themselves are unfavorable, because they cost energy. Indeed, for a simple Kossel crys-tal, the energy of a single-kink can be calculated, as shown in Fig. 6.4, to be €kink — w / 2 , where w is the bond strength. For real crystals, how-ever, the energy of a single kink may be considerably different, due to the reconstructed bonds on the surface.
To quantify the statistics of kinks in steps, let us suppose, for simplicity, tha t kinks tha t move steps laterally one lattice unit are much more numer-ous than those which move steps laterally more than one lattice unit . Note, though, tha t this approximation breaks down when kink energies are low relative to kT (see e.g., Figure 6.5).
If we nevertheless make this approximation, then we are interested in the probabilities, p+, p _ and p 0 , tha t an arbitrarily chosen position along a step contains either plus or minus single kinks, or no kink, respectively.4
Since we have excluded all other possibilities, these must sum to unity:
p + + p _ + P o = 0. (6.5)
3 J . Frenkel, "On the surface motion of particles in crystals and the natural roughness of crystalline faces," J. Phys. U.S.S.R. 9, 392 (1945).
4W.K. Burton, N. Cabrera, and F.C. Frank, "The growth of crystals and the equi-librium structure of their surfaces," Philos. Trans. R. Soc. London Ser. A 243, 299 (1951).

6.1. Statistics of Adatoms, Kinks, and Steps
a
Figure 6.4: In moving an atom from position a to position b, two net bonds are broken, but four kinks are formed. If the bond energy is w, then the energy per kink is €kink = 2w/4 = w/2.
If we also allow for the step to make a nonzero average angle, φ, with the underlying lattice, then the difference between the plus and minus kink probabilities is determined by
P+ -P- = t an φ = ρ ^ . (6.6)
In a sense, pext defines an "extrinsic" kink probability imposed by the mis-cut of the step. Then, pmt = 2p_ may be thought of as an "intrinsic" kink probability. Their sum, p i n t -f Pext = P+ + P - , is the total kink probability. If we also assume tha t the kinks do not interact with each other, then the additional energy of the step due to kinks, per lattice unit along the step, is the total kink probability, times the kink energy, ekink· Hence, the total energy of the step is
^step = ^kink (P+ +P-) + e s t e p , (6.7)
where estep is the energy per lattice unit of a straight step without kinks. Since we have assumed the kinks to be independent of each other, the
configurational entropy associated with the kinks is determined by the num-ber of ways they may be distinguishably distributed along the length of the step. Following a simple extension of Equation 3.24 to a three-component alloy, the ideal entropy of mixing is
^step = p+ lnp+ + p _ l n p _ + p0 \np0 (6.8)
Altogether, the step free energy is / s t e p = ustep — Tsstep, which we can rewrite in terms of the extrinsic and intrinsic kink probabilities as
/step = ^step + ekink (P+ + P- )
+ kT[{pext + p i n t / 2 ) ln(pext + Pint/2) + (Pint/2) ln(p i n t /2 )
+ (1 - Pext - Pint) l n ( l - Pext ~ Pint)]· (6.9)

208 Chapter 6. Surface Morphology
Figure 6.5: Scanning tunneling micrograph of a Si surface misoriented 0.5° from (001) toward [110]. The surface height decreases from upper left to lower right.0 On this surface, alternate single-height steps are referred to as type SA and SB, and are smooth and rough, respectively, reflecting the relative energies of kink formation.
aB.S. Swartzentruber, Steps on Si(001): Energetics and Statistical Mechanics (Ph.D Thesis, U. Wisconsin-Madison, 1992).
For a given extrinsic kink probability, the equilibrium intrinsic kink prob-ability is tha t which minimizes /step>, or
^ £ = e k i n k + *T[ ( l /2 ) ln(pe x t + ρ·ιη1/2) + (1/2) ln(p i n t /2 )
- ( l / 2 ) l n ( l - p e x t - P i n t ) ] = 0. (6.10)

6.1. Statistics of Adatoms, Kinks, and Steps 209
Rewriting this in terms of the positive, negative, and missing kink proba-bilities then gives
p + p _ = p20e-2ekink/kT. (6.11)
Note tha t this equation reproduces exactly the "quasi-chemical" expression of Equation 4.44. The reason is tha t equilibrium between kinks on a step can be thought of as a balance between forward and backward chemical reactions, with positive and negative kinks annihilating to form missing kinks, and missing kinks thermally unbinding to form positive and negative kinks.
Equations 6.5, 6.6, and 6.11 are sufficient to determine the three equi-librium kink probabilities, and give, after some algebra,
Po 1 - y / l - (1 - 4e~2^ink/fcT)(1 _ t a n 2 φ}
I _ 4e-ek i nk/fcT
^eqU = taD> + / 2 e _ 2 e k i n k / f c T + 1 t a n2 φ
u _ _tan0 / /fcT 1 2 pequ = Z + ^ p 2 e - 2 e k i n k / f c T + _ t a n 2 ^ (g J 2 )
For the special case of perfectly cut step for which t an φ = 0, the energy, entropy, and free energy of an isolated step simplify to
^step == ^step T" ^kinkP—
_fstep = 2p_lnp_ + (l-2p_)ln(l-2p_) k
/step — ^step — J- 5s tep· (O.loJ
These energies, entropies, and free energies, normalized to the energy of a straight step, are plotted in Figure 6.6 as a function of p- = p+. For concreteness, we have assumed tha t kinks add an additional energy equal to the energy of the step itself, e^ink — ^step = w/s, a s they would in a Kossel crystal. At all nonzero temperatures , the free energy initially decreases with increasing p _ , due to entropy, and then increases, due to energy. The kink probabilities at which the free energies minimize are given by Equations 6.12, which, in the limit tan</> = 0, simplify to
^equ Po = 1 + 2e~ekink/fcT
e q u = equ = _ ; ^ ^

210 Chapter 6. Surface Morphology
0.0 0.2 step
Figure 6.6: Dependences of the energy, entropy, and free energy of a step on the probability of intrinsic kinks. The step is assumed to have no extrinsic kinks, and a kink is assumed to add an additional energy equal to half the energy of a straight step. The energies and free energies are normalized to the energy of a straight step. As the temperature increases, the intrinsic kink probability that minimizes the free energy of the step increases, and the minimum free energy decreases.
At a critical temperature , Tr?step, the step free energy vanishes at its minimum. Above this temperature , steps will form spontaneously on the surface, and the surface is said to be above its roughening temperature . 5
For a Kossel crystal, this critical temperature is Tr?step Note tha t this temperature is considerably below tha t given in the pre-
vious subsection by Equation 6.4. Physically, the reason is tha t , per lattice 5 An alternative way of calculating the roughening temperature is to calculate the
temperature at which the free energies of closed step loops vanishes; see, e.g., A. Zangwill, Physics at Surfaces (Cambridge University Press, Cambridge, 1988), pp. 16-17.
6.1. Statistics of Adatoms, Kinks, and Steps 211
site, step excitations on terraces are energetically less costly than adatom and missing adatom excitations. Note also tha t even this temperature is only a crude indication of the actual roughening temperature of real crys-tal surfaces. Its derivation neglected, among other things, the possibility tha t kinks may move steps laterally more than one lattice unit , and the solid-on-solid constraint tha t prevents steps from crossing each other.
More advanced t reatments take both of these effects into account, and are based on an analogy between noncrossing wandering steps on a surface and ID spinless fermion gases,6 where the Pauli principle automatically prohibits crossing.7 These t reatments also borrow heavily from studies of domain walls in 2D commensurate adsorbate phases,8 which are also analogous to ID spinless fermion gases.9 The result is tha t step free energies approach zero at Tr?step according to 1 0
/ s t e p - e - M ^ , (6.15)
and represent a second-order phase transition from smooth to rough.
6.1.3 Steps on Vicinal Surfaces In Subsection 6.1.2, we calculated the free energy of an isolated step wan-dering on a surface. The free energy was decreased below tha t of a perfectly straight step due to the configurational entropy associated with the mixing of positive, negative, and missing kinks. In the absence of step-step inter-actions, the free energy of a surface depends only on the free energy of the terraces plus those of the steps. For a surface miscut by an angle Θ away from the orientation of a singular surface, and hence having a step density per lattice site of s = t an Θ, the free energy, per lattice site, would then be
/surf = / terr + /step t a n 0 , (6 .16)
where / t e r r is the free energy of the singular, unstepped surface, and /step is given by Equation 6.13.
In this subsection, we consider the possibility tha t the steps interact, and tha t those interactions give rise to nonlinear dependences of the surface
6 C . Jayaprakash, C. Rottman and W.F. Saam, "Simple model for crystal shapes: step-step interactions and facet edges," Phys. Rev. B30 , 6549 (1984).
7P.G. de Gennes, "Soluble model for fibrous structures with steric constraints," J. Chem. Phys. 48, 2257 (1968).
8 J .M. Kosterlitz and D.J. Thouless, "Ordering, metastability and phase transitions in two-dimensional systems," J. Phys. C6 , 1181 (1973).
9H.J . Schulz, B.I. Halperin, and C.L. Henley, "Dislocation interaction in an adsorbate solid near the commensurate-incommensurate transition," Phys. Rev. B26, 3797 (1982).
1 0H.J. Schulz, "Equilibrium shape of crystals," J. Physique 46, 257 (1985).
212 Chapter 6. Surface Morphology
jr^><^^^^
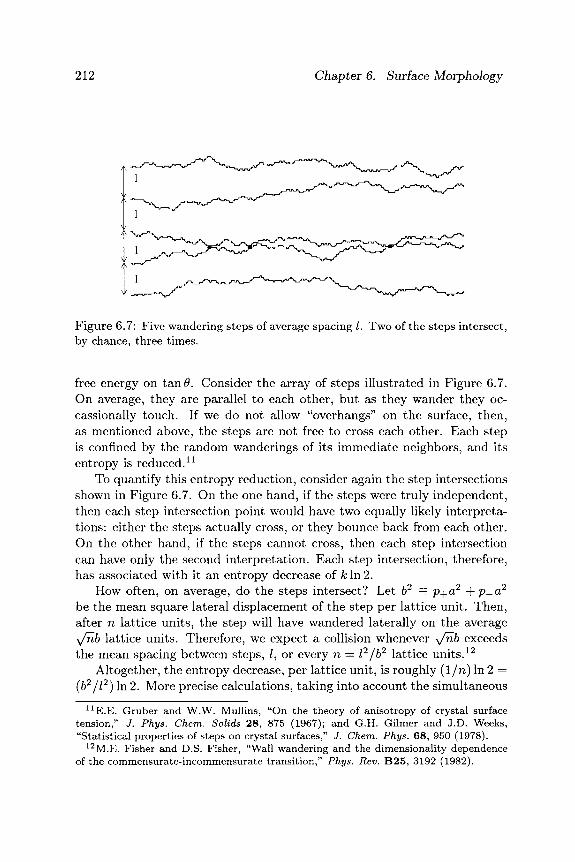
Figure 6.7: Five wandering steps of average spacing /. Two of the steps intersect, by chance, three times.
free energy on t a n # . Consider the array of steps illustrated in Figure 6.7. On average, they are parallel to each other, but as they wander they oc-cassionally touch. If we do not allow "overhangs" on the surface, then, as mentioned above, the steps are not free to cross each other. Each step is confined by the random wanderings of its immediate neighbors, and its entropy is reduced.1 1
To quantify this entropy reduction, consider again the step intersections shown in Figure 6.7. On the one hand, if the steps were truly independent, then each step intersection point would have two equally likely interpreta-tions: either the steps actually cross, or they bounce back from each other. On the other hand, if the steps cannot cross, then each step intersection can have only the second interpretation. Each step intersection, therefore, has associated with it an entropy decrease of A: In 2.
How often, on average, do the steps intersect? Let b2 = p + a 2 + p _ a 2
be the mean square lateral displacement of the step per lattice unit. Then, after n lattice units, the step will have wandered laterally on the average y/nb lattice units. Therefore, we expect a collision whenever y/nb exceeds the mean spacing between steps, /, or every n = Ϊ2 jb2 lattice units . 1 2
Altogether, the entropy decrease, per lattice unit, is roughly (1 /n) In 2 = (62 / / 2 ) In 2. More precise calculations, taking into account the simultaneous
1 1E.E. Gruber and W.W. Mullins, "On the theory of anisotropy of crystal surface tension," J. Phys. Chem. Solids 28, 875 (1967); and G.H. Gilmer and J.D. Weeks, "Statistical properties of steps on crystal surfaces," J. Chem. Phys. 68, 950 (1978).
1 2M.E. Fisher and D.S. Fisher, "Wall wandering and the dimensionality dependence of the commensurate-incommensurate transition," Phys. Rev. B25 , 3192 (1982).
6.1. Statistics of Adatoms, Kinks, and Steps 213
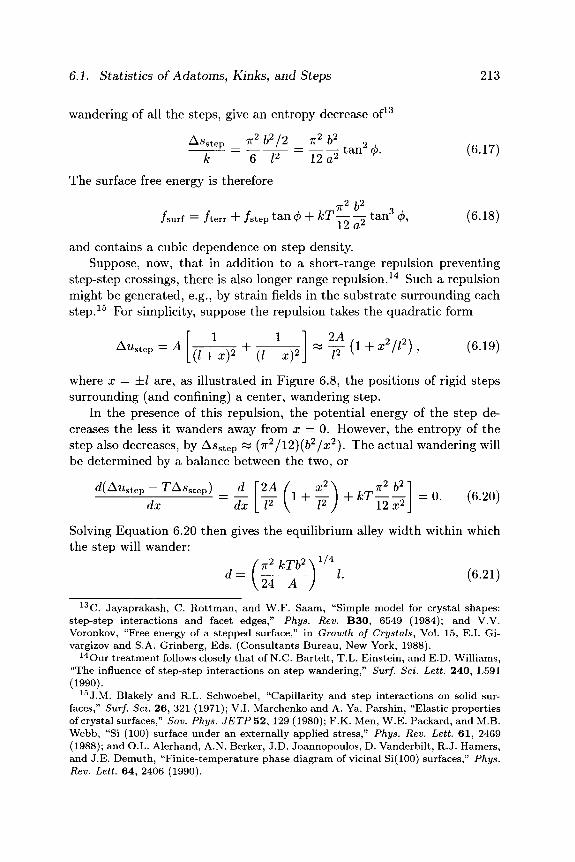
wandering of all the steps, give an entropy decrease of
Z^tep _ ±b*j2_ _ T?_\?_ 2
13
* "6 P -η^Άΐίφ- ( 6 ·1 ? )
The surface free energy is therefore
7Γ2 b2
/surf = /terr + /step tan φ + kT— — tan3 φ, (6.18)
and contains a cubic dependence on step density. Suppose, now, that in addition to a short-range repulsion preventing
step-step crossings, there is also longer range repulsion.14 Such a repulsion might be generated, e.g., by strain fields in the substrate surrounding each step.15 For simplicity, suppose the repulsion takes the quadratic form
A^step = A + ■ (l + x)2 (l-x) f(l + x2/l2), (6.19)
where x = ±Z are, as illustrated in Figure 6.8, the positions of rigid steps surrounding (and confining) a center, wandering step.
In the presence of this repulsion, the potential energy of the step de-creases the less it wanders away from x = 0. However, the entropy of the step also decreases, by Ass t e p ~ (π2/12)(62/χ2). The actual wandering will be determined by a balance between the two, or
d(Austep - TAsg tep ) _ d dx dx
2A ( x2\ lrT1*2b2
= 0. (6.20)
Solving Equation 6.20 then gives the equilibrium alley width within which the step will wander:
J f7T2kTb2Y/4, . N d=(ü—) <· (6-21)
1 3 C . Jayaprakash, C. Rottman, and W.F. Saam, "Simple model for crystal shapes: step-step interactions and facet edges," Phys. Rev. B30 , 6549 (1984); and V.V. Voronkov, "Free energy of a stepped surface," in Growth of Crystals, Vol. 15, E.I. Gi-vargizov and S.A. Grinberg, Eds. (Consultants Bureau, New York, 1988).
1 4Our treatment follows closely that of N.C. Bartelt, T.L. Einstein, and E.D. Williams, "The influence of step-step interactions on step wandering," Surf. Sei. Lett. 240, L591 (1990).
1 5J .M. Blakely and R.L. Schwoebel, "Capillarity and step interactions on solid sur-faces," Surf. Sei. 26, 321 (1971); V.l. Marchenko and A. Ya. Parshin, "Elastic properties of crystal surfaces," Sov. Phys. JETP 52, 129 (1980); F.K. Men, W.E. Packard, and M.B. Webb, "Si (100) surface under an externally applied stress," Phys. Rev. Lett. 6 1 , 2469 (1988); and O.L. Alerhand, A.N. Berker, J.D. Joannopoulos, D. Vanderbilt, R.J. Hamers, and J.E. Demuth, "Finite-temperature phase diagram of vicinal Si(100) surfaces," Phys. Rev. Lett. 64, 2406 (1990).
214 Chapter 6. Surface Morphology
-l/a -d/a
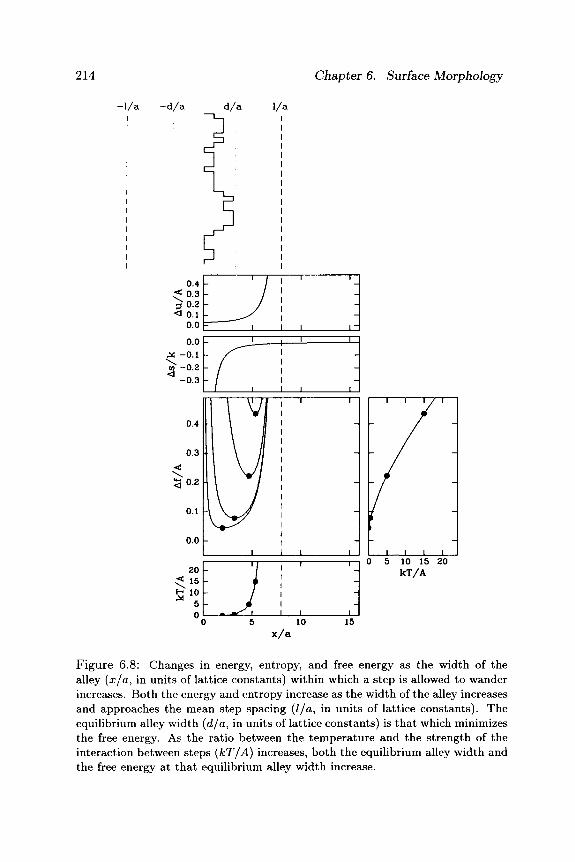
Figure 6.8: Changes in energy, entropy, and free energy as the width of the alley (x/a, in units of lattice constants) within which a step is allowed to wander increases. Both the energy and entropy increase as the width of the alley increases and approaches the mean step spacing (l/a, in units of lattice constants). The equilibrium alley width (d/a, in units of lattice constants) is that which minimizes the free energy. As the ratio between the temperature and the strength of the interaction between steps (kT/A) increases, both the equilibrium alley width and the free energy at that equilibrium alley width increase.

6.2. Equilibrium Morphology 215
As illustrated in Figure 6.8, this balance will depend on temperature, though only weakly, because of the 1/4 power.
Altogether, the change in free energy, per step, due to step-step inter-actions, is
A^=P"(1 + V-e3-J- (6·22)
As expected, the free energy change increases with the step-step interaction strength, A. It also increases with the root-mean-square kink amplitude, 6, since the larger 6 is, the more "difficult" it is to confine the step.
Finally, we can write the surface free energy, per lattice site, as
/surf = / terr + (/step + A / s t e p ) t a n 0
2A I n2kTb2 \ = /terr + /step tan Θ + — I 1 + γ ^ 1 tan3 Θ. (6.23)
Note that the first nonlinear term is cubic, rather than quadratic, in step density. This has consequences, as will be seen in the next section, on the shape of the equilibrium crystal near the tan 0 = 0 orientation.
6.2 Equilibrium Morphology In Section 6.1, we discussed the statistics of adatoms, kinks, and steps. These statistics are the primary determinants of the orientation depen-dence of the free energies of vicinal surfaces. In this section, we suppose that we have been given complete knowledge of surface free energies, and ask: how do those free energies determine equilibrium morphologies? For macroscopic crystals of constant volume, we will find, in Subsection 6.2.1, that the equilibrium shape is determined by the orientation dependence of the surface free energy through what is known as the Wulff construction. For "planar" surfaces of constant average orientation, we will find, in Sub-section 6.2.2, that the equilibrium morphology can be deduced from the orientation dependence of the surface free energy using a common tangent construction. Some average orientations will be stable, while others will tend to break up into combinations of other orientations. Finally, for thin heteroepitaxial films of one material on substrates of another material, we will find, in Subsection 6.2.3, that equilibrium morphologies are determined not only by surface free energies, but by interface and volume free energies as well.

216 Chapter 6. Surface Morphology
6.2.1 Shapes of Crystals: Wulff's Theorem We start, in this subsection, by considering a macroscopic crystal of a sin-gle material whose overall volume is specified. What shape will this crystal have in equilibrium? We discuss, in turn, three related constructions for equilibrium crystal shapes. The most basic is known as Wulffs construc-tion; from Wulffs construction may be derived what is known as Herring's construction; and from Herring's construction in turn may be derived what is known as Andreev's construction.
Wulffs Construction
Intuitively, we expect the equilibrium shape of a crystal of constant volume to be such that those surfaces whose orientations have less energy will have greater area, while those whose orientations have greater energy will have lesser area.
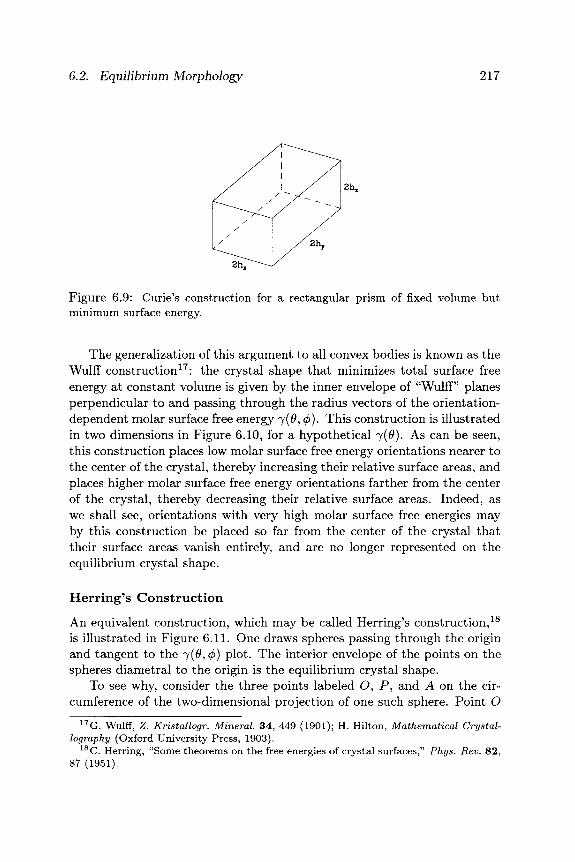
For example, consider the rectangular prism illustrated in Figure 6.9, bounded by rectangular faces of specific surface free energies *yx, *yy, and yz. If the distances of each face from the crystal center are hx, hy, and /i2, then the face areas are hyhz, hxhz, and hxht, and the total surface free energy is
E = 2-yxhyhz + 2-yyhxhz + 2jzhxhy. (6.24) If we require the volume, V = 8hxhyhz, to be constant, then we can write
E = l r + l ; + 2 W v (6·25)
To find the distances hx and hy that minimize the energy, we set dE/dhx = dE/dhy = 0, giving
lxhyhz = jyhxhz = yzhxhy = (ΐχΊνΊζ)1/3ν2/3 = constant. (6.26)
In other words, the free energies of all the faces of the equilibrium crystal are equal.
Note also that the areas of the faces are inversely proportional to their distances from the center of the crystal [e.g., hxhy = V/(8hz)]. Therefore, those distances are in turn proportional to the specific surface free energies:
— = — = — = (ΊχΊυΊζ\ ' /g 2j\ hx hy hz \ V )
In other words, faces of high specific surface free energy lie farther from the center of the crystal than those of low specific surface free energy, and therefore have lower relative surface areas.16
1 6 P . Curie, "Sur la formation des cristaux et sur les constantes capillaires de leurs differentes faces," Bull. Soc. Min. de France 8, 145 (1885).
6.2. Equilibrium Morphology 217
Figure 6.9: Curie's construction for a rectangular prism of fixed volume but minimum surface energy.
The generalization of this argument to all convex bodies is known as the Wulff construction1 7: the crystal shape tha t minimizes total surface free energy at constant volume is given by the inner envelope of "Wulff" planes perpendicular to and passing through the radius vectors of the orientation-dependent molar surface free energy η(θ, φ). This construction is illustrated in two dimensions in Figure 6.10, for a hypothetical 7(0). As can be seen, this construction places low molar surface free energy orientations nearer to the center of the crystal, thereby increasing their relative surface areas, and places higher molar surface free energy orientations farther from the center of the crystal, thereby decreasing their relative surface areas. Indeed, as we shall see, orientations with very high molar surface free energies may by this construction be placed so far from the center of the crystal tha t their surface areas vanish entirely, and are no longer represented on the equilibrium crystal shape.
Herring's C o n s t r u c t i o n
An equivalent construction, which may be called Herring's construction,1 8
is illustrated in Figure 6.11. One draws spheres passing through the origin and tangent to the 7(0, φ) plot. The interior envelope of the points on the spheres diametral to the origin is the equilibrium crystal shape.
To see why, consider the three points labeled O, P , and A on the cir-cumference of the two-dimensional projection of one such sphere. Point O
1 7G. Wulff, Z. Kristallogr. Mineral. 34, 449 (1901); H. Hilton, Mathematical Crystal-lography (Oxford University Press, 1903).
1 8 C . Herring, "Some theorems on the free energies of crystal surfaces," Phys. Rev. 82, 87 (1951).
218 Chapter 6. Surface Morphology
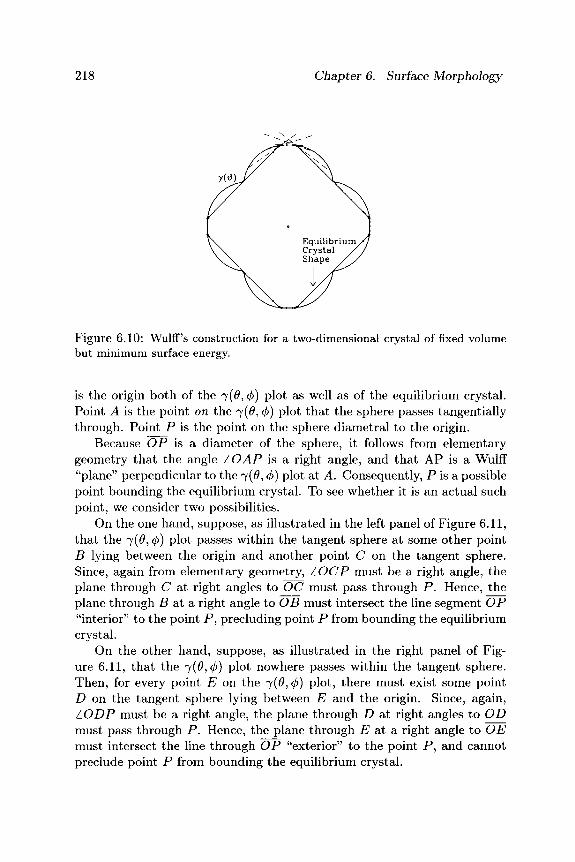
Figure 6.10: Wulffs construction for a two-dimensional crystal of fixed volume but minimum surface energy.
is the origin both of the 7(0, φ) plot as well as of the equilibrium crystal. Point A is the point on the 7(0, φ) plot tha t the sphere passes tangentially through. Point P is the point on the sphere diametral to the origin.
Because OP is a diameter of the sphere, it follows from elementary geometry tha t the angle LOAP is a right angle, and tha t A P is a Wulff "plane" perpendicular to the 7(0, φ) plot at A. Consequently, P is a possible point bounding the equilibrium crystal. To see whether it is an actual such point, we consider two possibilities.
On the one hand, suppose, as illustrated in the left panel of Figure 6.11, tha t the η(θ,φ) plot passes within the tangent sphere at some other point B lying between the origin and another point C on the tangent sphere. Since, again from elementary geometry, LOCP must be a right angle, the plane through C at right angles to OC must pass through P. Hence, the plane through B at a right angle to OB must intersect the line segment OP "interior" to the point P , precluding point P from bounding the equilibrium crystal.
On the other hand, suppose, as illustrated in the right panel of Fig-ure 6.11, tha t the 7(0, φ) plot nowhere passes within the tangent sphere. Then, for every point E on the 7(0, φ) plot, there must exist some point D on the tangent sphere lying between E and the origin. Since, again, LODP must be a right angle, the plane through D at right angles to OD must pass through P. Hence, the plane through E at a right angle to OE must intersect the line through OP "exterior" to the point P , and cannot preclude point P from bounding the equilibrium crystal.

6.2. Equilibrium Morphology 219
7(tf)
E A
Figure 6.11: Herring's construction for deducing whether orientation A is repre-sented on the equilibrium crystal shape at P. For the 7(0) plot shown on the left, orientation A is not represented, because the 7(0) plot at another orientation B lies within the tangent circle. For the 7(0) plot shown on the right, orientation A is represented, because at every other orientation (e.g., E) the 7(0) plot lies outside the tangent circle.
Altogether, the equilibrium crystal shape is the locus of diametral points P on all tangent spheres not intersected by other portions of the 7(0, φ) plot. Alternatively, one may find first the locus of diametral points P on all tangent spheres without regard to intersections with the 7(0, φ) plot, and then take the interior envelope of those points.
A n d r e e v ' s C o n s t r u c t i o n
In a sense, Herring's construction maps points like A in energy-orientation (0, 0 ,7 ) space onto points like P in real (#, 2/, z) space. In other words, it tells us where in real space a surface of a particular orientation will appear. To quantify this mapping, consider the circle shown in Figure 6.12 tangent to and passing through the 7(0) plot at point A. We would like to deduce the (x, z) coordinates of the point P diametral to point O in terms of 7(0) and Ύ'(Θ) at point A.
First, let us deduce the x coordinates of point P. Denote the lengths of the line segments AJ and AP by Ζχ and /2, respectively. Then, the x-coordinate of the point P is
x = (/x -f Z2)cos0. (6.28)

220 Chapter 6. Surface Morphology
Figure 6.12: Andreev's construction for deducing the mapping between point A in energy-orientation space onto point P on the equilibrium crystal in real space.
Now we note tha t l\ is 7 t a n 0 , and if we let ß be the angle ΔΑΚΟ, where the line through AK is tangent to 7(0) at A, then I2 is 7 tan( /3 + 0) = 7(tan/3 + t a n 0 ) / ( l — t a n ß t a n 0 ) . Hence,
x = 7 cos 0 ( t an 0 + tan β + t an 0
1 — tan ß t an 0
Finally, since tan/3 is the slope of the 7(0) plot, we can rewrite it as
0 (7 cos 0) <9(7cos0)/<90 — 7 sin 0 + 7 ' cos Θ tan/3 =
«9(7 sin 0) $ (7 sin θ) /8Θ 7 cos 0 + 7 ' sin 0
(6.29)
(6.30)
Inserting this expression for tan/3 into Equation 6.29 then gives, after some algebra,
/ Λ d ( 7 / c o s # ) x = 7 / c o s 0 + 7 t a n 0 c o s 0 = - ^ τ ^ . (6.31)
a ( t a n 0 ) Second, let us deduce the z-coordinate of point P. By inspection of
Figure 6.12, the ^-coordinate is the difference between the lengths of the line segments OJ and LJ. Since OJ is 7 / c o s 0 and LJ is x t a n 0 , we then have
7 x t an 0 7 — t a n 0 0 ( 7 / cos 0)
(6.32) cos 0 ~ cos 0 " # ( t an 0)
Equations 6.31 and 6.32 are explicit algebraic expressions for the Herring construction. Note tha t bo th are expressed in terms of / = 7 / c o s 0 and
6.2. Equilibrium Morphology 221
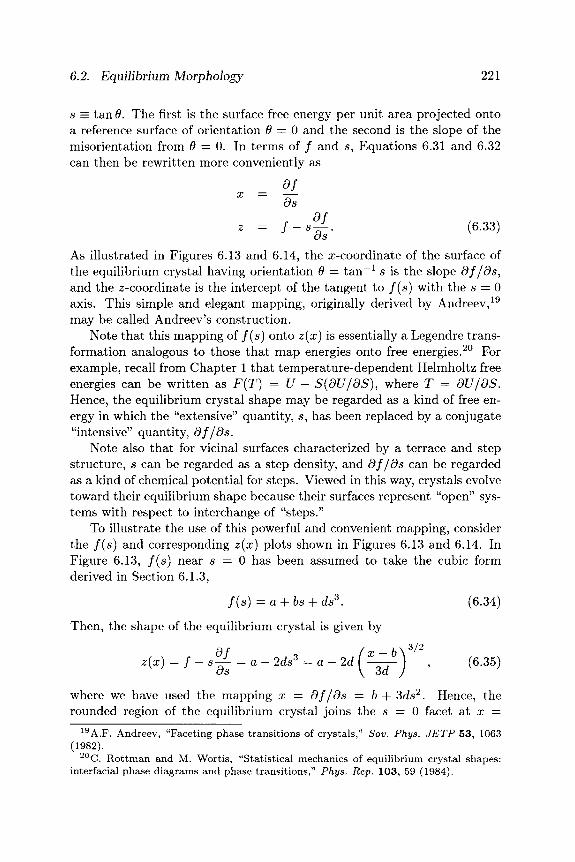
s = tan Θ. The first is the surface free energy per unit area projected onto a reference surface of orientation 9 = 0 and the second is the slope of the misorientation from Θ = 0. In terms of / and s, Equations 6.31 and 6.32 can then be rewritten more conveniently as
df X = Ts
z = / - β | £ · (6-33)
As illustrated in Figures 6.13 and 6.14, the x-coordinate of the surface of the equilibrium crystal having orientation Θ = t a n - 1 s is the slope df/ds, and the z-coordinate is the intercept of the tangent to f(s) with the s = 0 axis. This simple and elegant mapping, originally derived by Andreev,1 9
may be called Andreev's construction. Note tha t this mapping of f(s) onto z(x) is essentially a Legendre trans-
formation analogous to those tha t map energies onto free energies.20 For example, recall from Chapter 1 tha t temperature-dependent Helmholtz free energies can be writ ten as F(T) = U — S(dU/dS), where T = dU/dS. Hence, the equilibrium crystal shape may be regarded as a kind of free en-ergy in which the "extensive" quantity, s, has been replaced by a conjugate "intensive" quantity, df/ds.
Note also tha t for vicinal surfaces characterized by a terrace and step structure, s can be regarded as a step density, and df/ds can be regarded as a kind of chemical potential for steps. Viewed in this way, crystals evolve toward their equilibrium shape because their surfaces represent "open" sys-tems with respect to interchange of "steps."
To illustrate the use of this powerful and convenient mapping, consider the f(s) and corresponding z(x) plots shown in Figures 6.13 and 6.14. In Figure 6.13, f(s) near 5 = 0 has been assumed to take the cubic form derived in Section 6.1.3,
f(s) = a + bs + ds3. (6.34)
Then, the shape of the equilibrium crystal is given by
ßf _ „ o , „ 3 _ „ njiX~b 3/2
z(x) = f - s^f =a- 2ds6 =a-2d[ ^—^ ) , (6.35) ds \ 3d )
where we have used the mapping x = df/ds = b + 3ds2. Hence, the rounded region of the equilibrium crystal joins the 5 = 0 facet at x =
19 A.F. Andreev, "Faceting phase transitions of crystals," Sov. Phys. JETP 53, 1063 (1982).
2 0 C . Rottman and M. Wortis, "Statistical mechanics of equilibrium crystal shapes: interfacial phase diagrams and phase transitions," Phys. Rep. 103, 59 (1984).

222 Chapter 6. Surface Morphology
0.15
0.10
0.05
0.00
Figure 6.13: Andreev's construction near an orientation around which the pro-jected surface free energy per unit area (left) is concave up in tan0, and for which the tan Θ = 0 facet joins the rest of the crystal (right) with a continuous first derivative.
b with a "critical exponent" of 3/2. Because the misorientation of the rounded region goes to zero continuously as the facet is approached [zf(x) is continuous but z"(x) is not], the junction can be thought of as a second-order phase transit ion.2 1
In Figure 6.14, f(s) has been assumed to be concave down except for cusps at s = 0 and s = ± 1 . Then, the z(x) mapping becomes "reentrant," and the 5 = 0 and 5 = 1 facets join directly. Because the orientation of the crystal changes discontinuously \z'(x) is discontinuous], the junction can be thought of as a first-order phase transition.
6.2.2 Shapes of Surfaces: Facetting In Subsection 6.2.1, we discussed various constructions and mappings for deducing the equilibrium shapes of crystals subject to the constraint of constant volume. Often, however, a different constraint is imposed, tha t of constant average surface orientation. In this subsection, we ask: under what conditions will such a surface be stable, and under what other conditions will it tend to "facet" into combinations of other orientations? An example of such facetting is shown in Figure 6.15.
To answer this question it will be convenient to use the quantities in-troduced in Subsection 6.2.1. These are the surface free energies per unit
2 1 V.L. Pokrovsky and A.L. Talapov, "Ground state, spectrum, and phase diagram of two-dimensional incommensurate crystals," Phys. Rev. Lett. 42, 65 (1979).
6.2. Equilibrium Morphology 223
0.12
0.10
<p 0.08 w o
^ 0 . 0 6 N
0.04
0.02
0.00
— i —
- V^
_
1 -1 .0
— i 1 1 —
_ _ l 1 l _ _ - 0 . 5 0.0 0.5
t a m ?
— ι —
1 1.0
0.12
0.10
0.08
0.06
0.04
0.02
0.00
1 1
/ " J-- T ■ / ■
- 0 . 1 0 - 0 . 0 5
1
1 0.00
X
— i
\ v Λ ■ N
0.05
1
-
-
V 1 0.10
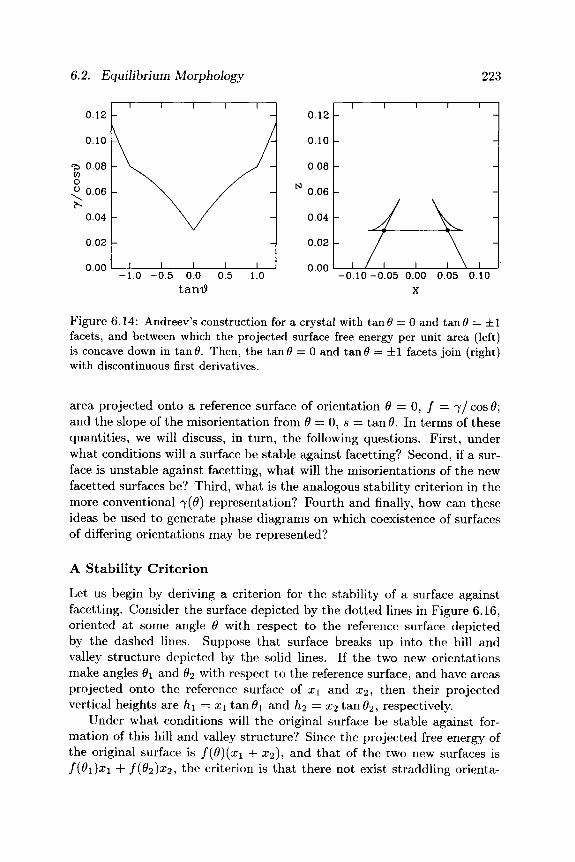
Figure 6.14: Andreev's construction for a crystal with tan0 = 0 and tan0 = ± 1 facets, and between which the projected surface free energy per unit area (left) is concave down in tan0. Then, the tan0 = 0 and tan0 == ±1 facets join (right) with discontinuous first derivatives.
area projected onto a reference surface of orientation 0 = 0, / = 7 / cos 0; and the slope of the misorientation from 0 = 0 , 5 = tan 0. In terms of these quantities, we will discuss, in turn , the following questions. First, under what conditions will a surface be stable against facetting? Second, if a sur-face is unstable against facetting, what will the misorientations of the new facetted surfaces be? Third, what is the analogous stability criterion in the more conventional 7(0) representation? Fourth and finally, how can these ideas be used to generate phase diagrams on which coexistence of surfaces of differing orientations may be represented?
A Stabi l i ty Cr i ter ion
Let us begin by deriving a criterion for the stability of a surface against facetting. Consider the surface depicted by the dot ted lines in Figure 6.16, oriented at some angle 0 with respect to the reference surface depicted by the dashed lines. Suppose tha t surface breaks up into the hill and valley structure depicted by the solid lines. If the two new orientations make angles θχ and 02 with respect to the reference surface, and have areas projected onto the reference surface of x\ and x2, then their projected vertical heights are hi = xx t a n 0 i and h2 = x2 t a n 0 2 , respectively.
Under what conditions will the original surface be stable against for-mation of this hill and valley structure? Since the projected free energy of the original surface is f(ß){x\ + ι 2 ) , and tha t of the two new surfaces is f(9i)xi + f(92)x2, the criterion is tha t there not exist straddling orienta-

224 Chapter 6. Surface Morphology
Figure 6.15: Scanning tunneling micrograph of a Si surface cut 6° from (111) along an azimuth rotated about 10° away from the high symmetry [112] direction. The scan area is approximately 200 x 300 A. The surface has phase separated into two facets of different orientations, one containing 7 x 7 recon-structed terraces separted by straight [112] steps and one rotated azimuthally by approximately 40° from the [112] direction.0
a J . Wei, X-S Wang, N.C. Bartelt, E.D. Williams, and R.T. Tung, "The precipitation of kinks on stepped S i ( l l l ) surfaces," J. Chem. Phys. 94, 8384 (1991).
tions θχ and θ2 such tha t
/(*) > /(öi)—5—+/(02)—5—. (6·36) Xl + X2 Xl + X2
Note tha t from the relations x\ = / i i / t a n # i , x2 = h2/ta,n62, and X\-\- x2 — (h\ + h2)/ ί&ηθ, the fractions of the reference surface tha t have the two orientations can be deduced, after some algebra, to be
x2 tan Θ — t an θ\ X\ H- x2 t an θ2 — t an θχ χι t an Θ — t an θι , Λ„.
= 1 - 1 — 5 ΠΓ7Γ· ( 6 ·3 7 ) Χι + x2 t an θ2 — t an θι
These equations are equivalent to a lever rule tha t determines, given an average orientation 0, the amounts of two other orientations required for a

6.2. Equilibrium Morphology 225
^ ι
Figure 6.16: Geometry of a surface of average orientation Θ that has facetted into two surfaces of orientations θ\ and Θ2 relative to a reference surface. The projected horizontal widths and vertical heights of the two surfaces are 2xi, 2^2, 2h\, and 2/i2, respectively.
continuous joining of surfaces. Altogether, the stability criterion is then
/ ( t an (0 ) <
Λ v / t a n ö — tan 0i \ „, Λ x / t a n # — tan# i \ / ( t a n Ö l ) i 1 - tonft-tonoj + / ( ^ 2 ) ( t o n f t - t o n g j '
(6.38)
where we consider / to be a function of tan Θ ra ther than Θ. In other words, a surface of orientation Θ is stable if on an / vs. t a n # plot, / ( t a n # ) is less than all lever-rule-weighted sums of / ( t a n # i ) and / ( t a n ^ ) ·
T h e C o m m o n Tangent Cr i ter ion
Now tha t we have derived a criterion for stability of a surface against facetting, let us ask the opposite question. Suppose tha t the original sur-face is unstable with respect to breakup? Wha t will be the two straddling orientations, which can be considered two "phases," tha t will coexist sta-bly in its stead? To answer this question, we imagine making two distinct concerted variations in the geometries of the two surfaces, and require the total free energy change to vanish.
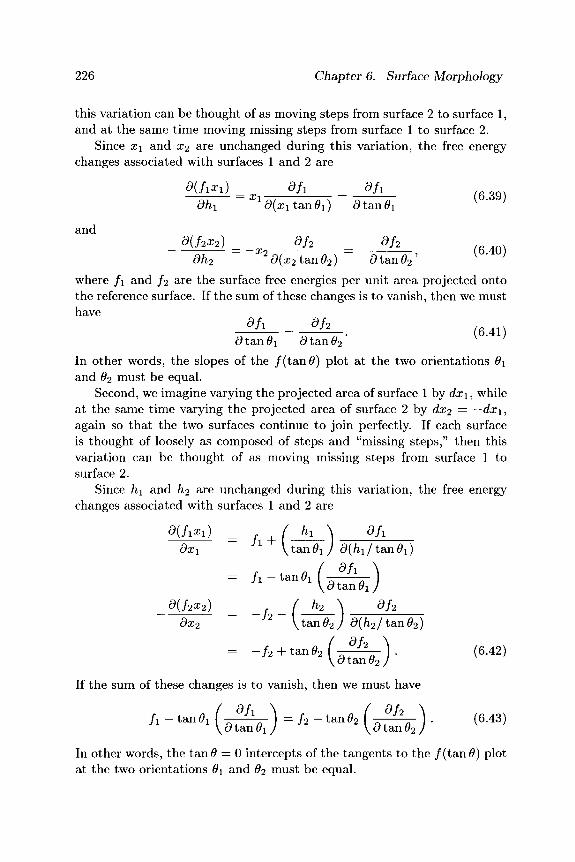
First, we imagine varying the projected vertical height of surface 1 by dhi, while at the same time varying the projected vertical height of surface 2 by ά\ι<ι — —dhi, so tha t the two surfaces continue to join perfectly. If each surface is thought of loosely as made up of steps and "missing steps," then
226 Chapter 6. Surface Morphology
this variation can be thought of as moving steps from surface 2 to surface 1, and at the same time moving missing steps from surface 1 to surface 2.
Since x\ and x2 are unchanged during this variation, the free energy changes associated with surfaces 1 and 2 are
d(fixi) a / i ö/i oh\ a (x i t an^ i ) a t an# i
and _ d{f2X2) = χ^ df2 = df2
dh2 ö(x2tan^2) 9 tan #2' where f\ and f2 are the surface free energies per unit area projected onto the reference surface. If the sum of these changes is to vanish, then we must have
d h = d h . (6.41) 0 tan 0i <9tan02
In other words, the slopes of the / ( tan0) plot at the two orientations θχ and θ2 must be equal.
Second, we imagine varying the projected area of surface 1 by dx\, while at the same time varying the projected area of surface 2 by dx2 = —dx\, again so that the two surfaces continue to join perfectly. If each surface is thought of loosely as composed of steps and "missing steps," then this variation can be thought of as moving missing steps from surface 1 to surface 2.
Since h\ and h2 are unchanged during this variation, the free energy changes associated with surfaces 1 and 2 are
ö( / i* i ) , ^ ( hx \ dfi — h + dx\ \tan9\ ) d(h\/tan6i)
= fx - t an f l i 1 d^1 ) J1 1\dtane1J d(f2x2) = _h _ (_h_\ dh
dx2 \ tan 02/ 9(/i2/tan02)
If the sum of these changes is to vanish, then we must have
Λ -tanÖ1 (sSbr) =h ~tan*2 {ä£k) ■ ( 6 ·4 3 )
In other words, the tan# = 0 intercepts of the tangents to the / ( tan#) plot at the two orientations Q\ and θ2 must be equal.

6.2. Equilibrium Morphology 227
Altogether, Equations 6.41 and 6.43 combined tell us tha t both the slopes and intercepts of the two tangents must be equal, and so the tan-gents themselves must coincide. Therefore, the condition for coexistence of two surfaces of different orientation is tha t their / ( t a n 0 ) plots share a common tangent.22 Another way of viewing the origin of this construction is to think of the steps as particles. Then, equilibrium between surfaces of different orientation is analogous to equilibrium with respect to inter-change of particles, hence equality of chemical potentials.2 3 In a sense, s = t a n 0 is an extensive, rather than an intensive, variable, and can vary inhomogeneously within an equilibrium system.2 4
Herring's Cr i ter ion
The common tangent criterion for orient at ional stability just derived is a powerful and useful one. It implies tha t conditions for stability and coexistence of surface orientations are formally equivalent to the conditions for stability and coexistence of binary alloy phases. Hence, the arguments and insights derived from Chapter 3 apply directly.
For example, if the / ( t a n 0 ) plot is concave up as in the top of Fig-ure 6.17, then all orientations are stable. If it is concave down, as in the bot tom of Figure 6.17, then only the t a n 0 = 0 and t a n 0 = ± 1 facets are stable; all other orientations decompose into a phase mixture of those facets, in proportions given by the lever rule.
This common tangent criterion in the / ( t a n 0 ) representation can also be understood using the more conventional 7(0) representation. To see how, note tha t the critical shape for the / ( t a n 0 ) plot dividing these two extremes of behavior is a straight line:
/ ( t a n 0) = A + B t an 0. (6.44)
Note tha t on a 7(0) plot, such straight lines become circles passing through the origin,
7(0) = (cos 0 ) / ( t a n 0) = A cos 0 + B sin 0, (6.45)
with origin at (A/2,B/2) and radius {A/2)2 + (B/2)2. Hence, / ( t a n 0 ) plots tha t are concave up correspond to 7(0) plots tha t "bulge" out between facets less than would a sphere passing through the origin, as in the top of Figure 6.17, and / ( t a n 0 ) plots tha t are concave down correspond to
22 A.A. Chernov, "The spiral growth of crystals," Sov. Phys.-Usp. 4, 116 (1961); and N. Cabrera, "The equilibrium of crystal surfaces," Surf. Sei. 2, 320 (1964).
2 3 P . Nozieres, "Surface melting and crystal shape," J. Phys. 50, 2541 (1989). 2 4N.C. Bartelt, T.L. Einstein, and C. Rottman, "First-order transitions between sur-
face phases with different step structures," Phys. Rev. Lett. 66, 961 (1991).

228 Chapter 6. Surface Morphology
Ί 1 1 Γ
yW
Stable I I I L 1 1 1 Γ Ί Π
Critically stable I I I L Ί 1 1 Γ
Unstable I
yW
-1.0 - 0 . 5 0.0 0.5 tantf
l.o
Figure 6.17: Common tangent criteria for orientational stability. The / ( t an0) = 7 / cos Θ plot at top is concave up between tan Θ = 0 and tan Θ = ± 1 , hence surfaces whose orientations lie between those angles are stable against facetting into an inhomogeneous mix of Θ = 0 and θ = ±π/4 surfaces. The / ( t an Θ) — 7 / cos Θ plot at bottom is concave down between tan# = 0 and tan# = ± 1 , hence surfaces whose orientations lie between those angles are unstable against facetting into an inhomogeneous mix of Θ = 0 and θ = ±π / 4 surfaces. The / ( t an Θ) = 7 / cos Θ plot in the middle are straight lines between tan# = 0 and tanö = ± 1 , hence surfaces whose orientations lie between those angles are critically stable against facetting into an inhomogeneous mix of Θ = 0 and θ = ±π / 4 surfaces.

6.2. Equilibrium Morphology 229
7(0) plots tha t bulge out between facets more than would a sphere passing through the origin, as in the bo t tom of Figure 6.17.25
Now, tangent spheres at orientations tha t bulge less than spherically must lie inside the η(θ) plot, and hence lie on the equilibrium crystal shape, while tangent spheres at orientations tha t bulge more than spherically must lie outside the 7(0) plot, and hence be absent from the equilibrium crystal shape. As a consequence, we also have Herring's criterion, originally proved in a different maner: those orientations are stable tha t are represented on the equilibrium crystal shape, and those orientations are unstable tha t are not represented on the equilibrium crystal shape.
T e m p e r a t u r e - D e p e n d e n t P h a s e Equi l ibr ia
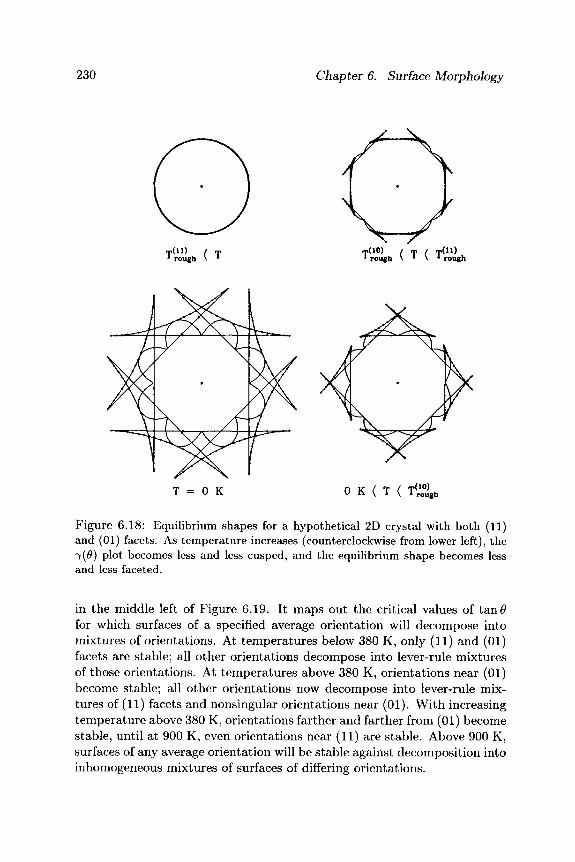
Let us now illustrate the stability criterion and common tangent construc-tions just derived with a concrete example. Consider the cubic 2D crystal shown in Figure 6.18, whose lowest free energy surfaces are (11) and (01) facets. At low temperatures , we expect the 7(0) plot to be deeply cusped at those orientations, leading to an equilibrium crystal bounded solely by these facets. As temperature increases, the η(θ) plot becomes less and less cusped. In this case, the (01) facets are shown to roughen first, leading to an equilibrium crystal bounded by continuously curved surfaces joined to (11) facets. Then, the (11) facets roughen, leading to an equilibrium crystal bounded everywhere by continuously curved surfaces.
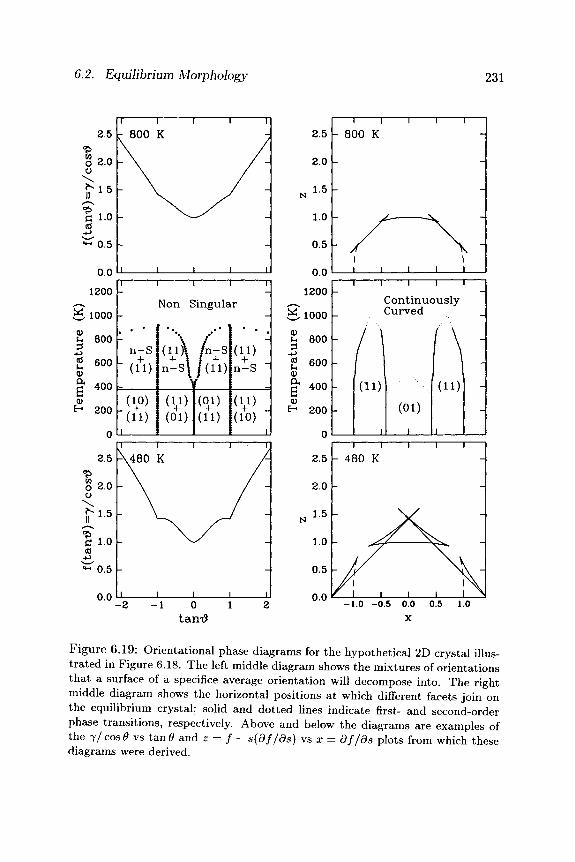
Another way of looking at the temperature evolution of this system is to plot, as illustrated in Figure 6.19, / vs t a n 0 and z = f — s(df/ds) vs x = df/ds diagrams. At low temperatures, the / ( t a n # ) plot is deeply cusped at t a n # = 0 and t a n # = ± 1 . Application of the common tangent construction then leads to the orientational gap shown in the bot tom left of Figure 6.19, and to the first-order facet-facet joining shown in the bo t tom right of Figure 6.19. At higher temperatures , the η(θ) plot becomes less and less cusped. As this happens, the orientational gap vanishes, and all orientations become stable. At the same time, the first-order facet-facet joining evolves to a second-order joining, and ultimately disappears entirely.
Finally, it is often convenient to plot these orientational gaps (in tan Θ) and facet-facet phase transition positions (in x = df/ds) as temperature-dependent phase diagrams. The resulting T ( t an Θ) phase diagram is shown
2 57(0) plots composed of exactly spherical bulges between facets, as in the middle of Figure 6.17, are also known as "raspberry" figures; see F.C. Frank, "The geometri-cal thermodynamics of surfaces," in W.D. Robertson and N.A. Gjostein, Eds., Metal Surfaces: Structure, Energetics and Kinetics, Proceedings of a joint seminar of the American Society for Metals and the Metallurgical Society of AIME, October 27-28, 1962 (American Society for Metals, Metals Park, Ohio, 1963), Chap. 1.
230 Chapter 6. Surface Morphology
o o T ( n ) / T T(io) / T / m(ii) 1 rough \ * * rough \ L \ * rough
T = 0 K 0 K ( T ( T^u,
Figure 6.18: Equilibrium shapes for a hypothetical 2D crystal with both (11) and (01) facets. As temperature increases (counterclockwise from lower left), the 7(0) plot becomes less and less cusped, and the equilibrium shape becomes less and less faceted.
in the middle left of Figure 6.19. It maps out the critical values of t a n # for which surfaces of a specified average orientation will decompose into mixtures of orientations. At temperatures below 380 K, only (11) and (01) facets are stable; all other orientations decompose into lever-rule mixtures of those orientations. At temperatures above 380 K, orientations near (01) become stable; all other orientations now decompose into lever-rule mix-tures of (11) facets and nonsingular orientations near (01). Wi th increasing temperature above 380 K, orientations farther and farther from (01) become stable, until at 900 K, even orientations near (11) are stable. Above 900 K, surfaces of any average orientation will be stable against decomposition into inhomogeneous mixtures of surfaces of differing orientations.
6.2. Equilibrium Morphology 231
0.0 1200
$£, looo
u 800
g 600
E 4 0 0
E- 200
0
2.5
1 1 1 1 1
Non-Singular
n - S
- (i+D
(10) " ( I D 1
:<lA U ;n-S\j(l l):
(y) | ( o i )
(01) (ID
( i + D; n-S
(1+D (10) "
1
2.5
2.0
1.5
1.0
0.5
n n
1 1 1
- 800 K
/ 1 1 1
1 1
-
-
y
\ 1 1
1200
J * 1000 r-
u 800 h
£ 600 I-
|· « o h
Continuously Curved
l\ (11)
1
(01)
1
f\ (11)
1 1 — i r 480 K
Figure 6.19: Orientational phase diagrams for the hypothetical 2D crystal illus-trated in Figure 6.18. The left middle diagram shows the mixtures of orientations that a surface of a specifice average orientation will decompose into. The right middle diagram shows the horizontal positions at which different facets join on the equilibrium crystal; solid and dotted lines indicate first- and second-order phase transitions, respectively. Above and below the diagrams are examples of the 7 / cos Θ vs tan<9 and z = / - s(df/ds) vs x = df/ds plots from which these diagrams were derived.

232 Chapter 6. Surface Morphology
The corresponding T(x) phase diagram is shown in the middle right of Figure 6.19. It maps out the critical horizontal positions at which different facets join on the equilibrium crystal. At temperatures below 380 K, (11) facets join (01) facets in first-order phase transitions. At temperatures above 380 K, orientations near (01) begin to appear. As a consequence, (11) facets join continuously curved orientations near (01) in first-order phase transitions, while the continuously curved orientations near (01) join (01) facets in second-order phase transitions. Wi th increasing temperature above 380 K, these alternative orientations near (01) become increasingly stable, until at 500 K the (01) facets "roughen" and disappear entirely.
Above 500 K, (01) facets are absent from the equilibrium crystal, but (11) facets are present, and continue to join continuously curved orienta-tions near (01) in first-order phase transitions. Wi th increasing temperature above 500 K, though, these continuously curved orientations approach more and more closely (11) orientations, until at 900 K the (11) facets begin to join these continuously curved orientations in second-order phase transi-tions. Finally, at 1000 K, the (11) facet itself "roughens" and disappears entirely.
6.2.3 Shapes of Thin Films: Growth Modes Thus far, in Subsections 6.2.1 and 6.2.2, we have been concerned with single-material systems, e.g., homoepitaxial films of one material on sub-strates of the same material . Then, the surface free energy and, in par-ticular, its orientation dependence, plays the most important role in de-termining the equilibrium morphology. However, for two-material systems, e.g., heteroepitaxial films of one material on substrates of another material, interface and volume free energies also play important roles.26
In this subsection, we discuss how these energies determine the equi-librium morphology, or "growth mode," of the film. We discuss two ap-proaches in turn . The first approach considers the shape of the thickness-dependent total free energy. The second approach considers the contact angles tha t the film islands make with the substrate, as determined by the surface and interface energies.
Free Energ ie s
Consider the thickness-dependent total free energy curves shown in Fig-ure 6.20. Note tha t these are the total free energies of the system relative
2 6E.G. Bauer, "Phänomenologische theorie der kristallabscheidung an Oberflächen. I & II," Z. Kristallogr. 110, 372, 395 (1958), NASA Technical Translations T T F - l l , 888 and 889 (NASA, Washington, D.C., August, 1968).

6.2. Equilibrium Morphology 233
0 10 20 30 40 50
1 1 1
- \ ^ ^^Χ /Ν /Χ / ^Ν /Ν /νχ -ν
^^Χ /Χ /Χ>Λ /^Χ /^^χ^ F-vdM layer by layer growth
1 1 1
1 1
--\ H
V \ / N ^
0 -10 -20 -30 -40 -50
0 -10 -20 -30 -40 -50
S-K layer plus island growth J I L
V-W island growth j i
10 20 Thickness
30 (MLs)
40
Figure 6.20: Thickness dependences of total free energies for the three classical heteroepitaxial growth modes.
to tha t of the bare substrate, and include both volume and surface con-tributions. We assume tha t there is a nonzero driving force for epitaxy, and so in each panel the overall t rend is for the free energy to decrease with increasing thickness of the heteroepitaxial layer. We also assume tha t fully completed layers, with fully laterally coordinated atoms, have slightly lower energies than partially completed layers, and so in each panel the free energies are shown corrugated slightly with a monolayer periodicity.
There are three cases of interest.2 7 In the top panel of Figure 6.20, the sum of the free energies associated with the free surface of the epitaxial film, 7e/v> a n d with the interface between the substrate and the epitaxial film, 7 s / e , is less than or equal to tha t associated with the original substrate surface, 7S/V:
7 e / v + 7 s / e < 7 s / v (6 .46)
Then, the overall free energy decreases faster over the first layer (or two), before settling down to a steady state slope for thicker films. The overall shape of the thickness-dependent free energy is then concave up. Therefore,
2 7M.H. Grabow and G.H. Gilmer, "Thin film growth modes, wetting and cluster nu-cleation," Surf. Sei. 194, 333 (1988).
234 Chapter 6. Surface Morphology
for every integral-monolayer thickness, the system is thermodynamically stable against breakup into inhomogeneous regions, some thicker and some thinner. This leads to what is known as the ideal Frank-van-der-Mer we layer-by-layer growth mode.28
In the bottom panel, the sum of 7e/v and 7s/e is greater than 7S/V-
7e/v + 7 s / e > 7s /v · (6-47)
Then, the overall free energy increases at first as the first layer (or two) is deposited, before turning around and decreasing for thicker films. The overall shape of the thickness-dependent free energy is then concave down. Systems of uniform thickness are therefore thermodynamically unstable against breakup into inhomogeneous regions, some very thick and some completely uncovered. This leads to what is known as the Volmer-Weber island growth mode.29 It is often observed in "dirty" systems in which im-purities lower the free energy of the starting surface, but are buried shortly after heteroepitaxy begins.30
In the middle panel, the sum of 7e/v and 7s/e is, just as in the top panel, less than 7S/V:
7 e / v + 7 s / e > 7 s / v (6.48)
Therefore, the surface free energy decreases faster as the first layer (or two) is deposited. However, because of some constraint that the substrate im-poses on the epilayer, the energy decreases less steeply as subsequent layers are deposited. Only for very thick films, when the epilayer decouples from the substrate, does the energy decrease as steeply as expected for a given driving force for homoepitaxy. The overall shape of the thickness-dependent free energy is therefore initially concave up, but then subsequently concave down. Films thicker than a few layers are therefore unstable to breakup into inhomogeneous regions, some very thick and some having only one (or two) layers. This leads to what is known as the Stranski-Krastanov layer plus island growth mode.31
2 8 F .C. Frank and J.H. van der Merwe, "One-dimensional dislocations. I. Static the-ory," Proc. R. Soc. London A198, 205 (1949); F.C. Frank and J.H. van der Merwe, "One-dimensional dislocations. II. Misfitting monolayers and oriented overgrowth," Proc. R. Soc. London A198, 216 (1949); F.C. Frank and J.H. van der Merwe, "One-dimensional dislocations. III. Influence of the second harmonic term in the potential representation, on the properties of the model," Proc. R. Soc. London A200, 125 (1950); and F.C. Frank and J.H. van der Merwe, "One-dimensional dislocations. IV. Dynamics," Proc. R. Soc. London A201 , 261 (1950).
2 9 M. Volmer and A. Weber, "Keimbildung in übersättigten gebilden," Z. Phys. Chem. 119, 277 (1926).
3 0B.A. Joyce, "The growth and structure of semiconducting thin films," Rep. Prog. Phys. 37, 363 (1974).
311.N. Stranski and L. Krastanow, "Zur theorie der orientierten ausscheidung von
6.2. Equilibrium Morphology 235
/ epi/vac s' ^x . f Epi N.
V a c u u m 7sub/vac / Tsub/epi \ < * > K * Substrate
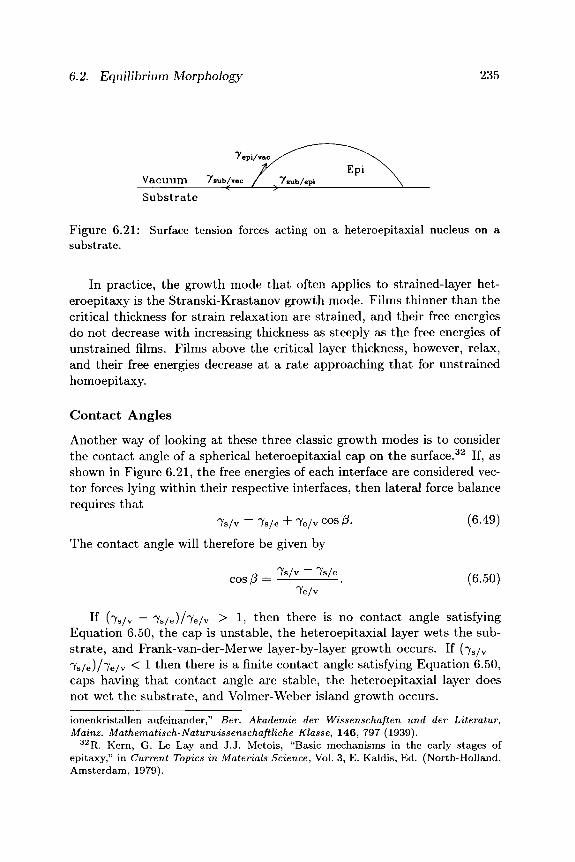
Figure 6.21: Surface tension forces acting on a heteroepitaxial nucleus on a substrate.
In practice, the growth mode tha t often applies to strained-layer het-eroepit axy is the Stranski-Krastanov growth mode. Films thinner than the critical thickness for strain relaxation are strained, and their free energies do not decrease with increasing thickness as steeply as the free energies of unstrained films. Films above the critical layer thickness, however, relax, and their free energies decrease at a rate approaching tha t for unstrained homoepitaxy.
C o n t a c t A n g l e s
Another way of looking at these three classic growth modes is to consider the contact angle of a spherical heteroepitaxial cap on the surface.32 If, as shown in Figure 6.21, the free energies of each interface are considered vec-tor forces lying within their respective interfaces, then lateral force balance requires tha t
7 s / v = 7 s / e + 7 e / v COS ß. ( 6 . 4 9 )
The contact angle will therefore be given by
Ω 7 s / v ~~ 7 s / e (a c r A
cosp = —- —. (6.50) 7e/v
If (7s/v — 7s/e)/7e/v > 1> then there is no contact angle satisfying Equation 6.50, the cap is unstable, the heteroepitaxial layer wets the sub-strate, and Frank-van-der-Merwe layer-by-layer growth occurs. If (7S/V ~~ 7s/e)/7e/v < 1 then there is a finite contact angle satisfying Equation 6.50, caps having tha t contact angle are stable, the heteroepitaxial layer does not wet the substrate, and Volmer-Weber island growth occurs.
ionenkristallen aufeinander," Ber. Akademie der Wissenschaften und der Literatur, Mainz. Mathematisch-Naturwissenschaftliche Klasse, 146, 797 (1939).
3 2R. Kern, G. Le Lay and J.J. Metois, "Basic mechanisms in the early stages of epitaxy," in Current Topics in Materials Science, Vol. 3, E. Kaldis, Ed. (North-Holland, Amsterdam, 1979).

236 Chapter 6. Surface Morphology
If (7s/v — 7s/e)/7e/v depends on thickness, then it is possible for the first few layers to wet the substrate, for subsequent layers to island, and for the growth mode to be Stanski-Krastanov layer-plus-island. For example, for an island on a bare substrate, (7S/V
— 7s/e)/7e/v m aY D e greater than unity, so that a wetting epilayer forms. Then, for an island on a wetting epilayer, \7w/v 7w/e )/7e/v, where 7 w / v is the surface free energy of the wetting layer and 7w/e is the interface free energy between the wetting layer and the epilayer, may be less than unity, so that islands form on the wetting epilayer.
This can come about in strained heteroepitaxy if the strain and dislo-cation energies of the epitaxial film are thought of as an effective interface free energy that is included as part of 7w/e- Then, for very thin (mono-layer) films, 7S/v may be so large that (7S/V — 7s/e)/7e/v ls greater than unity and the first epilayer wets the substrate. For very thick, unstrained films, the free energy of the interface between the first wetting epilayer and subsequent epilayers (7w/e) would normally vanish, and the surface free energies of the wetting epilayer (7W/V) and subsequent epilayers (7e/v) would be equal. Hence (7w/v — 7w/e)/7e/v -* 1> a n d islands would be unsta-ble. For intermediate thickness strained films, however, with a finite 7w/e, (7w/v — 7w/e)/7e/v < 1> a n d islands will be stable.
6.3 Nonequilibrium Morphology In Section 6.2, we discussed equilibrium shapes of crystals and crystal sur-faces in the absence of growth. In this section, we discuss nonequilibrium shapes in the presence of growth. We restrict our attention to homoepitaxy on simple starting surfaces at or near singular orientations, and composed of noninteracting arrays of steps. We do not treat the interesting but exceed-ingly complex cases of epitaxy on starting surfaces well away from singular orientations or of growth on inhomogeneous, "patterned" starting surfaces composed of multiple orientations.33 We also do not treat the important but complex case of heteroepitaxy, in which surface morphology is often tightly coupled to the transition between coherency and semicoherency (see, e.g., Exercise 2 in Chapter 5), and in which Stranski-Krastonov layer-plus-island and Volmer-Weber island growth modes are often observed. Finally, we also neglect effects due to surface reconstructions in covalently bonded
3 3 W.W. Mullins, "Flattening of a nearly plane solid surface due to capillarity," J. Appl. Phys. 30, 77 (1959); W.T. Tsang and A.Y. Cho, "Growth of GaAs-Gai_ x Al x As over preferentially etched channels by molecular beam epitaxy: a technique for two-dimensional thin-film definition," Appl. Phys. Lett. 30, 293 (1977); and E. Kapon, M.C. Tamargo, and D.M. Hwang, "Molecular beam epitaxy of GaAs/AlGaAs superlattice heterostructures on nonplanar substrates," Appl. Phys. Lett. 50, 347 (1987).

6.3. Nonequilibrium Morphology 237
semiconductors,3 4 or due to the interplay between morphology and compo-sition tha t can occur on the surfaces of binary alloys.35
In modeling nonequilibrium surface morphology, it is useful to distin-guish between two approaches. In the first approach, surface morphology is modeled directly. At one extreme, molecular dynamics simulations track the exact positions {r"i,r"2,...} of all a toms as they move in response to forces between them.3 6 At the other extreme, continuum models track the height h of a coarse-grained surface position (x,y). The time evolution of /i(x, y) is determined by various driving (e.g., growth with stochastic noise) and relaxation (e.g., diffusional) terms.3 7 In between these two extremes, Monte Carlo simulations track the column heights n of discrete surface lattice sites (i, j). The time evolution of the n(i,j) is determined by the probabilities of surmounting assumed energy barriers separating various configurations.38
In the second approach, surface morphology is not modeled directly. Instead, the surface is decomposed into defects of various kinds, such as steps, 2D islands, and adatoms. The t ime evolution of surface morphology is then determined by the dynamics of the motion and interactions of these defects.
In this section, we will take the second approach. Its disadvantage is
34See, e.g., S.A. Barnett and A. Rockett, "Monte Carlo simulations of Si(OOl) growth and reconstruction during molecular beam epitaxy," Surf. Sei. 198, 133 (1988); and H.-J. Gossman and L.C. Feldman, "Initial stages of silicon molecular-beam epitaxy: effects of surface reconstruction," Phys. Rev. B32 , 6 (1985).
3 5A. Madhukar and S.V. Ghaisas, "The nature of molecular beam epitaxial growth examined via computer simulations," CRC Critical Reviews in Solid State and Materials Sciences 14, 1 (1988).
3 6 M. Schneider, A. Rahman, and I.K. Schuller, "Role of relaxation in epitaxial growth: a molecular-dynamics study," Phys. Rev. Lett. 55, 604 (1985); E.T. Gawlinski and J.D. Gunton, "Molecular-dynamics simulation of molecular-beam epitaxial growth of the sil-icon (100) surface," Phys. Rev. B36, 4774 (1987); S. Das Sarma, S.M. Paik, K.E. Khor, and A. Kobayashi, "Atomistic numerical simulation of epitaxial crystal growth," J. Vac. Sei. Technol. B 5 , 1179 (1987); and D. Srivastava and B.J. Garrison, "Growth mech-anisms of Si and Ge epitaxial films on the dimer reconstructed Si (100) surface via molecular dynamics," J. Vac. Sei. Technol. A 8 , 3506 (1990).
3 7 M. Kardar, G. Parisi, and Y-C Zhang, "Dynamic scaling of growing interfaces," Phys. Rev. Lett. 56, 889 (1986); D.E. Wolf, "Kinetic roughening of vicinal surfaces," Phys. Rev. Lett. 67, 1783 (1991); Z.-W. Lai and S. Das Sarma, "Kinetic growth with sur-face relaxation: continuum versus atomistic models," Phys. Rev. Lett. 66, 2348 (1991).
3 8 F .F . Abraham and G.H. White, "Computer simulation of vapor deposition on two-dimensional lattices," J. Appl. Phys. 4 1 , 1841 (1970); G.H. Gilmer and P. Bennema, "Simulation of crystal growth with surface diffusion," J. Appl. Phys. 43 , 1347 (1972); S. Clarke and D.D. Vvedensky, "Origin of reflection high-energy electron-diffraction inten-sity oscillations during molecular-beam epitaxy: a computational modeling approach," Phys. Rev. Lett. 58, 2235 (1987); and P.A. Maksym, "Fast Monte Carlo simulation of MBE growth," Semicond. Sei. Technol. 3, 594 (1988).

238 Chapter 6. Surface Morphology
that it requires a priori knowledge of the important defect types and the ways in which they interact, knowledge that is currently far from com-plete. Its advantage, though, is that it simplifies and brings deeper phys-ical understanding to a rich statistical behavior. The evolution of surface morphology is complex and highly nonlinear, often even oscillatory upon initiation of growth. Indeed, such oscillations, illustrated in Figure 3.14 have been observed by reflection high-energy electron diffraction (RHEED) and other in situ measurements in a variety of materials, including III-V,39
IV-IV,40 II-VI41 and I-VII42 compounds, as well as metals43 and high-Tc superconductors.44 Similar oscillations have also been observed during
3 9 J . J . Harris, B.A. Joyce, and P.J. Dobson, "Oscillations in the surface structure of Sn-doped GaAs during growth by MBE," Surf. Sei. 103, L90 (1981); C.E.C. Wood, "RED intensity oscillations during MBE of GaAs," Surf. Sei. 108, L441 (1981); J.N. Eckstein, C. Webb, S.-L. Weng, and K.A. Bertness, "Photoemission oscillations during epitaxial growth," Appl. Phys. Lett. 51, 1833 (1987); L.P. Erickson, M.D. Longerbone, R.C. Youngman, and B.E. Dies, "The observation of oscillations in secondary electron emission during the growth of GaAs by MBE," J. Crystal Growth 81, 55 (1987); J.P. Harbison, D.E. Aspnes, A.A. Studna, L.T. Florez, and M.K. Kelly, "Oscillations in the optical response of (001) GaAs and AlGaAs surfaces during crystal growth by molecular beam epitaxy," Appl. Phys. Lett. 52, 2046 (1988); and J.Y. Tsao, T.M. Brennan, and B.E. Hammons, "Oscillatory AS4 surface reaction rates during molecular beam epitaxy of AlAs, GaAs and InAs," J. Crystal Growth 111, 125 (1991).
4 0 T . Sakamoto, N.J. Kawai, T. Nakagawa, K. Ohta, and T. Kojima, "Intensity oscilla-tions of reflection high-energy electron diffraction during silicon molecular beam epitaxial growth," Appl. Phys. Lett. 47, 617 (1985).
4 1 L . A. Kolodziejski, R.L. Gunshor, N. Otsuka, B.P. Gu, Y. Hefetz, and A.V. Nurmikko, "Use of RHEED oscillations for the growth of 2D magnetic semiconductor superlattices (MnSe/ZnSe)," J. Cryst. Growth 81, 491 (1987).
4 2 H. Dabringhaus and H.J. Meyer, "Untersuchung der kondensation und Verdampfung von alkalihalogenid-kristallen mit molekularst rahlmethoden. II. Relaxationseffekte auf der (lOO)-oberfläche von KC1," J. Cryst. Growth 16, 31 (1972); and H.J. Meyer and H. Dabringhaus, "Molecular processes of condensation and evaporation of alkali halides," in Current Topics in Materials Science Vol. 1, E. Kaldis, Ed. (North-Holland, Amsterdam, 1978), Chap. 2.
4 3 Y. Namba, R.W. Vook, and S.S. Chao, "Thickness periodicity in the Auger line shape from epitaxial (111) Cu films," Surf. Sei. 109, 320 (1981); T. Kaneko, M. Imafuku, C. Kokubu, R. Yamamoto, and M. Doyama, "The first observation of RHEED intensity oscillation during the growth of Cu/Mo multi-layered films," J. Phys. Soc. Jpn. 55, 2903 (1986); S.T. Purcell, B. Heinrich, and A.S. Arrott, "Intensity oscillations for electron beams reflected during epitaxial growth of metals," Phys. Rev. B35 , 6458 (1987); C. Koziol, G. Lilienkamp, and E. Bauer, "Intensity oscillations in reflection high-energy electron diffraction during molecular beam epitaxy of Ni on W (110)," Appl. Phys. Lett. 51, 901 (1987); and D.A. Steigerwald and W.F. Egelhoff, Jr., "Observation of intensity oscillations in RHEED during the epitaxial growth of Cu and fee Fe on Cu (100)," Surf. Sei. 192, L887 (1987).
4 4 T . Terashima, Y. Bando, K. Iijima, K. Yamamoto, K. Hirata, K. Hayashi, K. Kami-gaki, and H. Terauchi, "Reflection high-energy electron diffraction oscillations during epitaxial growth of high-temperature superconducting oxides," Phys. Rev. Lett. 65 , 2684 (1990).

6.3. Nonequilibrium Morphology 239
Peclet number L2j/D < 1 L2j/D » 1 L2j/D > 1 L2j/D » 1
Growth Regime "Diffusional" Step Flow "Convective" Step Flow 2D Nucleation and Growth Statistical Growth
Table 6.1: Magnitudes of Peclet numbers and the corresponding type of growth.
other kinds of crystal growth, such as electrocrystallization45 and gas source or chemical beam epitaxy.4 6
To organize our t reatment , we consider in the following Subsections the four regimes of behavior on vicinal (stepped) surfaces indicated in Table 6.1. These regimes are distinguished by the ratio between the velocity at which the steps move as they consume adatoms and the velocity at which adatoms diffuse to the steps. If j is the deposition rate in monolayers per second, and if L is the average spacing between the steps, then the velocity at which the steps move is roughly fstep = jL. If D is the adatom diffusivity, then the velocity of adatom diffusion to the steps is roughly t> adat ~ D/L. The ratio between the velocities is therefore L2j/D. This ratio is a kind of Peclet number, in tha t it is a dimensionless measure of the relative impor-tance of convective over diffusional mass flow. Low Peclet numbers imply high temperatures and a dominance of diffusional mass flow; high Peclet numbers imply low temperatures and a dominance of convective mass flow. Another way of understanding the Peclet number is to note tha t it is also the ratio between the diffusion t ime across the terraces, L2/D, and the adatom arrival time, TML = 1/j· Low ratios imply either low growth rates or high adatom diffusivities; high ratios imply either high growth rates or low adatom diffusivities.
6.3.1 Fast Adatoms and "Diffusive" Step Flow In this subsection, we discuss how surface morphology evolves if Peclet numbers are much less than unity, so tha t adatom diffusion to nearby steps is fast relative both to step flow and to the rate at which adatoms arrive from the vapor. Then, ada tom coverages will be low, adatom-adatom inter-actions can be neglected, and growth will proceed exclusively by the flow
4 5 V. Bostanov, R. Roussinova, and E. Budevski, "Multinuclear growth of dislocation-free planes in electrocrystallization," J. Electrochem. Soc. 119, 1346 (1972).
4 6 W.T . Tsang, T.H. Chiu, J.E. Cunningham, and A. Robertson, "Observations on intensity oscillations in reflection high-energy electron diffraction during chemical beam epitaxy," Appl. Phys. Lett. 50, 1376 (1987).

240 Chapter 6. Surface Morphology
—I ί ϊ , Ln+1 V i
Figure 6.22: An array of steps at horizontal positions {xn} separated by terraces of widths {Ln}.
of steps across the surface. In other words, adatoms are fast, and it is their diffusion tha t mediates step flow.
To understand how the morphology of a surface evolves in this step flow regime, consider the array of steps illustrated in Figure 6.22. Suppose adatoms on terrace n have probability p + of at taching at the "up" step n on the left, and probability p~ — 1 — p+ of at taching at the "down" step n + l o n the right. If Ln is the width of terrace n in monolayers, then jLn
adatoms land on tha t terrace each second, of which p + a t tach at step n and p~ a t tach at step n + 1. Terrace n makes an "up" contribution to the velocity of step n of jLnp+ and a "down" contribution to the velocity of step n + 1 of jLnp~. Alternatively, the velocity of step n can be viewed as containing an "up" contribution from terrace n of j L n p + , and a "down" contribution from step n — 1 of jLn-\p~. In other words,
Xn — Vn \p++p ) \P++P ) Since the width of the n t h terrace is Ln = xn+χ — x n , we can also write
Xn = jfan+l ~ Xn) ( ^ T ~ Γ ) + J(Xn ~ # n - l ) ( ~ j — ~ ) > ( 6 ·5 2 )
which is a set of difference equations for the t ime evolution of the positions of the steps in the array.
If the incorporation probabilities are rewritten as
+ ( P + + P " ) , ( p + -p~) p = h 2 2
( p + + p ~ ) (p+-p~) (6.53) 2 2
then Equation 6.52 can be recast, after some algebra, into the form
./ΐη+1-Χη_Λ . /p+ ~P~\ (Xn+l - Xn Xn-Xn-l\ X n = J { 2 )+Λ^Τ^){—2 2— )■
(6.54)
6.3. Nonequilibrium Morphology 241
The first term on the right-hand side of Equation 6.54 is a simple differ-ence between step positions, while the second term is a difference between differences. Hence, the continuum equivalent of Equation 6.54 is
UX I Ό — Ό \ d X iM=jaa+j{^TF)^ ( 6 · 5 5 )
which is a single differential equation for the evolution of the step positions. An identical equation may be derived for the evolution of the terrace widths by inserting Equation 6.51 into Ln = xn+i — xn:
*-«>-J£ ♦>(££)£. <"·> The first derivative terms in both of these equations give rise to wave
behavior such that, for a fixed horizontal coordinate x, the step index n decreases as time increases. In particular, as steps move to the right during growth, the indices of the steps seen by a stationary observer decrease as dn/dt = —j.
The second derivative terms in both of these equations are dispersion terms that tend to either damp or amplify fluctuations. Suppose, e.g., a surface at time t = 0 is composed of terraces having average widths of Lavg, but with an additional small sinusoidal variation of amplitude AL over step index changes of n\, i.e., L(n) = Lavg + ALs'm(n/n\). Then, its time evolution can be shown (see Exercise 8) to be given by
L{n,t) = Lavg + ΔΖ,δίη2π ( VL±J1 ) e~t/TD, (6.57)
where the rate at which the sinusoidal variation decays is47
— =j(—) ( P + - P " ) · (6·58) TD \nxj v J
The decay rate depends inversely on the square of the wavelength of the perturbation. As a consequence, growth will tend to smoothen short-wavelength perturbations sooner than long-wavelength ones, and very long-wavelength perturbations will tend to smoothen exceedingly slowly.48
4 7R.L. Schwoebel, "Step motion on crystal surfaces. II," J. Appl. Phys. 40, 614 (1969); and T. Fukui, H. Saito, and Y. Tokura, "Superlattice structure observation for (AlAs)1/2(GaAs)1/2 grown on (001) vicinal GaAs substrates," Japan. J. Appl. Phys. 27, L1320 (1988).
4 8H.-J. Gossman, F.W. Sinden, and L.C. Feldman, "Evolution of terrace size distribu-tions during thin-film growth by step-mediated epitaxy," J. Appl. Phys. 67, 745 (1990).

242 Chapter 6. Surface Morphology
Note tha t it is the anisotropy between the up and down step incorpo-ration probabilities tha t determines whether the per turbat ion will grow or shrink. If p + > p~, then the per turbat ion decays; if p+ < p~, then the perturbat ion grows. This can be understood by inspection of Figure 6.22. If Ln is at some instant wider than its neighbors, then if adatoms on tha t terrace preferentially at tach at the "up" step, Ln will decrease and the per-turbat ion will decay, while if they preferentially a t tach at the "down" step, Ln will increase and the per turbat ion will grow.
Note tha t although Equation 6.56 describes a wave moving backward in step index with increasing time, the horizontal position x « Layg(n + jt) of a given step index itself moves forward with t ime as steps flow to the right. Hence, Equation 6.57 can be rewritten approximately as
L(x, t) = L a v g + AL sin 2π f ——— ] e~t,TD. (6.59) \Lavgn\J
In real space, terrace width perturbat ions propagate nearly vertically, even though the steps themselves propagate horizontally to the right. This be-havior is illustrated in Figure 6.23, which shows the evolution of an array of steps having an initial Gaussian per turbat ion centered at xn = 80.
Finally, we note tha t , in deriving Equat ion 6.56, adatoms were assumed to at tach only at adjacent steps. If, instead, adatoms cross adjacent steps and ultimately a t tach at more distant steps, then higher order derivatives appear in Equations 6.55 and 6.56 tha t can cause perturbat ions to propa-gate to the right.4 9
6.3.2 Slow Adatoms and "Convective" Step Flow In Subsection 6.3.1, we discussed how surface morphology evolves if Peclet numbers are much less than unity, so tha t adatom diffusion to nearby steps is fast. In this subsection, we discuss how surface morphology evolves if Peclet numbers are on the order of unity, so tha t ada tom diffusion to nearby steps is comparable to the step flow velocity. Then, as we shall see, adatom annihilation occurs not only by adatom diffusion to steps, but by step flow over adatoms. As a consequence, there can arise an oscillatory interplay be-tween accumulation of adatoms between the steps, and sweeping of adatoms by step flow.
To quantify this, consider the equi-spaced array of steps illustrated in Figure 6.24, with a space and time-dependent adatom coverage 6(x,t). On the terrace bounded by steps at XL a n d XR, the coverage increases with time
49S.A. Chalmers, J.Y. Tsao, and A.C. Gossard, "Lateral motion of terrace width distributions during step-flow growth," Appl. Phys. Lett. 6 1 , 645 (1992).

6.3. Nonequilibrium Morphology 243
30 J
a ^ 2 0 -»-> + 10 J
0
1 1
_
1 1
1 1
η
• . . : ; : : : : : : : J
1 11
Figure 6.23: Snapshots in time of the terrace widths, Ln(t), heights, hn(t) and lateral positions, xn( t ) , of an array of steps after successive monolayers have been deposited. The terraces are on average five lattice parameters wide, but with an initial Gaussian bunching centered at xn « 80. Bottom: The heights hn of the steps are constant, but their lateral positions xn increase with time as the steps flow to the right. Top: Even though the steps flow to the right, the perturbation in the terrace widths propagates vertically up. For clarity, the terrace widths Ln
are shown offset by successive monolayers t/rMh-
due to deposition at a rate j , and the spatial distribution of the coverage broadens in t ime due to diffusion at a ra te Dd26/dx2. If evaporation back into the vapor is negligible, then the coverage evolves according to 5 0
0{x,t)=j + D 82θ Ar5" (6.60)
At the left step edge, the rate at which adatoms at tach will be pro-portional to the adatom coverage, k^t6{x^,t)^ where k£tt is a kinetic rate constant for successful adatom at tachment at. an up step. If adatoms can also detach from steps, then there will be a competing rate, fc~Jet, w n e r e
^det ls a kinetic rate constant for successful adatom detachment from an up step.
The difference between these two rates must be exactly balanced by the diffusive flow of adatoms into the step, D[d6/dx]XL. Hence, we have at the left step
Γ ββ"
kttte(xL,t)-k+it=Di dx
(6.61)
5 0W.K. Burton, N. Cabrera, and F.C. Frank, "The growth of crystals and the equilib-rium structure of their surfaces," Philos. Trans. R. Soc. London Ser. A243 , 299 (1951).

244 Chapter 6. Surface Morphology
Figure 6.24: Steady-state adatom coverages on an equi-spaced array of "fast" steps.
Using similar reasoning, we also have at the right step
'θθ] ^tAxR,t)-k-et = -D
dx (6.62)
where k~tt and k^et are kinetic rate constants for successful ada tom attach-ment and detachment from the down step. These two boundary conditions determine, along with Equation 6.60, the t ime evolution of the adatom coverage.51
Note, however, tha t these boundary conditions are complicated by the fact tha t , as adatoms at tach at the steps, the steps themselves move, so tha t the positions in space at which the boundary conditions must be applied also move. Since the velocities at which the steps move is determined by the sum of the a t tachment rates of adatoms coming from the left and the right of each step, we have
«(*) = [*£t*(*L, t) - k+j + [k:ite(xR, t) - fcd-j
= D \3θλ dx
XL· - D
ΪΘΘ1 dx
(6.63)
To remove this complication, it is convenient to transform into a coor-dinate system, x' = x + J vdt, tha t itself moves with the steps. Then, the boundary conditions given by Equations 6.61 and 6.62 may be applied at fixed xf
L and x'R, but the differential Equation 6.60 becomes
(6.64)
The equation now contains both a "diffusive" term, Dd26/dx'2, as well as a "convective" term, υθθ/θχ', due to the motion of the s tep.5 2
5 1R. Ghez and S.S. Iyer, "The kinetics of fast steps on crystal surfaces and its appli-cation to the molecular beam epitaxy of silicon," IBM J. Res. Develop. 32, 804 (1988).
5 2 K. Voigtlander, H. Risken, and E. Kasper, "Modified growth theory for high su-persaturation," Appl. Phys. A39 , 31 (1986); and V. Fuenzalida and I. Eisele, "High supersaturation layer-by-layer growth: application to Si MBE," J. Crystal Growth 74, 597 (1986).
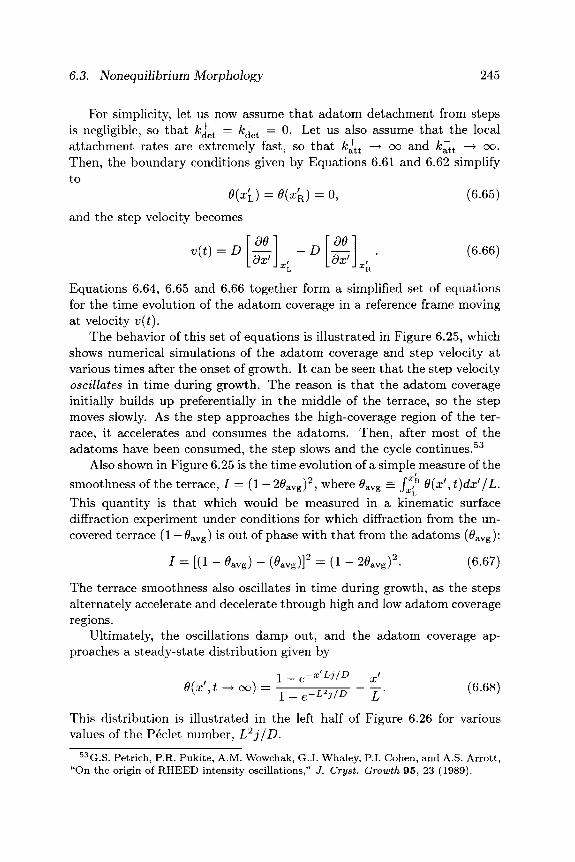
6.3. Nonequilibrium Morphology 245
For simplicity, let us now assume tha t adatom detachment from steps is negligible, so tha t fc~j~t = k^et = 0. Let us also assume tha t the local at tachment rates are extremely fast, so tha t k^tt —> oo and k~tt —► oo. Then, the boundary conditions given by Equations 6.61 and 6.62 simplify to
e(x'L) = θ{χ'κ) = 0, (6.65)
and the step velocity becomes
<*) = AlZi\ ~D\^\ ■ (6·66) 'θθ' βχ'
-D 'θθ' βχ'
Equations 6.64, 6.65 and 6.66 together form a simplified set of equations for the t ime evolution of the adatom coverage in a reference frame moving at velocity v(t).
The behavior of this set of equations is illustrated in Figure 6.25, which shows numerical simulations of the adatom coverage and step velocity at various times after the onset of growth. It can be seen tha t the step velocity oscillates in time during growth. The reason is tha t the adatom coverage initially builds up preferentially in the middle of the terrace, so the step moves slowly. As the step approaches the high-coverage region of the ter-race, it accelerates and consumes the adatoms. Then, after most of the adatoms have been consumed, the step slows and the cycle continues.5 3
Also shown in Figure 6.25 is the t ime evolution of a simple measure of the smoothness of the terrace, / = (1 — 20 a v g ) 2 , where 0a v g = f*,K θ(χ'', t)dx'/L. This quanti ty is tha t which would be measured in a kinematic surface diffraction experiment under conditions for which diffraction from the un-covered terrace (1 — 0avg) is out of phase with tha t from the adatoms (#a v g ) :
/ = [ ( ! - 0avg) - (0avg)]2 = (1 - 20 a v g ) 2 . (6.67)
The terrace smoothness also oscillates in t ime during growth, as the steps alternately accelerate and decelerate through high and low adatom coverage regions.
Ultimately, the oscillations damp out, and the adatom coverage ap-proaches a steady-state distribution given by
1 — e~x' LJ/D χι 0(x',t - oo) = l_e_L,j,D - j . (6.68)
This distribution is illustrated in the left half of Figure 6.26 for various values of the Peclet number, L2j/D.
5 3G.S. Petrich, P.R. Pukite, A.M. Wowchak, G.J. Whaley, P.I. Cohen, and A.S. Arrott, "On the origin of RHEED intensity oscillations," J. Cryst. Growth 95, 23 (1989).
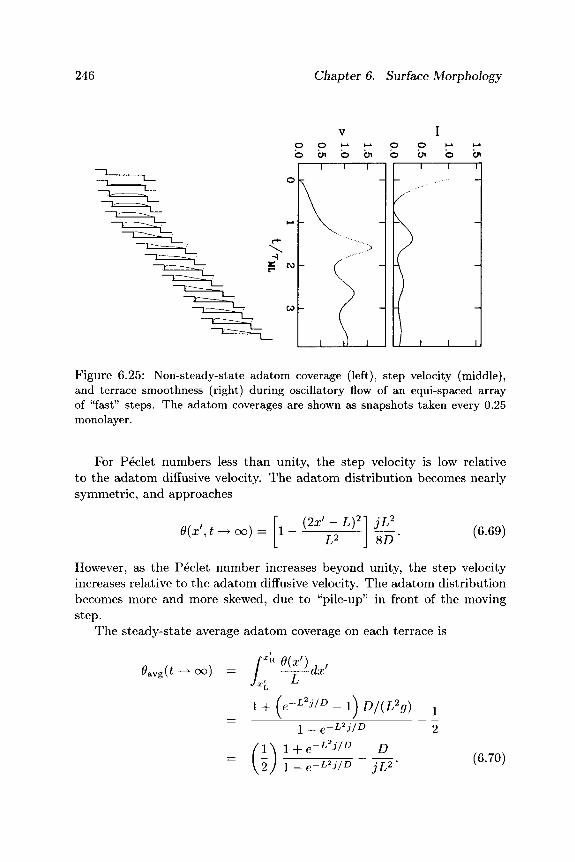
246 Chapter 6. Surface Morphology
o o ^ ·-* b a* ό Ü>
o
»-»
Γ0
CO
1
- \
(
1
1 1
" ' ■ >
f' J
\ \
Figure 6.25: Non-steady-state adatom coverage (left), step velocity (middle), and terrace smoothness (right) during oscillatory flow of an equi-spaced array of "fast" steps. The adatom coverages are shown as snapshots taken every 0.25 monolayer.
For Peclet numbers less than unity, the step velocity is low relative to the adatom diffusive velocity. The adatom distribution becomes nearly symmetric, and approaches
0 ( z ' , f - * oo) = 1 -(2x' - L) ΊΧ
2 1
SD' (6.69)
However, as the Peclet number increases beyond unity, the step velocity increases relative to the adatom diffusive velocity. The adatom distribution becomes more and more skewed, due to "pile-up" in front of the moving step.
The steady-state average adatom coverage on each terrace is
"avg(^ CO) J x'
θ(χ') άχ'
l+(e-L2^D-l)D/(L29) x
1 _ e-L2)lD 2 1 \ 1 + e-L^'D D 2) i-e-L^j/D jL2- (6.70)

6.3. Nonequilibrium Morphology 247
0.0 0.2 0.4 0.6 0.8 1.0 X ' / L
15 20
Figure 6.26: Left: Steady-state adatom coverages on an array of "fast" steps for various values of L 2 j / D , the Peclet number. Right: Dependence of steady-state average terrace smoothness on the Peclet number.
The steady-state kinematic surface diffraction intensity corresponding to this average coverage is shown in the right half of Figure 6.26 as a function of the Peclet number. As can be seen, it decreases quickly as the step velocity increases relative to the adatom diffusivity, and hence as the average adatom coverage builds up on each terrace.5 4
6.3.3 2D Cluster Nucleation, Growth and Coalescence
In Subsection 6.3.2, we discussed how surface morphology evolves if Peclet numbers are on the order of unity, so tha t adatom diffusion to nearby steps is comparable to the step flow velocity. In this subsection, we discuss how surface morphology evolves if Peclet numbers are greater than unity, so tha t adatom diffusion to nearby steps is slow relative both to step flow and to the rate at which adatoms arrive from the vapor. Then, adatoms accumulate and interact on the terraces between the steps, and ultimately form 2D clusters.
If the clusters are transient, in tha t they break apart faster than they grow, then their main consequence will be to impede adatom diffusion. Adatoms diffusing toward steps will occasionally meet and merge with a
5 4 J .H. Neave, P.J. Dobson, B.A. Joyce, and J. Zhang, "Reflection high-energy electron diffraction oscillations from vicinal surface - a new approach to surface diffusion measure-ments," Appl. Phys. Lett. 47, 100 (1985); and T. Nishinaga and K-I Cho, "Theoretical study of mode transition between 2d-nucleation and step flow in MBE growth of GaAs," Japan. J. Appl. Phys. 27, L12 (1988).

248 Chapter 6. Surface Morphology
cluster or another adatom. Assuming the cluster itself is relatively im-mobile, the adatom will be unable to continue its journey until it breaks free from the cluster. Then, the effective adatom diffusivity decreases with increasing adatom coverage,55 so tha t step flow becomes less and less "dif-fusive" and more and more "convective."
If the clusters are permanent , in tha t they form stable growing nuclei, then the kinetics of growth are altered drastically. In a sense, the clusters take on a life of their own. Their boundaries represent "extrinsic" steps tha t compete for adatoms with the intrinsic steps always present on a vicinal surface. As a consequence, the clusters grow and ultimately coalesce, often in a complex, oscillatory way.
To understand why, consider epitaxy on a singular surface, or on a vicinal surface whose terraces are very wide compared to the spacing of the clusters. Enumerate the layers by n = 0 , 1 , 2 , . . . , where n = 0 is the initially completely occupied substrate surface layer, n = 1 is the first, initially completely unoccupied epilayer, and so on. Associate with each of these layers three coverages: a n , the total coverage of mobile adatoms created by impingement from the vapor; ηη, the total coverage of nuclei centers created by interaction between mobile adatoms; and θη, the total coverage of immobile atoms permanently incorporated into clusters. These coverages are represented in Figure 6.27 by the open circles, filled squares, and open squares, respectively.
M o b i l e A d a t o m s
For simplicity, assume tha t mobile adatoms are created exclusively by im-pingement from the vapor (rather than by detachment from clusters). Then, the rate at which the mobile adatom coverage in layer n increases is equal to the flux times the exposed coverage of layer n — 1, or (0 n _ i — 0n) / rML ·
Once mobile adatoms in layer n are created, they may diffuse to and at tach at the edges of both layer n — 1 and layer n clusters. The rates at which they do so will be proportional to the product of the mobile adatom coverage (α η ) , the coverage of layer n — 1 and layer n nuclei centers (ηη-ι and 77n), and the capture numbers, or efficiencies, associated with those nuclei. These capture numbers are essentially the geometric cross sections tha t the clusters present to diffusing adatoms, and have been the subject of considerable study.5 6 Here, we take them to be constant. The rate at which
5 5A.K. Myers-Beaghton and D.D. Vvedensky, "Nonlinear equation for diffusion and adatom interactions during epitaxial growth on vicinal surfaces," Phys. Rev. B42 , 5544 (1990).
5 6 G. Zinsmeister, "Theory of thin film condensation. Part D: Influence of a variable collision factor," Thin Solid Films 7, 51 (1971); J.A. Venables, "Rate equation ap-

6.3. Nonequilibrium Morphology 249
o o 1 1 A
r - r - i _ r n ^ n r > ^ n . r - ^ o ^ r ■ ^ — ι ^ο r
Figure 6.27: Adatom arrival, diffusion and attachment at step edges, accom-panied by cluster nucleation, growth, and coalescence. The open circles on the surface represent mobile adatoms; the filled squares represent nuclei centers; and the open squares represent immobile atoms permanently incorporated into clus-ters.
adatoms in level n are captured by clusters in level n — 1 is then fc~ttanr/n_i, where k~tt is the kinetic rate constant for a t tachment at "down" steps; and the rate at which they are captured by clusters in level n is 1ϊ£ηαηηη, where k£tt is the kinetic rate constant for a t tachment at "up" steps.
At the same time, mobile adatoms in layer n may also hop over steps into layers n — 1 and n + 1, while mobile adatoms in layers n — 1 and n + 1 may hop over steps into layer n. Here, we assume these adatom exchange rates to be proportional to the mobile adatom coverage in the layer the adatoms are jumping from and the exposed coverage of the layer the adatoms are jumping to. Hence, the exchange rate out of layer n is ktxchan(Qn ~ 0 n + i ) + k~xchan(6n-2 - 0 n _ i ) , and the exchange rate into layer n is / c^ c h a n _ i ( (9 n _ i - 0n) + A:^x c han + i (0n_i - 0 n ) , where k+xch and k~xch are the rates of hopping over "up" and "down" steps, respectively.
Altogether, the coverage of mobile adatoms evolves in t ime approxi-mately as
"n — l ~ "n (i — i i + \ <*n = OLn (fcattT7n-i + ^Jtt^nj
TML ~ * W h a n ( 0 n - 0 n + i ) - k~xchan(0n-2 ~ # n - i ) + ktxchan-l{en-\ ~ 0n) + /Q c h O! n +i (0 n _ i - 0 n ) . (6.71)
It increases due to deposition and to exchange from adjacent layers, but decreases due to incorporation into growing clusters and to exchange into adjacent layers.
proaches to thin film nucleation kinetics," Phil. Mag. 27, 697 (1973); B. Lewis and G.J. Rees, "Adatom migration, capture and decay among competing nuclei on a substrate," Phil. Mag. 29, 1253 (1974); and R. Kariotis and M.G. Lagally, "Rate equation modeling of epitaxial growth," Surf. Sei. 216, 557 (1989).

250 Chapter 6. Surface Morphology
I m m o b i l e A d a t o m s
As mobile adatoms at tach at steps, the coverage of immobile atoms per-manently incorporated into clusters must increase correspondingly. Since, as illustrated in Figure 6.27, the coverage of immobile atoms in layer n depends on the a t tachment of mobile adatoms in layers n and n + 1, we can write
On = ktttanln + ^ « η + Ι ^ η · (6.72)
As in Equation 6.71, k*tt and k~tt are kinetic ra te constants for at tachment of mobile adatoms at up and down steps, respectively.
Note tha t in this simple t reatment we neglected possible anisotropies in the shapes of the clusters. Such anisotropies can arise from anisotropic at tachment or diffusion rates, and have been observed during growth of semiconductors having strong and anisotropic surface reconstructions.5 7
N u c l e i C e n t e r s
Finally, the coverage of nuclei centers itself increases, as mobile adatoms collide to form 2D clusters, and then decreases as the clusters grow, impinge on each other, and ultimately coalesce. In general, nucleation is a complex process by which a distribution of clusters of various sizes evolves in t ime in response to kinetic adatom at tachment and detachment rates and to highly nonlinear size and shape dependencies to cluster energetics.58 Nucleation may also be "heterogeneous," in the sense of being catalyzed by defects on the surface.59 In this simple t reatment , we assume tha t two adatoms are sufficient to form a stable cluster, and tha t the nucleation rate is propor-tional to the collision rate between adatoms, fcnuc<*n·
Coalescence of clusters is also a complex process tha t depends on the distribution of clusters in both size and space. At one extreme, if the nuclei centers are distributed randomly in space, then their initial coalescence rate can be shown to be proportional to both the coverage of cluster centers
5 7 R.J . Hamers, "Nucleation and growth of epitaxial layers on Si(001) and S i ( l l l ) sur-faces by scanning tunneling microscopy," Ultramicroscopy 3 1 , 10 (1989); J.Y. Tsao, E. Chason, U. Koehler, and R. Harness, "Dimer strings, anistropic growth, and persistent layer-by-layer epitaxy," Phys. Rev. B40 , 11951 (1989); and Y.-W. Mo, B.S. Swartzen-truber, R. Kariotis, M.B. Webb, and M.G. Lagally, "Growth and equilibrium structures in the epitaxy of Si on Si (001)," Phys. Rev. Lett. 63 , 2393 (1989).
58See, e.g., D. Walton, "Nucleation of vapor deposits," J. Chem. Phys. 37, 2182 (1962); K.F. Kelton, A.L. Greer, and C.V. Thompson, "Transient nucleation in condensed sys-tems," J. Chem. Phys. 79, 6261 (1983).
5 9 Anti-phase boundaries between equivalent reconstruction domains on the surface are an example. See, e.g., R.J. Hamers, "Nucleation and growth of epitaxial silicon on Si(001) and S i ( l l l ) surfaces studied by scanning tunneling microscopy," Ultramicroscopy 3 1 , 10 (1989).

6.3. Nonequilibrium Morphology 251
and the rate of change of the coverage of immobile adatoms incorporated into the clusters, or 2ηηθη.60 At the other extreme, if their centers are distributed equally in space, then the initial coalescence rate will be zero, increasing sharply when the clusters just begin to impinge on each other.6 1
Here, we assume a coalescence rate between these two extremes: τ)ηθη/{1 — θη). This form of the coalescence rate guarantees tha t the coverage of nuclei centers decreases smoothly to zero as the coverage of immobile adatoms incorporated into the clusters approaches unity, or tha t ηη —> 0 as θη —> 1.
Altogether, the coverage of nuclei centers evolves in time approximately as
Vn = Lc«n ~ ( 1 \ J On- (6.73)
Note tha t in deriving Equation 6.73, we have neglected, for simplicity, elimination of nuclei centers in the absence of growth. More comprehensive t reatments must allow for such effects, which are due to surface tension. Small clusters, because of their large perimeter length to cluster area ratio, are thermodynamically less stable than, and will ultimately "ripen" into, increasingly larger clusters.62
N u m e r i c a l So lu t ions
Equations 6.71, 6.72 and 6.73 form a set of coupled rate equations, three for each layer, describing the evolution of the coverages of mobile adatoms, immobile adatoms, and nuclei centers. They may be solved analytically in some simple limiting cases,63 but in general require numerical integra-
6 0 R. Vincent, "A theoretical analysis and computer simulation of the growth of epi-taxial films," Proc. Roy. Soc. Lond. A321 , 53 (1971); and M.J. Stowell, "Thin film nucleation kinetics," Phil Mag. 26, 361 (1972).
6 1 J.A. Venables, "Rate equation approaches to thin film nucleation kinetics," Phil. Mag. 27, 697 (1973).
62See, e.g., I.M. Lifschitz and V.V. Slyozov, "The kinetics of precipitation from super-saturated solid solutions," J. Phys. Chem. Solids 19, 35 (1961); C. Wagner, "Theorie der alterung von niederschlagen durch umlösen," Z. Electrochem. 65, 581 (1961); P.W. Voorhees and M.E. Glicksman, "Solution to the multi-particle diffusion problem with applications to Ostwald ripening - I. Theory," Ada Met. 32, 2001 (1984); C.V. Thomp-son, "Coarsening of particles on a planar substrate: interface energy anisotropy and application to grain growth in thin films," Acta Met. 36, 2929 (1988); and H.A. At-water and C M . Yang, "Island growth and coarsening in thin films - conservative and nonconservative systems," J. Appl. Phys. 67, 6202 (1990).
63See, e.g., A.N. Kolmogoroff, Bull. Acad. Sei. URSS (Cl. Sei. Math. Nat.) 3, 355 (1937); M. Avrami, "Kinetics of phase change I. General theory," J. Chem. Phys. 7, 1103 (1939); M. Avrami, "Kinetics of phase change II. Transformation-time relations for random distribution of nuclei," J. Chem. Phys. 8, 212 (1940); M. Avrami, "Kinetics of phase change III. Granulation, phase change and microstructure," J. Chem. Phys. 9, 177 (1941); W.B. Hillig, "A derivation of classical two-dimensional nucleation kinetics
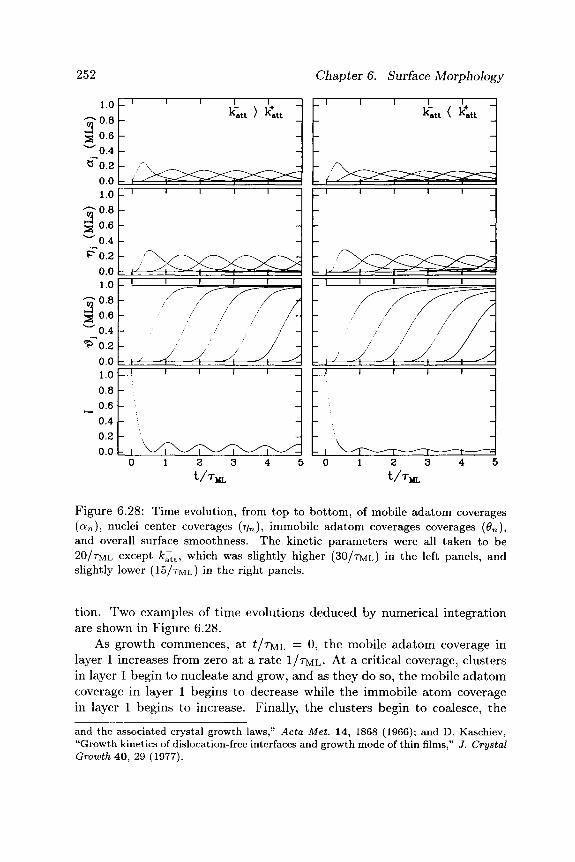
252 Chapter 6. Surface Morphology
£"0.2U
1.0 0.8 0.6 0.4 0.2 0.0 1.0 0.8 0.6 0.4 0.2 0.0 1.0 0.8 0.6 0.4 0.2 0.0 1.0 0.8 0.6 0.4 0.2 0.0
1 1
\- i-^
1
1
1 k-att >
1
1 Katt
IXi
i i
i i
1 1—i 1 1 1 1 1
l·
-
- M -Z~l
- i x
/
-4~ 1
/
^Λ Γ~
-^Ί^
/ / /
^ ι — ^ 1
v ^ ^ \ ^
^ / / J u
11
1 1
Ύ^-^Α 0 1 2 3 4 5 0 1 2 3 4 5
t /T M L t / T ^
Figure 6.28: Time evolution, from top to bottom, of mobile adatom coverages (a n ) , nuclei center coverages (r/n), immobile adatom coverages coverages (0n), and overall surface smoothness. The kinetic parameters were all taken to be 20/TML except /c~tt, which was slightly higher (30 /TML) in the left panels, and slightly lower (15 /TML) in the right panels.
tion. Two examples of t ime evolutions deduced by numerical integration are shown in Figure 6.28.
As growth commences, at £/TML — 0? the mobile adatom coverage in layer 1 increases from zero at a rate 1 /TML · At a critical coverage, clusters in layer 1 begin to nucleate and grow, and as they do so, the mobile adatom coverage in layer 1 begins to decrease while the immobile a tom coverage in layer 1 begins to increase. Finally, the clusters begin to coalesce, the
and the associated crystal growth laws," Acta Met. 14, 1868 (1966); and D. Kaschiev, "Growth kinetics of dislocation-free interfaces and growth mode of thin films," J. Crystal Growth 40, 29 (1977).

6.3. Nonequilibrium Morphology 253
nuclei center coverage decreases, and the rate at which mobile adatoms incorporate into permanent clusters also decreases.
In the meantime, as clusters in layer 1 form, mobile adatoms begin to be created in layer 2. In this way, successive layers are born by a burst of nucleation and growth of clusters, only to die by being covered by a burst of nucleation and growth of higher level clusters.64 If these bursts are well separated in time, then growth is smooth, and successive layers are born only after previous layers have died. If the bursts overlap in time, then growth is rough, and successive layers are born even before previous layers have died.
Also shown is the time evolution of a generalization of Equation 6.67 for the smoothness of the surface,
/= |£ ( -1 )" + 1 [K+Ö„) -K + 1 +Ö„ + 1 ) ]1 . (6.74)
Just as tha t defined by Equation 6.67, this quanti ty is tha t which would be measured in a kinematic surface diffraction experiment under conditions for which diffraction from adjacent exposed surface layers is out of phase.
In both cases shown in Figure 6.28, the smoothness of the surface oscil-lates in time with a monolayer periodicity. The strength of the oscillations is, however, very sensitive to the values of the kinetic parameters . For ex-ample, they are stronger when adatom at tachment is faster at down steps than at up steps (left side of Figure 6.28), rather than vice-versa (right side of Figure 6.28). The reason is tha t if adatoms preferentially at tach at down steps, then the mobile adatom coverage in higher layers will be lower, and cluster nucleation in these higher layers will tend to be suppressed until the lower layers are fully complete.
Note tha t the oscillations predicted by Equations 6.71, 6.72 and 6.73, even when weak, are relatively persistent. In practice, faster decays are nearly always observed, and are thought to be due to effects such as a small amount of step flow (see Figure 6.25) or slight nonuniformities in growth fluxes arriving at the surface (see Exercise 10).
As a final comment, note tha t this t reatment neglected evaporation of mobile adatoms back into the vapor. At the low to medium tempera-tures typical of most MBE growth, this assumption is reasonable. At high temperatures, however, evaporation can become significant. Then, the os-
6 4 S . Stoyanov, "Layer growth of epitaxial films and superlattices," Surf. Sei. 199, 226 (1988); and P.I. Cohen, G.S. Petrich, P.R. Pukite, G.J. Whaley, and A.S. Arrott, "Birth-death models of epitaxy I. Diffraction oscillations from low index surfaces," Surf. Sei. 216, 222 (1989).

254 Chapter 6. Surface Morphology
dilations in surface smoothness and in mobile adatom coverages can also manifest themselves as oscillations in the growth rate itself.65
6.3.4 Statistical Roughening In Subsection 6.3.3, we discussed how surface morphology evolves if Peclet numbers are greater than unity, so that adatom diffusion to nearby steps is slow relative to the step flow velocity. In this subsection, we discuss how surface morphology evolves if Peclet numbers are much greater than unity, so that the rate at which adatoms diffuse, even to adjacent lattice sites, becomes slower than the rate at which they arrive from the vapor. In other words, suppose adatoms "stick" wherever they happen to land. If they arrive randomly, then they will be uncorrelated in space, and it is sufficient to know the probability p that any particular column on the surface will have a height n. If they arrive randomly in time according to Poisson statistics, then this probability will be
n! In this equation, 6tot is the total coverage of deposited atoms, so that X ^ 0 P ( n ) = * anc^ Σ^=οηΡ ( η ) = ^tot· As illustrated in the left half of Figure 6.29, the column height probabilities are roughly centered at n = 6tot, but become more and more dispersed as 0tot increases. Ultimately, for large #tot, the asymmetric Poissonian distribution approaches a symmetric Gaussian distribution.66
If we again generalize Equation 6.67 to calculate the smoothness of the surface, then we can write
1 = X>i)>(n) -l 2 ^
Σ (~fltot)* -40to (6.76)
As illustrated in the right half of Figure 6.29, the surface smoothness de-creases exponentially with increasing total coverage, at a rate four times faster than the simple deposition rate.
Suggested Reading 1. A.A. Chernov, Modern Crystallography III. Crystal Growth (Springer-
Verlag, Berlin, 1984). 6 5G.H. Gilmer, "Transients in the rate of crystal growth," J. Cryst. Growth 49, 465
(1980). 6 6 E . Chason and J.Y. Tsao, "Adatoms, strings and epitaxy on singular surfaces," Surf.
Sei. 234, 361 (1990).

Suggested Reading 255
I I I I Γ
0.6 p- -ΰ = 0.ΐ
o 0.2 l·-Q 0 ' -L Q ^ Ω & c» ik
I 1 1 1 r
ο.βµ tf=i.e
a0.4L o
0.2 k ° o
0 0 ' ' Φ Q ^ ° ^ 0 2 4 6 8
n
Figure 6.29: Probability p that a particular column will have height n (left) and decay of kinematic out-of-phase diffraction intensity (right) after statistical deposition of various average numbers of monolayers 0tot ·
2. R. Kern, G. Le Lay, and J .J . Metois, "Basic Mechanisms in the Early Stages of Epitaxy," in Current Topics in Materials Science, Vol. 3, E. Kaldis, Ed. (North-Holland, Amsterdam, 1979).
3. P.K. Larsen and P.J. Dobson, Eds., Reflection High-Energy Elec-tron Diffraction and Reflection Electron Imaging of Surfaces (Plenum Press, New York, 1988).
4. B. Lewis and J .C. Anderson, Nucleation and Growth of Thin Films (Academic Press, New York, 1978).
5. J .W. Matthews, Ed., Epitaxial Growth Par t s A and B, (Academic Press, New York, 1975).
6. W.D. Robertson and N.A. Gjostein, Eds., Metal Surfaces: Structure, Energetics and Kinetics, Proceedings of a joint seminar of the Amer-ican Society for Metals and the Metallurgical Society of AIME, Oc-tober 27-28, 1962 (American Society for Metals, Metals Park, Ohio, 1963).
7. J.A. Venables, G.D.T. Spiller, and M. Hanbucken, "Nucleation and growth of thin films," Rep. Prog. Phys. 47 , 399 (1984).
8. E.D. Williams and N.C. Bartelt , "Thermodynamics of surface mor-phology," Science 251 , 393 (1991).
ud
-A 0.0 0.5 1.0 1.5
Ό

256 Chapter 6. Surface Morphology
9. A. Zangwill, Physics at Surfaces (Cambridge University Press, Cam-bridge, 1988).
Exercises 1. Derive Equation 6.12, the equilibrium probabilities of plus, minus and
missing kinks.
2. Show that angles such as LOAP in Figure 6.11, with origin on the circumference of a circle and with legs passing through the ends of a diameter of the circle, are right angles.
3. Consider the facetted 2D crystal illustrated in Figure 6.30 bounded by four faces of surface energy η0 oriented perpendicular to rays along Θ = 0, π/2,7Γ, 3π/2, and four faces of surface energy 71, oriented per-pendicular to rays along θ = π /4 ,3π /4 , 5π/4, 7π/4. Show that the pyramids that make up this polyhedra obey the "common vertex" relations
K = b0l2 + bxl\/2 hx = b0/V2-rb1/2. (6.77)
Using these relations, show that the pyramidal heights of the polyhe-dron with minimum surface energy, E = 4(7060 + 7161), at constant area, A = 4(/i060/2-h/ii&i/2), are proportional to the surface energies of the bases, j0/h0 = 7 i / ^ i , in agreement with the Wulff construc-tion.
4. Derive Equations 6.31 for the relationship between the fractional sur-face areas, x\/{x\ + X2) and #2/(^1 + #2), ano^ ^n e tangents of the orientation angles of those surfaces, tan#i and tariff.
5. Suppose f(s) in Equation 6.34 were quadratic rather than cubic. What would be the shape of the equilibrium crystal near the s = 0 facet?
6. What is the functional form of / ( s ) , where / = 7/cosö and s = tan Θ, for an orientation-independent molar surface free energy 7(0) = constant? Is it concave up or down?
7. Is there an equilbrium island size for Volmer-Weber island growth, or will larger islands continuously grow in time at the expense of smaller islands?
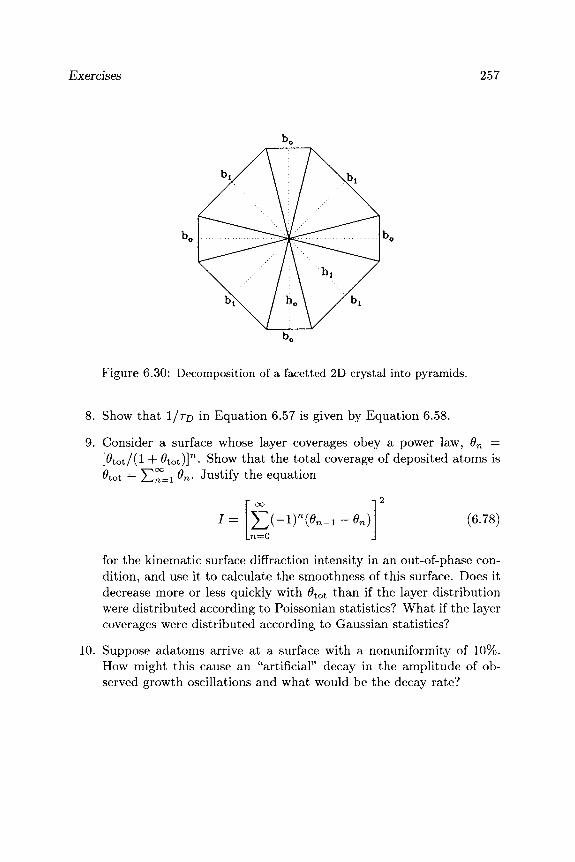
Exercises 257
Figure 6.30: Decomposition of a facetted 2D crystal into pyramids.
8. Show tha t l/το in Equation 6.57 is given by Equation 6.58.
9. Consider a surface whose layer coverages obey a power law, θη = [#tot/(l + #tot)]n· Show tha t the total coverage of deposited atoms is 0tot = Σ ^ ι 0η· Justify the equation
l 2
1 = Σ(-Ι)η(θη-1-Θη) .71 = 0
(6.78)
for the kinematic surface diffraction intensity in an out-of-phase con-dition, and use it to calculate the smoothness of this surface. Does it decrease more or less quickly with 6tot than if the layer distribution were distributed according to Poissonian statistics? Wha t if the layer coverages were distributed according to Gaussian statistics?
10. Suppose adatoms arrive at a surface with a nonuniformity of 10%. How might this cause an "artificial" decay in the amplitude of ob-served growth oscillations and what would be the decay rate?

Chapter 7
Surface Composit ion
In Chapter 6, we discussed the equilibrium and nonequilibrium morphology of a surface assuming tha t the composition of the surface was unimportant . In this chapter, we discuss the equilibrium and nonequilibrium composition of a surface assuming tha t the morphology of the surface is unimportant . In both of these chapters, therefore, we neglect possible interdependencies between morphology and composition, interdependencies tha t are clearly present but thus far poorly understood. For example, we do not discuss, except casually, the various reconstructions of the surfaces of I I I /V semi-conductors, and how they might depend on the ratio between the column III and column V atom coverages on the surface.1 Instead, we discuss those interesting and important aspects of surface composition tha t are to first order independent of surface morphology.
We begin, in Section 7.1, by describing a thermodynamic framework 1A.Y. Cho, "GaAs epitaxy by a molecular beam method: observations of surface
structure on the (001) face," J. Appl. Phys. 42, 2074 (1971); J.R. Arthur, "Surface stoichiometry and structure of GaAs," Surf. Sei. 43 , 449 (1974); M.D. Pashley, K.W. Haberern, W. Friday, J.M. Woodall, and P.D. Kirchner, "Structure of GaAs (001) (2x4)-c(2x8) determined by scanning tunneling microscopy," Phys. Rev. Lett. 60, 2176, (1988); D.K. Biegelsen, R.D. Bringans, J.E. Northrup, and L.-E. Swartz, "Surface reconstruc-tions of GaAs (100) observed by scanning tunneling microscopy," Phys. Rev. B41 , 5701 (1990); C. Deparis and J. Massies, "Surface stoichiometry variation associated with GaAs (001) reconstruction transitions," J. Cryst. Growth 108, 157 (1991); R. Ludeke, R.M. King, and E.H.C. Parker, "MBE surface and interface studies," in E.H.C. Parker, ed., The Technology and Physics of Molecular Beam Epitaxy (Plenum Press, New York, 1985), pp. 555-628; H.H. Farrell and C.J. Palmstr0m, "Reflection high energy electron diffraction characteristic absences in GaAs (100) (2x4)-As: a tool for determining sur-face stoichiometry," J. Vac. Sei. Technol. B8, 903 (1990); and J.Y. Tsao, T.M. Brennan, J.F. Klem, and B.E. Hammons, "Surface-stoichiometry dependence of As2 desorption and As4 'reflection' from GaAs (001)," J. Vac. Sei. Techn. A7 , 2138 (1989).
259

260 Chapter 7. Surface Composition
for understanding surface alloys. For simplicity, we develop the framework within the approximation tha t the surface is exactly one monolayer thick. As a consequence, the framework, like those of other monolayer models, cannot be used to understand phenomena tha t depend on surface effects greater than one monolayer deep.2 Nevertheless, the framework is intuitive, leads to a deep physical understanding of the relationship between bulk and surface alloy phases, and can be easily used in semi-empirical modeling.
Then, in Section 7.2, we apply the framework to equilibria and nonequi-hbria between vapor and monolayer adsorbate phases, t reat ing the adsor-bate phase as a surface alloy of adsorbates and "missing" adsorbates. In doing so, we will derive familiar equilibrium constructs, such as adsorption isotherms and adsorption isobars, as well as discuss less familiar nonequi-librium phenomena, such as transient and coverage-dependent adsorption and desorption.
Finally, in Section 7.3, we will apply the framework to the technologi-cally important phenomena of segregation and t rapping of dopants or other impurities at surfaces during MBE. This phenomenon is especially complex, in tha t it involves equilibria and nonequilibria between vapor, surface, and bulk crystalline phases.
7.1 Monolayer Thermodynamics In this section, we discuss the equilibrium thermodynamics of the surface of a bulk alloy. We begin, in Subsection 7.1.1, by establishing a nomenclature consistent with tha t introduced in Chapter 3. We then ask, in the first half of Subsection 7.1.2: given a composition of the bulk alloy, what is the composition of the surface alloy tha t is in equilibrium with tha t bulk alloy? In general, the surface and bulk compositions will not be the same in equilibrium, in tha t one component of the alloy will tend to segregate to the surface, displacing the other component back into the bulk. We finally ask, in the second half of Subsection 7.1.2: given the compositions of the surface and bulk alloys, what is the free energy required to create new surface at tha t composition? This free energy is the surface work (also often called the surface tension), and is minimum if the surface composition is such tha t the surface alloy phase is in equilibrium with the bulk alloy phase.
2See, e.g., J.K. Strohl and T.S. King, "A multicomponent, multilayer model of surface segregation in alloy catalysts," J. Catal. 118, 53 (1989).
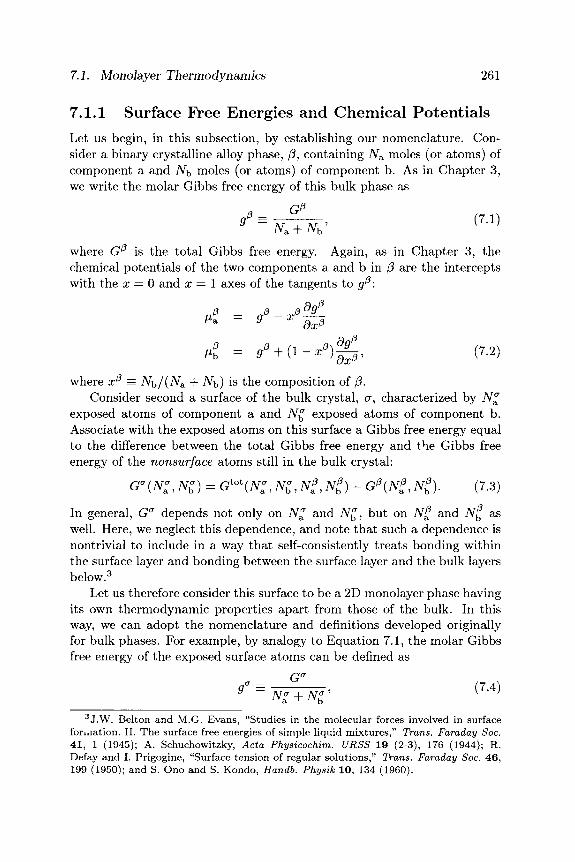
7.1. Monolayer Thermodynamics 261
7.1.1 Surface Free Energies and Chemical Potentials Let us begin, in this subsection, by establishing our nomenclature. Con-sider a binary crystalline alloy phase, /?, containing Na moles (or atoms) of component a and N\y moles (or atoms) of component b. As in Chapter 3, we write the molar Gibbs free energy of this bulk phase as
* s KTK· (7'1)
where G$ is the total Gibbs free energy. Again, as in Chapter 3, the chemical potentials of the two components a and b in β are the intercepts with the x = 0 and x = 1 axes of the tangents to g@:
ß ß ßd9ß
where x@ = N^/(Na + Νγ,) is the composition of ß. Consider second a surface of the bulk crystal, σ, characterized by N°
exposed atoms of component a and Νζ exposed atoms of component b. Associate with the exposed atoms on this surface a Gibbs free energy equal to the difference between the total Gibbs free energy and the Gibbs free energy of the nonsurface atoms still in the bulk crystal:
G"{N:, Νζ) = Gtot(NZ, Νζ, Ng, Νξ) - Gß(N^, Νξ). (7.3)
In general, Ωσ depends not only on Νζ and iV£, but on N& and Νζ as well. Here, we neglect this dependence, and note that such a dependence is nontrivial to include in a way that self-consistently treats bonding within the surface layer and bonding between the surface layer and the bulk layers below.3
Let us therefore consider this surface to be a 2D monolayer phase having its own thermodynamic properties apart from those of the bulk. In this way, we can adopt the nomenclature and definitions developed originally for bulk phases. For example, by analogy to Equation 7.1, the molar Gibbs free energy of the exposed surface atoms can be defined as
9 = N? + Nr' ( Λ> 3 J .W. Belton and M.G. Evans, "Studies in the molecular forces involved in surface
formation. II. The surface free energies of simple liquid mixtures," Trans. Faraday Soc. 4 1 , 1 (1945); A. Schuchowitzky, Ada Physicochim. URSS 19 (2-3), 176 (1944); R. Defay and I. Prigogine, "Surface tension of regular solutions," Trans. Faraday Soc. 46, 199 (1950); and S. Ono and S. Kondo, Handb. Physik 10, 134 (1960).

262 Chapter 7. Surface Composition
and, by analogy to Equations 7.2, the chemical potentials of a and b in σ are the intercepts with the x = 0 and x = 1 axes of the tangents to ga\
µΐ = g° + (l-x°)^. (7.5)
where χσ = Νζ/(Ν° + Νζ) is the composition of σ. Furthermore, the composition dependence of the molar Gibbs free en-
ergy of surface phases may be semi-empirically modeled in the same way that the molar Gibbs free energy of bulk phases is often modeled, as ideal solutions, or as one of a heirarchy of regular solutions (see Table 3.1). Ex-amples of such composition-dependent surface and bulk molar Gibbs free energies for the Ag-Au system are shown in Figure 7.1. In this system, the molar Gibbs free energies are thought to be characterized by the sub-regular forms
fl<Ag1_,/,Aux/s> = ( 1 _ xß)g(AS) + xßg(Ku) _ S m . x . d e a l T + Ω 0 ( 1 _ χβ)χβ
fl>A*i — A u " < = (1 - Χσ ) ί7 >Α 8 ( + * V A U ( - Smix,idea.T + Ω σ ( 1 - x")x°,
(7.6)
and are linear interpolations between the molar Gibbs free energies of the pure-component phases, plus entropic and enthalpic "mixing" terms.
Note that in writing these equations, we have extended the notation of Section 2.4 so that interface phases are represented by mismatched pairs of brackets, braces, and parentheses to denote the bulk phases the inter-face is sandwiched between. In this notation, the two phases of interest, the crystalline bulk and surface phases, are denoted ( A g ^ ^ A u ^ ) and )Ag1_I«rAu^(, and their compositions are denoted x@ and χσ.
For the crystalline solid, g^Ag^ and g(Au) are the known molar Gibbs free energies of the pure-component phases Ag and Au,4 and
n<Agl_x/JAux/J> =A + Bxß + CT (7.7)
is a known composition and temperature-dependent interaction parameter.5
4 The molar Gibbs free energies of the pure crystals were calculated accord-ing to the prescription described in Chapter 2, using the heat capacity expression cp = (c0 + c i T ) T 2 / ( T 2 + θ2^). The heat capacity parameters for (Ag) were cQ = 0.253 meV/(atomK), c\ = 0.0553 µ β ν ^ ί ο π ι / ^ ο ι τ ι Κ 2 ) , θ τ = 55.4 K; the parame-ters for (Au) were c0 = 0.248 meV/(atomK), c\ = 0.563 µ ε ν ^ ΐ ο π ι / ^ ΐ ο π ιΚ 2 ) and θ τ = 43.5 K.
5Following J.L. White, R.L. Orr, and R. Hultgren, "The thermodynamic properties
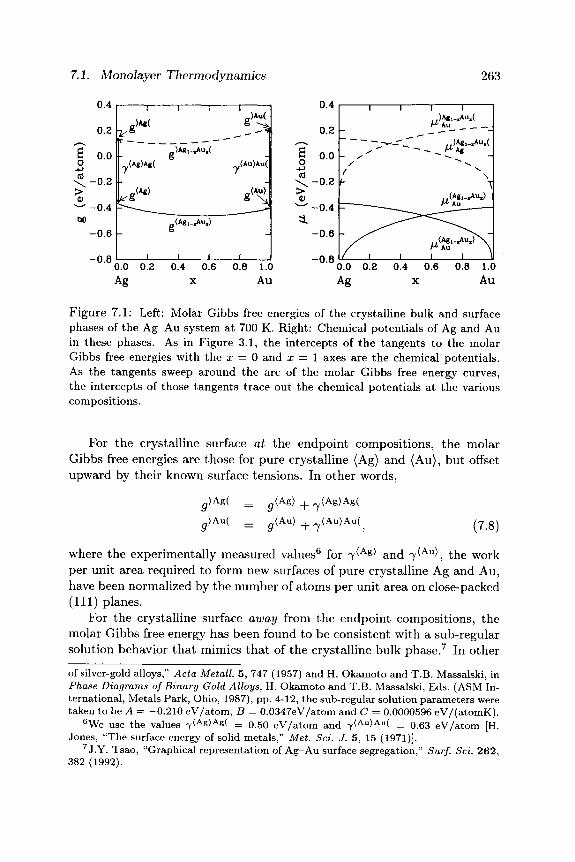
7.1. Monolayer Thermodynamics 263
0.4
0.2
ß 0.0 o
> 0)
oo
-0.2 H-
-0.4
-0.6
-0.8
1
|r —
|7<Ag>Ag(
1 0 < A e >
1 1
g<Agi.^uB)
1 fi>Au( I
(Au>Au(|
„<AU>1
I 1 0.0 0.2 0.4 0.6 0.8 1.0 Ag X Au
0.4
0.2
— ι 1 A6 Au__ __ __ _
..>Aei-^uB( ^ ^ ^ A^Ag
0.0 0.2 0.4 0.6 0.8 1.0 Ag X Au
Figure 7.1: Left: Molar Gibbs free energies of the crystalline bulk and surface phases of the Ag-Au system at 700 K. Right: Chemical potentials of Ag and Au in these phases. As in Figure 3.1, the intercepts of the tangents to the molar Gibbs free energies with the x — 0 and x = 1 axes are the chemical potentials. As the tangents sweep around the arc of the molar Gibbs free energy curves, the intercepts of those tangents trace out the chemical potentials at the various compositions.
For the crystalline surface at the endpoint compositions, the molar Gibbs free energies are those for pure crystalline (Ag) and (Au), but offset upward by their known surface tensions. In other words,
JAg( = 0<Ag> _|_ 7<Ag)Ag(
JAu( _ = 9 (Au) + 7 <Au)Au( (7.8)
where the experimentally measured values6 for 7 ^ ) and 7^A u), the work per unit area required to form new surfaces of pure crystalline Ag and Au, have been normalized by the number of atoms per unit area on close-packed (111) planes.
For the crystalline surface away from the endpoint compositions, the molar Gibbs free energy has been found to be consistent with a sub-regular solution behavior tha t mimics tha t of the crystalline bulk phase.7 In other
of silver-gold alloys," Acta Metall. 5, 747 (1957) and H. Okamoto and T.B. Massalski, in Phase Diagrams of Binary Gold Alloys, H. Okamoto and T.B. Massalski, Eds. (ASM In-ternational, Metals Park, Ohio, 1987), pp. 4-12, the sub-regular solution parameters were taken to be A = -0 .210 eV/atom, B = 0.0347eV/atom and C = 0.0000596 eV/(atomK).
6We use the values 7<As>As( = 0.50 eV/atom and 7<Au)Au( = 0 6 3 e v / a t o m [H. Jones, "The surface energy of solid metals," Met. Sei. J. 5, 15 (1971)].
7J .Y. Tsao, "Graphical representation of Ag-Au surface segregation," Surf. Sei. 262, 382 (1992).

264 Chapter 7. Surface Composition
words, Ωσ = Ω^. (7.9)
As drawn in the left panel of Figure 7.1, the shape of the molar Gibbs free energy of the surface alloy is the same as that of the bulk alloy, but is offset upward by amounts that vary linearly from 7^Ag)As( Qn one end to 7<Au>Au( on the other end.
7.1.2 Atom Transfers between Surface and Bulk Having defined, in Subsection 7.1.1, the thermodynamic functions for the crystalline bulk and surface phases, let us consider, in this subsection, trans-ferring atoms between the two phases. Such transfers can take place in two ways, and are discussed separately in the following two subsubsections.
Parallel Tangents and Equilibrium Segregation
In the first way of transferring atoms between the two phases, the overall number of surface sites is preserved. Then, if we move, e.g., a Au atom from the bulk to the surface, we must at the same time move a Ag atom from the surface to the bulk: atom transfers between bulk and surface must be atom exchanges. Hence, they are accompanied by free energy changes equal to the difference between (a) the "excess" chemical potentials required to move a Au atom from the bulk to the surface, or
,,exc _ jAg^^Au^l (Α&1_χβΑχιχβ) ^Au = MAu " ^ A U ' \(ΛΌ)
and (b) the "excess" chemical potentials required to move a Ag atom from the bulk to the surface, or
,,exc _ )Α&1_χσΑηχσ( (Α&1_χβΑηχβ) ^Ag = ^Ag ~ ^Ag · I ' · 1 1 ;
In other words, they are accompanied by a free energy change of
„exc ,,exc _ / >ASi-x-A"*- ( , (A&i-Xß Auxß >\
MAu _ ^Ag = ^ A u ~ ^Au J
f )Agl_xaAux*( (Agl_xßAuxß)\ ~ \ßAg ^Ag ) ' \ ί Λ Ζ )
This free energy change can be rewritten as
„exc „exc _ / )*&i-x*Au*<* ( > Α β ΐ - ^ Aux<x (\ A Au ~ PAg — ^ A u ^Ag J
{ (Agl_xßAuxß) (Agl_xßAuxß)\ - ^MAU ~ ^Ag J ' \*'LO)

7.1. Monolayer Thermodynamics 265
Non-equil ibrium
0.2
0.0 r\.>Ag.4Au..< / Ag
g >Ag,.llAu,(
(Ag 4Au e)Ag 4Au e(
l^ . /Ag. 4 Au e > -0 .6 h MAg
I _l_ _L
<Ag.4Aue> MAu
_L
Equilibrium 1 1
N,,)ASe3Au.37( - H- Ag
7 < A 8 .
(Ag4Au.e) - ^Ag
1 1
Au
1 1
g > A g , _ ^ u ^ ^ ^
,, >Ag.e3Au 37( r Au -
e)Ag.e3Au37(
^ A g ^ U , ) ^
— · ^ - 7 ..(Ag.Aue) MAu _
1 1 0.0 0.2 0.4 0.6 0.8 1.0 0.0 0.2 0.4 0.6 0.8 1.0 Ag x Au Ag x Au
Figure 7.2: Surface and bulk phase equilibria in the Ag-Au system at 700 K. Left: The two tangents to the molar Gibbs free energies have different slopes and there is a driving force for Ag or Au atoms to segregate to the surface. Center: the two tangents are parallel and the surface is in equilibrium with the bulk.
and can be seen to be the difference between the slope of the tangent to µ)Α&1_χσΑηχσ( a t χσ a n d t h e s k ) p e o f t h e t a n g e n t t o µ <Α 8 ι _ ^Αα ^ > ^ χβ
When µ ^ — µ^ is positive, as in the left panel of Figure 7.2, Au surface atoms will tend to exchange with Ag bulk atoms, and the surface will become enriched in Ag. When it is negative, then Ag surface atoms will tend to exchange with Au bulk atoms. When it is zero, as in the right panel of Figure 7.2, then the surface is in equilibrium with the bulk. In other words, the crystal and surface phases are in equilibrium with each other when the tangents to their molar Gibbs free energies have the same slopes, or, equivalently, when the tangents are parallel.8
Now, according to this parallel tangent criterion, to find the composition of a surface in equilibrium with a bulk crystal of a particular composition, we must solve Θ9^Α^-*σΑχι*σ(/Θχσ = dg{Agi-*ßAu*ß)/dxß by varying χσ
for fixed χΡ. Equivalently, and sometimes more conveniently, one can (see 8 M. Hillert, "The role of interfaces in phase transformations," in The Mechanism of
Phase Transformations in Crystalline Solids, Monograph and Report Series No. 33 (The Institute of Metals, London, 1969), pp. 231-247; and M. Guttmann, "Grain boundary segregation, two dimensional compound formation, and precipitation," Met. Trans. 8A, 1383 (1977).
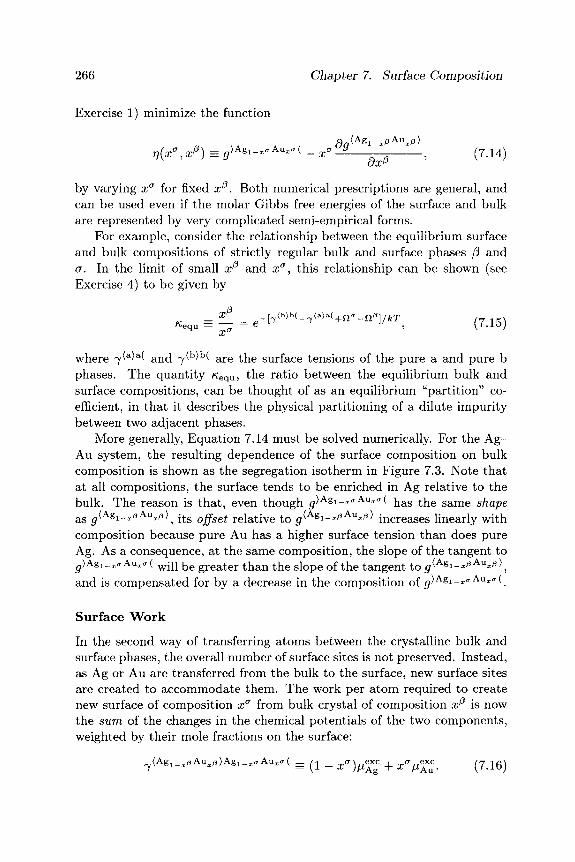
266 Chapter 7. Surface Composition
Exercise 1) minimize the function
\ A A / da{Agi-*ßAu*ß)
η{χσ,Χβ) = 0>A8i—Aux.( _ χσ^_ ? ( 7 > 1 4 )
by varying χσ for fixed x^. Both numerical prescriptions are general, and can be used even if the molar Gibbs free energies of the surface and bulk are represented by very complicated semi-empirical forms.
For example, consider the relationship between the equilibrium surface and bulk compositions of strictly regular bulk and surface phases β and σ. In the limit of small x@ and χσ, this relationship can be shown (see Exercise 4) to be given by
^equ — = e-[7<b>b(-7<a>a(+nff-n'J]/fcT / J ^ N
where 7 ^ a ( and 7<b>b< are the surface tensions of the pure a and pure b phases. The quanti ty Kequ, the ratio between the equilibrium bulk and surface compositions, can be thought of as an equilibrium "partition" co-efficient, in tha t it describes the physical parti t ioning of a dilute impurity between two adjacent phases.
More generally, Equation 7.14 must be solved numerically. For the A g -Au system, the resulting dependence of the surface composition on bulk composition is shown as the segregation isotherm in Figure 7.3. Note tha t at all compositions, the surface tends to be enriched in Ag relative to the bulk. The reason is tha t , even though ^)A gi-^< rΑυ*σ( n a s the same shape as g(AZi-*eAu*e\ its offset relative to 0<A«i-«0Au«<3> increases linearly with composition because pure Au has a higher surface tension than does pure Ag. As a consequence, at the same composition, the slope of the tangent to flf>Ag1_x<rAux<T( w i u b e g r e a t e r t han the slope of the tangent to g^A^-^An^\ and is compensated for by a decrease in the composition of ^ A ß i - ^ A U i < 7 ( .
Surface Work
In the second way of transferring atoms between the crystalline bulk and surface phases, the overall number of surface sites is not preserved. Instead, as Ag or Au are transferred from the bulk to the surface, new surface sites are created to accommodate them. The work per a tom required to create new surface of composition χσ from bulk crystal of composition x^ is now the sum of the changes in the chemical potentials of the two components, weighted by their mole fractions on the surface:
7 <Ag1_x/JAu^>Ag1_x.Auxa( Ξ ^ _ χ " ) µ « £ + xVAx
uc . (7.16)

7.1. Monolayer Thermodynamics 267
00
0.8
0.6
0.4
0.2
n n
1
-
—
*. φ-^&^
1
Δ
1
1 1
Δ ^ Γ
1 1
*aj
^ J
"1
0.0 Ag
0.2 0.4 0.6 0.8 1.0 Au
F i g u r e 7 .3 : Surface segregation isotherm for the A g - A u system at 700 K, deduced from the parallel tangent construct ion i l lustrated in Figure 7.2. Mea-sured d a t a are represented by open circles,0 tr iangles, d iamonds , 0 and filled circles.d
a G .C. Nelson, "Determination of the surface versus bulk composition of silver-gold alloys by low energy ion scattering spectroscopy," Surf. Sei. 59, 310 (1976).
bS.H. Overbury and G.A. Somorjai, "The surface composition of the silver-gold sys-tem by Auger electron spectroscopy," Surf. Sei. 55, 209 (1976).
CM.J. Kelley, D.G. Swartzfager, and V.S. Sundaram, "Surface segregation in the Ag-Au and P t -Cu systems," J. Vac. Sei. Technol. 16, 664 (1979).
K. Meinel, M. Klaua, and H. Bethge, "Segregation and sputter effects on perfectly smooth (111) and (100) surfaces of Au-Ag alloys studied by AES," Phys. Stat. Sol. A106, 133 (1988).
This equation defines the surface work, 7<ASi-*£Au*£>ASi-*-Au*<T(, in terms of the surface and bulk compositions and chemical potentials.
Let us now expand µ ^ and µ™£ using Equations 7.10 and 7.11, and apply the identities
fl<Ag1.,,A„./>> = {ί_χβ)µ(Α,1_χ,Αηχβ)+χβ^1_χ0Α^)
g)ASl_x„Aux<,( = ( 1 _ χσ)µ)Α^_χ,Αηχ,( + ^ j A g , . , . A u . . ^ ^ ^
which can be derived from Equations 7.2 and 7.5. Then, the surface work can be writ ten as
7 (Ag1_x/3Aux /g)Ag1_x (TAux <T( _
(** ~ *ß)(µϊϊ <Ag 1 _ x ^Au x / 3 ) (Α&1_χβΑ\ιχβ) -»iT-*ßAun- σ-18)

268 Chapter 7. Surface Composition
If we define the "excess" molar Gibbs free energy to be gexc = ^ A S i - ^ A u ^ ( -^ ( A g j . ^ A u ^ t h e n w e a l g o h a v e
Oexc = ΛΑ&ι-χβΑχιχβ)Α&ι-χσΑχιχσ(
+ {x° - xß) ( ^ - ' ^ - „<£-.<·*».'>) . (7.19)
This last expression for the relationship between the excess molar Gibbs free energy and the surface work can be understood graphically by inspec-tion of Figure 7.2. If the surface and bulk compositions are the same, as in the left panel, then χσ = x? and gexc = 7 < A 8 i - . / » A v ) A 8 i - . ' A u « ' ( itself. Otherwise, as in the right panel, we must add a correction term equal to the slope of the tangent to </ g i - *^ u*0' times the difference between the surface and bulk compositions. The surface work can thus be seen to be the vertical distance between the tangent to the molar Gibbs free energy of the surface at composition χσ , evaluated at χσ , and the tangent to the molar Gibbs free energy of the bulk at composition x@, also evaluated at χσ'. Importantly, this graphical interpretation of the surface work holds whether or not the tangents are parallel, hence whether or not the surface and bulk are in equilibrium with each other.
To make contact with s tandard t reatments of surface thermodynamics, note tha t Equation 7.19 can be rewritten in yet another equivalent form:
„exc _ (Ag1_i/3Aui/3)Ag1_I,AuIa( exe <A8i-*0 Auxß > , exc. <Α8ι-*0 A V )
if " I ' xAgPAg ' xAuA^Au (7.20)
This equation reproduces the well-established relation9 (at constant tem-perature) between the excess molar Gibbs free energy of the surface, the surface work, and the excess Ag and Au at the surface, and
exc — σ _ ~.β xAu — x x '
Finally, let us return to Equation 7.16, to understand more clearly the difference between the work required to transfer atoms to the surface in the two different ways. In the first way, we form new surface area at fixed composition. The work required is then ^ ^ i - x ^ v ) ^ - ^ ^ ! . i n the second way, we change the composition of the surface at fixed surface area. The work required is then &γΙΑ*ι-*βΑ"*β)Α*ι-*~Α"*σ(/8χσ = µ%£ - µ^ (see Exercise 3). In equilibrium, tha t work must be zero, as in the discussion following Equations 7.12 and 7.13.
9A.W. Adamson, Physical Chemistry of Surfaces, 4th Ed. (John Wiley and Sons, New York, 1982).
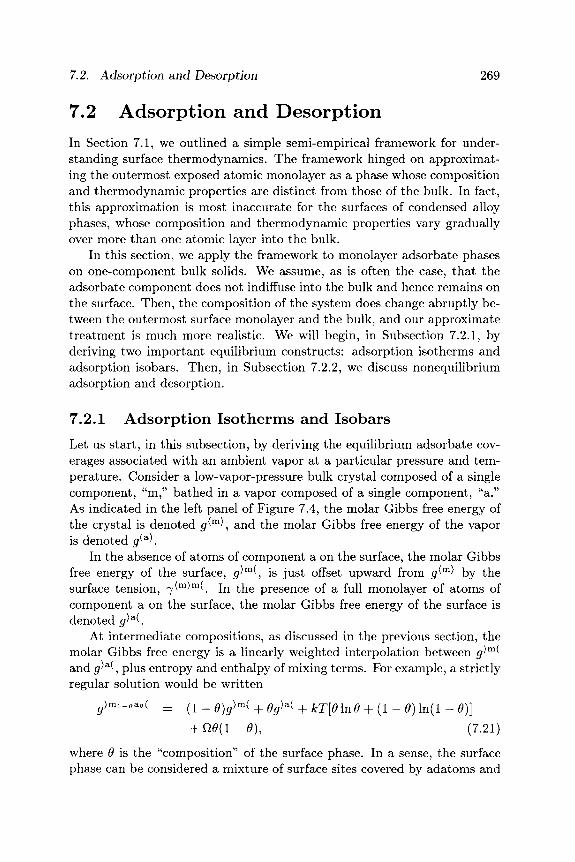
7.2. Adsorption and Desorption 269
7.2 Adsorption and Desorption In Section 7.1, we outlined a simple semi-empirical framework for under-standing surface thermodynamics. The framework hinged on approximat-ing the outermost exposed atomic monolayer as a phase whose composition and thermodynamic properties are distinct from those of the bulk. In fact, this approximation is most inaccurate for the surfaces of condensed alloy phases, whose composition and thermodynamic properties vary gradually over more than one atomic layer into the bulk.
In this section, we apply the framework to monolayer adsorbate phases on one-component bulk solids. We assume, as is often the case, tha t the adsorbate component does not indiffuse into the bulk and hence remains on the surface. Then, the composition of the system does change abruptly be-tween the outermost surface monolayer and the bulk, and our approximate t reatment is much more realistic. We will begin, in Subsection 7.2.1, by deriving two important equilibrium constructs: adsorption isotherms and adsorption isobars. Then, in Subsection 7.2.2, we discuss nonequilibrium adsorption and desorption.
7.2.1 Adsorption Isotherms and Isobars Let us start , in this subsection, by deriving the equilibrium adsorbate cov-erages associated with an ambient vapor at a particular pressure and tem-perature. Consider a low-vapor-pressure bulk crystal composed of a single component, "m," bathed in a vapor composed of a single component, "a." As indicated in the left panel of Figure 7.4, the molar Gibbs free energy of the crystal is denoted < / m \ and the molar Gibbs free energy of the vapor is denoted g^\
In the absence of atoms of component a on the surface, the molar Gibbs free energy of the surface, g^m(, is just offset upward from g^ by the surface tension, 7^m)m(. In the presence of a full monolayer of atoms of component a on the surface, the molar Gibbs free energy of the surface is denoted g*^.
At intermediate compositions, as discussed in the previous section, the molar Gibbs free energy is a linearly weighted interpolation between <^m( and (^a(, plus entropy and enthalpy of mixing terms. For example, a strictly regular solution would be writ ten
5 > m i - i a i ( = (1 - % > m ( + 0<?)a( + fcT[01n0 + (1 - θ) 1η(1 - Θ)] + Ω 0 ( 1 - 0 ) , (7.21)
where Θ is the "composition" of the surface phase. In a sense, the surface phase can be considered a mixture of surface sites covered by adatoms and

270 Chapter 7. Surface Composition
b b b b b b n n n n n n n n n n n n n n n n n n n n n n n n n n n n n n n n n n n n n n n n n n n n n n n n n n n n n n n n n n n n n n n n n n n n n n n n n n n n n n n n
Figure 7.4: Vapor and surface adsorbate phase equilibria. Left: The two tangents to the molar Gibbs free energies are parallel, hence there is no driving force for the coverage of a atoms on the surface to change. Right: Schematic of adsorption and desorption of a atoms from the vapor onto a surface and from the surface back into the vapor.
surface sites not covered by adatoms, so tha t Θ is also the average adatom coverage on the surface.
To find, given these molar Gibbs free energies, the equilibrium adatom coverage, we can apply the same arguments we applied in Section 7.1. Suppose, as illustrated in the left half of Figure 7.4, the surface coverage is θ0, so tha t the chemical potential of atoms a is the intercept of the tangent to # ) m i - ö a * ( (0 o ) with the Θ = 1 axis,
µ; ) m i θΆθ( _ > 1 θ&θ( + (1-θ) 5 > i - « a 9 (
ΘΘ " (7.22)
and the chemical potential of atoms m is the intercept with the Θ = 0 axis,
ßq)m1_eae( )mi_0a0( _ ) m i
^m — if eae{ _ Q_
de (7.23)
If we adsorb an a tom a from the vapor, then the free energy of the system increases by µ» 1 _ e a ^ — g^ due to the movement of a tom a from the vapor to the surface phase, but it decreases by g^ — µ^~θΆθ because the m atom tha t was covered has moved from the surface phase into the bulk. The equilibrium condition is therefore
µ )mi_öaö( ■µ ; >m, >Wa)-s<m\ (7.24)

7.2. Adsorption and Desorption 271
which is equivalent to the parallel tangent construction derived in Sec-tion 7.1.
Now, recall from Equation 2.47 that the molar Gibbs free energy of an elemental vapor is
S(a)(p,T) = g^\Po,T)+ kTIn (ξλ , (7.25)
where p0 is a reference pressure. Hence, as the pressure of (a) increases, the molar Gibbs free energy of (a) also increases. As a consequence, the slope of g^ — g^m( increases, causing the parallel tangent to pivot around the g)mi_öaö( c u r v e^ a n d ultimately causing the equilibrium coverage 0equ itself to increase. For a strictly regular adsorbate phase, this parallel tangent condition is expressed by combining Equations 7.21, 7.22, 7.23, 7.24 and 7.25, giving
flequ cn(l-e^u)/kT __ P_eAgdes/kT^ (J.2$)
A "equ Po
where Agdes = (g{a)(Po,T) - #>a<) - (#<m> - g^) is the "activation" free energy of desorption at the reference pressure p0. This equation defines the coverage of the surface phase in equilibrium with a vapor at pressure p and temperature T, and can be used to construct both adsorption isotherms (the pressure dependence of the coverage at constant temperature) and adsorption isobars (the temperature dependence of the coverage at constant pressure).
For example, if Ω = 0, so that the solution is ideal, then
P ^ u = p + p o e-AWfcT '
which reproduces what is known as Langmuir's isotherm. The adatom coverage increases linearly at first with increasing pressure, then saturates beyond a critical temperature-dependent pressure, p0e~Agdes^kT.
If Ω φ 0, then the solution is nonideal. On the one hand, if Ω > 0, then adatoms and "missing" adatoms repel each other, which is equiva-lent physically to adatoms attracting each other. The adatom coverage increases more rapidly at first with increasing pressure, before again sat-urating beyond a critical temperature-dependent pressure. On the other hand, if Ω < 0, then adatoms and "missing" adatoms attract each other, which is equivalent physically to adatoms repelling each other. The adatom coverage increases less rapidly at first with increasing pressure, before again saturating beyond a critical temperature-dependent pressure.
(7.27)

272 Chapter 7. Surface Composition
7.2.2 Sticking Coefficients and Desorption In Subsection 7.2.1, we discussed the composition, or coverage, of an adsor-bate surface phase in equilibrium with its vapor. Physically, tha t equilib-rium can also be viewed as the balancing of a dynamic competition between adsorption of atoms or molecules from the vapor and desorption of atoms or molecules back into the vapor. As a consequence, if we know the ad-sorption rate, then, at equilibrium, we know the desorption rate as well. In this subsection, we derive expressions for this desorption rate, as well as for the rates at which coverages, per turbed away from their equilibrium values, will re turn to those equilibrium values.
From the kinetic theory of gases, the rate at which atoms or molecules in a vapor impinge upon a surface, per lattice site, is ρλ2/ V^nmkT', where p and T are the pressure and temperature of the vapor, m is the atomic or molecular mass, and λ2 is the area per lattice site of the surface. If s(6,T) is the coverage and temperature dependent fraction of impinging atoms or molecules tha t "stick" to the surface, then the adsorption rate will be
Jdes - vsr ( 7 · 2 8 )
At equilibrium, atoms or molecules must, by detailed balance, desorb exactly as fast as they adsorb. Since, at equilibrium, the coverage of a strictly regular solution surface phase is related to the pressure by Equa-tion 7.26, the equilibrium desorption rate can also be expressed in terms of coverage as
= ρλ*8(θ,Τ) = Ρο\*8{θ,Τ) ί Θ \ n ( 1 _ , ) / f c r W f c r ( 29) J V2nmkT V2nmkT \ l - Θ J V * J
If we now assume tha t desorption depends directly on coverage, and only indirectly on the equilibrium pressure required to achieve tha t coverage, then Equation 7.29 holds even away from equilibrium. Hence, the net adsorption rate for a regular solution surface phase is
Θ = in
— Jads Jdes
\28(Θ,Τ) V2wmkT »-«•(rb)«""- e)/kTe-Agd„/kT , (7.30)
which is a first-order differential equation for the t ime evolution of the coverage.

7.2. Adsorption and Desorption 273
Often, the sticking coefficient decreases linearly with coverage as s(6, T) s 0 ( l - Θ). Then,
Θ = j n e t = *0>? [p(l -Θ)- poeeW-°VkTe-*°*«'kT] . (7.31)
The net adsorption rate can be seen to be the difference between the rate at which atoms or molecules stick on uncovered portions of the substrate , and the rate at which atoms or molecules desorb from the covered portions of the substrate.
If the surface phase is an ideal solution, then Ω = 0, and Equation 7.31 simplifies to
0 = jnet = s0X2
y/2nmkT p - 0 ( p + P o ) e - A 9 d ~ / f c r ] . (7.32)
A surface having initially a coverage of 0ini approaches exponentially the equilibrium coverage given by Equation 7.27 with a time constant r given by
1 _ So\2(p + Poe-^^kT) _ s0X2Poe-^^kT
\f2-KmkT V2wmkT(l - 0 e q u ) '
In other words, 0 — #equ + (#ini — #equ)e -t/r (7.34)
Note tha t for small deviations from the equilibrium coverage at pressure Pequ, the rate at which the surface will re turn to its equilibrium coverage is
ά(ΑΘ) = jnet(0equ + Δ 0 ) = jnet(0equ) + Δ 0 dt
Since inet(^equ) = 0 at equilibrium,
1. d(Afl) r ~ ~ A0dt
Ojn 3Θ
Jnet θθ
(7.35)
(7.36) equ
is the "small signal" approach rate back toward the equilibrium coverage. For an ideal solution surface phase, Equations 7.32 and 7.36 give
1. _ So\2{p + p0e-^*lkT) _ s0X2p0e-A^/kT
T V27rmkf V2nmkT(l - 6equy (7.37)
which reproduces Equation 7.33. For a strictly regular solution surface phase, Equations 7.31 and 7.36 give
1. = s0X2 ( 1 _ 2ft(9equ
r ~ y/2nmkT \0equ kT equ \ e-Agdes/kT (7.38)
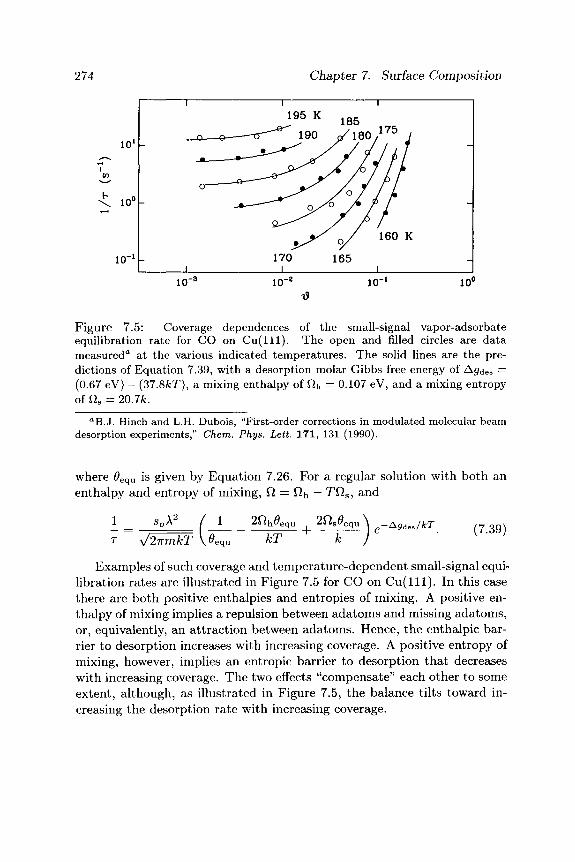
274 Chapter 7. Surface Composition
ΚΓ 'Γ -
Figure 7.5: Coverage dependences of the small-signal vapor-adsorbate equilibration rate for CO on C u ( l l l ) . The open and filled circles are data measured0 at the various indicated temperatures. The solid lines are the pre-dictions of Equation 7.39, with a desorption molar Gibbs free energy of Agdes = (0.67 eV) — (37.8/cT), a mixing enthalpy of Qh = 0.107 eV, and a mixing entropy of ns = 20.7k.
a B . J . Hinch and L.H. Dubois, "First-order corrections in modulated molecular beam desorption experiments," Chem. Phys. Lett. 171 , 131 (1990).
where 0e q u is given by Equation 7.26. For a regular solution with both an enthalpy and entropy of mixing, Ω = Ώ,^ — ΤΩ 8 , and
1 S0\2
r y/2nmkT \0« 2fth0, equ
kT + 2Ωβ0* -Agdes/kT (7.39)
Examples of such coverage and temperature-dependent small-signal equi-libration rates are illustrated in Figure 7.5 for CO on C u ( l l l ) . In this case there are both positive enthalpies and entropies of mixing. A positive en-thalpy of mixing implies a repulsion between adatoms and missing adatoms, or, equivalently, an at t ract ion between adatoms. Hence, the enthalpic bar-rier to desorption increases with increasing coverage. A positive entropy of mixing, however, implies an entropic barrier to desorption tha t decreases with increasing coverage. The two effects "compensate" each other to some extent, although, as illustrated in Figure 7.5, the balance tilts toward in-creasing the desorption rate with increasing coverage.

7.3. Surface Segregation and Trapping 275
7.3 Surface Segregation and Trapping In Section 7.1 we discussed the preferential segregation of one compo-nent from the bulk to the surface. In equilibrium, such segregation oc-curs when there are differences either between the surface tensions of the pure-component endpoint materials or between the free energies of mixing in the surface and bulk phases. Away from equilibrium, such segregation may or may not be significant, and will depend on the relative kinetics of crystal growth and interdiffusion between the surface and bulk phases. In this section, we discuss these dependences.
We will begin, in Subsection 7.3.1, by discussing the important simple case of segregation of a dilute solute under steady-state growth conditions.10
This discussion will lead to an expression for the nonequilibrium parti t i t ion coefficient, κ;, governing the ratio between the solute concentrations in the bulk and surface phases.
Then, in Subsection 7.3.2, we will make the assumption tha t , under non-steady-state conditions, this nonequilibrium parti t ion coefficient still applies locally to the ratio between solute concentrations in the bulk phase just adjacent to the surface phase and in the surface phase itself. In this way, the nonequilibrium parti t ion coefficient can be used to define a bound-ary condition connecting the non-steady-state evolution of solute concen-trations in the bulk and surface phases.
7.3.1 Steady-State Compositional Partitioning In this subsection, we consider steady-state segregation of a dilute solute b in a host solvent a. As illustrated in Figure 7.6, there are three phases to consider: the vapor, (a i_ x vb x v) , at composition x v , the bulk solid, (&\-xßhxß), at composition x@, and the surface monolayer dividing the two, )&ι-χ°\)χσ(, at composition χσ.
Between these three phases there are two basic kinetic processes tha t compete with each other.1 1 First, vapor condenses, forming simultaneously a new surface layer (layer 1 in the right side of Figure 7.6), and transforming the previous surface layer into a new bulk solid layer (layer 2 in the right side of Figure 7.6). If condensation is "partitionless," in tha t the composition of the new surface layer mimics the composition of the vapor, then the system
10We do not treat the more complicated case of a nondilute solute; see, e.g., J.M. Moison, C. Guille, F. Houzay, F. Barthe, and M. Van Rompay, "Surface segregation of third-column atoms in group III-V arsenide compounds: ternary alloys and heterostruc-tures," Phys. Rev. B40, 6149 (1989).
n J . J . Harris, D.E. Ashenford, C.T. Foxon, P.J. Dobson, and B.A. Joyce, "Kinetic limitations to surface segregation during MBE growth of III-V compounds: Sn in GaAs," Appl. Phys. A33 , 87 (1984).

276 Chapter 7. Surface Composition
o o o o
• o o o o I
2 .9 2. o_°_?_9 ·. °_0_°_9 9.9-°-9-9 .2 ·_0_0-3 ο ο · ο ο ο ο ο ο ο ο · ο ο ο ο ο ο ο ο ~
Diffusion 1 _0 ·_ O_0_0^ p_ 0_0_9_0 £ ·_0_0_· Ο 0_·_0 /f 3οοοοοο·οοοοοοοοοο·οο Ψ 4οο·οοοοοοοο·οοοοοοοο
1.1 1.3 1.5 1.6 1.8 2.1 b x b
Figure 7.6: Left: Schematic molar Gibbs free energies of crystal (&i-xßbxß), vapor (ai-xvbxv) and surface )ai_x<Tbx<r( phases. Right: Schematic of two com-peting kinetic processes: partitionless growth followed by solute partitioning via diffusion.
moves from point A to point B in the left side of Figure 7.6. At the same time, the previous surface layer, possibly enriched in solute, is transformed into a new bulk layer. Therefore, the system also moves from point C to point D in the left side of Figure 7.6.
Second, if the previous surface layer (layer 2 in the right side of Fig-ure 7.6) were enriched in solute, then as it becomes a new bulk layer, it will also be enriched in solute. As a consequence, solute will tend to diffuse out into the new surface layer (layer 1 in the right side of Figure 7.6), moving the system from point D to point E and from B to C on the left side of Figure 7.6. In other words, partitionless condensation from vapor to sur-face to bulk solid is followed by partit ioning by interdiffusion between the surface and the bulk solid. Note tha t , from start to finish, the system has moved downward from point A to point E in the left side of Figure 7.6, so tha t there is a net driving force for condensation.
Two extremes of behavior may be imagined, depending on the ratio between the rate of growth, j (in ML/s ) , and the rate of interdiffusion be-tween bulk and surface layers, Di/a2. As in Section 6.3, this ratio, a2j/Di, is a kind of Peclet number in tha t it is a dimensionless measure of the relative importance of convective over diffusional mass flow. Also as in Sec-tion 6.3, another way of understanding this Peclet number is to note tha t it is also the ratio between the t ime required for diffusion between the surface layer and its adjacent bulk layer, a2/Di, and the monolayer growth t ime,
1 U p / >-
A ^-«- "/ ·< * *->
J3
* A 2 r ^ - - * -
\ " f - - _ _ tl
^ v ^ ^ C r y s t a l
1 1 1
γ
' Surface -
Vapor A ~— — ^ ■ -— J
1
00 k ^ J 2

7.3. Surface Segregation and Trapping 277
On the one hand, if a2j/Di <C 1, then interlayer diffusion is fast relative to growth. The surface layer will be in compositional equilibrium with its adjacent bulk layer, and the ratio between their compositions will be given by the equilibrium partition coefficient Kequ. This extreme of behavior is therefore characterized by equilibrium solute segregation. On the other hand, if a2j/Di ^> 1, then interlayer diffusion is slow relative to growth. The surface layer and its adjacent bulk layer will not have time during a monolayer growth cycle to reach composition equilibrium, and the ratio be-tween their compositions, /c, will approach unity. This extreme of behavior is therefore characterized by nonequilibrium solute trapping.
Periodic and Aperiodic Step-Wise Growth
To quantify the dependence of κ on the Peclet number, consider a sim-ple model in which growth proceeds by the passage of steps on a vicinal surface.12 Suppose the composition of the surface layer just ahead of a moving step is χσ. At time t = 0, just after the step has passed, that surface layer has become a bulk layer. If the new bulk layer has preserved its composition, then
n=0=x°. (7.40) During the subsequent time interval TML = 1/j until yet another step passes, solute atoms in the bulk layer will diffuse to the surface layer, at a rate proportional to the deviation of the composition of the bulk layer from its equilibrium value, κβ(ιχιχσ. In other words,
^ = ^ V - Kequa-). (7.41)
From Equations 7.40 and 7.41, the solute concentration in the bulk decays exponentially with time according to
χβ = Kequxa + (χσ - Kequxa)e-Da^a2. (7 .42)
Suppose now that once this bulk layer has been covered by yet another sur-face layer, further interdiffusion becomes negligible. There are two extreme possibilities for the ways in which the next layer may arrive.
On the one hand, if the steps on the surface are equispaced, then they pass over the surface periodically, at time intervals separated by TML = 1/j·
1 2M.J. Aziz, "Model for solute redistribution during rapid solidification," J. Appl. Phys. 53, 1158 (1982).
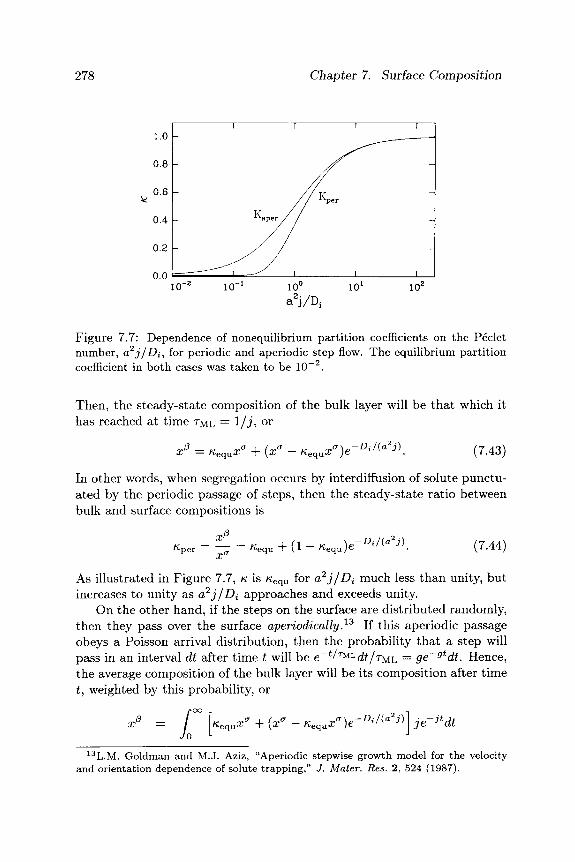
278 Chapter 7. Surface Composition
1.0
0.8
0.6
0.4
0.2
0.0
-
-
-
-
1 1
^aper / /
1 ^ 1
1
/ / Kper
1
1
-
-
1 10" 10" 10° 101
a ' j /Di 102
Figure 7.7: Dependence of nonequilibrium partition coefficients on the Peclet number, a2j/Di, for periodic and aperiodic step flow. The equilibrium partition coefficient in both cases was taken to be 10~ .
Then, the steady-state composition of the bulk layer will be tha t which it has reached at t ime TML = 1/j, or
^equ*^ i v*£ ^ e q u ^ ) ^ (7.43)
In other words, when segregation occurs by interdiffusion of solute punctu-ated by the periodic passage of steps, then the steady-state ratio between bulk and surface compositions is
v per — — ^ e q u "I v-*- ^ e q u j ^ -Di/(a2j) (7.44)
As illustrated in Figure 7.7, κ is Kequ for a2j/Di much less than unity, but increases to unity as a2j/Di approaches and exceeds unity.
On the other hand, if the steps on the surface are distributed randomly, then they pass over the surface aperiodically . 1 3 If this aperiodic passage obeys a Poisson arrival distribution, then the probability tha t a step will pass in an interval dt after t ime t will be e~t^TMLdt/ruL — ge~gtdt. Hence, the average composition of the bulk layer will be its composition after t ime £, weighted by this probability, or
— / ^equ«£ JO L
+ (*σ v equ χ
σ)β -Di/(a2j) je ~jtdt
13L.M. Goldman and M.J. Aziz, "Aperiodic stepwise growth model for the velocity and orientation dependence of solute trapping," J. Mater. Res. 2, 524 (1987).

7.3. Surface Segregation and Trapping 279
J_ 'j + Di/a?'
^equ^ ~\~ \X — f^equx ) A , ρ> / Λ 2 ' \ * ^ ^ /
In other words, when segregation occurs by interdiffusion of solute punctu-ated by the aperiod passage of steps, then the steady-state ratio between bulk and surface composition is
χΡ_ _ Kequ + ja2/Di χσ l+ja2/Di
(7.46)
Again, as illustrated in Figure 7.7, κ is Kequ for a2j/Di much less than unity, but increases to unity as a2j/Di approaches and exceeds unity. The increase is not as steep, however, as it is for Kper.
A Segregat in g D o p a n t : S b o n Si (001)
To illustrate this behavior, consider the well-established14 segregation of Sb impurities during MBE of Si on Si (001). Figure 7.8 shows measurements of the part i t ion coefficient κ at various growth rates and temperatures. As temperature increases the part i t ion coefficient initially decreases as Sb in-terdiffuses more and more quickly to the surface. At high temperatures, Sb diffusion is so fast tha t equilibrium is reached, and the parti t ion coefficient approaches the equilibrium parti t ion coefficient ttequ- Finally, as tempera-ture continues to increase, the surface and bulk phase compositions tend to equalize, and K,equ itself approaches unity (see Equation 7.15). Therefore, as temperature continues to increase, ultimately κ begins to increase again, due to an increase in Kequ.
Also shown in Figure 7.8 are the predictions of Equation 7.44 for segre-gation mediated by periodic step flow. As can be seen, the predictions agree reasonably well with the data , although there is some disagreement at the lower growth temperatures for the higher growth rates. The disagreement may be due to the onset of a 2D nucleation and growth mode, hence the onset of segregation mediated by aperiodic step flow.
7.3.2 Non-Steady-State Compositional Partitioning In Subsection 7.3.1, we derived expressions for the nonequilibrium parti t ion coefficient, κ,. There, we assumed a steady-state solute concentration in the surface layer. In other words, we assumed tha t surface solute depletion due to incorporation into the bulk was just compensated for by adsorption from the vapor.
1 4 J .C. Bean, "Arbitrary doping profiles produced by Sb-doped Si MBE," Appl. Phys. Lett. 33 , 654 (1978).

280 Chapter 7. Surface Composition
10°
io-2
io-4
l(Te
IO"8
Λ - 1 0
1 1 1
\ \ 3.0 Ä/s
1.0 Ä/S —r^M)
0.3 λ/s \}&^
1 1 1
I
-
-\
H
1 600 800 1000
T (K) 1200
Figure 7.8: Temperature dependence of nonequilibrium partition coefficients for Sb during MBE of Si on Si (001). The data points0 and predictions of Equation 7.44 are for growth rates of 3.0 Ä/s (open circles and solid line), 1.0 Ä/s (open triangles and dashed line), and 0.3 Ä/s (filled circles and dot-ted line). The diffusivity was assumed to be Arrhenian, and given by Di/α2 = 2X10¹¹ exp( — l.QleV/kT), while the equilibrium partition coefficient was assumed to be ftequ = exp( — 1.23eVy/cT), consistent with the form given by Equation 7.15.
aH. Jorke, "Surface segregation of Sb on Si (100) during molecular beam epitaxy growth," Surf. Sei. 193, 569 (1988).
In this subsection, we relax this assumption, and allow the solute con-centration in the surface layer to evolve. To do so, recall tha t the nonequi-librium part i t ion coefficient, «, is the ratio between solute concentrations in a bulk layer just adjacent to the surface layer and in the surface layer itself. It can therefore be thought of as the fraction of solute in the surface layer tha t becomes "trapped" in the adjacent bulk layer during each monolayer growth cycle. If the overall growth velocity is t>, then the rate of decrease of solute in the surface layer due to t rapping will be vκχσ ja, where a is a monolayer step height.
At the same time, solute may also adsorb from the vapor onto the surface, or desorb back into the vapor from the surface. If νΆ(\8 = j^"tea 1S
the adsorption "velocity" and vdes = j^ltex<Ta is the desorption "velocity" of solute, then the overall rate of change of solute concentration in the surface layer will be 1 5
a (vdes + VK)X°
(7.47)
15C.E.C. Wood and B.A. Joyce, "Tin-doping effects in GaAs films grown by molecular beam epitaxy," J. Appl. Phys. 49, 4854 (1978).

7.3. Surface Segregation and Trapping 281
This equation describes the time evolution of the solute concentration in the surface layer during growth. It increases due to adsorption from the vapor, and decreases due to a combination of desorption back into the vapor and trapping in the bulk.
Note, though, that even after the solute has become trapped in the bulk, it may still diffuse, albeit at rates determined by the bulk diffusivities, which may be much slower than the diffusivity for exchange between the surface layer and its adjacent bulk layer. Therefore, the bulk solute concentration will evolve, after trapping, according to
dxP „ d2x? Irj λ
-ÖT = D ^ ( 7 ·4 8 )
where z is a distance scale perpendicular to the surface in a stationary reference frame.16
The boundary condition on this diffusion equation is the solute concen-tration most recently trapped in the bulk layer just adjacent to the surface, or
[Αζ=ζΛι) = ™σ· (7.4») In this equation, ζσ{ί) = ζσ^0 — J0 vdt is the position of the interface between the surface layer and its adjacent bulk layer. Equations 7.47, 7.48 and 7.49 together completely describe the time evolution of the overall bulk solute concentration due to nonequilibrium segregation followed by bulk diffusion. They are complicated, however, by the boundary condition in Equation 7.49, which must be applied at a moving surface. It is convenient, therefore, to transform into a reference frame, z' = z + / vdt', that moves with the surface.17 In this reference frame, Equation 7.48 becomes
-θΓ = 0"Ί^-υ^ ( 7 ·5 0 )
and Equation 7.49 becomes
[ζβ],,=0 = κχσ- (7·51)
To illustrate the use of these equations, Figure 7.9 shows time evolu-tions of the spatial distributions of solute during growth of a structure
16 We neglect electrostatic effects near the surface, which may cause solute "drift" to-ward or away from the surface. See, e.g., E.F. Schubert,, J.M. Kuo, R.F. Kopf, A.S. Jordan, H.S. Luftman, and L.C. Hopkins,, "Fermi-level-pinning-induced impurity redis-tribution in semiconductors during epitaxial growth," Phys. Rev. B42 , 1364 (1990).
17S.A. Barnett and J.E. Greene, "Si molecular beam epitaxy: a model for tempera-ture dependent incorporation probabilities and depth distributions of dopants exhibiting strong surface segregation," Surf. Set. 151, 67 (1985).
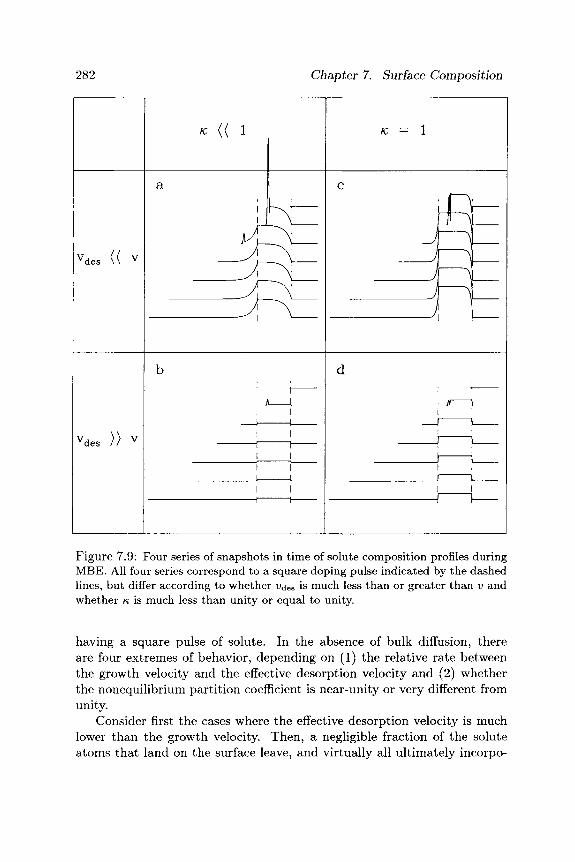
282 Chapter 7. Surface Composition
Figure 7.9: Four series of snapshots in time of solute composition profiles during MBE. All four series correspond to a square doping pulse indicated by the dashed lines, but differ according to whether fdes is much less than or greater than v and whether κ is much less than unity or equal to unity.
having a square pulse of solute. In the absence of bulk diffusion, there are four extremes of behavior, depending on (1) the relative rate between the growth velocity and the effective desorption velocity and (2) whether the nonequilibrium parti t ion coefficient is near-unity or very different from unity.
Consider first the cases where the effective desorption velocity is much lower than the growth velocity. Then, a negligible fraction of the solute atoms tha t land on the surface leave, and virtually all ultimately incorpo-
7.3. Surface Segregation and Trapping 283
rate into the growing crystal. On the one hand, if the parti t ion coefficient is unity, as in panel (c), then all the solute atoms in the surface layer are incorporated into the bulk as growth proceeds. The depth profile of the final solute concentration mimics within one to two monolayers the square pulsed arrival rate of solute. On the other hand, if the parti t ion coefficient is much less than unity, as in panel (a), then only a fraction of the solute atoms in the surface layer is incorporated into the bulk as growth proceeds. The depth profile of the final solute concentration now tails off gradually, as solute "rides" and gradually accumulates on the growing surface, and continues to be incorporated into the crystal even after the square pulse of solute has ended.
Consider second the cases where the effective desorption velocity is much higher than the growth velocity. Then, many of the solute atoms tha t land on the surface leave, and only a fraction ultimately incorporates into the growing crystal. Tha t fraction is K,v/(v^es + κ,ν) « Kv/v^es, and increases linearly with the part i t ion coefficient. The depth profile of the final solute concentration again mimics the square pulsed arrival rate of solute, because any solute in the surface layer tha t does not incorporate in the bulk desorbs from, rather than "rides" on, the surface.18 Note tha t as growth proceeds, there is a competition between desorption and trapping of solute. On the one hand, if the part i t ion coefficient is much less than unity, as in panel (b), then most of the solute atoms in the surface layer eventually desorb, and the absolute concentration of solute in the bulk is low. On the other hand, if the parti t ion coefficient is unity, as in panel (d), then more of the solute atoms in the surface layer incorporate into the bulk, and the absolute concentration of solute in the bulk is higher.
Of the four extremes of behavior just discussed, only one results in a solute composition profile tha t is broadened beyond the square solute arrival pulse. Unfortunately, tha t extreme is a commonly observed one, in which appreciable solute segregates to and rides on the surface, rather than either incorporating or desorbing. It may be circumvented to some extent by reduced growth temperature, which reduces solute diffusion from the bulk to the surface.19
18S.S. Iyer, R.A. Metzger, and F.G. Allen, "Sharp profiles with high and low doping levels in silicon grown by molecular beam epitaxy," J. Appl. Phys. 52, 5608 (1981).
1 9H.J. Gossman, E.F. Schubert, D.J. Eaglesham, and M. Cerullo, "Low-temperature Si molecular beam epitaxy: Solution to the doping problem," Appl. Phys. Lett. 57, 2440 (1990).

284 Chapter 7. Surface Composition
Suggested Reading 1. A.W. Adamson, Physical Chemistry of Surfaces, 4th Ed. (John Wiley
and Sons, New York, 1982).
2. J .M. Blakely, Introduction to the Properties of Crystal Surfaces (Perg-amon Press, Oxford, 1973).
3. R. Defay, I. Prigogine, A. Bellemans and D.H. Everett , Surface Ten-sion and Adsorption (John Wiley and Sons, New York, 1966).
Exercises 1. Verify tha t minimizing Equation 7.14 is equivalent to the parallel
tangent construction.
2. Show tha t , for a given bulk composition, the surface work given by Equations 7.16 and 7.18 is minimum when the surface composition is such tha t the surface and bulk phases are in equilibrium with each other, i.e., when the parallel tangent construction is satisfied.
3. Show, beginning with Equation 7.16, tha t
Note tha t both µ ^ and µ^ depend on χσ'.
4. Derive Equation 7.15, the equilibrium part i t ion coefficient between bulk and surface phases for strictly regular bulk and surface phases.
5. Derive Equation 7.26 for the dependence of the equilibrium coverage of a strictly regular adsorbate phase on pressure.
6. For a given Peclet number, the nonequilibrium part i t ion coefficient, /c, is higher for aperiodic than for periodic passage of steps. Physically, why is this so?
7. In principle, solute segregation and t rapping may occur at a number of stages in the growth cycle. Solute may ride ahead of the edges of steps sweeping laterally over terraces by horizontal diffusion follow-ing kink flow; they may also ride on the surface by vertical diffusion following step flow. Suppose the horizontal and vertical interdiffu-sivities at the step edges and at the surface are Dhor a n d D\eri a n d tha t the average terrace width is L /α , in units of lattice spacings.

Exercises 285
Assuming periodic partitionless kink flow followed by horizontal dif-fusive segregation, what is the nonequihbrium partition coefficient «step associated with segregation ahead of the moving step? Then, assuming periodic, non-part it ionless step flow followed by vertical diffusive segregation, what is the nonequihbrium partition coefficient «terr associated with segregation on top of the growing terraces?