surface-mounted smart pzt sensors for monitoring damage
TRANSCRIPT

Surface-mounted smart PZT sensors for monitoring damage using EMI-based multi-sensing technique
Aditya Parpe and Jothi Saravanan Thiyagarajan
School of Infrastructure,
Indian Institute of Technology Bhubaneswar, India
Mail: [email protected]

• Need of structural health monitoring to avoid the sudden failure &overcome maintenance problems.
• Lead Zirconate Titanate (PZT) act as actuator as well as sensor.
• “Electro-Mechanical Impedance Technique”: Non-destructive technique.
• In this research, the proposal of the multi-sensing technique on thesurface-mounted PZT sensors is offered.
• The effective methodologies to monitor the damage in the concretestructures, using multiple surface-mounted PZT sensors, are presented.
• This study considers the important aspects of SHM, damage detectionand localization.
Indian Institute of Technology, Bhubaneswar
Introduction
1. Methodology for damage detection-
✓ The sensors are harmonically excited in the high-frequency range.
✓ Obtaining conductance signatures at different states and comparing them.
✓ Evaluating statistical metrics (namely root mean square deviation and correlationcoefficient) for better understanding of trend of signatures.
Indian Institute of Technology, Bhubaneswar
Introduction

2. Methodology for damage localization-
✓ The group of sensors are assumed to be in parallel connection.
✓ MISO mode is preferred to obtain multiplexed signatures of particularcombination.
✓ Three combinations: SSU2-3, SSU1-3 and SSU1-2-3.
✓ Evaluating dynamic metrics (namely moving RMSD and moving CC) forlocalization.
✓The magnitude of moving RMSD and moving CC.
Indian Institute of Technology, Bhubaneswar
Introduction

• Steel plate + adhesive layer + PZT patch = SSU
• PZT patch: PIC 151
• SSUs are harmonically excited [0-450 kHz]
• Distinct resonant frequencies of SSUs.
Indian Institute of Technology, Bhubaneswar
Numerical investigationSmart sensing units (SSUs)
SSU 1 2 3
Thickness (mm) 0.75 1.5 3
Resonant frequency (kHz) 335 350 355

• Damage: crack of length 20 mm.
• External loading: load impactor✓ 10 kN
✓ 30 kN
• Conductance signatures are obtained from each SSUs at different states.
Indian Institute of Technology, Bhubaneswar
Numerical investigation Concrete beam with multiple
surface-mounted SSUs:
Damage monitoring
SSU No. 1 2 3
Distance from impactor
(mm)
310 110 250
Distance from crack
location (mm)
70 120 480

Indian Institute of Technology, Bhubaneswar
Results Damage detection study
0
0.002
0.004
0.006
0.008
0 50 100 150 200 250 300 350 400 450
Co
nd
uct
ance
(S
)
Frequency (kHz)
pristine state
damaged state
0
0.002
0.004
0.006
0.008
0 50 100 150 200 250 300 350 400 450
Co
nd
uct
ance
(S
)
Frequency (kHz)
pristine state
damaged state
0
0.003
0.006
0.009
0.012
0 50 100 150 200 250 300 350 400 450
Co
nd
uct
ance
(S
)
Frequency (kHz)
pristine state
damaged state
(a) (b)
(c)
Conductance signatures obtained from (a)
SSU-1; (b) SSU-2; (c) SSU-3 for the
damaged concrete beam.

Indian Institute of Technology, Bhubaneswar
Results Damage detection study
(a) (b)
Various statistical metrics (a) RMSD; (b) CC evaluated for each SSU.
0
0.1
0.2
0.3
0.4
0.5
SSU 1 SSU 2 SSU 3
RM
SD
0.56
0.6
0.64
0.68
0.72
SSU 1 SSU 2 SSU 3
CC

Indian Institute of Technology, Bhubaneswar
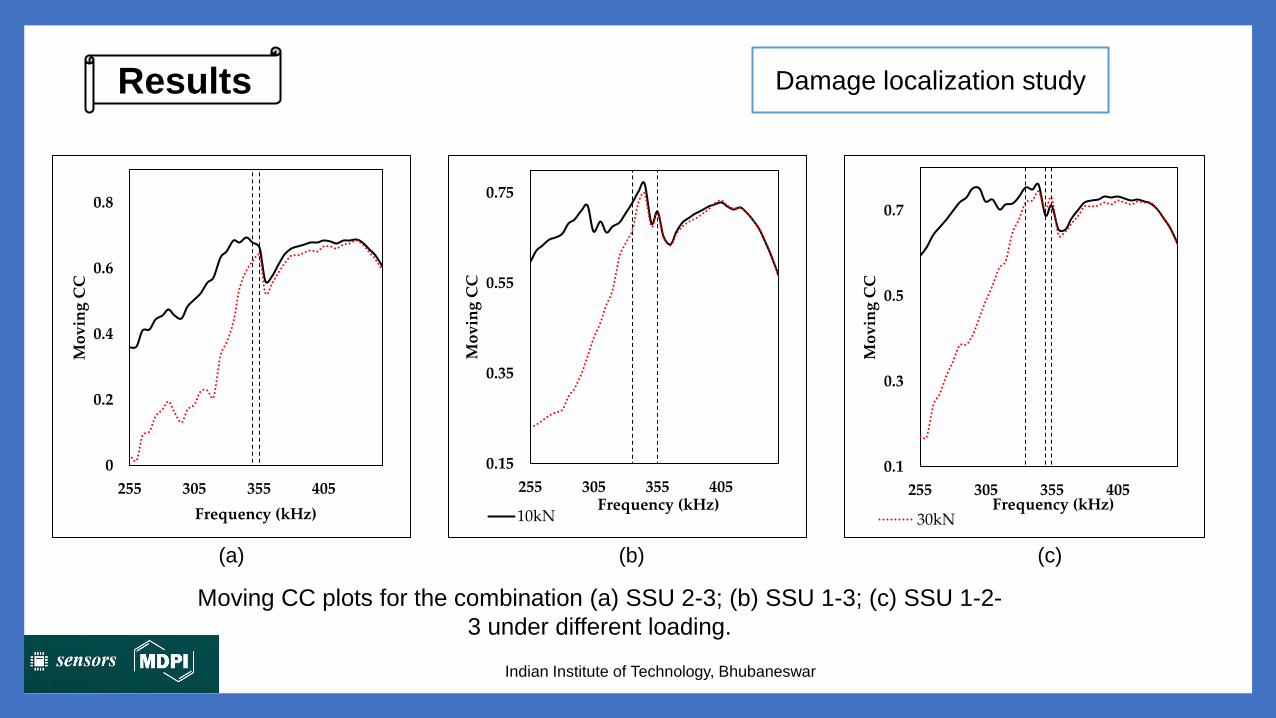
Results Damage localization study
(a) (b) (c)
Moving RMSD plots for the combination (a) SSU 2-3; (b) SSU 1-3; (c) SSU
1-2-3 under different loading.
0
0.75
1.5
2.25
3
3.75
255 305 355 405
Mo
vin
g R
MS
D
Frequency (kHz)
0
0.5
1
1.5
2
255 305 355 405M
ov
ing
RM
SD
Frequency (kHz) 10kN
0
0.5
1
1.5
2
255 305 355 405
Mo
vin
g R
MS
D
Frequency (kHz) 30kN
Indian Institute of Technology, Bhubaneswar
Results Damage localization study
(a) (b) (c)
Moving CC plots for the combination (a) SSU 2-3; (b) SSU 1-3; (c) SSU 1-2-
3 under different loading.
0
0.2
0.4
0.6
0.8
255 305 355 405
Mo
vin
g C
C
Frequency (kHz)
0.15
0.35
0.55
0.75
255 305 355 405M
ov
ing
CC
Frequency (kHz)10kN
0.1
0.3
0.5
0.7
255 305 355 405
Mo
vin
g C
C
Frequency (kHz)30kN
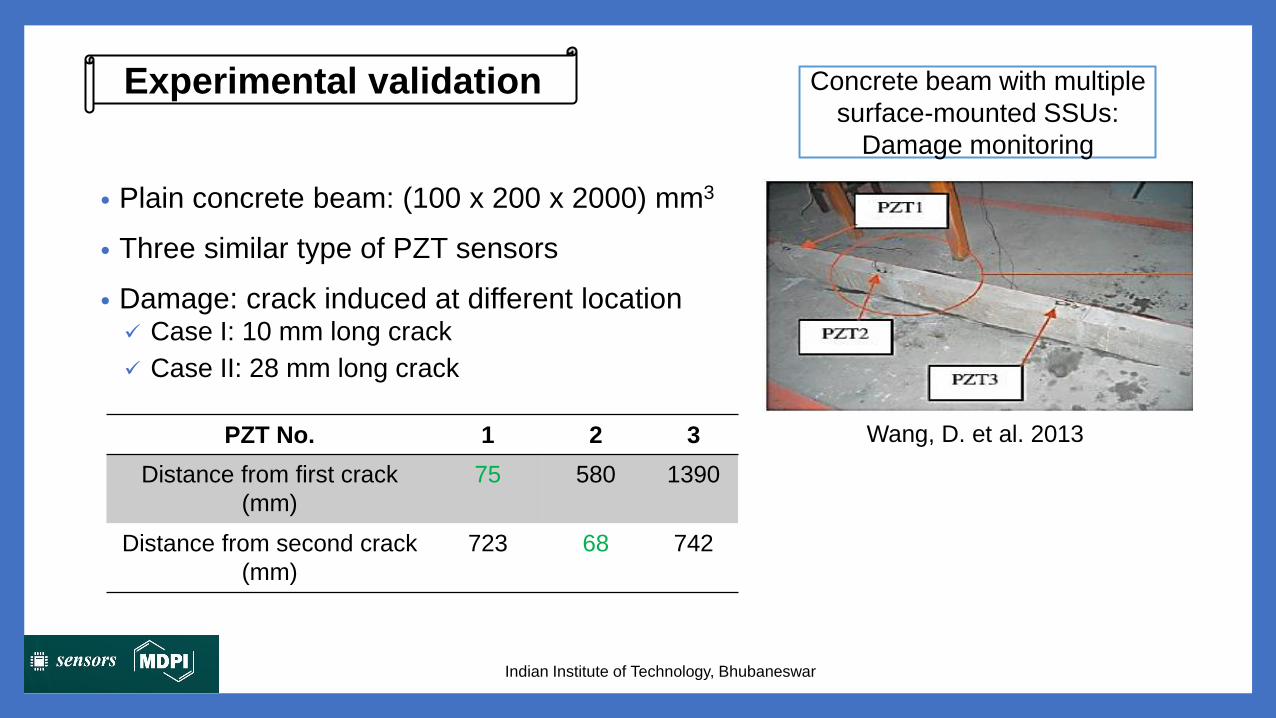
• Plain concrete beam: (100 x 200 x 2000) mm3
• Three similar type of PZT sensors
• Damage: crack induced at different location✓ Case I: 10 mm long crack
✓ Case II: 28 mm long crack
Indian Institute of Technology, Bhubaneswar
Experimental validation Concrete beam with multiple
surface-mounted SSUs:
Damage monitoring
PZT No. 1 2 3
Distance from first crack
(mm)
75 580 1390
Distance from second crack
(mm)
723 68 742
Wang, D. et al. 2013

Indian Institute of Technology, Bhubaneswar
Damage detection study
(a) (b) (c)
Conductance variations measured for (a) PZT-1; (b) PZT-2; (c) PZT-3
bonded to concrete beam.
Experimental validation
0
100
200
300
400
500
600
700
800
30 50 70 90
Co
nd
uct
ance
(μ
S)
Frequency (kHz)undamaged
0
100
200
300
400
500
600
700
30 50 70 90
Co
nd
uct
ance
(μ
S)
Frequency (kHz)10 mm crack
0
100
200
300
400
500
600
700
800
900
30 50 70 90
Co
nd
uct
ance
(μ
S)
Frequency (kHz)28 mm crack

Indian Institute of Technology, Bhubaneswar
Damage detection study
(a) (b)
Statistical metrics (a) RMSD; (b) CC evaluated for various PZT sensors.
Experimental validation
0
0.02
0.04
0.06
0.08
PZT 1 PZT 2 PZT 3
RM
SD
10 mm crack 28 mm crack
0.92
0.93
0.94
0.95
0.96
0.97
0.98
0.99
1
1.01
PZT 1 PZT 2 PZT 3
CC
10 mm crack 28 mm crack

• The trend of experimental results shows a good correlation with thenumerical results.
• Surface-mounted SSUs are working well in the concrete structures.
• The proposal of the multi-sensing technique on the surface-mounted PZTsensors is recommended for effective SHM.
• The studies based upon damage detection and localization have beenperformed.
Indian Institute of Technology, Bhubaneswar
Conclusion
