surface roughness evaluation of textile fabrics: a … s. mooneghi.pdfjournal of engineered fibers...
TRANSCRIPT

Journal of Engineered Fibers and Fabrics 1 http://www.jeffjournal.org Volume 9, Issue 2 – 2014
Surface Roughness Evaluation of Textile Fabrics: A Literature Review
Sara Asghari Mooneghi, Siamak Saharkhiz, PhD, S. Mohammad Hosseini Varkiani, PhD
Amirkabir University of Technology, Tehran, Tehran, Iran
Correspondence to:
Sara Asghari Mooneghi email: [email protected]
ABSTRACT Surface roughness is an important and effective factor in predicting tactile properties of fabrics. The definition of surface roughness and its different evaluating methods are divided into two main groups, subjective and objective, are reviewed. The latter consists of contact and non-contact methods. The evaluation in subjective and objective techniques is done by trained people as a measuring device and an apparatus, respectively. Keywords: surface roughness; subjective techniques; objective techniques; contact methods; non-contact methods; textiles. INTRODUCTION There are two reasons for surface roughness measurement. The first is to control manufacture and the second is to help ensure that the products perform well. In case of textiles, the former is related to special finishing (pressing or ironing), but the latter is related to tactile comfort and handling of fabrics [1-2]. Tactile comfort is important for garments which touch the human skin. A large number of different psychological and physiological responses of the human body along with fabric physical properties are incorporated to produce the subjective feeling of fabrics. Tactile feel is a multidimensional concept which consists of several characteristics including: compression, friction, bending, surface roughness, tensile, shear, and thermal behavior. Among these, surface roughness is a fundamental and effective factor [3-4]. In this paper, the surface roughness definition is presented. In addition, some techniques for surface roughness evaluation of fabrics which are used by various researchers are reviewed in detail.
SURFACE ROUGHNESS DEFINITION Before defining the surface roughness, the surface and its components should be identified. Any surface is generally composed of three components in accordance with wavelength or frequency. The low, medium and high frequency range variation are called form, waviness, and roughness respectively. Each surface always has these three elements together and they are expected to be analyzed separately [1, 5]. There are at least 20 roughness parameters and some of them are described in the following sections. It is necessary to notice that these parameters can be defined for form and waviness as well, but this paper is devoted to the surface roughness. Sampling Length (lr) The sampling length is the length in the X direction which is used to identify irregularities of surface roughness [5-6]. Evaluation Length (ln) The evaluation length is the length in the X direction which is used to analyze and evaluate the surface roughness profile. It can contain one or more, sampling lengths [5-6].
FIGURE 1. Mean line (Sum of areas A, C, E, G and I, is equal to K, B, D, F and H) [5] Mean Line Mean line is a reference line from which all measurements are calculated. There are different ways to define the mean line. Usually, it is placed where the sum of areas above it is equal to the sum of areas below it. In Figure 1, the sum of A, C, E, G and I is equal to K, B, D, F and H.

Journal of Engineered Fibers and Fabrics 2 http://www.jeffjournal.org Volume 9, Issue 2 – 2014
FIGURE 2. Mean line (least-squares) [5]. Another way is using the least squares line which is a line from which the sum of squares of the profile heights is minimal. As shown in Figure 2, a2+b2+c2+…+n2 is minimal [5-6]. Profile Peaks and Valleys The outward and inward sections of the profile are defined as profile peaks and valleys, respectively. These parts should join two adjacent profile intersection points with the mean line. A profile element is composed of one peak and its adjacent valley in the assessed profile. As shown in Figure 3, sections A and B are profile peaks and the section between points D and E are valleys [5-6].
FIGURE 3. Profile peaks and valleys [5]. Ordinate Value Z(x) The ordinate value is the height of the profile in each position of x from the mean line. Based on the location above or below X axis (mean line), Z(x) can be positive or negative, respectively [5-6]. Local Slope (dz/dx) Profile inclination in each position of xi is defined as the local slope (Figure 4) [5-6].
FIGURE 4. Local slope [5]. Maximum Profile Peak Height (Rp) The distance between the mean line and highest point of the profile peak is called profile peak height or Zp. The Rp is defined as the maximum Zp in one sampling length. This parameter is shown in Figure 5 [5-6].
FIGURE 5. Maximum surface roughness profile peak height [5]. Maximum Profile Valley Depth (Rv) The distance between the mean line and the deepest point of profile valley is called profile valley depth or Zv. The Rv is defined as the maximum Zv in one sampling length. This parameter is shown in Figure 6 [5-6].
FIGURE 6. Maximum surface roughness profile valley depth [5].
Journal of Engineered Fibers and Fabrics 3 http://www.jeffjournal.org Volume 9, Issue 2 – 2014
Maximum Height of Profile (Rz) The sum of the maximum profile peak height and the maximum profile valley depth in one sampling length is defined as Rz (RZ=Rp+Rv). This parameter is approximately equal to the structural roughness of the fabric surface. In nonwoven and woven fabrics, Rz changes with differences in construction [5-6]. Mean Height of Profile Elements (Rc) A profile element consists of one peak and its adjacent valley in the assessed profile. The distance between peak and valley is shown by Zt (Figure 7).
FIGURE 7. A profile element [5]. Rc is the average of the profile elements in one sampling length and is calculated by Eq. (1).
∑=
=m
iiZt
mRc
1
1
(1)
In this equation, Zti is related to the height of the profile element and m is the number of elements in one sampling length (Figure 8) [5-6].
FIGURE 8. Mean heights of surface roughness profile [5]
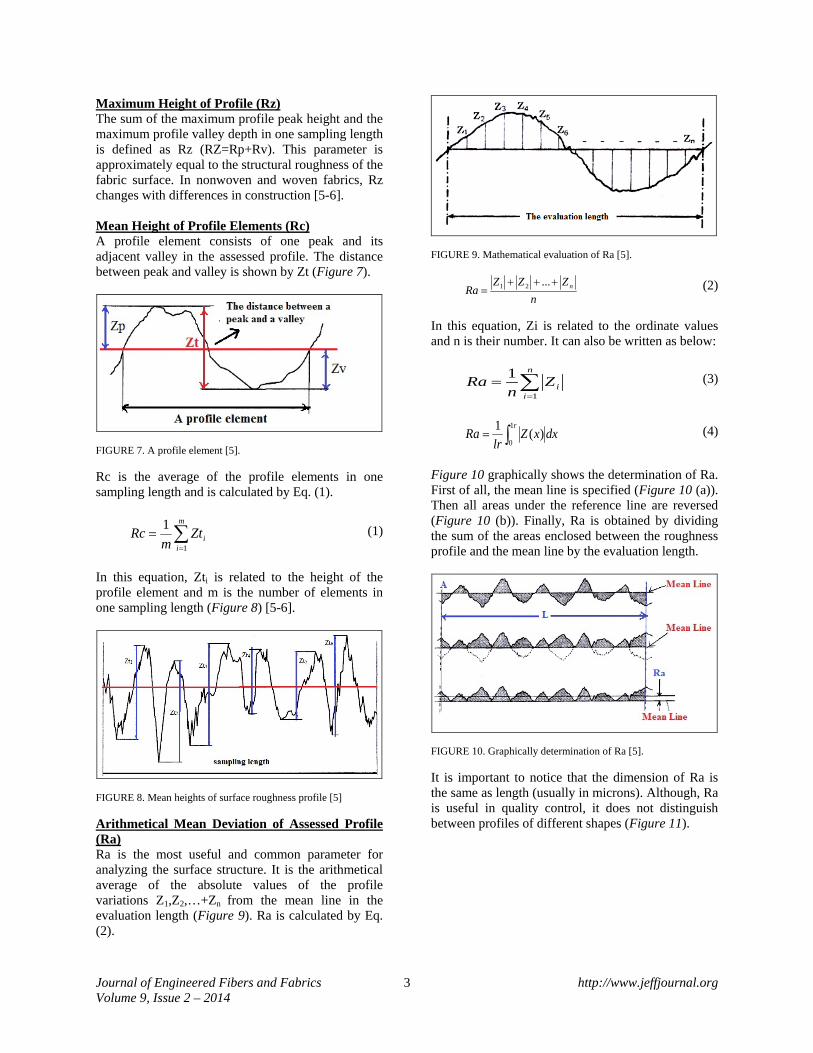
Arithmetical Mean Deviation of Assessed Profile (Ra) Ra is the most useful and common parameter for analyzing the surface structure. It is the arithmetical average of the absolute values of the profile variations Z1,Z2,…+Zn from the mean line in the evaluation length (Figure 9). Ra is calculated by Eq. (2).
FIGURE 9. Mathematical evaluation of Ra [5].
nZZZ
Ra n+++=
...21
(2)
In this equation, Zi is related to the ordinate values and n is their number. It can also be written as below:
∑=
=n
iiZ
nRa
1
1
(3)
∫=r
dxxZlr
Ra1
0)(1 (4)
Figure 10 graphically shows the determination of Ra. First of all, the mean line is specified (Figure 10 (a)). Then all areas under the reference line are reversed (Figure 10 (b)). Finally, Ra is obtained by dividing the sum of the areas enclosed between the roughness profile and the mean line by the evaluation length.
FIGURE 10. Graphically determination of Ra [5]. It is important to notice that the dimension of Ra is the same as length (usually in microns). Although, Ra is useful in quality control, it does not distinguish between profiles of different shapes (Figure 11).

Journal of Engineered Fibers and Fabrics 4 http://www.jeffjournal.org Volume 9, Issue 2 – 2014
FIGURE 11. Profiles with same Ra and different shapes [5]. It is common in the textile branch to use Mean Absolute Deviation (MAD) which is calculated as below along with Ra [5-6].
∫ −=lr
dxRaxZlr
MAD0
)(1
(5)
Root Mean Square Deviation of the Assessed Profile (Rq) The root Mean Square Deviation of the Assessed Profile in one sampling length is given by Eq. (6).
dxxZlr
Rqr
∫=1
0
2 )(1
(6)
Rq is more significant than Ra in statistics and it does not distinguish between profiles of different shapes as well [5-6]. Root Mean Square slope of the assessed profile (R∆q) This parameter is obtained from the mean square values of the local slopes in one sampling length.
dxdXdZ
lrR
r
q ∫=∆1
0
2)(1
(7)
R∆q is useful in tribological applications. The lower the slope, the smaller the friction and wear. Also, the reflectance property of a surface increases in the case of small R∆q [5-6]. Arithmetical Mean Slope of the Assessed Profile (R∆a) This parameter is obtained from the arithmetical mean of the local slopes in one sampling length.
∫=∆r
a dxdXdZ
lrR
1
0
1
(8)
This parameter is important in various applications such as in the study of sliding friction and the reflectance of light from surfaces [5-6]. As mentioned above, there are a large number of surface roughness parameters obtained from the profile method and just some are appropriate in special cases based on the purpose of investigation. SUBJECTIVE SURFACE ROUGHNESS EVALUATION OF TEXTILE FABRICS The first technique used to evaluate the surface roughness of fabrics is subjective methods. This means, evaluating the surface roughness by trained people as a measuring device. Commonly, in these methods, experts touch the fabrics with their fingers and then predict the surface roughness by using paired comparisons. The literature indicates that many investigators have studied the surface roughness of textiles by using this technique. As a case in point, in 1956, Stockbridge et al. [7] studied the surface roughness of woven and knitted fabrics subjectively. Four groups from low education, with little general alertness and little interest in the experiment till high education, were used. The groups were asked to evaluate surface roughness of fabrics by touching them with their fingers. Afterwards, they used the method of paired comparisons and determined the coefficients of consistency and unanimity among the subjects. The former was related to an individual’s judgments, and the latter was related to the agreement within a group. Results showed that there was a significant agreement on the ranking of roughness between groups of subjects. Subjects also had wide variation in their ability to perform the discrimination required. In recent times, some researchers [8] have used blind subjective sensory assessments. This means the subjects have to cover their eyes because it is believed that vision can affect the assessment of texture. Moreover, there are some reports which compare subjective assessments to objective ones. Therefore, we will review them in the following section. OBJECTIVE SURFACE ROUGHNESS EVALUATION OF TEXTILE FABRICS The purpose of the objective methods is to quantify the surface roughness using an apparatus. Generally these methods work in accordance with the surface profile systems called surface height variation (SHV)

Journal of Engineered Fibers and Fabrics 5 http://www.jeffjournal.org Volume 9, Issue 2 – 2014
trace. This profile indicates height variation in selected direction which is used to compute a number of roughness parameters. Objective methods are divided into two groups: contact or mechanical methods and non-contact methods. Contact Methods In these methods, during the measurement process, the sensor comes to contact with the surface of fabrics. Different systems have been assembled in this case, and some of them are described below. In 1955, the Cloth Profile Recorder was devised by Bulter et al. [9]. After that the KES (Kawabata Evaluation System) system was developed which works based on the correlation between subjective sensations such as smoothness, sleekness, firmness, fullness, crispness and hardness, and physical characteristics such as extension, bending, compression, and friction. The handle variations due to fabric structure and treatments can be quantified and the correlation between physical characteristics and subjective sensation is high [10]. KES can measure the coefficient of friction )μ ( and the surface roughness (mean deviation of surface roughness, SMD) simultaneously.
FIGURE 12. Sensing element of KES [11]. As shown in Figure 12, the sensing element consists of a metallic rod equipped in its free end with a thin wire in a U form. During the measurement, the sensor touches the surface of fabric under a constant normal force. In order to generate an electrical signal proportional to the vertical displacement of the sensor, a linear differential transformer is used. Moreover, to block off the signals which have frequency higher than 1 mm, a high-pass filter is applied. In that case, the signal represents only the upper and lower limits of the thickness variation of the fabric. Therefore, an integrator is used and SMD
(Surface Mean Deviation) is calculated as below (Figure 13):
∫ ′−= X dXTTX
SMD 01
(9)
In this equation, X is related to maximum measuring length, T is the fabric thickness measured by the sensor at location X and T' is the mean fabric thickness [3, 11].
FIGURE 13. Measuring surface roughness by KES [3]. In 1988, the Multipurpose Fabric Tester was designed by Hearle and Amirbayat [12-13]. This instrument measures the surface properties (roughness and friction coefficient), drape coefficient, and bending stiffness of fabrics continuously and only with one sample (Figure 14).
FIGURE 14. Multipurpose Fabric Tester (a) Sample-mounting, (b) General view of device [12]. The linear transducer has been used for measuring the surface roughness. It is capable of measuring the variation of the height to an accuracy of 1 μ ± m. During the test, a steel ball at the tip of the sensor comes in contact with the surface. The size of the steel ball is selected based on the type of fabric and surface
Journal of Engineered Fibers and Fabrics 6 http://www.jeffjournal.org Volume 9, Issue 2 – 2014
testing. Afterwards, the output signal is rectified and fed into the microprocessor. In fact, the heights (Hi) in different points (n) are measured by the instrument and the surface roughness (R) is calculated by Eq. (10).
n
HHiR
n
i∑=
−= 1
)(
(10)
In this equation (H) shows the average of heights. The results of tests on woven and nonwoven fabrics indicated that the developed device was compatible with conventional methods satisfactorily. In the same year (1988), Lord, Radhakrishnaiah, and Grove [14] studied the assessment of the tactile properties of woven fabrics made from various types of staple-fiber yarns. In this research, ring-spun, rotor-spun, and friction-spun yarns were used as weft yarns in a series of woven fabrics. Tactile properties were measured by KES (roughness and friction) and a subjective method. Then the investigators tried to correlate between measured parameters by these two methods. Reasonable correlation was obtained between subjective assessment and surface roughness characteristics over a diversified amount of thread-spacing Moreover, noticeable difference was observed in surface roughness between the front and back surfaces of a fabric. Differences in yarn structures, especially in plain fabrics (twill fabrics also were tested) had an influence on the surface roughness. The results showed that rotor-spun yarns tend to produce high levels of roughness. Besides, roughness of fabrics produced from friction-spun stable-fiber yarns may be compared favorably with those from ring-spun yarns. In 1989, Amirbayat and Cooke [13] studied the changes in surface properties of fabrics during wear. The Multipurpose Fabric Tester devised by Hearle and Amirbayat [12] was used to measure surface properties (roughness and friction) and tests performed on 20 different woven fabrics. Meantime, researchers tried to correlate between abrasion resistance and surface properties, areal density, and thickness (T) of fabrics. Results showed strong correlation between these parameters and abrasion resistance. Moreover, a trial regression equation was derived to relate mentioned properties with abrasion resistance, which showed reasonable agreement with the actual test results. It was concluded that roughness can also be used to distinguish between various fabrics better than the coefficient of friction. In 1992, Ajayi [15] studied smoothness, friction and handle of woven, knitted and nonwoven fabrics
objectively and subjectively. The surface roughness was not measured directly in this research. In other words, the hypothesis tested in this work was that any fabric that has a small coefficient of friction is likely to be explained as a smooth fabric. The Instron tensile tester equipped with a friction assembly was used for the friction measurement. Objectively, fabrics may present alike / different frictional resistance to motion and have alike / different friction coefficients, but subjectively, these fabrics may be tactually different or alike. This may show that these quantities may not be a sole index of fabric smoothness or roughness. Results demonstrated that where other frictional characteristics such as number of peaks, amplitude of resistance, and frictional resistance were roughly the same, the fabric with a smaller friction coefficient was usually smoother.
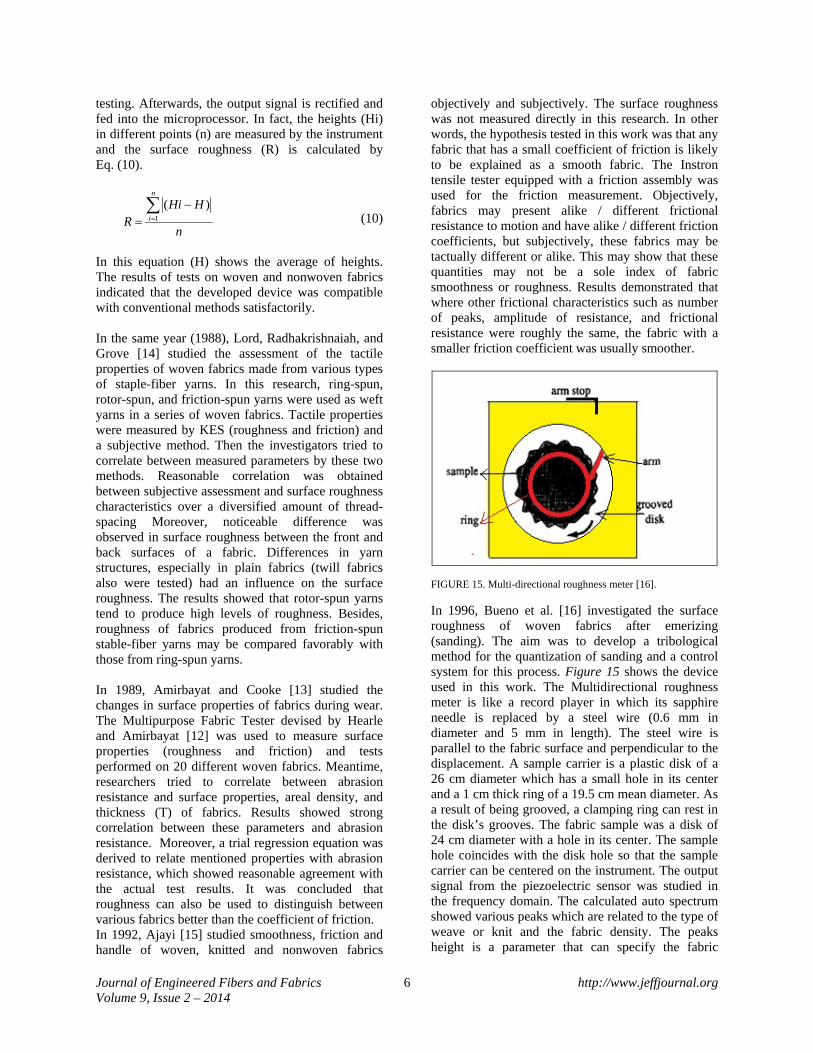
FIGURE 15. Multi-directional roughness meter [16]. In 1996, Bueno et al. [16] investigated the surface roughness of woven fabrics after emerizing (sanding). The aim was to develop a tribological method for the quantization of sanding and a control system for this process. Figure 15 shows the device used in this work. The Multidirectional roughness meter is like a record player in which its sapphire needle is replaced by a steel wire (0.6 mm in diameter and 5 mm in length). The steel wire is parallel to the fabric surface and perpendicular to the displacement. A sample carrier is a plastic disk of a 26 cm diameter which has a small hole in its center and a 1 cm thick ring of a 19.5 cm mean diameter. As a result of being grooved, a clamping ring can rest in the disk’s grooves. The fabric sample was a disk of 24 cm diameter with a hole in its center. The sample hole coincides with the disk hole so that the sample carrier can be centered on the instrument. The output signal from the piezoelectric sensor was studied in the frequency domain. The calculated auto spectrum showed various peaks which are related to the type of weave or knit and the fabric density. The peaks height is a parameter that can specify the fabric

Journal of Engineered Fibers and Fabrics 7 http://www.jeffjournal.org Volume 9, Issue 2 – 2014
surface state with high sensitivity. In fact, the measured parameter is the sensor strain energy, that is, the fabric roughness. A study on human touch revealed that the hand indicates skin strain energy, and so, the surface roughness. Considering the fact that the measured parameter in this apparatus is the sensor strain energy, the researchers claimed that this contact method is comparable with the hand evaluation system. Results showed that the peak height increases with the process intensity and decreases after sanding. This phenomenon is due to modification of fabric roughness. Following their previous work, in 1997, Bueno et al. [17] measured the surface roughness and investigated the effects of sanding and raising on the surface state of woven and knitted fabrics, macroscopically. The surface roughness was measured by the multidirectional roughness meter which was devised one year ago [16]. The instrument provides information about the fabric state and the fundamental directions of fabric relief, which depend on the type of weave or knit. In fact, this technique specifies the surface state from a tribological point of view and can be applied for different finishing processes that modify the surface state, such as sanding, raising, calendaring or ironing. Similar to their previous research, the peak heights of the calculated auto spectrum changed with the process intensity and decreased after sanding or raising, due to modification of the fabric profile. In 2004, Militky and Bazik [1] studied the surface roughness of heat resistant protective clothing. A simple technique based on the tracking of a metal blade on the textile surface and record of necessitated load, was presented. The contiguous measurement of load was done by the TIRATEST tensile testing machine, which shows the surface force variation (SFV). The force F in different distances from the reference line changes in contrast to thickness R. Furthermore, another method based on the image analysis was used in this work. The image analysis method was not described in this work completely and was proposed in another article [2] in 2007. Additionally, the surface roughness was measured by KES (marked by researcher as MAD) and a subjective method. The purpose of this investigation was to quantitatively compare surface roughness properties of the clothes and correlate them to the result of subjective assessment. It was claimed that the presented method is simple and can be used for practical measurements. However, the correlation with KES results was weak. As a result, it was thought that the image analysis method is likely to be more useful. Moderate correlation of surface
roughness with subjective hand (SH) also showed that the roughness of tested fabrics is not directly related to mechanical comfort prediction. Generally, coarser surface is potentially one of the sources of worse mechanical comfort.
FIGURE 16. Testing instrument used by Militky and Bazik (2004) [1]. In 2004, Vassiliadis and Provatidis [11] characterized the structure of woven and knitted fabrics by using surface roughness data obtained by KES. Perusals indicated that the surface roughness properties of fabrics provide knowledge on their structural characteristics. The data obtained from the KES system was signal-processed digitally owing to get the spectral characteristics of the surface roughness measurements. In fact, a novel analytical test was developed to maximize the usage of the data acquired from the KES system. It is claimed that the presented method has a non-destructive diameter and can be applied to woven or knitted fabrics. In 2005, Kim, D., Shinjung and Kim, E. [3] perceived touch of worsted fabrics based on their characteristics using the objective measurement technique. They showed the possibility of the quantitative method which was the KES system to predict subjective sensation of fabrics and influence of the surface-fiber profile on perceived handle of worsted fabrics. Although the surface roughness has been identified as an effective factor on subjective sensation of the fabric surface, researchers believed that in many cases, it is not enough especially for worsted or woolen fabrics that have surface fibers since they have a large number of surface fibers. Therefore, quantitative measured surface-fiber profiles and surface roughness of fabrics were incorporated to

Journal of Engineered Fibers and Fabrics 8 http://www.jeffjournal.org Volume 9, Issue 2 – 2014
predict perceived softness and warmth of the touch of fabrics. It is claimed that considering some limitations, the results and the methods from this report can be used for the product planning and finishing process in the textile industry. In the same year (2005), the back-scattering spectrum of textiles was studied experimentally by Moussa et al. [18]. The influence of different parameters such as the surface roughness was demonstrated experimentally and theoretically in this article. In 2005, another investigation was done by Fontaine et al. [19] to characterize roughness-friction criteria for a tested surface. In order to do so, a patented device was developed which was capable of recognizing fine modifications on the surface state of textiles.
FIGURE 17. Autospectrum analysis [19].
FIGURE 18. Measurement method used by Fontaine et al. [19]. Figure 18 shows the measuring system. Illustrating the veracity of the technique, two nonwovens which had hygienic applications were examined. The rotating disk which samples are clamped on is the sample carrier. Afterwards, it is rubbed by an extremely preloaded thin metallic blade (50µm) excited by surface properties such as friction and roughness. Throughout contact, the metallic blade
vibrates in accordance with eigenvalues of frequencies (vibration modes). Strain gauges are located on the blade to measure its vibrations. A Fourier analysis of the temporal signal from the sensor is done for calculating the power spectrum related to frequency with the use of a spectrum analyzer. This is an auto spectrum in which the height of the peaks of each mode depends on the surface state of the tested samples (Figure 17). Here the surface roughness was calculated by Eq. (11).
∫ −=L
dxyxyL
R0
.)(1
(11)
In this equation, L is the evaluation length, y is the mean length and y(x) is the height of one point located on the X axis. Owing to this auto spectrum (center of the peak), frequencies of vibration modes were experimentally specified. Researchers only studied the energies of mode 1 and 3. It has been shown that the former is sensitive to both friction and roughness while the latter is sensitive to roughness only. It was claimed that the developed method is capable of evaluating all kinds of surface states. Results showed that the roughness of the spunlace products was generally more than spun and sofspun products. Furthermore, the friction in spunlace products was more important compared to the spunbonded nonwovens. In 2007, Bertaux, Lewandowski, and Derler [8] studied the relationship between friction and tactile properties of woven and knitted fabrics. The friction coefficients of fabrics were measured by KES and textile friction analyzer (TFA). The tactile properties of the samples were appraised by two types of blind subjective sensory assessments. First, touch assessment by thumbs and the second was the prickle test. The former characterized the surface roughness and the latter characterized discomfort in terms of prickle throughout wearing. In addition, the surface roughness was measured by KES. The researcher tried to classify fabrics from the viewpoint of tactile properties and correlate fabric friction and subjectively perceived touch properties. This correlation was found just for knitted fabrics which ascribe to their surface structure. In order to understand whether or not other parameters could have affected the obtained correlation, fabric characteristics including bending, compression, basis weight, fabric thickness and hairiness were studied. They found that the related properties in the correlation between friction and the handle properties of fabrics using principal component analysis were bending, thickness and compressibility. On the other

Journal of Engineered Fibers and Fabrics 9 http://www.jeffjournal.org Volume 9, Issue 2 – 2014
hand, the friction results displayed there was a negative correlation between the friction analyzer and the KES. This was ascribed to the different testing conditions such as applied load, sliding speed, contact area and surface materials and illustrated the dependence of fabric friction properties on testing variables. Non-Contact Methods The literature indicates that many investigators have studied the surface roughness of textiles in non-contact ways. There is not contact between the sensor and surface in any of these methods. These methods are divided into two groups: Optical methods and Image analysis and fractal methods. Optical Methods The majority of non-contact methods consist of optical techniques. These methods use monochrome light which can be produced by a laser or an optical fiber bundle and are based on studying light reflection from the surface. In some methods, all the reflected light must be taken into account while other methods are based on its polarization.
FIGURE 19. (a) General view of first optic device; (b) Sample-mounting [9]. The first non-contact photic method was presented by Ramgulam, Amirbayat, and Porat in 1993 [9]. The developed device is able to measure the surface roughness of woven fabrics based on the triangulation technique. Figure 19 shows the general view of the developed device. Laser triangulation sensors specify the position of sample by measuring the reflected light form its surface. A transmitter (laser diode) projects a spot of light to the surface. Then light reflection is received by optical lens on a light sensitive device or receiver. If the position of sample changes from the reference point, the location of reflected point of light on the detector changes as well. The electrical signal demonstrates the spot location on the receiving part and, following linearization and additional digital or
analogue signal conditioning, provides an output signal proportional to the target position [20].
FIGURE 20. Laser triangulation sensor [20]. In this device, a light beam (25 micron diameter) produced by a laser diode illuminates the fabric surface. Then the laser triangulation sensor measures the distance between itself and the sample surface with a preciseness of 10 μm. Eq. (10) was used to quantify surface roughness from the obtained data. Plain woven fabrics were tested for demonstration of the presented method’s capability. Results were also compared with the given results from KES and Multipurpose Fabric tester (rotary). It was stated that the laser sensor works more precisely than the two contact methods. Moreover, the results obtained from this device were in better agreement with rotary systems than those obtained from KES. In that, KES underestimates the true geometrical roughness which is related to the size of its contactor and its measurement trend. The evaluation of roughness with hand consists of applying pressure on the fabric surface. Due to this fact, some researchers believe that the acquired results from contact methods are more compatible with subjective methods and they could be the most appropriate techniques to measure surface roughness. In order to apply this pressure in the presented device, it was suggested that the sample surface be covered with a clear glass during the measurement. It was indicated that passing a light beam through a glass had negligible effects on results.

Journal of Engineered Fibers and Fabrics 10 http://www.jeffjournal.org Volume 9, Issue 2 – 2014
In 1995, profilometric surface measuring systems were studied by Seifert et al. [21]. A contact method and a photic method (based on laser triangulation technique) which were the same in design and only different in sensor technology and a few technical details, were used. In order to compare the measuring systems, three needle bonded fabrics were tested and surface profile and the roughness parameters were obtained. Results revealed that both systems had resolutions smaller than 1 µm in the test direction and so they were appropriate for high precision measurement. Due to dependency of the measuring precision to textile characteristics, special calibration of the measuring system for textiles was expected.
FIGURE 21. Optical multidirectional roughness meter [22]. In 1999, Bueno, Durand and Renner [22-23] studied emerizing and raising effects on woven and knitted fabrics by a non-contact method. In order to do so, an optical multidirectional roughness meter with the signal processing system in the frequency domain was developed which has three main parts: sample carrier, optical part and signal processing (Figure 21). During the measurement, light spot produced by a laser transforms into a line. The linear light spot is projected on the fabric surface and is then reflected. Afterwards, the reflected light by the beam splitter goes on the photomultiplier which transforms light to electrical signal. It is important to notice that the light beam can be absorbed, scattered or reflected and the presented device is capable of measuring only the light reflection. To calculate the power spectral density relative to frequency by a spectrum analyzer which showed one or several peaks, the Fourier analysis of the electrical signal from the reflected beam was used. The peaks depended on the structure and the density of fabrics. Moreover, the surface state of fabrics was determined by frequency spectra in which peak heights were inversely proportional to the importance of the pile. Results showed that peak heights decreased after these two finishing processes due to an increase in hairiness and thus an increase in energy absorption. Also the heights increased with the process intensity.
The novelty of the presented device is the result of having three features together: the circular movement of the sample, the Fourier signal processing, and the linear probe. The first feature provides examination of samples in all directions like the human hand does during the touch of a surface. The second feature provides findings of periods. At last, having the linear probe is very useful. In fact, during a circular scan, a point like probe can sense all the threads on its path; thus the spectrum obtained displays a hump but no peaks (Figure 22). However, a linear probe shows only the basic directions of the fabric structure. The main drawback of the presented device is its sensitivity to color. This technique can be used for colorless or light-colored fabrics because of their low light absorption. In 2000, Bueno, Durand and Renner [23] measured the surface roughness of fabrics by a non-contact method. The aim of researchers was the development of a non-contact method to investigate the surface state of fabrics.
FIGURE 22. Advantage of a linear probe over a point like probe [24]. In order to do so, an optical multidirectional roughness meter designed in 1999 [22] was used again but researchers tried to modify it (Figure 21). In the previous device, the reflected beam from fabric surface is focused on the beam splitter by means of a biconvex lens. But in the current device, it is located between the beam splitter and the photodiode (Figure 23). Furthermore, in 2000 the photomultiplier is replaced by the photodiode. Except these two, there are no differences between the devices. Similar to their previous work, they studied the effects of sanding and raising finishing processes on the surface state of fabrics. Results were similar with improved accuracy.

Journal of Engineered Fibers and Fabrics 11 http://www.jeffjournal.org Volume 9, Issue 2 – 2014
In the same year (2000), this group [24] optically characterized the surface state of fabrics after sanding and raising processes. The surface roughness was measured by an optical multidirectional roughness meter developed in 2000. However, there is a difference between this device and the one used before [23]. In the new one (Figure 24), the light beam projects to the sample surface and the beam splitter is in a completely parallel way. Moreover, the hairiness of fabrics was investigated by a hairiness meter. Results showed that peak heights decreased after these processes and increased with intensity of processes. Note that these results were similar to their previous works.
FIGURE 23. Optical multidirectional roughness meter developed in 2000 by Bueno, Durand and Renner [23].
FIGURE 24. The new optical multidirectional roughness meter developed by Bueno, Durand and Renner in 2000 [24].
In 2002, Ishizawa et al. [25] measured the surface properties of woven fabrics using an optical fiber bundle and a subjective method. A complex measuring system was designed which evaluates brightness, roughness and luster of textile surfaces. Figure 25 shows the measuring system.
FIGURE 25. Measuring system developed by Ishizawa et al. [25]. In this device, the light from LED illuminates the sample surface. Then the reflected light goes into optical fibers and is detected by the photodiode and is transformed to voltage. The signal is amplified and passed through the low-pass filter. Finally, the output signal is recorded by a digital multi-meter (Figure 25 a). To measure the surface roughness (Figure 25 c) the optical fiber bundle is moved horizontally above the sample and measures the light intensity. The reflected light intensity from the surface changes based on the surface irregularities of fabrics, and this parameter can be transformed into the distance between the sample surface and the bundle edge (L) by the output characteristic curve. The mean deviation of L values demonstrated the surface roughness of fabrics. Figure 26 shows the output characteristic curve to the distance between the sample surface and the bundle edge in the case of using the mirror as the sample. Results showed that there was a high correlation between measured light intensities and values of subjective assessments. As a matter of fact, it was claimed that this novel method is useful for evaluating the surface properties of woven fabrics. The presented technique is rather simple in which by changing the sensor to fix, tilt or moving state, brightness, roughness and luster can be measured. Moreover, the device could be used in on line measuring.

Journal of Engineered Fibers and Fabrics 12 http://www.jeffjournal.org Volume 9, Issue 2 – 2014
FIGURE 26. Characteristic curve of the measuring system used by Ishizawa et al. [25]. In 2003, Park et al. [26] evaluated the surface roughness of woven and knitted fabrics in a non-contact way. A measuring device based on the laser triangulation technique was devised (Figure 27) which was composed of a laser displacement sensor with high accuracy and a linear motor. The sensor can measure the distance between itself and a sample surface (therefore the height of the object) with an accuracy of 1 μm. In consequence of having anisotropy in textile fabrics, a light beam (0.3 mm diameter) which illuminates the sample surface, measures the surface roughness over a 2 cm length along the principal directions. In the presented technique, the sample is moved with a specified speed, and then stored 200 data (obtained from the height measurement) with a microprocessor. Obtained data can be utilized using Eq. (10) to quantify the surface roughness. Afterwards, in order to reduce photic errors, the effects of hairiness and surface color on the roughness were investigated.
FIGURE 27. Measuring device used by Park et al. [26]. Results showed that surface color can be a source of error, and bright colors have the possibility to have more errors than dark colors. Also, it was revealed that the hairiness is an important parameter which increases the surface roughness. The researcher demonstrated the effectiveness of the presented method in comparing the obtained results with KES.
It is claimed that this method is suitable for precision measurement of surface roughness. In 2007, Tourlonias, Bigue, and Bueno [4] devised a polarimetric texturometer for woven and nonwoven fabrics. The presented device was made-up of a previous optical texturometer [24] which was equipped with a new measurement part and works based on analyzing the degree of polarization of reflected light. Figure 28 shows the polarimetric texturometer. The degree of polarization is calculated by Eq. (12) theoretically.
crossIIcrossII
P+−
=||
||
(12)
Here, I is related to intensity of the reflected light.
FIGURE 28. Polarimetric texturometer [4]. Therefore, the degree of polarization of reflected light can be determined by two crossed linear polarization elements I cross and III. Recording the Icross and III is enough to characterize the light wave. In order to measure these two simultaneously, a new measurement arm was added to the texturometer. The entire reflected beam from sample surface is divided into two parts by the beam splitter cube. A polarizer is placed in the first optical path, the main direction of which is parallel to the polarization direction of the incident beam, i.e., parallel to the laser line. In the same way, a polarizer crossed to this direction is located in the second optical path. As a result, Icross and III are measured at the same time and P is calculated by Eq. (12). The variation of light intensity during the measurement is related to the surface structure of fabrics. The output signal was processed with Fourier analysis. Due to fabric periodic structure, the PSD displayed several frequency peaks, the energy of which depends on the fabric surface state. In case of woven fabrics, P was dependent on

Journal of Engineered Fibers and Fabrics 13 http://www.jeffjournal.org Volume 9, Issue 2 – 2014
the surface roughness and hairiness and thermo bonding in nonwovens. Results showed that the polarization of reflected light reduced by hairiness due to an increase in surface irregularities. In 2010, Asghari Mooneghi, Hosseini Varkiyani, and Saharkhiz [27] studied the surface roughness of worsted fabrics quantitatively using a laser sensor. In this study, nine groups of woven fabrics consisting of three various weft densities (19, 21 and 23 cm-1) and three various weave (Twill 2/2, Twill 3/1 and Hopsack 2/2), were used. Comparing various filters and texture of textiles, the Gaussian Regression filter was used in order to extract the 3D surface roughness profile (Figure 29) from the measured surface profile. Afterwards, five roughness parameters were extracted using this profile, including average roughness, root mean square deviation of the surface roughness profile, maximum profile peak height, maximum profile valley depth and maximum height of profile. Results showed that Twill 3/1 always had higher surface roughness in comparison to other fabrics in a same weft density. Statistical analyses also demonstrated that there are significant relationships between weft density and weave structure with surface roughness in 95% confidence range. The advantage of this technique is the evaluation of roughness parameters not only in warp and weft direction but also in a 3D way. Since the 3D parameters provide surface roughness with just one number in comparison with 2D ones (warp and weft), they give a better gauge for roughness. Image Processing and Fractal Methods Another non-contact technique to evaluate the surface roughness consists of methods based on the image processing and fractal dimension. Here, the
surface profile is obtained by a camera and image analysis techniques. Then fractal dimension is determined by data calculated from the surface profile. Finally, surface roughness is computed by fractal dimension. In 1993, Pourdeyhimi and Sobus [28] studied surface intensity and roughness (variation of surface intensity) in order to quantify changes in appearance of carpet surfaces due to mechanical wear. This research demonstrated the utilization of gray scale image analysis to evaluate the micro texture variation and roughness or relief. Results demonstrated that simple mechanical wear commonly entails a loss of relief and variation, but carpet structure had a significant effect on the observed trends. It was believed that intensity and fractal dimension are promising candidates for automated measurement of carpet appearance. The observation also [19] revealed that although the image analysis can quantify appearance loss on carpets, this method cannot be sufficient to quantify their tactile sensation. In 2002, Hu, Xin and Yan [29] classified polar fleece fabric appearance after abrasion by extended morphological fractal analysis. In this technique, the digital gray level image is treated as a three-dimensional surface. Extended fractal analysis is capable of characterizing fabric textures where the roughness of these textures is not necessarily scale-invariant. In other words, this method can be applied to physically describe surface roughness and texture regularity with the parameter mfv (multi scale fractal vector) and to classify the appearance grade with the Bayes classification method. Experimental results showed that there was a good agreement between estimated grades and subjective ones.

Journal of Engineered Fibers and Fabrics 14 http://www.jeffjournal.org Volume 9, Issue 2 – 2014
FIGURE 29. Surface and surface roughness profile of Hopsack 2/2 [27].
In 2006, Sul et al. [10] measured surface roughness of nonwovens by three-dimensional profile data. The surface friction properties changes of nonwoven fabrics were studied under repetitious abrasions. Also surface data to evaluate roughness were obtained by a 3D camera (fractal dimension). For precise surface roughness measurement, high-pass filtering of the surface data was applied to detect defects or pilling. Figure 30 shows the three-dimensional surface scanning system.
FIGURE 30. Three-dimentional surface scanning system [10]. Results indicated that the presented technique is independent of specimen color and texture and it is free from the back-light conditions. The measuring time is very short (less than one second). As a result, this technique can be used as an on line, real time measuring system.
In 2007, Militky and Mazal [2] presented an image analysis technique to evaluate surface roughness of textiles. Researchers intended to devise a new system for measuring the surface roughness in a non-contact way. The RCM system was developed to measure roughness which uses the special arrangements of textile bend around sharp edges (Figure 31) and laser lighting from the top. Figure 32 shows the RCM system. The result after image processing is so-called “slice” which is the roughness profile in the cross direction at a chosen position in the machine. Moreover, it is possible to move the sample holder step by step and reconstruct the surface roughness plane in two dimensions.
FIGURE 31. Details of RCM apparatus: (a) fabric arrangements; (b) CCD camera position; (c) lighting system [2]. The obtained data from image processing consists of heights H(di) in different distances (d) from the reference line. Thus, the surface roughness can be calculated based on the mean absolute deviation (MAD) of these heights. It was claimed that the

Journal of Engineered Fibers and Fabrics 15 http://www.jeffjournal.org Volume 9, Issue 2 – 2014
presented method, due to being simple could be an appropriate substitute for all the traditional contact stylus profiling methods.
FIGURE 32. RCM system components [2]. COMPARISON OF VARIOUS OBJECTIVE SURFACE ROUGHNESS EVALUATION TECHNIQUES Objective surface roughness measurement consists of contact and non-contact methods. There are some advantages and disadvantages for each of these two methods which are described below. (a) All contact methods are able to damage and press surface fibers downward due to contact between sensor and fabric surface. Accordingly, obtained results from these methods depend on the type and the size of contactor. Also, these methods might evaluate surface roughness erroneously. This issue was demonstrated by Ramgulam, Amirbayat, and Porat in 1993 [9] by comparing three fabrics which had been tested by KES, Laser Sensor and Multipurpose Fabric Tester (Rotary). Figure 33 and Table I. show the SEM photographs of these fabrics and their mean roughness values, respectively. They stated that the 6.40-micron roughness given by KES for the towel is not realistic, especially when compared with the other two samples and their given roughness. TABLE I. Mean roughness values of three fabrics given by different testers (in microns) [9].
Fabric KES Laser Sensor Rotary (3mm)
Rotary (3mm)
a 2.60 28.37 27.80 32.07
b 8.96 93.42 39.60 52.30
c 6.40 183.04 16.39 -
FIGURE 33. SEM photographs of samples: (a) Woven fabric; (b) Knitted fabric; (c) Terry towel [9]. The 5-mm wide contactor of the KES, which at the same magnification is as wide as half the width of the photographs, rides over the surface while the laser beam of 25-micron diameter detects surface irregularities. The same underestimation of roughness is presented in the result given by the rotary tester when a 3-mm ball is used. Using a very fine contactor for testing these types of fabrics did not help either. The contactor dug in and became trapped, which stopped the relative motion of the fabric against it. This happened during a trail to measure the roughness of the terry towel using a 1-mm ball with the rotary tester. (b) Contact methods are time consuming and using the measured data is troublesome. Furthermore, as a consequence of being time consuming, they are not appropriate for on line, real time detection systems in the manufacturing process. (c) Contact methods in comparison with non-contact ones are more easily influenced by environmental conditions such as humidity. All these disadvantages resulted in using non-contact measurement of surface roughness in recent times [10]. However, due to lack of standardization, there have been many discrepancies between the results given by all of these contact and non-contact techniques. The only tool accepted as a commercially viable method is KES; and most of the researchers show the capability of their presented devices by comparing their results with KES results. However, some articles [9-10] show that KES results are unrealistic and underestimated due to the contact measurement mechanism and size of the stylus. Therefore, the authors think that it is still necessary to compare results given by various instruments to find the most accurate surface roughness measurement system and evaluate the suitability of that method by testing the set of textile surfaces. In addition, it seems necessary to compare various surface roughness parameters and find the most suitable parameters for fabrics.

Journal of Engineered Fibers and Fabrics 16 http://www.jeffjournal.org Volume 9, Issue 2 – 2014
After all, the presented techniques listed in this article have their own advantages and disadvantages which are briefly listed in Table II.
TABLE II. Comparison of various objective surface roughness evaluation techniques.
No Instrument Measurement Method Main Advantages and Disadvantages Sample Used Citing
1
The Kawabata Evaluation System for Fabric (KES-FB4)
Contact
KES is accepted as a commercially viable tool. Surface roughness can be measured in warp and weft
directions. In most practices the KES system is too complex and
expensive for use in factories.
Woven and Nonwoven
[3, 11 & 30]
2 Multipurpose Fabric Tester Contact
Due to contact between the sensor and the fabric surface, this device like other contact methods is able to damage the surface fibers and press them downward. Accordingly, the obtained results depend on type, size of the contactor, environmental conditions and kind of samples.
The measured parameter is similar to KES-FB4.
Woven and Nonwoven [12]
3 Multi-
Directional Roughness Meter
Contact
Considering the measured parameter in this apparatus which is the sensor strain energy, the researchers claimed that this contact method is comparable with hand evaluation system.
Woven [16]
4 A device by Militky and Bazik
Contact The measured parameter is similar to KES-FB4. The agreement with KES results is weak. The technique is simple and can be used practically.
Woven [1]
5 A device by Fontaine et al. Contact The measured parameter is similar to KES-FB4.
The device can be used for all kind of surfaces. Nonwoven [19]
6
A device by Ramgulam, Amirbayat, and Porat
Non-Contact / Laser triangulation sensor
The measured parameter is similar to KES-FB4. The presented device works more precisely than KES
and Multipurpose Fabric Tester. Utilizing a clear glass during the measurement, the
device can simulate the hand evaluation system. The technique is simple and can be used practically.
Woven, Knitted and Nonwoven
[9]
7 A device by Park et al.
Non-Contact / Laser triangulation sensor
The measured parameter is similar to KES-FB4. The agreement with KES results is very good. Results showed that the surface color and its hairiness
can be a source of error. Surface roughness can be measured in warp and weft
directions.
Woven [26]
8 Optical
Multidirectional Roughness Meter
Non-Contact / Light reflection
The advantages are the circular movement of the sample, the Fourier signal processing, and the linear probe.
The main drawback of the presented device is its sensitivity to surface color. This technique can be used for colorless or light-colored fabrics because of their low light absorption capability.
The projected light can be absorbed, scattered or reflected and the presented device is capable of measuring only the light reflection.
Woven [22]
9 Modified Optical Multidirectional
Roughness Meter
Non-Contact / Light reflection Woven [23]
10 Modified Optical Multidirectional
Roughness Meter
Non-Contact / Light reflection Woven [24]
11 A device by Ishizawa et al.
Non-Contact / Optical fiber bundle
The agreement with subjective assessment is very good.
The technique is simple and the device can be used for on-line measurements.
Surface roughness can be measured in warp and weft directions.
Woven [25]
12 Polarimetric Texturometer
Non-Contact / Polarization of reflected light
The main advantages are the circular movement of the sample, the Fourier signal processing, and the linear probe.
Using polarization of reflected light, the device is very efficient in differentiating hairiness from surface roughness. Thus, hairiness could have an effect on the reflected light energy. The results are more precise in comparison with the Optical Multidirectional Roughness Meter.
Woven and Nonwoven [4]

Journal of Engineered Fibers and Fabrics 17 http://www.jeffjournal.org Volume 9, Issue 2 – 2014
13
A device by Asghari Mooneghi, Hosseini Varkiyani, and Saharkhiz
Non-Contact / Laser triangulation sensor
The advantage of this technique is the ability to evaluate roughness parameters not only in warp and weft directions but also in 3D way. Since the 3D parameters provide surface roughness with just one number in comparison with 2D ones (warp and weft), they give a better gauge for roughness.
The method can be used for all kind of fabrics similar to its counterparts.
Woven [27]
14 Gray Scale Image Analysis
Non-Contact / Image processing and fractal
dimension
Although it cannot be sufficient to quantify tactile sensation of carpet, the method is a promising candidate for automated evolution of carpet appearance.
Carpet [28]
15 Extended
Morphological Fractal Analysis
Non-Contact / Image processing and fractal
dimension
The agreement with subjective assessment is very good. Knitted [29]
16 3D Surface Scanning System
Non-Contact / Image processing and fractal
dimension
The presented technique is independent of specimen color and texture and it is free from the back-light conditions.
The measuring time is too short (less than one second). As a result, this technique can be used as an on line, real time measuring system.
The agreement with KES results is not good which is due to difference in the measurement mechanism.
Nonwoven [10]
17 RCM System Non-Contact / Image processing and fractal
dimension
Being simple, the device could be an appropriate substitute for all the traditional contact stylus profiling methods.
The measured parameter is similar to KES-FB4.
Woven [2]
CONCLUSION Surface roughness is an important factor during touching and handling of fabrics. Here, the surface roughness definition and different techniques for evaluating this property of fabrics were reviewed. In general, there are subjective and objective techniques to evaluate surface roughness. Since 1955, researchers have attempted to measure surface characteristics of fabrics from a quantitative point of view. Previously, subjective assessments were used. Distinctive techniques have been proposed in this context since then which have their own advantages and disadvantages. The objective group also consists of contact and non-contact methods. REFERENCES [1] Militky, J., and Bajzik, V., “Characterization
of Protective Clothing Surface Roughness”, 2nd International Congress on Technical textiles, 2004.
[2] Militky, J., and Mazal, M., “Image Analysis Method of Surface Roughness Evaluation”, International Journal of Clothing Science and Technology, 2007, 19 (3-4), pp 186-193.
[3] Kim, D., Shinjung, Y., and Kim, E., “Objective Measures for Perceived Touch of Worsted Fabrics”, International Journal of Industrial Ergonomics, 2005, 35, pp 1159-1169.
[4] Tourlonias, M., Bigue, L., and Bueno, M.A.,
“Polarimetric Measurements of Fabric Surfaces”, Optical Engineering, 2007, 46 (8), pp 1-9.
[5] Biglari, F.R., and Dashtizadeh, M., “Surface Metrology and Contact Roughness Measurment”, Amirkabir University of Technology (Tehran Polytechnic) Press, Tehran, 2005.
[6] Seifert, R., Raue, P., Offermann, P., Bahners, T., Schollmeyer, E., Magel, M., Fuchs, H., “Surface Characterisation of Textile Fabrics. Part 1: Surface Characterisation Parameters”, Melliand Textilber., 1993, 76 , pp 30–33, E13–E15.
[7] Stockbridge H.C. et. al. “The Subjective Assessment of the Roughness of Fabrics”, J. Text. Inst., 1957, 48, pp 26-34.
[8] Bertaux, E., Lewandowski, M., and Derler, S., “Relationship between Friction and Tactile Properties for Woven and Knitted Fabrics”, Textile Res. J., 2007, 77 (6), pp 387-396.
[9] Ramgulam, R.B., Amirbayat, J., and Porat, I., “Measurement of Fabric Roughness by a Non-Contact Method”, J. Text. Inst., 1993, 84, pp 99–106.
[10] Sul, I., Hong, K., Shim, H., and Kang, T., “Surface Roughness Measurement of Nonwovens Using Three-Dimensional Profile Data”, Textile Res. J., 2006, 76 (11), pp 828-834.

Journal of Engineered Fibers and Fabrics 18 http://www.jeffjournal.org Volume 9, Issue 2 – 2014
[11] Vassiliadis, S., and Provatidis, C., “Structural Characterization of Textile Fabrics Using Surface Roughness Data”, International Journal of Clothing Science and Technology, 2004, 16 (5), pp 445-457.
[12] Hearle, J.W.S., and Amirbayat, J., “The Design of a Multipurpose Fabric Tester”, J. Text. Inst., 1988, 79 (4), pp 588–598.
[13] Amirbayat, J., and Cooke, W.D., “Change in Surface Properties of Fabrics during Wear”, Textile Res. J., 1989, 59 (7), pp 469–477.
[14] Lord, P.R., Radhakrishnaiah, P., and Grove, G. “Assessment of the Tactile Properties of Woven Fabrics Made from Various Types of Staple-Fibre Yarn”, J. Text. Inst., 1988, 79 (1), pp 32–52.
[15] Ajayi, J.O., “Fabric Smoothness, Friction, and Handle”, Textile Res. J., 1992, 62, pp 52–59.
[16] Bueno, M.A., Lamy, B., Renner, M., and Viallier-Raynard, P., “Tribological Investigation of Textile Fabrics”, Wear, 1996, 195 (1-2), pp 192-200.
[17] Bueno, M.A., Viallier, P., Durand, D., and Renner, M., “Instrumental Measurement and Macroscopical Study of Sanding and Raising”, Textile Res. J., 1997, 67 (11), pp 779-787.
[18] Moussa, A., Dupont, D., Steen, D., Zeng, X., and Elias, M., “Experimental Study of Back-Scattering Spectrum of Textile Structures”, Color Research and Application, 2006, 31 (2), pp 122-132.
[19] Fontaine, S., Marsiquet, C., Renner, M., Bueno, M.A., and Nicolletti, N., “Characterization of Roughness-Friction: Example with Nonwovens”, Textile Res. J., 2005, 75 (12), pp 826-832.
[20] http://www.sensorland.com/HowPage056.html [21] Seifert, R., Raue, P., Offermann, P., Bahners,
T., Schollmeyer, E., Ma¨gel, M., and Fuchs, H., “Surface Characterisation of Textile Fabrics. Part 3: Profilometric Surface Measuring Systems”, Melliand Textilber., 1995, 76, pp 636–639, E164–E166.
[22] Bueno, M.A., Durand, B., and Renner, M., “Noncontact Measurements of Sanding and Raising Effects”, Textile. Res. J., 1999, 69(8), pp 570–575.
[23] Bueno, M.A., Durand, B., and Renner, M. “Non-Contact Measurement of the Roughness of Textile Fabrics”, Experimental Techniques, 2000, 24 (2), pp 23-27.
[24] Bueno, M.A., Durand, D., and Renner, M., “Optical Characterization of the State of the Fabric Surfaces”, Opt. Engng., 2000, 39 (6), pp 1697-1703.
[25] Ishizawa, H., Nishimatsu, T., Kamijyo, M., and Toba, E., “Measurement of Surface Properties of Woven Fabrics Using an Optical Bundle”, J. Textile Engineering, 2002, 48(1), pp 5–10.
[26] Park, K.H., Kwon, Y.H., Oh, K.W., and Kim, E.A., "The Surface Roughness Measurement for Textiles Fabrics by a Non-Contact Method for Tactile Perception", 2003, 6th ADC.
[27] Asghari Mooneghi, S., Hosseini Varkiyani, S.M., and Saharkhiz, S., “Further Study on Roughness of Worsted Fabrics”, AUTEX 2011, Mulhouse.
[28] Poudeyimi, B., and Sobus, J., “Evaluating Carpet Appearance Loss: Surface Intensity and Roughness”, Textile Res. J., 1993, 63 (9), pp 523-535.
[29] Hu, J., Xin, B., and Yan, H., “Classifying Fleece Fabric Appearance by Extended Morphological Fractal Analysis”, Textile Res. J., 2002, 72 (10), pp 879-884.
[30] Bernard, A.B, Barker, R., and Hinks, D., “Factors Affecting Human Comfort Response to Garments”, M. Sc. Thesis, Textile Engineering Department, North Carolina State University, 2009.
AUTHORS’ ADDRESSES Sara Asghari Mooneghi Siamak Saharkhiz, PhD S. Mohammad Hosseini Varkiani, PhD Amirkabir University of Technology 424 Hafez Ave Tehran, Tehran 15875-4413 Iran