surface spectroscopy of nanoparticles
TRANSCRIPT

Diss. ETH No 00000
Surface Spectroscopy of Nanoparticles
A dissertation submitted to the
SWISS FEDERAL INSTITUTE OF TECHNOLOGY ZURICH
for the degree of
Doctor of Natural Sciences
presented by
Alejandro Niels Keller Perez
Lic. Ing. Fısica, UIA
born October 25th, 1970
citizen of Mexico
accepted on the recommendation of:
Prof. Dr. H. C. Siegmann, examiner
Prof. Dr. D. Pescia, co-examiner
2001


Contents
Abstract 1
Zusammenfassung 3
Chapter 1. Surface Science with Nanosized
Particles in a Carrier Gas 5
1. Introduction 6
2. Evaluation of the surface area 7
3. Chemical fingerprint of the active surface 15
4. Theoretical background of the scaling laws 20
5. Conclusions 24
Chapter 2. Effects of second order processes
in aerosol monitoring 27
1. Introduction 28
2. Theory 29
3. Methods 33
4. Results and Discussion 36
Chapter 3. Magnetic circular dichroism in the
photoemission of nanoparticles in gas suspension 47
1. Introduction 48
2. Ferrofluids 48
i

ii CONTENTS
3. Methods 49
4. Results and Discussion 53
References 59
Acknowledgements 65
Curriculum vitae 67
Education 67
Scholarships 67
Working experience 68
CHAPTER 1
Surface Science with Nanosized
Particles in a Carrier Gas
ABSTRACT. The dynamics of nanoparticles in a carrier gas are governed by the
physical and chemical nature of the surface. The total surface area can be divided
into an “active” and a “passive” part. The active surface is the surface on which
transfer of momentum, energy, and mass from the gas to the particle takes place.
The experiments show that the active surface may be determined in physically very
differentin situexperiments such as measuring the mobilityb, the diffusion constant
D, or the mass transfer coefficientK of the particle. The concept of the active sur-
face manifests itself in scaling lawsKb = const,KD = const andY b = const,
found valid over a large range of particle shapes and sizes.Y is the yield of low
energy photoelectrons from the particles upon irradiating the carrier gas with light
of energy below the ionization energy of the carrier gas molecules but above the
photoelectric threshold of the particles. WhileK, D, andb are independent of the
chemical nature of the particles as far as we know today, the simultaneous measure-
ment ofY provides a chemical fingerprint of the particles and allows one to observe,
in combination with pulsed lasers as sources of light, the dynamical changes of the
active surface while the nanoparticle is interacting with the carrier gas.
∗Published in: A. Kelleret al., J. Vac. Sci. Technol. A 19(1), Jan/Feb 2001
5

6 1. SURFACE SCIENCE WITH NANOSIZED PARTICLES IN A CARRIER GAS
1. Introduction
Nanosized liquid or solid bodies may remain suspended in a carrier gas for a
long time. They are mesoscopic, containing103-106 atoms or molecules, and may
exhibit unexpected properties due to their very large surface to volume ratio. Such
nanoparticles in a carrier gas have been largely neglected in surface science. Yet it
is evident that it would be highly welcome if not urgent to know more about their
surface characteristics. Nanoparticles in air, for instance, have moved to the center
of attention because of their well documented effect on public health (Peters et al.,
2000). They are deposited in the alveoles of the lung, where the defense mechanisms
of the human body are weak; in this way, a number of toxic chemicals adsorbed at
the nanoparticle surface penetrate into the human body using the nanoparticles as
vehicles. Another example is the precipitation forming process in clouds. It depends
to a large extent on the presence of nanoparticles acting as condensation nuclei for
ice and water. This has a significant influence on the albedo of the earth and on rain
and snowfall (Rosenfeld, 2000).
However, none of these phenomena is understood on the atomic level. It is
therefore necessary to adapt the techniques developed in surface science to the char-
acterization of the surface of the nanoparticles. It is important to do the investigations
while the nanoparticle remains suspended in its carrier gas. Deposition on a sub-
strate and transfer into vacuum may severely alter the surface characteristics of the
nanoparticle and, through the action of surface tension, even its shape. The transfer
of momentum, energy, and mass from the gas to the particle as well as the hetero-
geneous chemical reactions and the surface tension are dominated by an atomically
thin layer at the surface. The properties of this layer can be subject to significant
transformations without changing the particle bulk parameters. It is well known that
a fingerprint of the surface as well as its dynamical changes become observable by
measuring the photoelectric yield of the particle while it is suspended in its genuine
2. EVALUATION OF THE SURFACE AREA 7
carrier gas (Kasper et al., 1999a). The surface characteristics often depend on spuri-
ous contaminants of the carrier gas and on small changes of the temperature as well
as on fine details in the process of nanoparticle production, be it in an internal com-
bustion engine (Matter et al., 1999) or in a volcano (Ammann et al., 1993). It is the
purpose of this article to show that surface science with nanoparticles in a carrier gas
is possible and a rewarding new field of research with many important applications.
2. Evaluation of the surface area
With nanoparticles it is generally not possible to define the geometry by a few
simple parameters, such as diameter, surface area, or volume. This arises because
nanoparticles may exhibit bizarre shapes with numerous incisions and internal sur-
faces. But the surface tension may also contract them into perfect spheres, notably if
water or other impurities in the carrier gas condense on them, or if the temperature
is raised so that the surface atoms become mobile. The electron microscope, in prin-
ciple a powerful tool to image nanostructures, has its limitations as the nanoparticles
may change shape on substrate deposition and on transfer to the vacuum for instance
by evaporation of condensates. Yet, one needs to have some measure of the surface
area in order to evaluate adsorption and to understand the interaction with the carrier
gas.
2.1. Surface area from the mobility or the diffusion constant.The most
commonly used technique to determine the “size” of a nanoparticlein situ relies on
the measurement of the mobilityb of the particle in its carrier gas.b is defined by
assuming a linear friction lawV = bF in which a constant drift velocityV is reached
under the action of an external forceF . F = eE is generated by attaching one
elementary electrical chargee to the particle and bringing it along with the carrier
gas into the electrical fieldE of a condenser. Nanoparticles of one specificb can exit
through a slit in the condenser and are counted with a condensation nucleus counter.

8 1. SURFACE SCIENCE WITH NANOSIZED PARTICLES IN A CARRIER GAS
100°C
400°C
800°C
1300°C400°C
100°C
FIGURE 1.1. Electronoptical micrographs of gold particles
generated in an electric discharge between gold-electrodes. Af-
ter the generation, the inert carrier gas has been heated to the
temperature indicated. The particles have identical mobilities
selected in a differential mobility analyzer. This mobility leads
to a mobility diameterdp = 50 nm which indeed corresponds to
the diameter of the spherical particles heated to 800 and 1300◦C.
The melting point of bulk gold is 1064◦C, but it is obvious that
the surface atoms become mobile much below that temperature.
By scanning the electric field in the condenser and counting the exiting particles at
each field strength, the mobility spectrum of the nanoparticles is obtained.
Figure. 1.1 shows examples of electron micrographs of gold particles that have
been generated in an electric discharge between high purity Au electrodes in atmo-
spheric pressure Ar gas which was subsequently heated to the temperature indicated.
After that, particles of the mobilityb = 0.92 × 10⁻³ cm2/(V s) were selected, pre-
cipitated on a substrate, and imaged in transmission electron microscopy. For the

2. EVALUATION OF THE SURFACE AREA 9
simple case of pure Au-particles in pure argon gas, the aforementioned possible dis-
tortions by electron microscopy are minimal. Figure 1.1 demonstrates that only those
particles heated to high temperatures approximate a spherical shape, the diameter of
which turns out to be≈ 50 nm. The “nose” of the particle heated to 1300◦C is prob-
ably due to agglomeration with a smaller particle after the heating section but before
the mobility analyzer. The generally accepted function connecting the observed mo-
bility with a particle diameterdp has been tabulated by Fuchs (Fuchs, 1964). In the
case of the particles displayed in Figure 1.1, this function yieldsdp = 50 nm as
well. However, the unheated Au particles have a much larger geometrical surface
area compared to the spherical Au particles. The concept of the mobility diameter
clearly can be quite misleading. It is outright wrong to derive the area of the geomet-
rical surface or the volume of the particle from it. Correctly, one has to think ofdp
as a parameter fixing the “active” surface which is essentially the part of the surface
that causes the friction in the carrier gas as explained later. The “passive” surface
includes the inner surfaces and the surface in bays or incisions that does not interact
with the carrier gas.
The theory of the friction coefficient1/b of a nanoparticle depends on the
Knudsen numberKn = λ/dp, whereλ is the mean free path of the carrier gas
molecules;λ = 67 nm in air at normal conditions. IfKn À 1, one has the molec-
ular particle motion where the gas molecules flyin vacuonear the particle. The
friction coefficient is then caused by the pressure difference between front and back
of the particle yielding:
(1)1
b=
1
3πnmvδd2
p,
wheren, m, andv are the density, mass, and average velocity of the gas molecules.
δ is a factor with value 1.0 or 1.4 depending on whether the reflection of the gas
molecules on the nanoparticle is specular or diffuse, respectively. Chemically inert
surfaces tend to exhibit specular, chemically active surfaces diffuse reflection. In

10 1. SURFACE SCIENCE WITH NANOSIZED PARTICLES IN A CARRIER GAS
actual aerosol practice, the mode of reflection is assumed to be fixed between these
two extremes. In reality, it depends on the accommodation coefficient at the interface
gas/particle.
ForKn ¿ 1, the particle friction is calculated from fluid dynamics. Assuming
spherical particles and very small drift velocity one arrives at the Stokes law in which
1/b ∝ dp. This is the well known paradoxical result that friction depends only on
the diameter, not on the cross section of the moving body as long as one has laminar
flow. It can be understood qualitatively by considering that friction is effective on
those parts of the surface, where the relative velocity component between gas and
particle in the direction of motion drops steeply. This reduces the particle surface
active in friction to a small strip around the circumference.
For Kn ' 1, one has the transition between molecular and hydrodynamic
motion. In many practical applications, this is the regime of interest, yet unfortu-
nately the theory has no rigorous foundation there. It turned out that a velocity slip
between gas and moving particle must be taken into account, known as the Cun-
ningham correction factorCc(λ/dp). This function makes it possible to produce a
smooth transition between the molecular regime with1/b ∝ d2p and the hydrody-
namic regime with1/b ∝ dp. It should be noted that in the molecular regime,π4d2
p
is the impact cross section averaged over all directions relative to the drift velocity
V . This averaging arises because the particle performs a Brownian rotation.
Hence, the fraction of the geometrical surface that produces friction continually
decreases asKn decreases, that is as the particle “size” increases. This fraction
of the geometrical surface is active in exchanging energy and momentum from the
particle to the gas, and we call it therefore the active surface. Inner surfaces, and
surfaces in bays or cracks, or with the large particles, surfaces around the front and
back dead center of the laminar flow are passive surfaces. The active surface has
also been named “Fuchs” surface (Gaggeler et al., 1989).

2. EVALUATION OF THE SURFACE AREA 11
The diffusion coefficientD of nanoparticles is measured for instance in diffu-
sion batteries (Hinds, 1982). It is inversely proportional to the same active surface as
the mobilityb at constant temperatureT sinceD = kTb, wherek is the Boltzman
factor.
The mobility and diffusion constant and, hence, the active surface determines
the precipitation of nanoparticles in filters. The larger particles tend to be removed
by impaction on obstacles in the carrier gas flow such as hairs. This form of particles
deposition is governed by the stopping distanceλp = V Mb, whereM is the mass
of the particle. The smaller particles tend to reach the walls of a narrow channel by
diffusion according to the deposition parameterD(L/Q), whereL is the length of
the channel andQ is the volume flow rate of the carrier gas (Hinds, 1982). In the
human respiratory tract, for instance, the large particles with a highM are deposited
by impaction in the upper part, whereas the small nanoparticles penetrate to the
alveoles of the lung were they reach the walls by diffusion.
2.2. Surface area from the mass transfer coefficient.The transfer of mole-
cules of densityn from the carrier gas to the nanoparticles of densityN describes
the growth of the nanoparticles by condensation of gas phase species. If every mol-
ecule that hits the particle also sticks to it, the rate of condensation is given by
dn/dt = −KNn whereK is the mass transfer coefficient. Obviously the stick-
ing probability is usually< 1. For instance, NO2 or O3 have sticking probabilities
on carbon nanoparticles of 10−4 according to Kalberer et al. (1996) and Fendel et al.
(1995). However, electrically charged molecules are reported to transfer at least
their charge to any nanoparticle once they contact it. Reactive species such as metal
atoms will also bind to any surface. This can be used to measure the mass trans-
fer coefficientK. In the first method, ions are produced in the carrier gas and the
electrical charge transferred to the nanoparticles is measured. In the second method,
that may be applied even with very low densities of nanoparticles, the carrier gas

12 1. SURFACE SCIENCE WITH NANOSIZED PARTICLES IN A CARRIER GAS
is doped with radioactive lead atoms produced in the decay of the noble gas atom
radon. The radioactivity acquired by the nanoparticles provides a measure ofK
(Gaggeler et al., 1989). With a sticking probability of 1,dn/dt = dN+/dt, where
N+ is the density of electrically charged particles or radioactive particles depending
on the experiment. This yields
(2) N+ = N0[1− exp(−Ktn0)]
wheret is the time of interaction.n0 andN0 are the densities of the molecules or
atoms and particles att = 0. K has been determined according to Eq. (2) by letting
the gas carrying the particles interact for a timet with the ions or the radioactive lead
atoms, and observing the densityN+ of charged or radioactive particles.
The theory ofK depends again on the Knudsen numberKn. For Kn À 1,
the gas molecules flyin vacuonear the particle. The rate with which they hit the
particle depends on the averaged particle cross section and the average velocityv of
the molecules. This yields
(3) K =π
4vd2
p.
For Kn ¿ 1, the continuum theory applies and the molecules with diffusion con-
stant∆ diffuse to the particles. This yieldsK = 2π∆dp. Hence, just like the
friction coefficient1/b, K scales withd2p in the molecular regime and withdp in the
macroscopic regime.
At Kn ' 1, the adsorbing species first have to perform a classical diffusion
to the neighborhood of the particle where the gas kinetics dominate. Some authors
have estimated the distance at which this transition occurs, but it turns out, as demon-
strated by Filippov (1993), that the last step is best treated in a Monte Carlo calcula-
tion of the actual pathways of the molecules. This has the advantage over the older
approximations that gas molecule collisions close to the particle are properly taken
into account and that even complex interactions such as those occurring between a

2. EVALUATION OF THE SURFACE AREA 13
100 1000 10000
50 100 300 75020
10-4
Ag agglomerates
Ammonium sulfateLatex spheres
Mobility diameter [nm]
10-7
10-6
10-5
Atta
chm
ent c
oeff
icie
nt [
cm /s
ec]
3
1/b [(V sec)/ ]cm2
TiO agglomerates2
K b=2.616·10 [cm /(V sec )]-9 5 2·
FIGURE 1.2. Mass transfer coefficientK plotted against the
friction coefficient1/b. the mobility diameterdp as calculated
from b is also indicated. The data are adapted from Rogak et al.
(1991) and Schmidt-Ott et al. (1990).K is determined by at-
tachment of radioactive lead atoms. The carrier gas is air.
charged molecule and the image charge induced in the particle can be accounted for
in a realistic way. At any rate, again a smooth transition occurs from the macro-
scopic regime whereK ∝ dp to the molecular regime withK ∝ d2p. If it were not
for the necessity to assume a sticking probability of 1 in the measurement ofK, and
a constant mode of reflection of the gas molecules in the case of the mobilityb, one
might predict from inspecting the theory that at least near the molecular regime, both
physically very different experiments depend on the active surface. This implies that
a scaling lawKb = const should be valid independently of the particle size. This
scaling law must be independent of the actual shape as well as of the chemical nature
of the particle.

14 1. SURFACE SCIENCE WITH NANOSIZED PARTICLES IN A CARRIER GAS
Rogak et al. (1991) and Schmidt-Ott et al. (1990) measured the mobilityb of
silver agglomerates, titanium oxide particles and their agglomerates, latex spheres,
and ammonium sulphate droplets over a wide range of particle sizes and shapes. Si-
multaneously, the mass transfer coefficient was also determined using the radioactive
lead method. Figure 1.2 shows the results of this experiment.K is plotted against
the friction coefficient1/b. The mobility diameterdp is calculated fromb accord-
ing to Fuchs (1964). The data extend well over the transition from the macroscopic
to the molecular regime, and there is indeed no systematic difference between ag-
glomerates with bizarre shapes and perfectly spherical particles. There is also no
difference between metals such as Ag and perfect insulators such as latex spheres
which means that the image charge potential is not important. The constant value of
Kb = 2.616×10⁻⁹ (cm5/V s2) provides a fit to the data. Although there are fluctu-
ations of up to 50% in a single measurement, a systematic deviation for one specific
type of particle does not occur. This proves that the active surface determines bothK
andb, and that both physically very different experiments really measure the same
particle property.
Figure 1.3 shows the results of our own experiments with a large variety of ma-
terials ranging from metals to insulators, and from perfect spheres to agglomerates
and needle shaped single crystals of the amino acid L-tyrosine. The mass transfer
coefficient was determined with the positive air ions produced in a glow discharge.
Prior to admitting the carrier gas with the nanoparticles to the region containing the
ions, any previously charged nanoparticles were removed by an electrofilter. Again,
Kb = const is verified within experimental uncertainty, and no specific trend can be
seen depending on the chemistry or the geometry of the nanoparticles in the range
20¿ dp ¿180 nm. This suggests that the scaling lawKb = const is universal and
also that the concept of the active surface makes sense.

3. CHEMICAL FINGERPRINT OF THE ACTIVE SURFACE 15
Mobility diameter [nm]
10-7
10-6
10-5
Atta
chm
ent c
oeff
icie
nt [
cm /s
ec]
3
1/b [(V sec)/ ]cm2100 1000 10000
50 10020 150
MagnetiteL-TyrosinePalladiumK b=· 2.616·10 [cm /(V sec )]-9 5 2
FIGURE 1.3. Mass transfer coefficientK vs the friction coeffi-
cient1/b for Pd, Fe3O4, and L-Tyrosine particles. The mobility
diameterdp is also indicated.K is determined by attachment of
positive air ions to neutral particles. The carrier gas is air.
3. Chemical fingerprint of the active surface
The yieldY of photoelectrons with photon energies near photoelectric thresh-
old delivers a fingerprint of the physical and chemical state of the surface of con-
densed matter, and depends on optical absorption, that is on bulk properties as well.
The advantage of this oldest form of photoelectron spectroscopy is that one can make
use of powerful and innovative sources of light such as excimer lamps and pulsed
lasers opening up investigations in the time domain as well. The main disadvantage
is that threshold photoemission is still poorly understood and in many cases can be
interpreted on a phenomenological basis only.
If the sample is immersed in a gas instead of vacuum, the photoelectrons col-
lide with gas molecules, perform a random motion near the sample surface, and
eventually diffuse back to it. Therefore, no steady-state photoelectric conductivity
16 1. SURFACE SCIENCE WITH NANOSIZED PARTICLES IN A CARRIER GAS
is observed with macroscopic samples unless one applies an electric field. However,
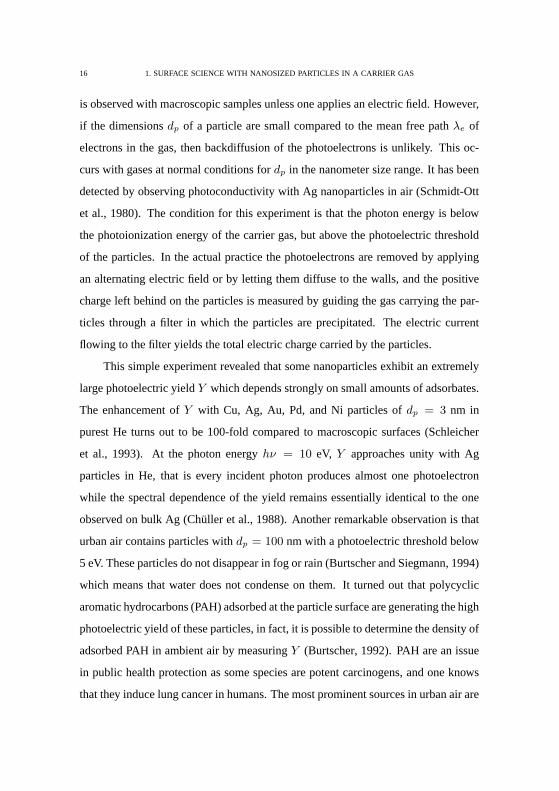
if the dimensionsdp of a particle are small compared to the mean free pathλe of
electrons in the gas, then backdiffusion of the photoelectrons is unlikely. This oc-
curs with gases at normal conditions fordp in the nanometer size range. It has been
detected by observing photoconductivity with Ag nanoparticles in air (Schmidt-Ott
et al., 1980). The condition for this experiment is that the photon energy is below
the photoionization energy of the carrier gas, but above the photoelectric threshold
of the particles. In the actual practice the photoelectrons are removed by applying
an alternating electric field or by letting them diffuse to the walls, and the positive
charge left behind on the particles is measured by guiding the gas carrying the par-
ticles through a filter in which the particles are precipitated. The electric current
flowing to the filter yields the total electric charge carried by the particles.
This simple experiment revealed that some nanoparticles exhibit an extremely
large photoelectric yieldY which depends strongly on small amounts of adsorbates.
The enhancement ofY with Cu, Ag, Au, Pd, and Ni particles ofdp = 3 nm in
purest He turns out to be 100-fold compared to macroscopic surfaces (Schleicher
et al., 1993). At the photon energyhν = 10 eV, Y approaches unity with Ag
particles in He, that is every incident photon produces almost one photoelectron
while the spectral dependence of the yield remains essentially identical to the one
observed on bulk Ag (Chuller et al., 1988). Another remarkable observation is that
urban air contains particles withdp = 100 nm with a photoelectric threshold below
5 eV. These particles do not disappear in fog or rain (Burtscher and Siegmann, 1994)
which means that water does not condense on them. It turned out that polycyclic
aromatic hydrocarbons (PAH) adsorbed at the particle surface are generating the high
photoelectric yield of these particles, in fact, it is possible to determine the density of
adsorbed PAH in ambient air by measuringY (Burtscher, 1992). PAH are an issue
in public health protection as some species are potent carcinogens, and one knows
that they induce lung cancer in humans. The most prominent sources in urban air are

3. CHEMICAL FINGERPRINT OF THE ACTIVE SURFACE 17
0 500 1000 1500 2000 2500 3000 3500
905010
0
1
2
3
4
5
6
7
8
Mobility Diameter [nm]
C-agglomeratesAg-recrystallizedAg-agglomeratesAu-recrystallized
Phot
oele
ctri
cY
ield
1/b [(V sec)/cm ]2
FIGURE 1.4. The photoelectric yieldY in arbitrary units vs the
friction coefficient1/b for various particles. The data for Ag
agglomerates, and C agglomerates are from Schmidt-Ott et al.
(1990) and Burtscher (1992) respectively, and the recrystallized
Ag and Au agglomerates are our own measurements. The mo-
bility diameter is also given.
diesel vehicles, but every incomplete combustion, be it wood or coal fire, or cigarette
smoke contributes particles with PAH adsorbed at the surface. Hence particles with
highY in ambient air invariably point to a nearby combustion source.
To do proper surface science with nanoparticles, one has to separate the effects
on the photoelectric yield stemming from physical properties such as particle size
and surface roughness from the ones induced by the chemical composition of the
bulk and at the surface. The window of photon energies useable in photoelectric
charging of nanoparticles is narrow;hν must be lower than the photoionization en-
ergy of the carrier gas but above the work functionφ of the nanoparticles. In air, one
additionally might have to stay below the photon energy inducing excessive ozone

18 1. SURFACE SCIENCE WITH NANOSIZED PARTICLES IN A CARRIER GAS
formation. Under this condition,hν ≥ φ, photoelectrons with quite low kinetic en-
ergy may be emitted from the surface of the particles into the carrier gas. However,
the photoelectron must not be reabsorbed by the particle. It is immediately clear that
the inner surfaces will not contribute to photoelectric emission. But the emission
from cracks and incisions is not as large as calculated from the geometrical area of
the surface because there is a high probability that the emerging photoelectron hits
some other part of its parent particle surface and gets reabsorbed. Therefore, it is
not surprising that the surface area accounting for the emission of charges from the
particle equals the one responsible for the absorption of ions at least in the molecular
regime where the ions fly on straight trajectories to the particle. Figure 1.4 shows
measurements of the photoelectric yieldY plotted against the friction coefficient1/b
which is the active surface. The data are for carbon agglomerates (Burtscher, 1992),
silver agglomerates (Schmidt-Ott et al., 1990), gold agglomerates, and recrystallized
Ag and Au agglomerates. We see that indeed there is a linear relationship between
1/b andY , but the constant of proportionality does depend on the material and on
the photon energy, hence, contains the desired chemical fingerprint of the nanopar-
ticle. The physical parameters of particle shape and size can thus be eliminated by
a measurement of the mobilityb or equivalently a measurement of the mass trans-
fer coefficientK. This is extremely helpful considering the bizarre shapes of the
agglomerates shown in Figure 1.1. One then has a new scaling lawY b = const or
equivalentlyY/K = const. These laws are important as they show that the chem-
ical fingerprint of the particles may be obtained even with a distribution of particle
sizesN(dp), and without knowledge of the number density. The total photoelectric
charge PC carried by the ensemble of particles is
(4) PC ∝Z ∞
0
Y Nddp,
while the total charge by ion attachment IC is
(5) IC ∝Z ∞
0
KNddp.
3. CHEMICAL FINGERPRINT OF THE ACTIVE SURFACE 19
Equation (5) follows from Eq. (2) if the product of ion densityn0 and the timet
spent in the ion charger is chosen to be low so thatexp(−Ktn0) ' 1−Ktn0. With
Y ∝ 1/b andK ∝ 1/b one obtains
(6)PC
IC= CF.
CF is a constant that depends only on the photon energy used in PC and on the
chemistry of bulk and surface of the particles, hence, it delivers “on-line” the de-
sired chemical fingerprint of the ensemble of particlesN(dp) without doing any size
analysis and without counting the particles. This has been applied for instance to dis-
tinguish particles of different origin in automotive exhaust, namely the carbonaceous
particles formed in incomplete combustion of the gasoline from the mineralic parti-
cles formed out of fuel additives (Matter et al., 1999). This is of importance, as the
reduction of carbonaceous particle emission is the responsibility of the engine man-
ufacturer, while the particles from contaminants of the fuel are in the responsibility
of the gasoline producers. Furthermore, even carbonaceous particles from different
types of combustion can be distinguished. This is helpful as particles from differ-
ent combustions carry a different blend of chemicals and therefore pose a different
health risk. It turns out, for instance, that a flickering candle produces particles with
high CF, while cigarette smoke exhibits an almost ten times lower CF (Siegmann
et al., 1999). Fresh diesel particles are identified readily by their specific CF which
is the same all over the world. Diesel particles are the most prominent part of partic-
ulate air pollution in major cities like Tokyo and Paris (Zhiqiang et al., 2000). It is
obvious that such techniques, amongst many other applications, will provide a basis
for quantifying the health risk imposed by particulate air pollution.
As an example for the observation of the dynamics of the active surface we
discuss the measurement of perylene C20H12 desorption from graphite particles
(Hueglin et al., 1997). An excimer laser delivers pulses of photons of 6.42 eV en-
ergy, the pulse length is 20 ns. The flat perylene molecule containing five aromatic
20 1. SURFACE SCIENCE WITH NANOSIZED PARTICLES IN A CARRIER GAS
rings was chosen because it stands as a typical representative of the PAH formed in
combustion. The well-known carcinogen Benzo(a)pyrene is built with five aromatic
rings as well and should therefore exhibit very similar adsorption/desorption kinet-
ics. In this experiment, the carbon particles are produced in a carrier gas at ambient
temperature in which a partial pressure of perylene is maintained. The perylene
adsorbs on the particles until an equilibrium between adsorption and desorption is
reached corresponding to the density of perylene moleculesnCH in the carrier gas
and to the number of adsorption sites on the particle. Subsequently a small volume
of the gas carrying the perylene loaded particles is transported into the hot carrier gas
with nCH = 0 at the temperatureT > T0. Now perylene will start to desorb from the
particles. The desorption of perylene induces a decrease of the photoelectric yield.
After a preset time, the UV laser is fired, and the time dependence of the decrease of
Y can be observed by measuring the photoelectric charge on the particles. Figure 1.5
shows the time dependence of the desorption for two temperatures of the carrier gas.
From these measurements, one obtains the adsorption enthalpy of perylene on the
particle. The experiment is analog to thermal desorption studiesin vacuo, one of the
most fruitful techniques in surface science.
Besides source attribution of combustion aerosols (Siegmann et al., 1999; Zhi-
qiang et al., 2000) and disclosing their surface dynamics as demonstrated in Fig-
ure 1.5, photoelectric charging of nanoparticles has also been used to study catalytic
reaction on soot particles (Kasper et al., 1999b). Furthermore, circular dichroism
in the photoionization of nanoparticles built with chiral molecules has also been
detected (Paul and Siegmann, 1999). This makes it possible to distinguish nanopar-
ticles of biological origin from particles synthesized in nonchiral chemical reactions.
4. Theoretical background of the scaling laws
Scaling laws are important in physics as they allow one to generalize the com-
plex phenomena observed for instance in phase transitions. Schmidt-Ott et al. (1990)

4. THEORETICAL BACKGROUND OF THE SCALING LAWS 21
0
0.5
1.0
0 200 400 600 800 10000
0.5
1.0
Time [ms]
Phot
oem
issi
on [
a.u.
]
T=100.5°C, t =43msd
T=73.2°C, t =307msd
FIGURE 1.5. Desorption of perylene from carbon agglomer-
ates of mobility diameterdp = 25 nm at T = 72.3◦C and
T = 100.5◦C. The dotted lines are exponentials with the time
constantstd = 307 ms andtd = 43 ms respectively, from
Hueglin et al. (1997).
have described scaling laws for mass, surface, and mobility radius of fractal-like ag-
glomerated particles; the term “exposed” surface is used in this work instead of ac-
tive surface employed here. We have given experimental evidence that the following
more restricted scaling laws are universal extending to spherical nanoparticles and
restructured agglomerates as well. These general scaling laws on changing the par-
ticle size are:Kb = const,Y b = const, andKD = const, whereb is the mobility,
Y is the photoelectric yield for threshold photoelectrons,D is the diffusion constant
of the particles, andK is the mass transfer coefficient. We have shown thatK may
22 1. SURFACE SCIENCE WITH NANOSIZED PARTICLES IN A CARRIER GAS
also be determined by simply measuring the electrical charge acquired by neutral
particles on adding ions to the carrier gas. We will now discuss some theoretical
implications.
The fact that the scaling lawKb = const is independent on whether the particle
is a metal or an insulator demonstrates that the role played by the image force in the
approach of an ion is negligible. For conducting particles the image charge potential
is largest. The potential energy of ions in an induced image field of a spherical
metallic particle with radius a is
(7) U =1
4πε0
e2a3
2r2(r2 − a2),
wheree is the elementary charge andr the distance from the particle center. The
image charge increases the probability of charging by bending the trajectories of
passing ions towards the particle. This is estimated to be significant ifU becomes
comparable to the average ion kinetic energyEk = 3/2kT at distances from the
particle surface of the order of the particle radius. For example, equatingU andEk
at r2 = 2a2 one obtains an estimate for the critical particle size below which the
image charge potential should become important
(8) acr =1
4πε0
e2
6κT.
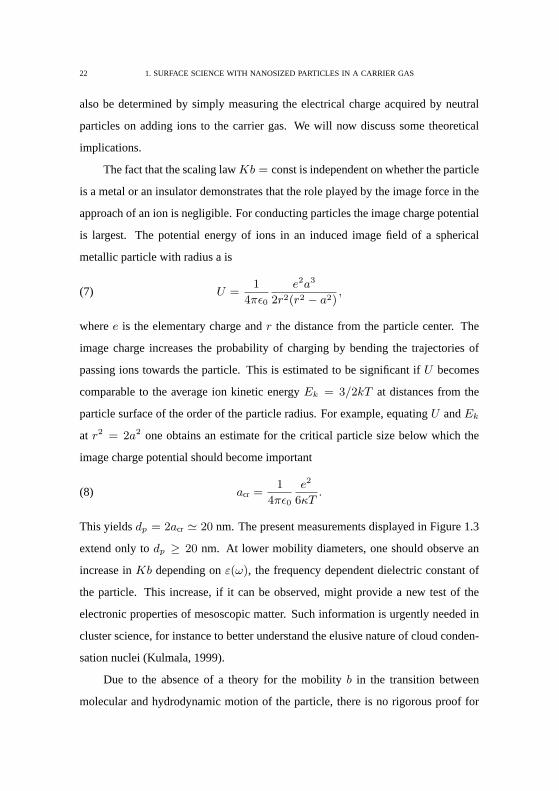
This yieldsdp = 2acr ' 20 nm. The present measurements displayed in Figure 1.3
extend only todp ≥ 20 nm. At lower mobility diameters, one should observe an
increase inKb depending onε(ω), the frequency dependent dielectric constant of
the particle. This increase, if it can be observed, might provide a new test of the
electronic properties of mesoscopic matter. Such information is urgently needed in
cluster science, for instance to better understand the elusive nature of cloud conden-
sation nuclei (Kulmala, 1999).
Due to the absence of a theory for the mobilityb in the transition between
molecular and hydrodynamic motion of the particle, there is no rigorous proof for

4. THEORETICAL BACKGROUND OF THE SCALING LAWS 23
Kb = const. However, formulae that are tested empirically exist for bothK and
b (Williams and Loyalka, 1991; Fuchs, 1964). Sherman (1963) found that existing
experimental data can be adequately described by the empirical formula
(9)q
qc=
1
1 + qc/qf,
whereq, qc, andqf are the transfer rates in the transition, continuum, and free–
molecular regime, respectively. Correspondingly, for the mass transfer coefficient
we have (Williams and Loyalka, 1991)
(10)K
Kc=
1
1 +√
πKn,
whereKc is the continuum–regime mass transfer coefficient.
Similarly, using the Cunningham correction factor (Williams and Loyalka, 1991)
for the particle mobility we obtain
(11)b
bc= 1 + Kn [A1 + A2 exp(−A3/Kn)] ,
wherebc is the particle mobility in the continuum limit and the values of the con-
stants can be taken asA1 = 1.257, A2 = 0.4 andA3 = 1.1. The last two equations
yield
(12) Kb = Kcbc1 + Kn [A1 + A2 exp(−A3/Kn)]
1 + π1/2.
This equation predicts that the productKb can vary only slightly, within 14%, as
Kn increases from 0 to infinity. The deviations are largest forKn = 1. This region
should be tested carefully to find out whether this deviation is real or an artifact of
the interpolation schemes. It also might be possible that with an inert carrier gas and
nonpassivated surfaces, the scaling breaks down due to different reflection modes of
the carrier gas molecules at the particle surface. PlottingKb is the most obvious
way to detect such an effect if it exists.
The scaling laws containing the photoelectric yieldY , namelyY b = const,
Y/K = const, andY D = const, so far have only been tested for particles with

24 1. SURFACE SCIENCE WITH NANOSIZED PARTICLES IN A CARRIER GAS
dp < 100 nm. For larger particles withdp > 200 nm, the onset of classical diffusion
leads to backdiffusion of the photoelectric charges to the particle. According to
Filippov et al. (1993), the probabilitype of liberation of a photoelectric charge is
given by
(13) pe =
�1 +
3
4Kne
�−1
.
Kne = λe/dp is the Knudsen number for the free electrons withλe the mean
free path of low energy electrons in the carrier gas. In air it takes many collisions
before the free electron attaches itself to O2 and produces the negative ion O−2 . In
N2 gas, no negative ions are formed andλe = 670 nm at normal conditions. It is
assumed that this value forλe also applies to air. Equation (8) yields thenpe ' 0.5
for dp = 500 nm, whilepe = 1 for Kne À 1 (small particles) andpe = 0 for
Kne ¿ 1 (large particles in the micrometer range). The photoelectric yield of a
particle is given byY = (π/4)d2pype wherey is the yield per unit area of the active
surface. The effective specific yieldype decreases as the particle increases but at a
different rate compared to the active surface responsible for the friction coefficient
1/b. It is therefore not expected that the scaling laws containingY are valid for larger
particles approaching the micrometer range. Yet this still waits detailed experimental
and theoretical investigation.
5. Conclusions
Surface characteristics of mesoscopic condensed matter or nanoparticles can be
evaluated while the particles are suspended in a carrier gas. There are three physi-
cally very different experiments to determine the area of the active surface, namely
the measurement of the mass transfer or attachment coefficientK, the mobility b,
and the diffusion constantD. Combining one of these experiments, preferably the
attachment of positive gas ions to the particles with photoelectric charging makes it
5. CONCLUSIONS 25
possible to obtain a chemical fingerprint of the particles without knowing their num-
ber or their sizes. It amounts to separating the effects of the physical shape and size
of the sometimes bizarre agglomerates from their chemistry. This arises because ion
attachment determines the total area of the active surface of the ensemble of particles
while photoelectric emission of low energy electrons is also proportional to the same
active surface but additionally contains a factor depending on the chemical nature of
the particles. By choosing the appropriate light source, one can be highly sensitive
to a specific adsorbate/particle system. Using pulsed lasers, it will be possible to
observe the surface dynamics down to the femtosecond time scale.
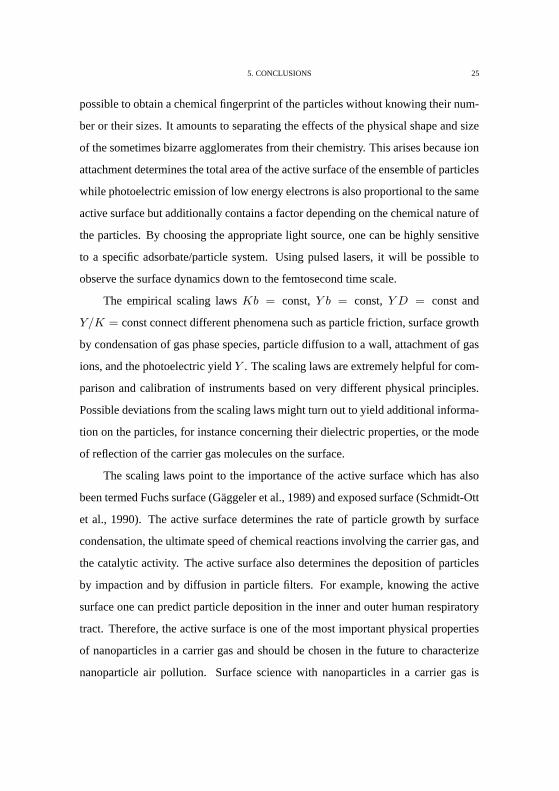
The empirical scaling lawsKb = const,Y b = const,Y D = const and
Y/K = const connect different phenomena such as particle friction, surface growth
by condensation of gas phase species, particle diffusion to a wall, attachment of gas
ions, and the photoelectric yieldY . The scaling laws are extremely helpful for com-
parison and calibration of instruments based on very different physical principles.
Possible deviations from the scaling laws might turn out to yield additional informa-
tion on the particles, for instance concerning their dielectric properties, or the mode
of reflection of the carrier gas molecules on the surface.
The scaling laws point to the importance of the active surface which has also
been termed Fuchs surface (Gaggeler et al., 1989) and exposed surface (Schmidt-Ott
et al., 1990). The active surface determines the rate of particle growth by surface
condensation, the ultimate speed of chemical reactions involving the carrier gas, and
the catalytic activity. The active surface also determines the deposition of particles
by impaction and by diffusion in particle filters. For example, knowing the active
surface one can predict particle deposition in the inner and outer human respiratory
tract. Therefore, the active surface is one of the most important physical properties
of nanoparticles in a carrier gas and should be chosen in the future to characterize
nanoparticle air pollution. Surface science with nanoparticles in a carrier gas is

26 1. SURFACE SCIENCE WITH NANOSIZED PARTICLES IN A CARRIER GAS
a young field with excellent chances for further growth and numerous important
applications.
CHAPTER 2
Effects of second order processes
in aerosol monitoring
ABSTRACT. We present a general-purpose mathematical model for pollution con-
centration studies. The model is an approximate solution for the time dependence of
size distribution that takes into account processes like aerosol coagulation and con-
densation among others. Our model is validated by representative experiments us-
ing standard aerosol monitoring devices that measure light scattering, particle cross
section, particle bound polycyclic aromatic hydrocarbons (PPAH) and number con-
centration, showing an excellent agreement with the experimental data. The results
demonstrate that aerosol coagulation has to be taken into account when monitoring
aerosol particles. We also show that the simultaneous application of different sensors
reveals new information about the physical and chemical properties of the aerosol.
∗Published in: A. Keller and K. Siegmann, J. Aerosol Sci. (2001) in print.
27

28 2. EFFECTS OF SECOND ORDER PROCESSES IN AEROSOL MONITORING
1. Introduction
It has been shown that a mass balance model used in combination with porta-
ble aerosol sensors is suitable for estimations of indoor particulate concentrations
and cigarette emission rates (Ott et al., 1992; Klepeis et al., 1996; Brauer et al.,
2000). More specific, such a method has been used to estimate the indoor particle-
bound polycyclic aromatic hydrocarbons (PPAH) concentration coming from traffic
(Dubowsky et al., 1999), environmental tobacco smoke (Ott et al., 1994) and other
indoor combustion sources (Ott and Klepeis, 1995). Yet, the method of these studies
is designed to be used when measuring aerosol mass with a piezoelectric balance
or when monitoring ambient gas concentration and therefore it just accounts for the
indoor-outdoor exchange rate, particle deposition rate and other properties which
involve first order processes in a mass balance differential equation. Nevertheless,
when using sensors that measure properties other than aerosol mass, as is the case
of number concentration, cross section, photoionization, or light scattering, or when
measuring aerosol mass indirectly (i.e. when using most portable-sensors) second
order processes, such as aerosol coagulation, must be considered.
In this paper we derive a model based on the general dynamic equation (GDE)
for aerosol samples that exhibit a narrow size distribution. The model is valid for
studies of number concentration, particle cross section, volume, total light scatter-
ing, and other properties which can be expressed in terms of moments of the size
distribution. A comparison between the model derived from the GDE and mass
balance model will also be presented. The model will be validated with our exper-
imental data obtained from aerosol devices that work on different principles and as
an application example the total PPAH emission of a cigarette will be calculated. It
will also be shown that the comparison of different sensors reveals more information
on physical and chemical properties of the aerosol.
2. THEORY 29
2. Theory
2.1. General Dynamic Equation. The particle size distribution of a polydis-
perse aerosol is described by the general dynamic equation (GDE) (Friedlander,
2000). In the case of a well mixed room of volumeV with a air flow rateω, and an
indoor source producing aerosol at a rateg, the GDE can be written as
dn(v, t)
dt=− ∂{I(v) · n(v, t)}
∂v+ 1
2
Z v
0
β(v − v, v)n(v − v, t)n(v, t)dv
− n(v, t)
Z ∞
o
β(v, v)n(v, t)dv − d(v)
Vn(v, t) +
g(v, t)
V(14)
+ω
V[x0(v, t)− n(v, t)] ,
wheren(v, t) is the particles size distribution at a timet, v is the particle volume,
I(v) is the single-particle growth rate by condensation,β(v, v) is the collision ker-
nel,d(v) is the rate of particle loss due to diffusion to the walls, andx0(v, t) is the
outdoor aerosol concentration.
Now, let us look at the physical interpretation of some important moments of
the size distribution. Thekth moment of the size distribution functionn(v, t) is
defined as
(15) Mk(t) =
Z ∞
0
vkn(v, t)dv,
wherek is an arbitrary real number. The zeroth moment,
(16) M0(t) =
Z ∞
0
n(v, t)dv = N(t)
is the total concentration of particles and the first moment is the total volume of the
particles per unit volume of gas:
(17) M1(t) =
Z ∞
0
vn(v, t)dv = φ(t)
whereφ is the volume fraction material in the fluid.
Other physical properties can be expressed by different moments. Since for
very small particles the light scattering follows the Rayleigh model, the intensity
30 2. EFFECTS OF SECOND ORDER PROCESSES IN AEROSOL MONITORING
of the scattered light is proportional tod6p and the total Rayleigh scattering can be
written as
(18) bscat∝ M2 (small particles).
On the other extreme, the scattering intensity in the optical range corresponds to
I ∝ d2p, and its total intensity can be written as
(19) bscat∝ M2/3 (large particles).
Similarly, if we assume that the surface of a particle isS ∝ d2p and its volume
v ∝ d3p, then the total aerosol surface per unit volume gasA is given by
(20) A ∝ M2/3.
Therefore, a population balance equation written in terms of the GDE for differ-
ent momentsMk can be used to study the changes in number concentration (k = 0),
particle cross section (k = 2/3), mass and volume (k = 1), and light scattering
(2/3 ≤ k ≤ 2), among others. Additionally, such an equation can even be used in
the case of aerosols composed of agglomerates with fractal dimensionDf by taking
into account the power law relationshipv ∝ dDfp .
2.2. Population balance equation.By multiplying equation (14) byvk and
integrating overv we obtain the change in moment:
∂
∂t(Mk) =k
Z ∞
0
vk−1I(v)n(v, t)dv − 1
V
Z ∞
0
vk[d(v) + ω]n(v, t)dv
+1
2
Z ∞
0
Z ∞
0
[(v + v)k − vk − vk]β(v, v)n(v, t)n(v, t)dvdv
+1
V
Z ∞
0
vkg(v, t)dv +1
V
Z ∞
0
vkx0(v, t)dv,(21)
Equation (21) describes the population balance for the different moments. It is highly
non-linear but it may be rewritten in a simplified form assuming a nearly monodis-
perse system. For an aerosol with narrow size distribution and average volumev we

2. THEORY 31
can writeMk = vkN(t), whereN(t) is the total number of aerosol particles. Thus,
equation (21) becomes
(22)∂
∂t(Mk) =
ω
V[x0,k(t)−Mk]+
gk(t)
V−�
d
V− kI
v
�Mk− 1− 2k−1
vkKM2
k ,
wheregk(t) = vkg(t, v) andx0,k(t) = vkx0(v, t) are the contributions from the
indoor-source and outdoor-concentration to thekth moment andK is the coagulation
coefficient.
We can notice immediately the similarity between equation (22) and the mass
balance equation. The first term on the right hand side of the equation is the change
in thekth moment due to air exchange, the second is the indoor source contribution,
and the third is the change in moment due to sinks (diffusion losses) and sources
(condensation or particle nucleation) inside the chamber. We also notice that the
coagulation contributes as a quadratic term for the momentsk 6= 1. This would
yield an error if we try to describe properties other than mass and volume by using
the mass balance model.
Now, let us define the first order moment change rate as
(23) βk ≡ d
V− kI
v
and the second order change rate as
(24) Kk ≡ 2− 2k
vkK.
Thus, equation (22) becomes
(25)∂
∂t(Mk) =
ω
V[x0,k(t)−Mk] +
gk(t)
V− βkMk − 1
2KkM2
k ,
In the case of the zeroth moment (number concentration)K0 = K is the actual co-
agulation coefficient andβ0 = d/V is reduced to the particle loss by diffusion since
condensation has no influence in number concentration. Fork = 1, M1 represents
total mass or volume, andK1 = 0. Finally, for momentsMk>1, as in the case of

32 2. EFFECTS OF SECOND ORDER PROCESSES IN AEROSOL MONITORING
Rayleigh scattering (k = 2), the coagulation would have a positive contribution to
the total moment sinceKk < 0.
If, for simplicity, we assume a constant outdoor concentrationx0,k(t) = x0,k
and an indoor source with constant strength over timegk(t) = gk we can solve
eqn. (25) as
(26)
Mk(t) =
�Γ + βk + ω
V
�e−Γ(t−t1) +
�Γ− (βk + ω
V)� �KkMk(t1)+Γ+βk+ ω
VKkMk(t1)−Γ+βk+ ω
V
�Kk
h�KkMk(t1)+Γ+βk+ ω
VKkMk(t1)−Γ+βk+ ω
V
�− e−Γ(t−t1)
i ,
which is the indoor aerosol concentration at a given timet > t1, Mk(t1) denotes
the value of thekth moment at timet1, and
(27) Γ ≡ �(βk + ω/V )2 + 2Kk(gk + ωx0,k)/V�1/2
.
We shall now analyze some specific cases of equation (26) and validate it
against the first order mass balance model. Lets assume that the outdoor concen-
tration x0,k = 0, which is valid for a controlled experiment in an isolated indoor
space. Simplifying, we can add together the first coefficients and write them as
Φ = βk + ω/V (also known as the effective air exchange rate). We can distinguish
now between two cases: a production process with a source emitting aerosol at a
constant rategk for a time intervalt1 ≤ t ≤ t2, and a decay process wheregk = 0
for a timet > t2.
During the emission eventt1 ≤ t ≤ t2 andΓ =�Φ2 + 2Kkgk/V
�1/2. At
this point, we can compare our result with the linear model by setting the value of
Kk = 0, obtaining
(28) Mk,lin(t1 ≤ t ≤ t2) =gk
V Φ
h1− e−Φ(t−t1)
i+ Mk(t1)e
−Φ(t−t1),
which is the expected simple exponential expression for the mass balance model (Ott
et al., 1992).

3. METHODS 33
For the decay processt > t2, gk = 0, A = Φ, and eq. (26) becomes
(29) Mk(t > t2) =
��Kk
2Φ+
1
Mk(t2)
�eΦ(t−t2) − Kk
2Φ
�−1
.
Equation (29) has a simpler form than our general solution (equation (26)), and
describes the concentration decay in the case when no indoor sources are present.
Here again by making the quadratic term coefficientKk = 0, we obtain the simple
exponential decay that involves a linear model
(30) Mk,lin(t > t2) = Mk(t2)e−Φ(t−t2).
Note that by using a sink coefficientKk 6= 0 the decay would yield a different
result than in the case of the simple exponential. This is especially important for our
example of source strength determination, where we analyze the decay and calculate
the values forΦ andKk to estimate the concentration in the room at the time when
the source was extinguished. It also plays an important role when measuring in
places where the air is not mixed fast because we would have to wait for the moment
when a stable condition is reached.
3. Methods
We performed a series of indoor experiments to monitor several particle proper-
ties from aerosol coming from sidestream cigarette smoke. The experimental setup
was based on the one suggested for chamber measurements by Ott et al. (1992) and
Brauer et al. (2000). Four cigarettes were set alight simultaneously by a smoking
machine (Filtrona, model 302) and left to burn by themselves (smolder smoked).
After burning, they were put out by dousing them into water. The experiments were
done inside a 77 m3 room with two ventilators placed inside it to ensure a fast mix-
ing of the cigarette smoke. During and after the burning process, sensors based on
different particle properties were acquiring data every 10 seconds. The flow rate of
the sensors was chosen to be 1.5 l/min and their exhaust was filtered and released
again into the room.

34 2. EFFECTS OF SECOND ORDER PROCESSES IN AEROSOL MONITORING
On another set of experiments, we sampled the aerosol in the mainstream smoke
by setting the smoking machine to burn the cigarettes performing puffs every 60 s.
The mainstream smoke was collected into filters and the filtered air was released into
the room. The filters were then analyzed to determine the amount of PAH on them
by means of a commercial Gas Chromatography Mass Spectroscopy (GCMS).
In both cases, the same commercially available filter cigarettes were used. On
average each cigarette burned for about 8 minutes when smoked by the machine and
11 minutes when let to smolder.
3.1. PPAH. A portable PPAH sensor (EcoChem PAS 2000 CE) was used to
measure the PPAH concentration during the experiments. The photoelectric aerosol
sensor (PAS) uses an excimer lamp to expose the aerosol flow to UV radiation with
an energyhν below the threshold for ionization of the gas molecules but above the
photoelectric threshold of the particles (i.e. photoelectrons are emitted from the par-
ticle). The emitted photoelectric current is determined by collecting the positively
charged particles on a filter and determining the current to ground potential. The
wavelength of the excimer lamp is chosen in such a way that the photoelectric yield
is mainly governed by the yield coming from aerosol particles which have PAH mo-
lecules adsorbed on their surface (Kasper et al., 1999a). The resulting photoelectric
current establishes in fact a signal which is proportional to the mass concentration
of PPAH (Burtscher and Siegmann, 1994).
3.1.1. Calibration of PPAH sensors.The Ecochem PAS 2000 CE sensors are
sold with a calibration for traffic combustion aerosols. Since these sensors do not
measure PAH mass directly, a new calibration has to be done when changing the
aerosol source since aerosols comming from different sources tend to have a different
PPAH composition. In our case, the calibration was done for particles emitted from
the combustion of the test cigarettes.

3. METHODS 35
In the same room used for the indoor measurements (a well ventilated and
mixed 77 m3 room), the test cigarettes were burned using the smolder method. Four
to six cigarettes were burned simultaneously (average burning time 11 min.) waiting
between 30 and 60 minutes before the next set of cigarettes was burned in order to
avoid a saturation of the sensor. A total of 70 cigarettes were burned in a 13 hours
period. During this time the aerosol concentration was monitored by the PAS 2000
CE sensor. Additionally a filter was sampling the aerosol in the room at a flow rate
of .84 m3/h in order to do a GCMS and compare the sample amount of PAH with
the integrated signal obtained from the PPAH sensor.
3.2. Diffusion Charging. An Ecochem DC 2000 CE diffusion charging sensor
was also used in the indoor experiments. This sensor works by producing positive
charged ions by a glow discharge formed in the neighborhood of a thin wire. The
ions are repelled by the wire which is at positive potential and travel to the space
containing the particles. During this, the ions have a probability of attaching to
a particle. If this happens the particle carries the charge. The gas containing the
particles is then sampled in a filter where the current flowing from the filter to ground
potential is measured. For very small particles, the probability of one of the ions
hitting the surface of the particle and sticking to it is proportional to the cross section
of the particle. Hence, this instrument measures the active surface of small particles
(Keller et al., 2001) without being sensitive to the chemistry (Qian et al., 2000).
3.3. Light scattering. We used a TSI Dusttrak (model 8520) which is a porta-
ble, battery operated instrument that measures the scattering of infrared light coming
from a GaAs-laser-diode at an angle of 90◦. It has an impactor at the sample entrance
that removes all particles above 10µm, and gives a value of PM10 mass per m3. The
calibration of the instrument depends on the particle size distribution, and therefore
on the particle source. It is factory set to relate the intensity of the scattered light to

36 2. EFFECTS OF SECOND ORDER PROCESSES IN AEROSOL MONITORING
the particle mass concentration of a standard aerosol sample (A1 test dust, previously
know as “Arizona dust”) which exhibits a wide size distribution.
3.4. Number Concentration. To estimate the number concentration of aerosol
particles, a continuous-flow Ultrafine Condensation Particle Counter (TSI CPC mo-
del 3025A) was used. The CPC is a device specially designed for detection of parti-
cles with a size smaller than the wavelength of visible light (down to 3 nm). Particles
that enter the measurement device serve as condensation nuclei for oversaturated
butanol vapor and grow. The butanol covered particles are then big enough to be
counted individually by means of light scattering.
4. Results and Discussion
4.1. Indoor measurements.Figure 2.1 shows the aerosol concentration, pro-
duced by setting alight four cigarettes, as measured by the TSI Dusttrak, Ecochem
DC 2000 CE, Ecochem PAS 2000 CE and TSI CPC 3025A. The cigarettes burned
until the point where the concentration reaches a maximum and were then put out.
We calculated the dashed lines by fitting the model to the decay part, using equa-
tion (29) and the Levenberg-Marquardt algorithm. The first part was then plotted
taking the fitted values, the initial indoor concentration and the cigarette burn time
as parameters to calculate the emission rategk. For this, the Newton method was
employed. As can be seen in the figure, the model shows an excellent agreement
with the experimental data.
A close examination of figure 2.1 reveals the presence of an upward curvature
in the decay part of all the plots when using a semi-logarithmic scale. This points
out that accounting for the second order terms is indeed important when using those
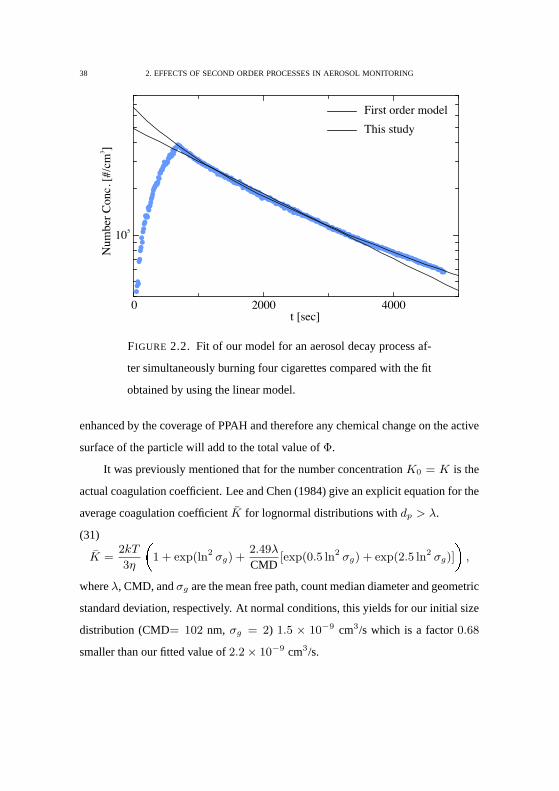
devices. The effect of this curvature is highlighted in both, figure 2.2 and table 2.1,
where a comparison with a fit to the first order model is shown. As can be seen
from the calculated residual values (table 2.1), the curvature implies that by fitting
the data to a model that includes only up to the first order coefficients we would

4. RESULTS AND DISCUSSION 37
0 2000 4000101
102
0 2000 4000104
105
0 2000 4000102
103
0 2000 400010 -1
100P
PA
H [
ng
/m ]3
Num
ber
Conc.
[#/c
m]
3
LS
[m
g/m
]3
DC
[S
.U./
m]
3
t [sec] t [sec]
FIGURE 2.1. Semi-logarithmic plot of the aerosol concentra-
tion produced by simultaneously burning four cigarettes, as
measured by a Dusttrak (Light Scattering, LS), DC 2000 CE
(Diffusion Charging, DC, in surface units per m3), PAS 2000
CE (PPAH) and CPC 3025A (number concentration), compared
to the concentration calculated by the model (dashed lines). The
model was fitted to the decay part of the curves and the results
where used to calculate the emission curve.
be underestimating the real values. This difference will even be higher for data
projected outside the fitting interval (figure 2.2). A similar measurement for an inert
gas or with a device that measures aerosol mass directly, like a piezobalance, should
not give this curvature since coagulation would not have any effect andKk = 0.
Table 2.2 shows the different values obtained when fitting the experimental
data. Specially notable is the case of the Ecochem PAS 2000 CE device, where the
effective air exchange rateΦ is about twice as big as the one of the other sensors, this
difference may be due to the fact that the photoionization of the particles is strongly
38 2. EFFECTS OF SECOND ORDER PROCESSES IN AEROSOL MONITORING
0 2000 4000
105
t [sec]
Num
ber
Conc.
[#/c
m]
3
First order model
This study
FIGURE 2.2. Fit of our model for an aerosol decay process af-
ter simultaneously burning four cigarettes compared with the fit
obtained by using the linear model.
enhanced by the coverage of PPAH and therefore any chemical change on the active
surface of the particle will add to the total value ofΦ.
It was previously mentioned that for the number concentrationK0 = K is the
actual coagulation coefficient. Lee and Chen (1984) give an explicit equation for the
average coagulation coefficientK for lognormal distributions withdp > λ.
(31)
K =2kT
3η
�1 + exp(ln2 σg) +
2.49λ
CMD[exp(0.5 ln2 σg) + exp(2.5 ln2 σg)]
�,
whereλ, CMD, andσg are the mean free path, count median diameter and geometric
standard deviation, respectively. At normal conditions, this yields for our initial size
distribution (CMD= 102 nm, σg = 2) 1.5 × 10⁻⁹ cm3/s which is a factor0.68
smaller than our fitted value of2.2× 10−9 cm3/s.

4. RESULTS AND DISCUSSION 39
TABLE 2.1. Summary of the residual values obtained by using
our model and the linear model.
Dusttrak DC 2000 CE PAS 2000 CE CPC 3025A
in absolut valuea
av diff 0.19× 10⁻⁴ −0.17× 100 −0.33× 10⁻¹ 0.07× 10²
av diff lin −8.55× 10⁻⁴ −1.47× 100 −2.97× 10⁻¹ −9.00× 10²
σ 0.71× 10⁻² 1.73× 101 3.06× 100 2.22× 10³
σlin 1.33× 10⁻² 2.77× 101 3.32× 100 7.57× 10³
in percentb
av diff 0.03 −0.06 0.19 0.05
av diff lin −0.65 −0.41 −1.50 −2.26
σ 1.07 1.42 7.51 1.16
σlin 2.79 2.37 7.88 6.4
a The residuals values where calculated as: residual= xobs−xmodel.b The residual values in percent, where
calculated as: residual= 100× (xobs− xmodel)/xobs.
Abbreviations: av, average; diff, difference; lin, linear model; obs, observed.

40 2. EFFECTS OF SECOND ORDER PROCESSES IN AEROSOL MONITORING
TA
BL
E2
.2.
Com
paris
onbe
twee
nth
epa
ram
eter
sfo
und
for
the
first
and
seco
ndor
der
deca
yra
teco
effic
ient
s
and
the
obse
rved
peak
conc
entr
atio
nof
one
ofou
rin
door
mea
sure
men
tsfo
rae
roso
ldev
ices
usin
gdi
ffere
nt
mea
surin
gpr
inci
ples
Dus
ttrak
DC
2000
CE
PA
S20
00C
EC
PC
3025
A
Uni
ts[m
g/m
3]
[S.U
./m3]c
[ng/
m3]
[#/c
m3]
Pro
pert
yLi
ghts
catte
ring
Act
ive
Sur
face
Act
ive
Sur
face
,N
umbe
r
Pho
toio
niza
tion
Con
cent
ratio
n
Φa
2.6
0(±
0.0
3)×
10−
43.5
7(±
0.0
4)×
10−
45.7
4(±
0.0
8)×
10−
42.8
5(±
0.0
3)×
10−
4
Kb k
3.9
4(±
0.1
2)×
10−
47.6
1(±
0.4
3)×
10−
81.2
5(±
0.1
4)×
10−
72.2
1(±
0.0
3)×
10−
9
Pea
k1.0
29
(±0.0
02)×
100
2.9
23(±
0.0
04)×
103
2.2
36
(±0.0
08)×
102
3.8
01
(±0.0
05)×
105
1 2K
k×P
eak
2.0×
10−
41.1×
10−
51.4×
10−
54.2×
10−
4
aΦ
inai
rch
ange
spe
rse
cond
.b
Kk
in[1
/Mom
entu
nits×
sec]
.cS
.U.s
tand
sfo
rsu
rfac
eun
its.
4. RESULTS AND DISCUSSION 41
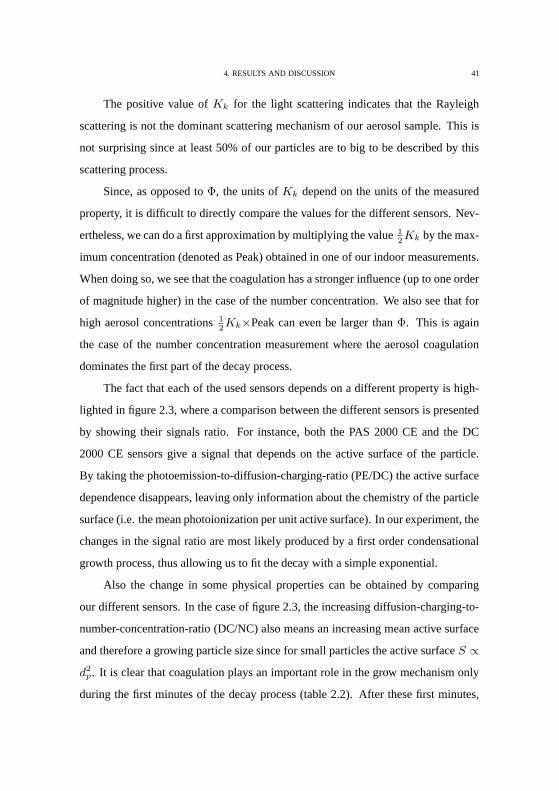
The positive value ofKk for the light scattering indicates that the Rayleigh
scattering is not the dominant scattering mechanism of our aerosol sample. This is
not surprising since at least 50% of our particles are to big to be described by this
scattering process.
Since, as opposed toΦ, the units ofKk depend on the units of the measured
property, it is difficult to directly compare the values for the different sensors. Nev-
ertheless, we can do a first approximation by multiplying the value12Kk by the max-
imum concentration (denoted as Peak) obtained in one of our indoor measurements.
When doing so, we see that the coagulation has a stronger influence (up to one order
of magnitude higher) in the case of the number concentration. We also see that for
high aerosol concentrations12Kk×Peak can even be larger thanΦ. This is again
the case of the number concentration measurement where the aerosol coagulation
dominates the first part of the decay process.
The fact that each of the used sensors depends on a different property is high-
lighted in figure 2.3, where a comparison between the different sensors is presented
by showing their signals ratio. For instance, both the PAS 2000 CE and the DC
2000 CE sensors give a signal that depends on the active surface of the particle.
By taking the photoemission-to-diffusion-charging-ratio (PE/DC) the active surface
dependence disappears, leaving only information about the chemistry of the particle
surface (i.e. the mean photoionization per unit active surface). In our experiment, the
changes in the signal ratio are most likely produced by a first order condensational
growth process, thus allowing us to fit the decay with a simple exponential.
Also the change in some physical properties can be obtained by comparing
our different sensors. In the case of figure 2.3, the increasing diffusion-charging-to-
number-concentration-ratio (DC/NC) also means an increasing mean active surface
and therefore a growing particle size since for small particles the active surfaceS ∝d2
p. It is clear that coagulation plays an important role in the grow mechanism only
during the first minutes of the decay process (table 2.2). After these first minutes,

42 2. EFFECTS OF SECOND ORDER PROCESSES IN AEROSOL MONITORING
500 1000 1500 2000 2500 3000
0.6
0.8
1.0
1.2
1.4
t [sec]
Rel
ativ
e ch
ang
e fa
cto
r
PE/DC
DC/NC
LS/NC
FIGURE 2.3. Change in signal ratio against time during an
aerosol concentration decay process. The points represent the
change in ratio of the values measured by means of photoemis-
sion (PE), diffusion charging (DC), number concentration (NC)
and light scattering (LS) normalized against the signal value
observed at the moment when the cigarettes burned out. The
dashed curve is an exponential fit.
the constant increase in signal ratio supports our previous idea of growing process
dominated by condensation. The increase in diameter is seen in the light-scattering-
to-number-concentration-ratio (LS/NC) behavior as well, where the steeper LS/NC
increase is due to the fact that light scattering for small particles is proportional to
d6p.
Furthermore, by using the fact that the particle active surfaceS ∝ d2p we can es-
timate the increase indp from our DC/NC data. This yields a value of∆dp ≈ 10%
during a 30 minutes interval for the data presented in figure 2.3. This value can
be checked by analyzing the change in time of the mobility diameter distribution
4. RESULTS AND DISCUSSION 43
1020.0
0.2
0.4
0.6
0.8
1.0
Mobility diameter [nm]
Rel
ativ
e par
ticl
e co
nce
ntr
atio
nt=0min
t=10min
t=20min
t=30min
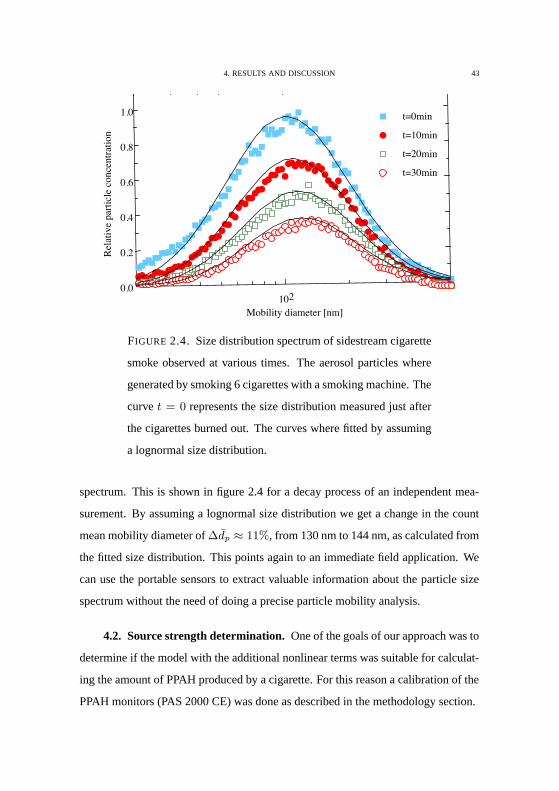
FIGURE 2.4. Size distribution spectrum of sidestream cigarette
smoke observed at various times. The aerosol particles where
generated by smoking 6 cigarettes with a smoking machine. The
curvet = 0 represents the size distribution measured just after
the cigarettes burned out. The curves where fitted by assuming
a lognormal size distribution.
spectrum. This is shown in figure 2.4 for a decay process of an independent mea-
surement. By assuming a lognormal size distribution we get a change in the count
mean mobility diameter of∆dp ≈ 11%, from 130 nm to 144 nm, as calculated from
the fitted size distribution. This points again to an immediate field application. We
can use the portable sensors to extract valuable information about the particle size
spectrum without the need of doing a precise particle mobility analysis.
4.2. Source strength determination.One of the goals of our approach was to
determine if the model with the additional nonlinear terms was suitable for calculat-
ing the amount of PPAH produced by a cigarette. For this reason a calibration of the
PPAH monitors (PAS 2000 CE) was done as described in the methodology section.

44 2. EFFECTS OF SECOND ORDER PROCESSES IN AEROSOL MONITORING
The GCMS analysis of the calibration probe yielded a total of 1.7µg PAH, this
represents a mean concentration of 155.7 ng/m3 PPAH during the 13 hours sampling
period. As a comparison the same type of analysis was done to the mainstream
smoke sampled extracted with the smoking machine.
By using the results obtained from the calibration and the indoor measurements
technique, we used our PAS 2000 CE sensors to establish the mean emission rate
of the test cigarettes, which was found to be 8 ng/sec PPAH per cigarette. This
means that the total emission of one cigarette for an 11 minutes burning event would
be 5.3µg PPAH. These results can be used to predict the PPAH concentration of
a series of smoking activities. Figure 2.5 presents a comparison between such a
prediction and one of our measurements. The close agreement with the experimental
data shows that the method is useful to calculate the necessary air exchange rate in
a room, where cigarette smoking are permitted, in order to stay below a maximum
concentration. We would like to stress that even small values of the coagulation
coefficient can yield a total different dynamic for highly concentrated systems when
compared to the linear mass balance model. This can also be seen in figure 2.5, as
we know from table 2.2 that the effect of coagulation on the PAS sensor for high
concentrations is one order of magnitude smaller than in the case of the number
concentration.
The same technique would allow us to calculate the total aerosol mass emission
rate, called Respirable Suspended Particles (RSP), of a cigarette and to obtain the
PAH-to-RSP rate. Klepeis et al. (1996) have calculated the RSP with the linear
model using a piezobalance, for a different kind of cigarettes, and found it to be
1.43 mg/min. This gives us an approximated PPAH-to-RSP ratio of 3.7×10⁻⁴. We
can compare this value with the PPAH-to-TAR ratio from the mainstream smoke
sampled using the smoking machine, found to be5.5 × 10−5, which shows the
fact that the sidestream smoke is richer in PPAH constitution than the mainstream
smoke, and with the PPAH-to-RSP ratio for traffic aerosol in the Gubrist tunnel

4. RESULTS AND DISCUSSION 45
0 2 4101
102
103
t [h]
PPA
H C
once
ntr
atio
n [
ng/m
]3
This study
First order model
FIGURE 2.5. PPAH concentration time series measured by us-
ing a PAS 2000 CE sensor compared with the time series pre-
dicted using our model and the mass balance model (Kk = 0).
Each concentration increment represents sets of four or six
cigarettes smoked at a time.
in Switzerland (Weingartner et al., 1997) determined by a chemical analysis to be
8.6 × 10⁻³ (0.86%), thus being one orders of magnitude larger than the PPAH-to-
RSP ratio for sidestream cigarette smoke.


References
Adachi, M, Okuyama, K, and Kousaka, Y. Simple evaluation method of bipo-
lar diffusion charging of aerosol-particles and its application to smoke detectors.
Aerosol Sci. Tech., 7(2):217, 1987.
Ammann, M., Hanert, R., Burtscher, H., and Siegmann, H.C. Photoelectric charg-
ing of ultrafine volcanic aerosol: Detection of Cu(I) as a tracer of chlorides in
magmatic gases.J. of Goephys. Res., 98:551–556, 1993.
Brauer, M., Hirtle, R, Lang, B, and Ott, W. Assessment of indoor fine aerosol con-
tributions from environmental tobacco smoke and cooking with portable neph-
elometer.J. of Expos. Anal. Environ. Epidemiol., pages 136–144, 2000.
Burtscher, H. Measurement and characteristics of combustion aerosols with special
consideration of photoelectric charging and charging by flame ions.J. of Aerosol
Sci., 23:549–595, 1992.
Burtscher, H. and Siegmann, H.C. Monitoring PAH-emissions from combustion
processes by photoelectric charging.Combustion Sci. and Tech., 101:327, 1994.
Chantrell, R.W., Popplewell, J., and Charles, S.W. Measurements of particle size
distribution parameters in ferrofluids.IEEE Trans. magnet., 14(5):975, 1978.
Charles, S.W. and Popplewell, J. Ferromagnetic liquids. In Wohlfarth, E.P., editor,
Ferromagnetic materials, volume 2. North-Holland Publishing Company, 1980.
Chuller, U., Burtscher, H., and Schmidt-Ott, A. Photoemission from small metal
spheres: A model calculation using an enhanced three-step model.Phys. Rev. B,
38:7814, 1988.
59

60 References
Dubowsky, S., Wallace, L.A., and Buckley, T.J. The contribution of traffic to indoor
concentrations of polycyclic aromatics hydrocarbons.J. of Expos. Anal. Environ.
Epidemiol., 9:312–321, 1999.
Fendel, W., Matter, D., Burtscher, H., and Schmidt-Ott, A. Interaction between
carbon or iron aerosol–particles and ozone.Atmospheric Environ., 29:967, 1995.
Filippov, A.V. Charging of aerosol in the transition regime.J. of Aerosol Sci., 24:
423–436, 1993.
Filippov, A.V., Schmidt-Ott, A., and Fendel, W. Escape Probability of Photoelec-
trons from Particles.J. of Aerosol Sci., 24(Suppl. 1):S501–S502, 1993.
Flipse, C.F.J., Rouwelaar, C.B., and de Groot, F.M.F. Magnetic properties of CoO
nanoparticles.Eur. Phys. J. D, 9:479, 1999.
Friedlander, S.K.Smoke, Dust, and Haze. Oxford University Press, 2000.
Fuchs, N.A.The Mechanics of Aerosols. Dover Publ. Inc., New York, 1964.
Gaggeler, H.W., Baltensperger, U., Emmennegger, M., Jost, D.T., Schmidt-Ott, A.,
Haller, P., and Hofmann, M. The epiphaniometer, a new device for continous
aerosol monitoring.J. of Aerosol Sci., 20:557–564, 1989.
Hinds, William C. Aerosol Technology. John Wiley & Son, 1982.
Hueglin, Ch., Paul, J., Scherrer, L., and Siegmann, K. Direct observation of desorp-
tion kinetics with perylene at ultrafine aerosol particle surfaces.J. of Phys. Chem.
B, 101:9335–9341, 1997.
Kaiser, R. and Miskolczy, G. Magnetic properties of stable disperssions of subdo-
main magnetic particles.J. Appl. Phys., 41(3):1064, 1970.
Kalberer, M., Ammann, M., Tabor, K., Parrat, Y., Weingartner, E, Piguet, D.,
Rossler, E., Jost, D.T., Turler, A., Gaggeler, H.W., and Baltensperger, U. Hetero-
geneous chemical processing of (NO2)–N-13 by monodisperse carbon aerosols at
very low concentrations.J. of Phys. Chem., 100:15487, 1996.
Kasper, M., Keller, A., Paul, J., Siegmann, K., and Siegmann, H.C. Photoelectron
spectroscopy without vacuum: nanoparticles in gas suspension.J. of Elec. Spec.,

References 61
98–99:83–93, 1999a.
Kasper, M., Sattler, K., Siegmann, K., Matter, U., and Siegmann, H.C. The influence
of fuel additives on the formation of carbon during combustion.J. of Aerosol Sci.,
30:217–225, 1999b.
Kauffeldt, Th., Kleinwechter, H., and Schmidt-Ott, A. Absolut on-line measurement
of the magnetic moment of aerosol particles.Chem. Eng. Comm., 151:169, 1996.
Kauffeldt, Th. and Schmidt-Ott, A. On-line measurement of the magnetic moment
of aerosol.J. of Aerosol Sci., 23(S1):S425, 1992.
Keller, A., Fierz, M., Siegmann, K., Siegmann, H.C., and Filippov, A. Surface
science with nanosized particles in a carrier gas.J. of Vac. Sci. and Technol. A, 19
(1):1–8, 2001.
Klepeis, N.E., Ott, W.R., and Switzer, P. A multiple smoker model for predicting
indoor air quality in public lounges.Environ. Sci. Technol., 30(9):2813–2820,
1996.
Knutson, E.O. and Whitby, K.T.J. of Aerosol Sci., 6:443, 1975.
Kodama, R.H. Magnetic nanoparticles.J. Magn. Magn. Mat., 200:359, 1999.
Kruis, F.E., Fissan, H., and Peled, A. Synthesis of nanoparticles in the gas phase
for electronic, optical and magnetic applications - a review.J. of Aerosol Sci., 29
(5/6):511, 1998.
Kulmala, M. Atmospheric aerosols: Gobal effects.J. of Aerosol Sci., 30(Supl. 1):
1–2, 1999.
Lee, K.W. and Chen, H. Coagulation rate of polydisperse particles.Aerosol Sci.
Tech., 3:327–334, 1984.
Martinet, A. Birefringence et dichroısme lineaire des ferrofluides sous champ
magnetique.Rheol. Acta, 13:260, 1978.
Matter, U., Siegmann, H.C., and Burtscher, H. Dynamic field measurements of
submicron particles from diesel engines.Environ. Sci. Technol., 33:1946–1952,
1999.
62 References
Meiklejohn, W.H. Exchange anisotropy - a review.J. Appl. Phys., 33(3):1328, 1962.
Meiklejohn, W.H. and Bean, C.P. New magnetic anysotropy.Phys. Rev., 102(5):
1413, 1956.
Meiklejohn, W.H. and Bean, C.P. New magnetic anysotropy.Phys. Rev., 105(3):
904, 1957.
Morrish, A.H¿. The physical principles of magnetism. John Wiley & Sons, New
York, 1965.
Ott, W. and Klepeis, N. Technical report no. 1: Development of an advanced total
human exposure model. Technical report, Indoor-outdoor PAH time series from
the residential exposure project., 1995.
Ott, W., Langan, L., and Switzer, P. A time series model for cigarette smoking
activity paterns: Model validation for carbon monoxide and respirable particles in
a chamber of an automobile.J. of Expos. Anal. Environ. Epidemiol., 2(Suppl. 2):
175–200, 1992.
Ott, W., Wilson, N., Klepeis, N., and Switzer, P. Real-time monitoring of polycyclic
aromatic hydrocarbons and respirable suspended particles from environmental to-
bacco smoke in a home. InProceedings of the international Symposium of the Air
and Waste Management Association (May 1994), Pittsburgh, 1994. Air and Waste
Management Association.
Paul, J., Dorzbach, A., and Siegmann, K. Circular dichroism in the photoionization
of nanoparticles from chiral compounds.Phys. Rev. Lett., 79(16):2947, 1997a.
Paul, J., Dorzbach, A., and Siegmann, K. Detection of chirality in ultrafine aerosol.
J. of Aerosol Sci., 28(Suppl. 1):S319, 1997b.
Paul, J. and Siegmann, K. Large natural circular dichroism in photoionization.
Chem. Phys. Lett., 304:23–27, 1999.
Peters, Annette, Skorkovsky, Jiri, Kotesovec, Frantisek, Brynda, Jaromir, Spix,
Claudia, Wichmann, H. Erich, and Heinrich, Joachim. Association between mor-
tality and air pollution in europa.Environ. Healt, 108(4):283–287, 2000. And

References 63
references cited therein.
Qian, Z., Siegmann, K., Keller, A., Matter, U., Scherrer, L, and Siegmann, H.C.
Nanoparticles air pollution in mayor cities and its origin.Atmospheric Environ-
ment, 34:443–451, 2000.
Rogak, S.N., Baltensperger, U., and Fleagan, R.C. Measurement of mass–transfer to
agglomerate aerosols.Aerosol Sci. Tech., 14:447–458, 1991.
Rosenfeld, D. Supression of rain and snow by urban and industrial air pollution.
Sci., 287:1793–1796, 2000. And references cited therein.
Schleicher, B., Burtscher, H., and Siegmann, H.C. Photoelectric quantum yield of
nanometer metal particles.Appl. Phys. Lett., 63(9):1191, 1993.
Schmidt-Ott, A., Baltensperger, U., Gaggeler, H.W., and Jost, D.T. scaling behavior
of physical parameters describing agglomerates.J. of Aerosol Sci., 21:711–717,
1990.
Schmidt-Ott, A, Schurtenberger, P., and Siegmann, H.C. Enormous yield of photo-
electrons from small particles.Phys. Rev. Lett., 45:1284–1287, 1980.
Sherman, E. InIII Int. Symp. on Rarefied Gas Dyn., volume II, pages 228–260, 1963.
Shuele, W.J. and Deetscreek, V.D. Appearance of a weak ferromagnetism in fine
particles of antiferromagnetic materials.J. Appl. Phys., 33(3):1136, 1962.
Siegmann, K., Scherrer, L., and Siegmann, H.C. Physical and chemical properties
of airborne nanoscale particles and how to measure the impact on human health.
J. of Molecular Structure (Theochem), 458:191–201, 1999.
Weingartner, E., Keller, C., Stahel, W.A., Burtscher, H., and Baltensperger, U.
Aerosol emission in a road tunnel.Atmospheric Environment, 31:451–462, 1997.
Williams, M.M.R. and Loyalka, S.K.Aerosol Science: Theory and practice. Perga-
mon Press, 1991.
Zhiqiang, Q., Siegmann, K., Keller, A., Matter, U., Scherrer, L., and Siegmann, H.C.
Nanoparticle air pollution in major cities and its origin.Atmospheric Environ., 34:
443–451, 2000.