surface water degradation - sustainable global...
TRANSCRIPT

AN EXPLORATION INTO AN URBANIZING WORLD: Interconnections of Water, Food, Poverty and Urbanization © Varis, O. (Ed.). 2006.
6.3 Surface water degradation
Olli Varis
Streams, lakes, reservoirs and wetlands are used and exploited in a variety of ways. They contain cultural and religious values that are essential. Ex-ploitation of surface waters contributes to the deterioration of water quality and changes in ecology. The natural patterns of seasonality and other varia-tions cause mismatch between supply and demand of water.
Surface water in the hydrologic cycle
Surface water resources – rivers, other streams, lakes, reservoirs, and wetlands – are a very dynamic part of the global water cycle. The climatic variability, both seasonal and annual, affects greatly the quantity and quality of surface waters. Basically, the input comes from rainfall, and the output from evaporation to the atmosphere and flow to the oceans. The water cycle also includes flow and storage in soil, in the ground, as snow and as ice.
In this chapter, quality and quantity issues of surface waters are summarized; the former ones in some more detail, because Chapters 2.3 to 2.5 present an over-view of water quantity in the global scale and in the study regions, even by country.
Quantity
Climatic issues determine the input to the surface waters, and partly also the output. Wet and rainy sea-sons or years cause floods and dry ones are the reason of droughts. In addition, changes in vegetation and land use cause long term changes in the water reten-tion, infiltration, and other properties of watersheds, and therefore also in water quantity. The most marked quantitative changes are, however, due to man-made constructions such as reservoirs, dams, water transfer systems and so forth.
In the global level, the construction of reservoirs has increased the stable runoff—the flow in driest sea-sons—by 1/3 (Figure 2.2b). By this, the floods have been cut down too, because flood waters can be stored to reservoirs to be used in the dry seasons.
The water consumption, however, has grown to such an extent, that many of the world’s big rivers are to-day exploited so severely that they discharge practi-cally no water at least seasonally to the oceans or seas. Such rivers include Amu-Darya and Syr-Darya in Central Asia, Nile and Niger (Global Water Part-nership 2000) in Africa, Colorado in North America, Huang He in China, and Ganges-Brahmaputra in In-
dia (Postel 1996). In fact, most of the world’s rivers have changed markedly their flow pattern due to man’s influence (Figure 10.1d).
Only a part of the water that is withdrawn for human use returns to the watersheds. The rest is evaporated into the atmosphere. Postel et al. (1996) have esti-mated, that around 51% of all water used by humans will not be available to other end-users (Figure 6.3a). For more discussion on the topic, see Chapters 2.3 to 2.4. Figure 2.3b shows water use vs. withdrawal data for each country in the study regions.
Figure 6.3a Water use and consumption Postel et al. (1996) have estimated, that around ½ of all the water used will not be available for other users. They call this proportion as con-sumed water. Agriculture is the greatest con-sumer, accounting for over 4/5 of the total water consumption.
Water use and consumption(1000 km 3 per year)
0 1 2
Agriculture
Industry
Municipalities
Reservoir losses
3
UseConsumption
Many Asian metropolises such as Bangkok, Calcutta, and Dhaka that are practically floating on water, but where the water contamination in almost all conceiv-able ways makes the water use very difficult (cf. Box 10.3b). Water transfer systems even from distances of hundreds of kilometers are being constructed to meet the urban needs. Large-scale water scarcity problems are created in the regions from which water is con-veyed away.
In Thailand’s central plain, which is one of the rice bowls of the world, large irrigation systems are these days useless in dry seasons, because their water is

AN EXPLORATION INTO AN URBANIZING WORLD: Interconnections of Water, Food, Poverty and Urbanization © Varis, O. (Ed.). 2006.
drawn away to meet the rapidly growing Bangkok’s expanding demands. The city itself is sinking, due to overdraft of groundwater, and its ample surface wa-ters are too heavily polluted for any other use but navigation.
Quality
Surface water quality problems consist of several different issues. This is due to the great diversity of lakes, reservoirs and rivers, the wide range of needs and preferences in society for the utilization of sur-face water, and the complexity of aquatic ecosystems. The changes are caused by point source polluters such as industries and settlements that have a sewer-age system; non-point polluters such as agriculture, or through the atmosphere. The most common water quality problems are:
• Eutrophication caused by the abundance of nu-trients and other agents of enhanced primary pro-duction.
• Oxygen depletion caused by degradation of or-ganic matter in water.
• Hygienic problems due to pathogenic organisms such as viruses, bacteria or protozoa.
• Salinization caused by high concentrations of ions such as calcium, sodium, chloride and sul-phate.
• Acidification due to atmospheric deposition of SO2 and NOx or by industrial, mining or natural emissions.
• Toxic or cumulative compounds such as heavy metals or other trace elements, radioactive com-pounds, halogenated hydrocarbons or water-borne toxins.
• Suspended material and turbidity caused by in-organic or organic matter.
• Changed thermal conditions due to thermal pol-lution, flow control or changed climate.
The principal driving force in water quality manage-ment is the need to resolve the potential conflict aris-ing from the specific demands and impacts of various activities on water quality, often under water scarcity. Many water uses suffer from poor quality but have no direct influence on it, while many cause water quality problems but are not harmed by them (Tables 6.3a and 6.3b).
Table 6.3c presents a checklist designed by Varis and
Somlyódy (1996). It is applicable to the screening of lake and reservoir water quality problems as a part of the Environmental Impact Assessment (EIA) process. Table 6.3d shows the various interconnections be-tween the numerous factors and driving forces of wa-ter quality.
Table 6.3a Impacts of surface water quality to uses. Typical influences of water quality problems on most frequent uses: eutrophication, oxygen de-pletion, hygienic problems, salinization, acidifica-tion, toxic / cumulative substances, turbidity and suspended matter, thermal pollution. - = low or occasional influence, -- = marked influence.
Use Eut
roph
ic.
Oxy
g. D
epl.
Hyg
. Pro
b.
Salin
izat
ion
Aci
dific
atio
n
Toxi
c su
bst.
Turb
.&su
sp.
Ther
m. P
oll.
Conservation -- -- -- -- -- -- -- -- Recreation -- -- -- - - -- -- - Fisheries -- -- - - -- - - Aquaculture - -- - - -- - - Withdrawal: - Households -- -- -- - - -- - - Municipalities -- - - - - -- - - Irrigation, etc. - - -- -- - -- - - Industry - - - - - - - Transport - - Flood control - Hydropower - Cooling basin - Waste transport and disposal
-
Table 6.3b Impacts of uses to surface water quality. Use + = low or occasional impact,
++ = high impact Conservation Recreation + Fisheries Aquaculture ++ + + Withdrawal: - Households - Municipalities - Irrigation, etc. + + - Industry Transport + ++ + Flood control + + + + Hydropower + + + ++ + Cooling basin + + + ++Waste transport and disposal
++ ++ ++ + ++ ++
For an itemized description of constituents of water quality and water use standards, see Thanh and Tam (1990a) and McCutcheon et al. (1992). Various na-tional and international agencies and authorities re-lease their own standards, which are typically use-specific.

AN EXPLORATION INTO AN URBANIZING WORLD: Interconnections of Water, Food, Poverty and Urbanization © Varis, O. (Ed.). 2006.
Table 6.3c Surface water quality impact assessment Cross-impact matrix for surface water quality impact assessment: + = same direction, - = op-posite direction, * = indefinite, case specific or unknown direction (Varis and Somlyódy 1996). Specification Problem impacted *)
Eut
roph
ic.
Oxy
g. D
epl.
Hyg
. Pro
b.
Salin
izat
ion
Aci
dific
atio
n To
xic
subs
t. Tu
rb.&
susp
. Th
erm
. Pol
l.
Climatic inputs Temperature + + * + +Humidity - +Solar radiation * + + + +Precipitation - + * - Wind * - + * * * - Thermal and hydraulic Stratification * * * * * * Ice-free period + * * * +Hydrologic Floods * * + - * * * - Droughts * * + * * +Erosion, loading + + + + * + + Retention time + + * + * + * +Water level - - * - * - * - Chemical Oxygen - - - - - Carbon dioxide * * + + Nutrient enrichment + + * + Salinity + - * pH + + - - * * Ecological Growth season length + + * * +Food chains, succession * * * * Blue-green algae + + + + + *) Problems Eutrophication (E) + - + + Oxygen depletion (O) + + + Hygiene (H) Salinization (S) - * Acidification (A) - + - Toxicity (X) Turbidity (M) * + + + Thermal (T) + + * +
Global comparisons are difficult
It is fairly complicated to carry out any global com-parisons on water quality issues and problems, due to the many-sidedness of the question, and given the present data sets. Water quality consists of a number of criteria, and their relation to the very varied water uses, differ greatly.
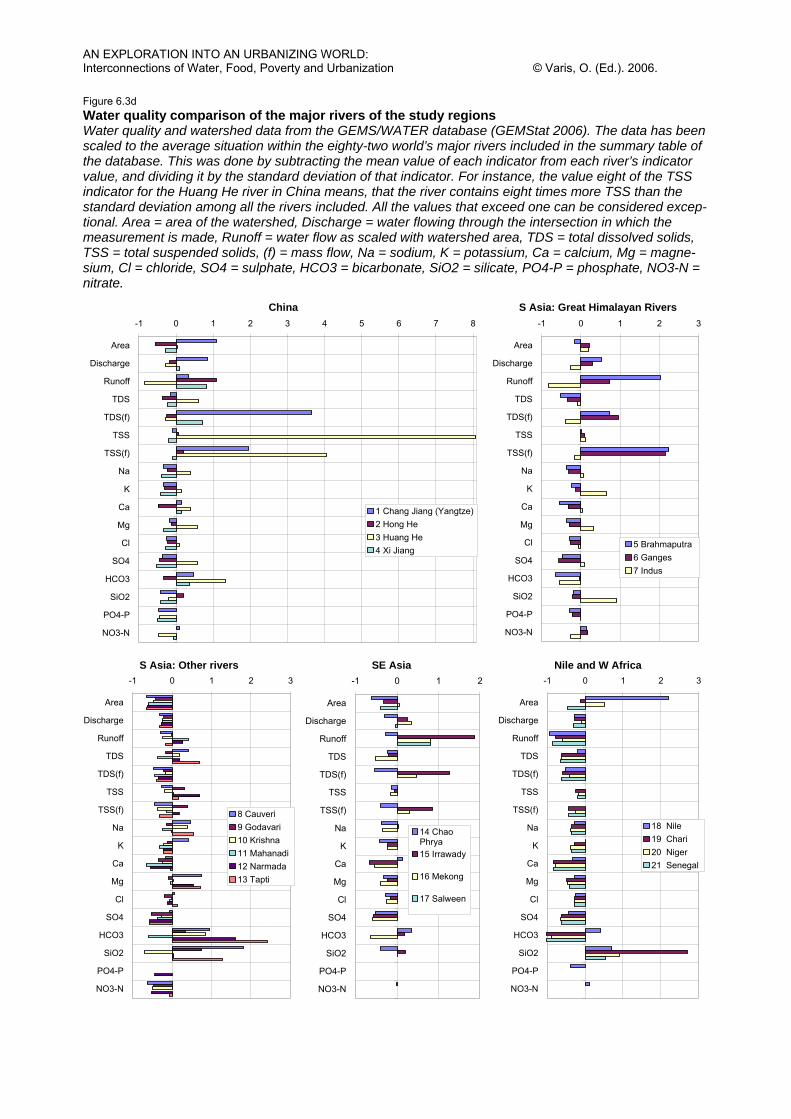
These comparisons are not as accurate as many na-tional ones, such as (see China’s national assessment in Box 6.3a), but they allow regional comparisons. And they are in rapid development all the time. As an example, the water quality indicators for the twenty-
one rivers of the study regions (Figure 6.3c) that are among the eighty-two rivers in the world that are in-cluded in the summary table of the GEMS/WATER database (GEMStat 2006) are shown in Figure 6.3d.
This system was established in 1976 by WHO, UNESCO, WMO and UNEP, and includes 287 river stations, sixty lake stations, and seventy-six ground-water aquifers. A digital water quality atlas is also available.
Water quality in freshwater assessments
Water quality deterioration has been almost neglected in contemporary global water assessments (Chapter 2.4). This is a severe handicap of those assessments. Water may be abundant, but the decreased quality is often a major obstacle for human uses as well as to the ecological balance in a watershed. No amount of water is sufficient, if its quality is deteriorated.
One exception is the UNEP/GEF study on global in-ternational waters. Global Environmental Facility initiated the Global International Waters Assessment (GIWA) project with the aim of providing compara-ble information on the state of international waters. The methodology was designed to integrate as many problems and their root causes as possible using a causal chain approach. The assessment is based on the result of expert panels that evaluate the status of the waters using a standard protocol. The world is divided into sixty-six regions, which include the ma-jor rivers and the adjacent marine areas.
The GIWA project is still ongoing at the time of writ-ing, but the available results with respect to the study regions are collected in Table 6.3e. Among those sixty-six regions, eleven lie in the five study regions China, S Asia, SE Asia, the Nile basin countries and W Africa.
With all respect to GIWA’s results, one cannot avoid some cynicism to the results by looking them a bit more carefully: one among myriad examples is that Lake Chad—even though having lost 90% of its sur-face area—does not seem to be considered as a par-ticularly problematic area by GIWA. One could con-tinue with such strange examples.
Rehabilitation of damaged watersheds
With the intensive exploitation of nature, it is typical that the so-called natural aging processes of the eco-systems are dramatically accelerated. Many water quality problems such as eutrophication, turbidity, and oxygen depletion, change the ecosystems in the same direction as their natural aging. For instance, the eutrophicated Lake Tuusulanjärvi, Finland, ages with a rate of roughly 100 times of the natural rate. In
AN EXPLORATION INTO AN URBANIZING WORLD: Interconnections of Water, Food, Poverty and Urbanization © Varis, O. (Ed.). 2006.
global scale, an example can be taken from the loss of biodiversity (see Chapter 6.5).
Many water quality problems are also related to the opening of material cycles. This issue is discussed in more detail in Chapter 6.1.
Pollution prevention was mentioned as one of the leading contemporary paradigms in water manage-ment in Chapter 3.1. With the other mentioned para-digms it addresses the observation from innumerable cases that remediation of damaged watersheds, lakes, rivers, etc., is typically exceedingly more expensive than prevention of the damage beforehand (Box
6.3b). The dilemma is, that usually there is no politi-cal pressure to take the actions before the problems turn visible to the society.
In many industrialized countries, formerly con-structed rivers and watersheds are being increasingly rehabilitated closer to their natural state. Thus ten-dency is a response to the recognition of the impor-tance of natural ecosystems in issues such as self-purification of water, flood control, and landscape formation. Naturally, it also reflects the changed val-ues and tastes concerning the exploitation of surface waters.
Box 6.3a Required reversal of environmental degradation in China
China is extremely short of natural resources, given its dense population. An analysis of the Chinese Academy of Sci-ences noted that "China's environmental pressures already exceed the critical equilibrium limits of many ecosystems" (Chinese Academy of Sciences 1992; Niu and Harris 1996). Reversing the environmental degradation is an expensive exercise. The World Bank (1997) estimated, that 1-2% of GDP will be required to address water and air pollution. This is a large figure, but it must be seen against the economic losses due to pollution, which equals 8% of GDP.
China has suffered from severe inefficiencies in its production system. A high volume of emissions in relation to pro-duced wealth is a clear indication of this (Box 6.1a).
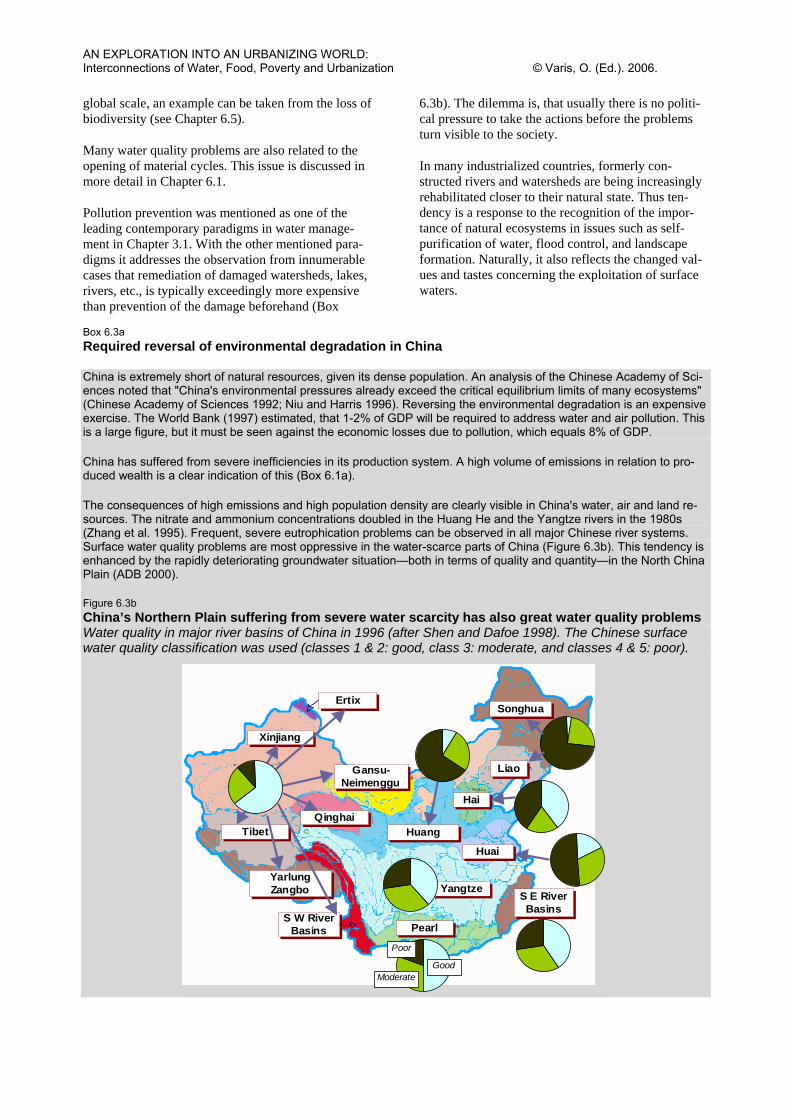
The consequences of high emissions and high population density are clearly visible in China's water, air and land re-sources. The nitrate and ammonium concentrations doubled in the Huang He and the Yangtze rivers in the 1980s (Zhang et al. 1995). Frequent, severe eutrophication problems can be observed in all major Chinese river systems. Surface water quality problems are most oppressive in the water-scarce parts of China (Figure 6.3b). This tendency is enhanced by the rapidly deteriorating groundwater situation—both in terms of quality and quantity—in the North China Plain (ADB 2000).
Figure 6.3b China’s Northern Plain suffering from severe water scarcity has also great water quality problems Water quality in major river basins of China in 1996 (after Shen and Dafoe 1998). The Chinese surface water quality classification was used (classes 1 & 2: good, class 3: moderate, and classes 4 & 5: poor).
Xinjiang
Gansu-Neimenggu
QinghaiTibet
YarlungZangbo
Huang
S W RiverBasins
Yangtze
Pearl
Huai
Hai
Liao
SonghuaErtix
S E RiverBasins
Poor
ModerateGood

AN EXPLORATION INTO AN URBANIZING WORLD: Interconnections of Water, Food, Poverty and Urbanization © Varis, O. (Ed.). 2006.
Table 6.3d Surface water quality interconnections Cross-impact matrix for interconnections among factors of surface water quality: + = same direction, - = opposite direction, * = indefinite, case specific or unknown direction (Varis and Somlyódy 1996). Influence from Toa Climatic inputs St If Fl Dr El Rt Wl Ox Ca Nu Sa pH Gs Fs NaTemperature * + * * * * * * + + * + Humidity * + - * - + * * Solar radiation * + * * * * * + * * Precipitation * * + - + - + * * * - * * Winds * + * * + * * * * * * * Thermal & hydraulic (a) St If Fl Dr El Rt Wl Ox Ca Nu Sa pH Gs Fs NaStratification St * * * * * * * * * * Ice free period If * * * * * * * + * + Hydrologic St If Fl Dr El Rt Wl Ox Ca Nu Sa pH Gs Fs NaFloods Fl * + - + - + * * * - * * * * Droughts Dr * * - * + - * * * + * * * * Erosion, loading El * * * * + + * * * Retention time Rt * * - * * * * + + + * + Water level Wl * * * - * * * * - - * - Chemical St If Fl Dr El Rt Wl Ox Ca Nu Sa pH Gs Fs NaOxygen Ox * * - * * * Carbon dioxide Ca * * + - * * Nutrient enrichment Nu * * + * * + Salinity Sa * + * * pH pH * * * * * * + Ecological St If Fl Dr El Rt Wl Ox Ca Nu Sa pH Gs Fs NaGrowth season length Gs * * * * * + Foodchains, succession Fs * * * * * Nuisance algae Na * * + + * Figure 6.3c Selected, major rivers of the study regions 1 = Chang Jiang, 2 = Hong He, 3 = Huang He, 4 = Xi Jiang, 5 = Brahmaputra, 6 = Ganges, 7 = Indus, 8 = Cauveri, 9 = Godavari, 10 = Krishna, 11 = Mahanadi, 12 = Narmada, 13 = Tapti, 14 = Chao Phaya, 15 = Irrawaddy, 16 = Mekong, 17 = Salween, 18 = Nile, 19 = Chari, 20 = Niger, 21 = Senegal. For selected data from the GEMS/WATER database, see Figure 6.3d.
18
20
19
21
3
6
7
4
15 17
111213
8
9
5
1416
10
12
14
AN EXPLORATION INTO AN URBANIZING WORLD: Interconnections of Water, Food, Poverty and Urbanization © Varis, O. (Ed.). 2006.
Figure 6.3d Water quality comparison of the major rivers of the study regions Water quality and watershed data from the GEMS/WATER database (GEMStat 2006). The data has been scaled to the average situation within the eighty-two world’s major rivers included in the summary table of the database. This was done by subtracting the mean value of each indicator from each river’s indicator value, and dividing it by the standard deviation of that indicator. For instance, the value eight of the TSS indicator for the Huang He river in China means, that the river contains eight times more TSS than the standard deviation among all the rivers included. All the values that exceed one can be considered excep-tional. Area = area of the watershed, Discharge = water flowing through the intersection in which the measurement is made, Runoff = water flow as scaled with watershed area, TDS = total dissolved solids, TSS = total suspended solids, (f) = mass flow, Na = sodium, K = potassium, Ca = calcium, Mg = magne-sium, Cl = chloride, SO4 = sulphate, HCO3 = bicarbonate, SiO2 = silicate, PO4-P = phosphate, NO3-N = nitrate.
China-1 0 1 2 3 4 5 6 7 8
Area
Discharge
Runoff
TDS
TDS(f)
TSS
TSS(f)
Na
K
Ca
Mg
Cl
SO4
HCO3
SiO2
PO4-P
NO3-N
1 Chang Jiang (Yangtze)2 Hong He 3 Huang He 4 Xi Jiang
S Asia: Great Himalayan Rivers-1 0 1 2 3
Area
Discharge
Runoff
TDS
TDS(f)
TSS
TSS(f)
Na
K
Ca
Mg
Cl
SO4
HCO3
SiO2
PO4-P
NO3-N
5 Brahmaputra 6 Ganges 7 Indus
S Asia: Other rivers-1 0 1 2 3
Area
Discharge
Runoff
TDS
TDS(f)
TSS
TSS(f)
Na
K
Ca
Mg
Cl
SO4
HCO3
SiO2
PO4-P
NO3-N
8 Cauveri 9 Godavari 10 Krishna 11 Mahanadi 12 Narmada 13 Tapti
SE Asia-1 0 1 2
Area
Discharge
Runoff
TDS
TDS(f)
TSS
TSS(f)
Na
K
Ca
Mg
Cl
SO4
HCO3
SiO2
PO4-P
NO3-N
14 ChaoPhrya 15 Irrawady
16 Mekong
17 Salween
Nile and W Africa-1 0 1 2 3
Area
Discharge
Runoff
TDS
TDS(f)
TSS
TSS(f)
Na
K
Ca
Mg
Cl
SO4
HCO3
SiO2
PO4-P
NO3-N
18 Nile 19 Chari20 Niger 21 Senegal

AN EXPLORATION INTO AN URBANIZING WORLD: Interconnections of Water, Food, Poverty and Urbanization © Varis, O. (Ed.). 2006.
Table 6.3e Results of GIWA with respect to the areas that fall in the study regions (GIWA 2003)
Legends No impact Slight impact Moderate impact Severe impact
Med
iterra
nean
Yello
w S
ea
Boha
i Sea
East
-Chi
na S
ea
Can
ary
Cur
rent
S
Gul
f of G
uine
a
Lake
Cha
d
Arab
ian
Sea
Bay
of B
enga
l
Sout
h C
hina
Sea
Mek
ong
Riv
er
Sulu
-Cel
ebes
Sea
Indo
n.S
ea, S
unda
I Freshwater shortage - Modification of stream flow - Pollution of existing supplies - Changes in the water table - Economic impacts - Health impacts - Other social and community impacts II Pollution - Microbiological - Eutrophication - Chemical - Suspended solids - Solid wastes - Thermal - Radionucleides - Spills - Economic impacts - Health impacts - Other social and community impacts III Habitat & community modification - Loss of ecosystems or ecotones - Modification of ecosystems or ecotones - Economic impacts - Health impacts - Other social and community impacts IV Unsust. exploitation of Fisheries - Overexploitation of fisheries - Excessive bycatch and discards - Destructive fishing practices - Decreased viability of stocks - Impact on biological & genetic diversity - Economic impacts - Health impacts - Other social and community impacts V Global change - Changes in hydrological cycle - Sea level change - Increased UV-B radiation - Changes in ocean CO2 source/sink - Economic impacts - Health impacts - Other social and community impacts
Coverage of the five study regions (+ indicates that also other areas are in-cluded) N
ile B
asin
+
Cen
tral C
hina
(Yan
gze
etc.
)
Nor
th C
hina
Pla
in
SE
Chi
na
Mau
ritan
ia, S
eneg
al, G
ambi
a +
W A
frica
exc
. Can
ary
& C
had
+
Cha
d B
asin
Pak
ista
n, W
Indi
a +
E In
dia,
Ban
glad
esh
+
Vie
tnam
, S C
hina
, Phi
lippi
nes
+
Mek
ong
Bas
in
Par
ts o
f Ind
ones
ia
Par
ts o
f Ind
ones
ia

AN EXPLORATION INTO AN URBANIZING WORLD: Interconnections of Water, Food, Poverty and Urbanization © Varis, O. (Ed.). 2006.
Box 6.3b Environmental vicious circles An example of lake eutrophication.
Environmental problems—such as deterioration of surface water quality—are often complex consequences of mutually connected processes that perpetuate one another. Such vicious circles tend to be difficult and costly to break, once they are in full force (Varis 1999). Many environmental vicious circles are known well enough in theory. However, over and over again, such circles are set in full speed instead of preventing them beforehand.
Prevention of environmental vicious circles would, though, be in most cases a far more economic option in the long run than the other alternative: letting the problems grow visible, and acting only with a considerable lag after that―a lag that seems to be necessary for political argumentation.
At present, one of the slogans in emerging economies is first pollute, then clean (Figure 6.3e). The argumentation goes in the following way: “…now there is no money to take care of environmental pollution. We have to put all the efforts to build up the economy. Once the money is there, the time is right for environmental investments”.
It has been shown too many times, that such solutions become extremely expensive, once the damages have been done, and the vicious circles keep on running although the external conditions have been improved by environmental investments.
One of the myriad of such vicious circles, or actually a pair of circles, is related to the eutrophication process of a lake. External nutrient loading, particularly phosphorus (P) and nitrogen (N), enhances the growth of phytoplankton and macroplants. This causes increased consumption of dissolved oxygen, due to degradation of more and more organic material. In oxygen-poor conditions, P plus many other harmful substances are mobilized from the bottom sediments and they, in turn, further boost primary production.
In parallel, increased nutrient concentrations favor the growth of bluegreen algae (known also as Cyanobacteria), which are able to fix N from the atmosphere to the ecosystem. This fertilizes the lake further, and enhances the growth of primary producers. Many bluegreen algae strains are toxic, being therefore very harmful to almost all uses of water.
Breaking these vicious circles has been found highly expensive in innumerable cases in Europe, North America and increasingly in other continents as well. Despite of that, the investments to wastewater treatment, diffuse pollution con-trol, industrial waste management, etc., tend to come too late. The political will is evidently difficult to raise before the problems emerge visible. In that instant, the vicious circles are already in place.
Figure 6.3e Pollution first then clean policy often creates vicious circles that are difficult to cut later Left: The first pollute—then clean philosophy tends to produce problems, which became much more ex-pensive to solve afterwards than prevent beforehand. Right: Once the vicious circles are there, the re-moval of external load is no longer enough when restoring the ecosystem. The vicious circles must be broken. This tends to be difficult and, in many cases, has proven extremely expensive.
Economy grows
First pollute Then clean
First polluteThen suffer from pollutedenvironment and try toslow pollution down
Dream scenario
Reality scenarioEconomy fluctuates
Nutrient (N, P)load to a lake
Increased primaryproduction
Bluegreenalgae growthN-fixation from
atmosphere
Increased Nload
IncreasedP load
Oxygendepletion
Mobilization ofP from
sediment