surface water impacts
TRANSCRIPT

SURFACE WATER IMPACTS 41
SURFACE WATER IMPACTS
Effects of cover crops on surface water quality
A. N. Sharpley and S. J. Smith
The current emphasis on sustainable agricultural systems has led to a renewed interest in the use of cover crops to reduce soil erosion losses and retain soluble nutrients during the dormant season. Cover crop choices include a broad range of plant material, such as ryegrass (Secufe cereale L.), winter wheat (Triticum aestivum L.), forage grasses, and legumes.
Historically, cover crops were used to fix atmospheric nitrogen (N), improve soil structure and tilth, and minimize runoff and erosion. As a result, much information is available on the agronomic and economic effects of cover crops under different management systems and regions of the country (9, 10, 35, 42). Less attention, however, has been given to the effect of cover crops on nutrient losses in surface runoff. While it is generally recognized that cover crops can be very effective in reducing nutrient losses associated with sediment transport (i.e., sediment-bound or particulate nutrients), information regarding soluble nutrient losses in surface runoff is sparse.
An increased public perception of the role of agriculture in nonpoint-source pollution has stimulated need for informa- tion on the effect of current and proposed agricultural man- agement practices on surface water quality (40). Because of easier identification and control of point sources of pollution, agricultural nonpoint sources now account for a larger share of all discharges than a decade ago. Consequently, more attention will be directed toward developing models that simulate nutrient transport in runoff to help select manage- ment systems that can minimize associated water quality problems.
In this chapter, we consider surface water quality impacts
A. N.Sharp1eyandS. J . Smitharesoilscientists with theNationalAgricultura1 Water Quality Luborarory, Agricultural Research Service, US. Department of Agriculture. Durant, Oklahoma 74702-1430.
for various cover crop situations, particularly in the Southern Plains. Our discussion focuses on field losses of N and phosphorus (P), the two plant nutrients most frequently associated with impaired surface water quality. We compare predictions of N and P transport and bioavailability with measured losses in runoff from watersheds with and without cover crops. We also discuss the management of cover crops in agricultural systems for surface water quality along with identified research needs.
Nutrient transport
Forms. Nitrogen and P transport occurs in soluble and particulate (sediment-bound and organic matter) forms. While soluble N [nitrate (NO,-N)] and soluble P are immediately available for biological uptake (20,43), particulate N and P are less readily available and may provide a long-term source of these elements for aquatic plant growth (3 ,5 ,46) . In the past, most studies have measured management effects on only soluble and total N and P losses in surface runoff. Measure- ment of particulate N and P bioavailability is needed, however, to estimate more accurately the impact of agricultural man- agement practices on the biological productivity of surface waters. This is of particular importance for particulate P, as P is often the growth-limiting element because of the ability of blue-green algae to fix atmospheric N.
Algal culture can quantify the amount of particulate P that is potentially available for uptake by algae (bioavailable particulate P) (38). These assays generally involve long-term incubations (100 days) and, thus, more rapid chemical extrac- tion procedures, using, for example, sodium hydroxide (NaOH), have been developed (8, 34).
(c) SWCS. For Individual Use Only.

42 COVER CROPS FOR CLEAN WATER
Amounts. The inclusion of a cover crop in several manage- ment systems consistently decreased runoff, soil loss, and amounts of N and P transported (Table 1). These studies included the use of alfalfa (Medicagosativa L.)-timothy (Phleum pratense L.) sod, barley (Hordeum vulgare L.), and ryegrass as cover crops with conventionally tilled and reduced-till corn (Zea mays L.); winter wheat as a cover crop with cotton (Gossypium hirsutum L.); alfalfa and ryegrass as a cover crop with wheat; and common chickweed (Stellaria media L.), Canada bluegrass (Poa compressa L.), and downy brome (Bromus tectorum L.) as cover crops with no-till soybeans
[Glycine max (L) Merr.]. In contrast to decreased amounts of N and P transported, the effect of cover crops on soluble concentrations is not consistent. For example, Angle et al. (I), Yo0 et al. (47), and Zhu et al. (49) reported that cover crops decreased mean annual NO,-N concentration of runoff from corn, cotton, and soybeans, respectively, while increased concentrations were observed by Klausner et al. (14) and Pesant et al. (19) for corn and wheat (Table 1). In the case of soluble P, cover crops increased mean annual concentrations compared with no cover crop, for all studies summarized in table 1, except for corn with an alfalfa-timothy cover (19) and
Table 1. Effect of cover crops on soil loss N and P transport in runoff for several management systems.
Management Cover Crop Locationt N P (inches) Soil Loss Nitrate - N N P P Fertilizer Runoff Total Soluble Total
~ Ib/acre/year - lb/acre/year
CT corn None NT corn Barley
CT corn NT corn CT wheat NT wheat
CT corn CT corn
CT corn NT corn
None Ryegrass None Ryegrasslalfalfa
None Winter rye
None Alfalfaltimothy
MD' 60 42 0.16 234 0.32(8.78)$ 0.85 0.01(0.40)$ 0.13 60 42 0.03 29 0.04(5.88) 0.11 O.Ol(1.65) 0.01
KY* 275 66 6.85 275 66 1.54 275 57 6.81 275 57 2.91
G A3 18 6.24 45 3.80
Quebec4 22 40 1.93 22 40 0.70
- 2.20(1.41) - 1.26(3.62) - 1.02(0.66) - 0.83(1.26)
3,271 838
15,083 0.36(0.81) 1.1 52 0.52(3.24)
- 0.44(0.28) - - 0.12(0.33) - - 0.29(0.18) - - 0.15(0.23) -
- 0.25(0.13) 3.64 - 0.27(0.20) 1.24
0.43 0.24(0.55) 2.70 0.53 0.21(0.22) 0.17
CT cotton None AL5 90 0 3.44 1,997 3.07(3.87) 3.67 0.3q0.43) 0.56 NT cotton None 90 0 3.58 953 1.2q1.73) 2.77 0.28(0.39) 0.39 NT cotton Winter wheat 90 0 1.37 232 0.50(1.12) 0.79 0.14(0.39) 0.18
NT soybean None M06 13 1 1 9.09 1,333 3.00(4.04) - 0.41(0.28) - NT soybean Common chickweed 13 1 1 5.22 208 O.SS(l.86) - 0.15(0.45) - NT soybean Canada bluegrass 13 1 1 5.59 83 0.79(1.92) - 0.38(0.80) - NT soybean Downy brome 13 1 1 4.53 105 0.75(2.06) - 0.24(0.52) 'CT and NT represent conventional and no-till, respectively. tfleference of each study location is 1. Angle et al. (1); 2, Klausner et al. (14); 3 , Langdale et al. (15); 4, Pesant et al. (19); 5, Yo0 et al. (47); and 6, Zhu et al. (49). *Figure in parenthesis is mean annual concentration.
Table 2. Mean annual soil loss and flow-weighted concentration and amount of P and N in runoff from peanuts during a 6-month winter period (October-April), with and without a cover crop, at Fort Cobb, Oklahoma.
Concentration (ppm) Amount (Ib/acre/6 months) 1985 1988 1985 1988
No Cover Crop Ryegrass No Cover Crop Wheat No Cover Crop Ryegrass No Cover Crop Wheat Parameter (FC1) (FC2) (FC2) (FC1) (FC1) (FC2) (FC2) (FC1)
Management Soil type
Fertilizer P' 43 21 0 0 Fertilizer N' 155 110 0 0
Cobb fine sandy loam (fine-loamy, mixed thermic Udic Haplustalfs)
Runoff losses Runoff (inches) Soil loss
1.14 0.44 4.81 1 .oo 4,125 893 15,973 1,973
Soluble P 0.14 0.19 0.12 0.15 0.04 0.02 0.13 0.04 Particulate P 4.53 3.98 4.70 3.50 1.17 0.40 5.13 0.79 Bioavailable P 1.21 1.05 1.32 0.24 Total P 4.67 4.17 4.82 3.65 1.21 0.42 5.26 0.82
Nitrate-N 0.50 0.73 0.29 0.75 0.13 0.07 0.31 0.17 Ammonium-N 0.09 0.04 0.28 0.1 1 0.03 0.01 0.30 0.03 Total N 15.10 13.10 17.05 12.93 3.91 1.33 18.61 2.92
'Units of application are Iblacrelyear.
(c) SWCS. For Individual Use Only.

SURFACE WATER IMPACTS 43
Table 3. Mean annual soil loss, concentration, and amount of P and N transported in runoff from gullied native grass watersheds before (1980-1984) and after (1985-1989) shaping and planting with Midland Bermudagrass cover in the Little Washita River Basin, Oklahoma.
Concentration (ppm) Amount (Ib/acre/year)
Prior to Gullied Treated Prior to Gullied Treated 7985-7989 7985-7989
(L W5202) Parameter Treatment (L W5207) (L W5202) Treatment' (L W5207) Management
Soil type Lucian-Nash complex
Fertilizer P 0 0 21 Fertilizer N 0 0 80
(loamy, mixed, thermic, shallow Udic Haplustolls)
Runoff losses Runoff (inches) Soil loss
2.34 4.80 5.58 18,577 29,861 6,454
Soluble P 0.02 0.02 0.06 0.02 0.01 0.05 Particulate P 7.47 5.04 1.84 8.10 4.58 1.98 Bioavailable P 0.17 0.67 0.23 0.77 Total P 7.49 5.06 1.90 8.12 4.59 2.75
Nitrate-N 0.67 0.68 0.36 0.32 0.64 0.47 Ammonium-N 0.15 0.05 0.1 1 0.28 0.05 0.11 Total N 21.46 9.02 3.38 8.72 7.82 3.46
'Average concentration and loss from paired watersheds (LW5201 and LW5202) prior to gully treatment.
cotton with a winter wheat cover (47). It is apparent, therefore, that the effect of cover crops on
surface water quality can vary as a function of climatic, soil, and crop factors. We present a more detailed analysis of N and P transport and bioavailability in runoff from several water- sheds in the Southern Plains under different cover crop situations below, to evaluate these factors. Sharpley et al. (30, 31) and Berg et al. (2) have given information on the analytical methods and management of these watersheds. Climatic considerations. Cover crops may be used during
a winter or summer fallow period. Differences in soil moisture and temperature between these seasons may influence the dynamics of nutrient cycling in soil-plant-residue systems and, thereby, influence the transport of N and P in surface runoff. Table 2 shows the effect of a winter cover crop of ryegrass and winter wheat on N and P transport in runoff from two watersheds under clean-tilled peanuts (Aruchis hypoguea L.). In both 1985 and 1988, there was a dramatic reduction in run- off (61% and 79%), soil loss (78% and 88%), and N (66% and 84%) and P (65% and 84%) transport with cover crops compared with no cover. The concentration of NO,-N and soluble P in runoff, however, was greater in the presence of both cover crops than for fallow, even though less fertilizer N and P was applied to the cover crop treatment in 1985 (Table 2). Measurement of bioavailable particulate P began in 1986, and inclusion of winter wheat cover in 1988 reduced bioavailable particulate P losses 82% (Table 2). Total bioavailable P (represented by soluble P plus bioavailable particulate P), however, comprised a slightly greater proportion of total P under winter wheat cover (34%) compared with no cover (28%).
The effect of a summer cover crop of forage sorghum [Sorghum sudunense (Piper) Stapf.] on soil and nutrient losses in runoff associated with winter wheat culture was shown at El Reno, Oklahoma (Figure 1). In this area of the Southern
Plains, occasional, early summer rains may cause consider- able losses from tilled, summer-fallow wheat fields. When feasible, as with graze-out winter wheat, a summer forage cover crop can reduce such losses.
Although runoff volumes were not affected by manage- ment (data not shown), mean annual amounts of soil, NO,-N,
36%
23% b9 Blo. partlc. P
Wheat - Conventlonal No till Natlve sorghum tlll wheat wheat grass
FR5) (FR6) (FR7) (FR 1)
Figure 1. Mean annual soil, N, and P loss in runoff from continuous winter wheat forage sorghum (FRS), winter wheat under two tillage ~ractices(FR6and FR7h and nativegrass(FR1) at El Reno, Oklahoma, - . . 3984-89. .
(c) SWCS. For Individual Use Only.

44 COVER CROPS FOR CLEAN WATER
total N, particulate P, bioavailable particulate P, total bioavailable P, and total P in surface runoff from winter wheat-forage sorghum (FR5) were lower than from monocul- ture winter wheat (FR6), for the period 1984-1989 (Figure 1). In contrast, the concentration and amount of soluble P in runoff from wheat-sorghum (FR5) were more than twice (120%) those in the absence of sorghum (FR6). As a result, total bioavailable P was a larger percentage of total P in runoff from watershed FR5 (36% of total P) than from FR6 (23% of total P). For comparison, figure 1 also shows losses from
P 100
0 a CORN (poundrlacrelyear) WHEAT W 80 i
1JN 13P m Low fertlllty 75N 2 2 P 275 N 66P a Hlgh fertlllty 215N 57P - 8 -
' 80
z z 0 $ 4 0
B
5
0: 20 8
Runon NO~-N SOIP a
Runoff NO3-N SolP CORN WHEAT
Ryegrass cover crop Ryegrass + alfalfa cover crop
Figure2. Percent reduction in NO,-Nand soluable Pconcentration of runoff from corn and wheat watersheds in Kentucky asa function of cover crop (14).
0 poundalacre
- \ - m
p B 0.12
40 80 40 80 40 80 T h e after plantlng (days)
Cotton Sorghum Soybean
Figure 3. Soluble P concentration of cotton, sorghum, and soybean leachate, and relativecontribution tosolublePtransportinrunoff,as a function of time after planting and P application on Houston black clay loam.
adjacent no-till wheat (FR7) and native grass (FRl) water- sheds, which show that with reduced soil tillage, soil and associated N and P losses decreased, while percent bioavailability increased.
Soil properties. Soil erosion and associated nutrient trans- port may be reduced by detention structures, judicious fertil- izer applications, and cover crops. Two paired, native grass watersheds in the Little Washita River Basin had extensive gully formation with annual soil, total N, and total P losses averaging (from 1980-1984) 18,571, 8.1 1, and 8.72 pounds/ acre/year, respectively (Table 3). In the fall of 1984, one of these watersheds (LW5202) was shaped to remove the gullies, fertilized with 36 pounds N and 21 pounds P/acre/year, sprigged to Midland bermudagrass [Cynodon ductylon (L.) Pers.], and a small pond ( 4 acre surface) was constructed. Subsequently, soil, total N, and total P losses from the treated watershed were appreciably lower (78%, 56%, and 40%, respectively) than the untreated watershed (Table 3). Al- though soluble P and bioavailable particulate P transport increased from treated compared with untreated watersheds, this may be partly due to fertilizer application to the former watershed only (Table 3).
The effect of cover crops on surface water quality may be influenced by soil chemical properties, as well as by surface- soil physical properties. From a study of NO,-N and soluble P transport in runoff from a Lima-Kendaia silt loam in New York by Klausner et al. (14), it is apparent that the relative effect of cover crops in reducing nutrient transport was a function of soil fertility. The percentage reduction in runoff, NO,-N, and soluble P transport from corn and wheat with and without a ryegrass and ryegrass-alfalfa cover crop, respec- tively, was greater for a high- compared with a low-fertility management system (Figure 2). By maintaining a higher soil fertility, the relative effectiveness of cover crops in reducing NO,-N and soluble P transport was enhanced an average of 8- fold and 48-fold for corn and wheat, respectively.
It is clear from these last two examples that the judicious use of fertilizer N and P can enhance cover crop growth and thereby lessen the impact of soil physical and chemical prop- erties on surface water quality. This may be brought about through increased cover and aggregation of surface soil by shoots and roots, respectively.
Crop type. Several studies have suggested that leaching of N and P from crop cover, in different stages of growth and decay, may account for seasonal fluctuations and differences from watershed to watershed in amounts of N and P trans- ported in runoff (4,11,22). Wendt and Corey (44) attributed increased soluble P losses in runoff from alfalfa plots (0.029 poundlacreiyear) compared with forested (0.004 pound/ acre/year), oats (0.014 pound/acre/year), and corn plots (0.010 pound/acre/year). during several simulated rainfall events (2.9 to 4.8 inches/hour/year) over a 2-year period, to larger amounts of P leached from alfalfa.
Researchers also have observed a difference in nutrient transport in runoff from alfalfa, cotton, and wheat watersheds at Chickasha, Oklahoma (Table 4). During the period sum- marized (1973-1974), no fertilizer was applied to any of the watersheds. Mean annual NO,-N and soluble P concentra-
(c) SWCS. For Individual Use Only.

SURFACE WATER IMPACTS 45
tions in runoff from alfalfa were greater than from cotton and wheat (Table 4). In fact, soluble P concentrations were consistently greater than critical values [0.01 parts per minion (pprn) PI associated with accelerated eutrophication (21, 41). On an even larger scale, Muir et al. (18) found a significant correlation between soluble P concentration in major streams of Nebraska and legume growth statewide. They suggested that soluble P concentrations in the Platte River may reflect P leached from alfalfa residues, carried in runoff during months when the crop is dormant (18).
These differences in nutrient transport, as a function of type of crop cover, have been explained partially by studies of nutrient release from vegetation that was cut decaying, dried, and/or freeze-thawed (6, 28, 37, 45). In a study of growing plants under simulated rainfall (2.4 inches/hour), Sharpley (23) found that cotton, sorghum, and soybean plants could maintain a soluble P concentration in plant leachate of 0.02 to 0.13 ppm (Figure 3). The contribution of plant leachate P to runoff losses subsequently was calculated from the difference in soluble P concentration of planted and bare soil. For mature plants (40 days after planting) that had received adequate fertilizer P (45 and 90 pounds/acre/year), leached soluble P accounted for about 20% of soluble P transported in runoff for each crop (Figure 3). When the plants were deficient in P, that is, nofertilizer P applied, or reached senescense (80 days after planting), however, crop cover leachate contributed the major proportion (up to 90%) of the soluble P transported in the runoff.
Cover crops may reduce soil and nutrient loss in runoff. However, soluble N and P concentrations in runoff may increase with cover crops as a function of soil fertility, crop type, and growth stage. This emphasizes the need to consider these climatic, soil, and crop factors in developing flexible agricultural management systems to maximize soil productiv- ity, as well as surface water quality. As cover crops can influence the form of nutrient transported in runoff, cover crops also may affect subsequent interactions between soluble and particulate nutrient forms during transport in runoff or streamflow.
Runoff-sediment-nutrient interactions
Researchers have investigated the relationship between N and P content of runoff sediment and sediment concentration of individual runoff events for the Oklahoma watersheds with and without cover crops, discussed earlier in tables 2 and 3,
Table 4. Mean annual soil loss and flow-weighted N and P concentration of runoff from alfalfa, cotton, and wheat watersheds at Chickasha, Oklahoma, during 1973 and 1974.* Parameter Alfalfa Cotton Wheat Runoff (inches) 5.51 7.36 7.09 Soil loss (poundslacrelyear) 268 3,390 1,700 Soluble P (ppm) 0.81 0.36 0.26 Total P (ppm) 1.77 2.68 1.59
Total N (ppm) 3.01 3.45 2.52 'No fertilizer N or P was applied to the watershed during the study period.
Nitrate-N (ppm) 1.57 0.73 0.80
10000
1000
100
10
10000
1000
100
10
1
\ - .- Cover crop I, y = 724X0'" f = 0.88
Bloavallable P [-+-- NO cover crop1 1 y = 2 9 2 ~ ~ ' - rZ = 0.65
I 0.01 0.1 1.0 10.0
SEDIMENT CONCENTRATION (g/I) Figure 4. Relationship between sediment and particulate and bioavallable P concentratlon of runoff from Oklahoma watersheds with and without cover crops.
and figure 1. Particulate P and bioavailable particulate P content of runoff sediment decreased with an increase in sediment concentration (Figure 4). Researchers found a similar relationship for total N (data not presented), which they attributed this to an increased transport of silt-sized (>2 microns) particles of lower N and P content than finer clay- sized (c2 microns) particles, as sediment concentration of runoff increases. The decrease in N and P content of sediment in runoff from watersheds with a cover crop, however, was greater than that with no cover crop, as shown by the regres- sion slope values with a cover crop (-1.20, -0.54, and -0.90 for total N, particulate P, and bioavailable particulate P, respec- tively) and without (-0.79, -0.32, and -0.39 for total N, particu- late P, and bioavailable particulate P, respectively). This cover crop effect may result from a greater transport of lighter crop residues and finer-sized particles of higher N and P content compared with heavier sediment material in runoff without a cover crop.
In addition to the effect of cover crops, the decrease in bioavailable particulate P content of runoff was greater than that of particulate P for a given increase in sediment concefi- tration (Figure 4). This may result from the decreasing bioavailability of P associated with increasing size of eroded soil particles, which contain less sorbed P and an increasing proportion of primary-mineral P (i.e., apatite) of lower avail- ability compared with finer-clay-sized particles.
These interactions between sediment and N and P are accentuated by the selective transport of organic and fine
(c) SWCS. For Individual Use Only.

46 COVER CROPS FOR CLEAN WATER
materials in runoff and will be important in determining both the long- and short-term potential of runoff to increase the biological productivity of surface waters. The fact that cover crops may influence these interactions emphasizes the poten- tial impact of cover crops on the bioavailability of particulate material entering a water body.
Predictions
Numerous comprehensive mathematical models have been developed to simulate N and P transport to surface waters, with the purpose of aiding selection of management practices capable of minimizing associated water quality problems (7). Although physically based descriptions of the various trans- port processes have been used, the lack of data to drive the models and limited field data for testing has resulted in an oversimplified representation of nutrient transport processes. In particular, equilibrium extraction coefficients have been used to predict soluble P, bioavailable particulate P has been assumed to be a constant proportion of total P, and no attempts have been made to simulate bioavailable particulate P transport. Accurate predictions of N and P transport in runoff from management systems, with and without cover crops, are required for more efficient evaluation of the relative effects of these practices on the eutrophic response of a water body.
10.0 r 1
I I Bioavailable P y = 1.01 + 0.99x
= \
+ No cover crop Y E p 0.01 W 0.01 0.1 1 .o 10.0
L r 9 1.0 I
Soluble P y = 3.04 + 0.94x
r * = 0.98
v - 0 W U n 0.1
I
0.011 /11:1 Relationship 1 0.001 I 1 I
0.001 0.01 0.1 1 .o
MEASURED (mg/l) Figum 5. Relationship between measured and predicted soluble and bioavailable P concentration of runoff from Oklahoma watersheds, with and without cover crops.
Soluble nutrients. One can predict the soluble P concentra- tion of runoff with the following equation that describes the kinetics of soil P desorption (29):
KP,DBt- Wa P, = [I1 V
where P, is the average soluble P concentration of an in- dividual runoff event (mg/l), Pa is the available (Bray-I) P content (mg/kg) of surface soil (0-50 mm) before each runoff event; D is depth of interaction between surface soil and runoff (mm); B is bulk density of soil (mg/m3); t is runoff event duration (minutes); W is runoff waterhod (suspended sedi- ment) ratio; V is total runoff during the event (m); and K, a, and fl are constants for a given soil. Values of D from soil loss (kg/ha) can be estimated, as follows (25):
ln(D) = i(A) + 0.576 ln(soi1 loss) P I where i is a function of soil aggregation (A). Values of equation 1 constants are then estimated from surface soil clay and organic C contents (24).
The soluble P concentration of each runoff event from the watersheds at El Reno, Fort Cobb, and Little Washita loca- tions were predicted with and without cover crops (Tables 2 and 3 and Figure 1). Using these predictions, mean annual concentrations were calculated, Accurate predictions of mean annual soluble P concentrations for runoff from watersheds with and without cover crops were obtained, and covered a wide range in measured concentrations (0.01 to 0.70 ppm) (Figure 5). Prediction error was determined as the standard error of the y estimate of linear measured-predicted regres- sion. In this analysis, the measured value (x) was assumed to be correct and had no error, with the standard error in the predicted value (y), representing all variability associated with the predictive equations. Prediction error for soluble P was 0.02 mg/l, which was 17% of the measured mean annual concentration.
Prediction of the soluble P concentration of runoff from the gullied Little Washita watersheds (1980-1989 for LW5201 and 1980-1984 for LW5202) used subsoil (50- to 200-mm depth) properties for equations 1 and 2 parameters (i.e., Pa, oc, /3, K, and A). When equation parameters reflected surface soil properties, predicted soluble P concentrations (0.09 mg/l average) were greater than measured values (0.02 mg/l average). The improvement in soluble P prediction using sub- soil properties reflects the fact that because the gullied water- sheds were severely eroded the main zone of interaction be- tween soil and rainfallhnoff and source of runoff sediment primarily involves subsoil material.
The release of soil NO,-N and transport in runoff was not predicted. Due to the mobility of NO,-N in the soil profile with infiltrating water, the amount of N03-N in surface soil and runoff is not closely related (33), precluding accurate NO,-N prediction in runoff.
Pmiiczdutk? nuhients. Total N, particulate P, and bioavailable particulate P concentrations of runoff were calculated from the respective surface soil contents and enrichment ratios (ER) of total N (NER), total P (PER), and bioavailable P
(c) SWCS. For Individual Use Only.

SURFACE WATER IMPACTS 47
50
20
10
5 -
2 -
(BIOER), as follows: Total N = soil total N x sediment conc. x NER
Bioavailabk particulate P = soil bioavailable P x sed. conc. x BIOER
t31 Particulate P = soil total P x sediment conc. x PER [41
[s] where the units are m a g for soil nutrient content and g/l for sediment concentration of runoff. The enrichment ratios from soil loss (kg/ha) were predicted using the following equation developed by Sharpley (27):
ln(ER) = 1.21 - 0.16 ln(soi1 loss) 161 Accurate predictions of particulate nutrient concentra-
tions in runoff from watersheds with and without cover crops (Figures 5 and 6) were obtained for a wide range of measured values. The error in total N, particulate P, and bioavailable particulate P prediction was 1.76,0.56, and 0.05 mg/l, respec- tively, which represented 1396, 14%, and 10% of the mean annual concentration for all watersheds. As for soluble P, subsoil properties were used in equations 3 to 5 for the gullied Little Washita watersheds. Using surface soil properties, predicted total N, particulate P, and bioavailable particulate P concentrations (an average 41.93, 15.15, and 1.15 mg/l, respectively) were appreciably greater than measured values (an average 17.31, 6.66, and 0.17 mgJ, respectively).
As the predictive relationship between enrichment ratio and soil loss (equation 6) is logarithmic, predicted values of enrichment ratio will be affected more by a unit quantity of soil loss at low values of loss (<45 pounds soil/acre/year) than at higher values of loss (>450 pounds soil/acre/year). Addi- tional testing of equation 5 has shown that this relationship may vary among watersheds of differing management (32). Consequently, making slope and intercept values of equation 5 a function of factors affecting soil loss or runoff energy, such as rainfall intensity, vegetative cover, and management prac- tices, should improve the prediction of enrichment ratio and, thus, particulate nutrient transport in runoff. This modifica- tion may be of particular importance to systems incorporating cover crops and reduced tillage, where a greater amount of organic and fine-sized material may be transported relative to conventional systems.
Management implications
- Total N
- y = -0.29 + 1.05X - r 2 = 0.97 - 3
- - 1:l
Relationship -
From this overview, it is apparent that we must answer several questions regarding the efficient use of cover crops in management systems to bring about a further improvement in both soil productivity and surface water quality. These ques- tions involve the effect of cover crops on the dynamics of soil nutrient cycling, crop and residue management, and improved simulation of nutrient transport and its bioavailability.
Sustainable or low-input agricultural systems will rely more heavily on residual soil N and P to meet crop nutrient requirements. Also, under reduced tillage practices or contin- uous heavy fertilizer, manure, or sludge applications, N and P may accumulate in certain soil horizons. Is it, thus, possible to select a cover crop that may have a higher affinity or require- ment for N and P and thereby reduce soil nutrient stratifica- tion? Alfalfa, for example, has reduced subsoil NO,-N accu- mulations (I 7). May the same be true for surface soil accumu-
50 I Particulate P I lo 1 y r * = = 16.61 0.96 + 0.99~ J* ] 1 .o
1 1 I I
1 2 5 10 20 50
MEASURED (mg/l) Figure 6. Relationship between measured and predicted total Nand particulate P of runoff fromOklahomawatersheds,with and without cover crops.
lations of P? It is possible that by using residual soil N and P, cover crops will reduce the amount of nutrients potentially available to be transported to surface waters.
In some management systems, the cover crop is killed before maturity to minimize water and light competition with the subsequent crop. What affect will this have on the amount of N and P in runoff? If the cover crop is not harvested but plowed into the soil, is the subsequent availability of residual N and P greater or less than that prior to uptake? Several studies have shown an increase in N and P availability in soil following decomposition of incorporated crop residues (28, 36). If the crop residue remains near the soil surface, as in reduced-tillage systems, subsequent nutrient availability will be of importance to potential N and P enrichment of runoff.
With an increase in soil-nutrient stratification and amounts in organic forms, are soil test procedures adequate to deter- mine positional and chemical availability? This may be of particular importance in reduced-tillage systems and where a cover crop is returned to the soil, contributing to an increase in organic matter content of the surface soil. In these situa- tions, mineralizable organic P may be an important source of P to crops (13. 26) and runoff. Soil test methods must, therefore, estimate or give credit for this mineralizable or- ganic-P pool, to avoid potentially excessive fertilizer-P appli- cations.
It is apparent from the above discussion that cover crops reduce soil, N, and P losses in surface runoff, although the
(c) SWCS. For Individual Use Only.

48 COVER CROPS FOR CLEAN WATER
proportion that is bioavailable both in soluble and particulate forms may increase. Is this increase in bioavailability sufficient to increase the short- and long-term biological productivity of receiving water bodies? In all examples given, soluble P and total P concentrations of runoff were consistently above the critical value associated with accelerated eutrophication of a water body (0.01 and 0.02 ppm, respectively). Thus, inclusion of cover crops in agricultural systems may not eliminate the risk of runoff stimulating eutrophication of a receiving water body. In the case of N with or without cover crops, NO,-N concentrations were below 10 and 100' ppm, considered as maximum potable levels for humans and livestock (39). In general, ammonium-N (NH,-N) concentrations were below recommended limits of 0.5 and 2.5 ppm for human consump- tion and fish survival (39).
Furthermore, as cover crops reduced N and P losses in surface runoff, but not their bioavailability, should eutrophi- cation-agricultural management decisions be based on total losses or bioavailability? Several studies of the association between P loading and biological productivity of lakes have indicated little decrease in productivity with reduced total P inputs and have attributed this to an increased bioavailability of P entering lakes (12, 16, 48). Consequently, the measure- ment of P bioavailability, as both soluble P and bioavailable particulate P, is essential to more accurately estimate the impact of agricultural management practices on the biological productivity of surface waters.
Although accurate predictions of nutrient transport in runoff can be obtained using kinetic and enrichment ratio approaches, are the processes by which cover crops affect surface water quality adequately simulated? For instance, the effects of cover crops on the physical processes controlling detachment and transport of particulates in runoff are better defined than the release of nutrients from soils and crops to runoff. This is complicated by the effect of cover crops on the degree of interaction between surface soil and runoff; initiat- ing nutrient extraction and transport; and the differential release of N and P from vegetation as a function of several soil and crop factors, such as soil nutrient status, soil-water content, crop type, and growth stage. Even though it is well established that nutrient leaching from crops can be an important source of nutrients in runoff, there has been limited success in simulating these processes, particularly for growing plants.
Three areas of research are suggested that should provide answers to these questions.
Systems research. Information is needed on the long-term effects of conservation systems, including cover crops, on the dynamics of soil nutrient cycling, in terms of the build-up of soil N and P in organic forms, fertilizer use, and transfer of bioavailable forms to runoff. In addition, a better understand- ing is needed of the effect of cover crops on the use of accumulated subsoil N and surface soil P, as they influence soil productivity and water quality.
Interdisciplinmy research. More emphasis should be placed on interdisciplinary research crossing agricultural and limno- logical boundaries. Considerable research has been con- ducted to quantify nutrient losses in runoff as a function of
1.
2.
3.
4.
5.
6.
7.
8.
9.
10.
11.
12.
13.
14.
15.
16.
17.
18.
REFERENCES
crop cover and management. However, it is still difficult to relate the potential bioavailability of N and P in runoff to a quantitative description of the biological response of a water body.
Modeling research. Research should be directed toward improving the partitioning of soluble, particulate, and espe- cially bioavailable forms transported in runoff from agricul- tural systems of differing vegetative cover. With the increased vegetative soil cover and possible return of residues to the surface soil afforded by cover crops, the relative importance of the partitioning processes controlling soluble nutrient release to runoff may need to be reevaluated. In addition, more accurate simulation of the dynamics of soil and crop residue nutrients with long-term cover crop use is needed. With the move to low-input sustainable agricultural systems, including cover crops, these model improvements will enable a more reliable evaluation of their impact on surface water quality.
Angle, J. S.,G. McClung, M.C. McIntosh,P. M.Thomas,andD.C. Wolf. 1984. Nutrient losses in runoff from conventional and no-till corn watersheds. J. Environ. Qual. 13:431-435. Berg, W. A., S. J. Smith,andG. A. Coleman. 1988. Management effects on runoff. soil, and nutrient losses from highly erodible soils in the Southern Plains. J . Soil and Water Cons. 43407-410. Bjork, S. 1972. Swedish lake restoration program gets results. Ambio
Burwell, R. E.. D. R. Timmons, andR. F. Holt. 1975. Nutrient transport in surface runoff as influenced by soil cover and seasonal periods. Soil Sci. SOC. Am. Proc. 39:523-528. Carignan, R., and J. Kalff. 1980. Phosphorussources for aquatic weeds: Water or sediments. Science 207:987-989. Cowen, W. F., and G. F. Lee. 1973. Leaves as a source of phosphorus. Environ. Sci. Technol. 7:853-854. DeCoursey, D. G. 1985. Mathematical models for nonpoint source pollution control. J . Soil and Water Cons. 40:408-413. Dorich, R A.. D. W. Nelson, and L. R. Sommers. 1985. Estimating algal available phosphorus in suspended sediments by chemical extraction. J . Environ. Qual. 14400-405. Eckert, D. J. 1988. Rye cover crops for no-tillage corn and soybean production. J . Production Agr. 1:207-210. Frye, W. W., and R. L. Blevins. 1989. Economically sustainable crop production with legume cover crops and conservation tillage. J . Soil and Water Cons. 4457-60. Gburek, W. J., and W. R. Heald. 1974. Soluble phosphate output of an agricultural watershed in Pennsylvania. Water Resources Res. 10:113- 118. Gray.C.B.J., an:R A. Kirkland. 1986.Suspendedsedimentphosphom composition in tributaries of the Ohnagan Lakes, BC. Water Res.
Harrison, R. A. 1987. Soil organic phosphorus. A review of world literature. C.A.B Int, Wallingford, Oxon, Eng. 257 pp. Klausner, S. D., P. J. Zwerman, and D. F. Ellis. 1974. Surface runoff losses of soluble nitrogen and phosphorus under two systems of soil management. J . Environ. Qual. 3:42-46. Langdale,G. W., R. A. Leonard, and A. W.Thomas. 1985. Conservation practice effects on phosphorus losses from southern Piedmont water- shedr. J . Soil and Water Cons. 40:157-160. Logan, T. J. 1982. Mechanisms for release of sediment-bound phos- phate to waterandtheeffectsof agricultural landmanagemen t onf2uvial transport ofparficulateanddissolvedphosphates. Hydrobiologia92519- 530. Mathers, A, C., B. A. Stewart, and B. Blair. 1975. Nitrate nitrogen removalfrom soil profiles by alfalfa. J . Environ. Qual. 4403-405. Muir, J., E. C. Seim, andR. A. Olson. 1973. Astudyoffactors influencing
1~153-165.
201193-1 196.
(c) SWCS. For Individual Use Only.

SURFACE WATER IMPACTS 49
19.
20.
21.
22.
23.
24.
25.
26.
27.
28.
29.
30.
31.
32.
33.
34.
35.
36.
37.
38.
39.
40.
41.
42.
43.
44.
45.
the nitrogen and phosphorus contents of Nebraska waters. J . Environ.
Pesant, A. R., J. L. Dionne, and J. Genest. 1987. Soil andnutrient losses in surface runofffrom conventional andno-till corn systems. Can. J. Soil Sci. 672335-843. Peters, R. H. 1981. Phosphorus availability in Lake Memphremagog and its tributaries. Limnol. Oceanogr. 261 150-1 161. Sawyer, C. N. 1947. Fertilization of lakes by agricultural and urban drainage. J. New England Water Works Assoc. 61:109-127. Schreiber, J. D., and L. L. McDowell. 1985. Leaching of nitrogen, phosphorus, and organic carbon from wheat straw residues: I. Rainfall intensity. J. Environ. Qual. 14:251-256. Sharpley, A. N. 1981. The contribution ofphosphorus leachedfrom crop canopy to losses in surface runoff. J. Environ. Qual. 10160-165. Sharpley, A. N. 1983. Effectofsoilpropertiesonthe kineticsofphospho- rus desorption. Soil Sci. S o c . Am. J. 47:462-467. Sharpley, A. N. 1985. Depth of surface soil-runoff interaction as af- fected by rainfall, soil slope and management. Soil Sci. SOC. Am. J.
Sharpley, A. N. 1985. Phosphorus cycling in unfertilized and fertilized agricultural soils. Soil Sci. SOC. Am. J. 49:905-911. Sharpley, A. N. 1985. The selective erosion ofplant nutrients in runoff. Soil Sci. SOC. Am. J. 49:1527-1534. Sharpley, A. N., and S. J. Smith. 1989. Mineralization and leaching of phosphorus from soil incubated with surface-applied and incorporated crop residues. J. Environ. Qual. 18:lOl-105. Sharpley, A. N., and S. J. Smith. 1989. Prediction ofsolublephosphorus transport in agricultural runoff. J. Environ. Qual. 18:313-316. Sharpley, A. N., S. J. Smith, J. R. Williams, 0. R. Jones, and G.A. Coleman. 1991. Water quality impacts associated with sorghum culture in the Southern Plains. J. Environ. Qual. 2 0 239-244. Sharpley, A. N., S. J. Smith, and J. W. Naney. 1987. The environmental impact of agricultural nitrogen and phosphorus use. J. Agr. Food Chem.
Sharpley, A. N., S. J. Smith, and R. G. Menzel. 1991. Nutrient enrich- ment in runoffandlandmanagement. In Proc. 5th Interagency Sedimen- tation Conf. 11:25-32. Sharpley, A. N., S. J. Smith, W. A. Berg, and J. R. Williams. 1985. Nutrient runoff losses as predicted by annual and monthly soil sampling. J . Environ. Qual. 14:354-360. Sharpley, A. N., W. W.Troeger, andS. J. Smith. 1991. The measurement of bioavailable phosphorus in agricultural runoff. J. Environ. Qual. 2 0
Smith, M. S., W. W. Frye, and J. J. Varco. 1987. Legume winter cover crops. Adv. Soil Sci. 7:95-139. Smith,S. J.,andA. N.Sharpley. 1990.Soilnitrogenmineralizationinthe presence of surface and incorporated crop residues. Agron. J. 82: 112- 116. Timmons, D. R., R. F. Holt, and J. J. Latterell. 1970. Leaching of crop residues as a source of nutrients in surface runoff water. Water Re- sources Res. 6: 1367-1375. U.S. Environmental Protection Agency. 1971. Algal assay procedure - Bottle test. Nat. EutmphicationRes. Program, Pacific N.W. Lab., Corvallis, Ore. 82 pp. U.S. Environmental Protection Agency. 1973. Water quality criteria. Washington, DC. US. Environmental Protection Agency. 1984. Report to Congress: Nonpoint source pollution in the US. Washington, DC. Vollenwieder, R. A., and J. Kerekes. 1980. The loading concept as a basis for controlling eutrophication: Philosophy and preliminary re- sults of the OECD program on eutrophication. Progr. Water Technol.
Wagger, M. G., and D. B. Mengel. 1988. The role of nonleguminous cover crops in the efficient use of water andnitrogen. In W. L. Hargrove et al. [eds.] Cropping Strategies for Efficient Use of WaterandNitrogen. Spec. Pub. No. 51. Am. SOC. Agron., Madison, Wis. pp. 115-127. Walton, C. P., and G. F. Lee. 1972. A biological evaluation of the molybdenum blue method for orthophosphate analysis. Tech. Int. Ver. Limnol. 18:676-684. Wendt, R. C., and R. B. Corey. 1980. Phosphorus variations in surface runofffrom agricultural lands as afunction of land use. J. Environ. Qual.
White, E. M. 1973. Water leachable nutrients from frozen or dried prairie vegetation. J. Environ. Qual. 2: 104-107.
Q ~ a l . 2~466-470.
49: 10 10-1 015.
36~8 12-8 17.
255-268.
12538.
9: 130-136.
46. Wildung, R. E., R. L. Schmidt, and A. R. Gahler. 1974. The phosphorus status of eutrophic lake sediments as related to changes in limnological conditions -- Total, inorganic, and organic phosphorus. J. Environ. Qual. 3:133-138. Yoo, K. H., J.T.Touchton,andR. H. Walker. 1988.Runoff,sedimentand nutrient losses from various tillage systems of cotton. Soil Tillage Res.
Young, T. C., and J. V. DePinto. 1982. Algal-availability ofparticulate phosphorus from diruse and point sources in the lower Great Lakes basin. Hydrobiologia 91:111-119. Zhu, J. C., C. J. Gantzer, S. H. Anderson, E.E. Alberts, and P.R. Beuselinck. 1989. Runoff, soil, anddissolvednutrient losses from no-till soybean with winter cover crops. Soil Sci. SOC. Am. J. 53:1210-1214.
47.
12:13-24. 48.
49.
(c) SWCS. For Individual Use Only.

50 COVER CROPS FOR CLEAN WATER
ROIPR-CT-NC .'. ROIPR-NT-NC 0 Preclp-NC - P n ~ l p - c w + ROIPR-CT-COV f ROIPR-NT-COV
Effect of cereal grain winter cover crops on surface water pollutant transport
from Coastal Plain corn production systems
K. W. Staver and R. B. Brinsfield
In the last two decades, water quality and economic pro- ductivity have declined drastically in the Chesapeake Bay (7). As a result of the link established between nutrient loading and water quality degradation, the current strategy for restor- ing the Chesapeake Bay focuses on reducing nitrogen (N) and phosphorus (P) inputs to the bay. A recent agreement among the states in the Chesapeake Bay drainage basin calls for reducing both N and P inputs to the bay by 40% by the year 2000.
Current estimates of nutrient inputs for the State of Mary- land, which contains essentially all of the shoreline of the mid- and upper bay, attributes over 40% of the total P and 30% of the total N to agricultural activities (3). Thus, it is likely that achieving overall nutrient reduction goals for the Chesapeake Bay will require reductions in both N and P transport from agricultural land.
The flat topography that is typical of agricultural land lying within the Coastal Plain region of the Chesapeake Bay drain- age basin reduces the potential for high rates of soil erosion. Consequently, dissolved nutrient losses can constitute a sig- nificant portion of total nutrient losses from agricultural land, especially where reduced-tillage practices further depress rates of soil loss.
We have identified nitrate (NO,) leaching into shallow groundwater as the dominant flow path for N from Coastal Plain corn (Zea mays L.) production systems (5), while orthophosphate losses in surface runoff constitute the single largest component of hydrologic P losses (6). Thus, achieving major reductions in nutrient losses from Coastal Plain agricul- tural systems will require implementation of nutrient manage- ment practices other than those aimed solely at erosion control.
One practice we demonstrated to have potential for reduc- ing NO, leaching losses is to plant cereal grain winter cover crops (2). While the ability of cereals to conserve leachable ions in the plow layer has long been recognized (4), as has the importance of vegetative cover for reducing soil erosion (a), their role in dissolved nutrient transport in surface runoff is less clear.
Evidence indicating that P leaching from plant residues on the soil surface increases dissolved P concentrations in runoff from no-till systems (I), suggests that winter cover crops will alter runoff solute levels, especially in areas where cover crop residues are not incorporated. In this study, we evaluated the effect of cereal grain cover crops on surface runoff transport
K . W . Staver and R . B . Brinsjield are researchers with the Department of Agricultural Engineering. Maryland Agricultural Experiment Station, University of MarylandSystem, P.O. Box 169, Queenstown, Maryland 21658.
of N and P from corn production systems in the Atlantic Coastal Plain.
Methodology
This research is an extension of a 5-year study evaluating the effect of tillage on hydrologic transport of nutrients from corn production systems in the Maryland Coastal Plain. Since 1984, surface runoff has from two adjacent, naturally defined watersheds under no-till (21 .O acres) and conventional tillage methods (14.6 acres), planted continuously in corn, have been monitored using calibrated flumes and a volume-based auto- mated sampling system (5). Soils in both watersheds belong to the Mattapex association of silty, moderately well-drained, and nearly level soils (0% to 3% slopes).
Chisel plowing is the major tillage operation employed in the conventional till watershed in conjunction with disking and the use of a field cultivator. From 1984 to 1988 we initiated spring tillage just prior to seedbed preparation and planting in early to mid May. We applied N and P identically to both systems for expected yields of 120 bushels/acre. At planting we added 30 pounds/acre of N as an ammonium-nitrate (NH,-NO,)-urea solution, and 30 to 50 days after planting we dribbled 110 pounds/acre N on the surface as a 30% solution of NH,-NO,. We applied P in solution with N at planting in a band 2 inches to the side and 2 inches below the seed at a rate of 22 pounds/acre. After grain harvest around mid-Septem- ber, we chopped stalks.
Following the 1984-1987 growing seasons, the watersheds remained fallow until the next growing season. After the 1988- 1989 grain harvests, we no-till-drilled rye (Secale cereale L.) into both watersheds on about October '1 at a rate of (3 bushels/acre (1 68 kg/ha). To prevent management difficul- ties associated with excessive spring growth (tillage, planter, and sprayer interference, as well as elevated carbon (C) to N ratios in cover crop residues), we initiated spring tillage and herbicide applications well in advance of corn planting. In 1989, above-average precipitation delayed initial activities until late March, while in 1990 we chisel-plowed the conven-
4 0.2
2 0.1
n n " " Oct Nov Dec Jan Feb Mar Apr
Figurel. Averagemonthlyprecipitationandrunoff (R0)toprecipitation (PR) ratlowith (1988-1990)and without (1 9811 988) a ryewinter cover crop.
(c) SWCS. For Individual Use Only.
SURFACE WATER IMPACTS 51
6
4;
3 -
2 -
1 ,
n
tionally tilled watershed and the no-till-treated watershed with glyphosate on about March 15. Following these opera- tions, the watersheds remained undisturbed until just prior to corn planting.
As an additional component of this study, in 1989 we investigated the leaching of nutrients from rye biomass after herbicide treatment. We placed rye samples from an area of the no-till study area, sprayed on April 24, over collection containers at field-equivalent densities. We collected and analyzed all leachate resulting from natural rainfall for N and P components for a 10-week period.
No courr-TDP . Comr-TDP + No conr-TP f CoWl-TP
t +
Results and discussion
1 .a-
Although the presence of a winter cover crop certainly changes evaporation and infiltration patterns at the soil sur- face, these changes appear to be minor relative to the influ- ence of precipitation patterns on surface runoff volume (Fig- ure 1). Although the marked differences in precipitation patterns between the no cover (1985-1988) and cover (1988- 1990) periods of this study make discerning cover crop effects difficult, cover crops appear to have reduced the potential for surface runoff during late winter. The sharp drop in the conventional-till runofflprecipitation ratio in April for the cover treatment resulted primarily from extreme surface
=
CT - Surlnco runolf N (ppm)
- 1 I
+
Oct N w Dec Jan Feb Mar Apr
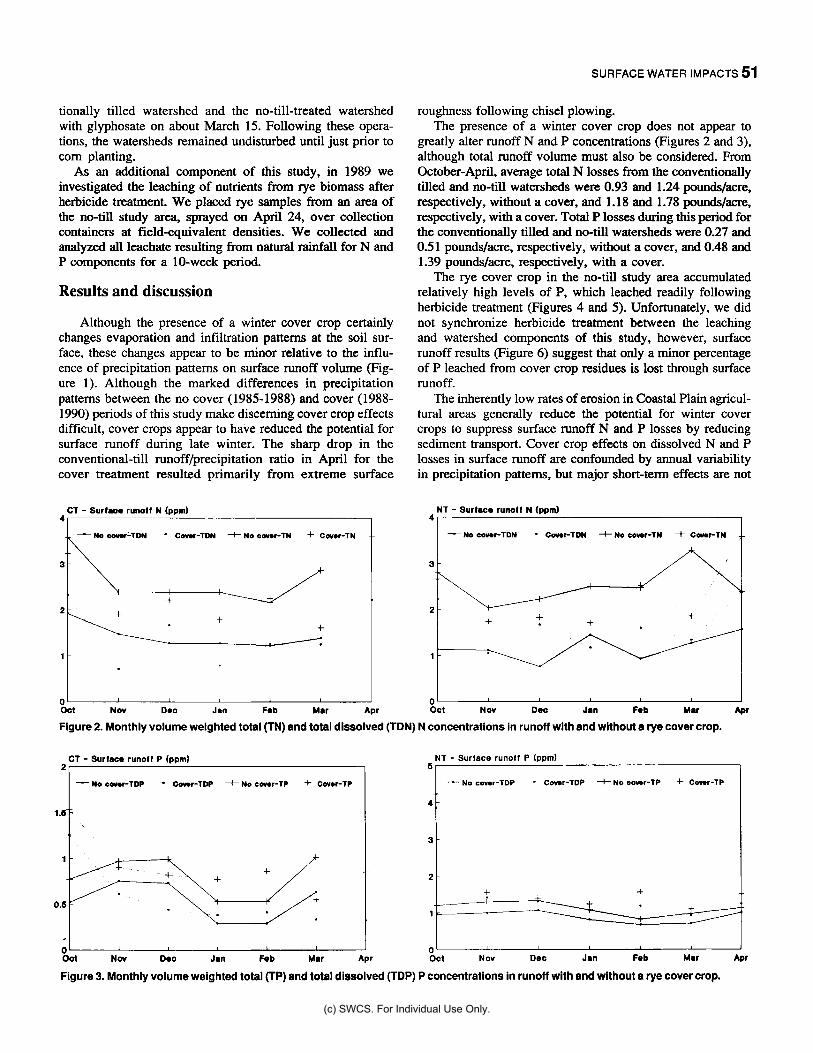
roughness following chisel plowing. The presence of a winter cover crop does not appear to
greatly alter runoff N and P concentrations (Figures 2 and 3), although total runoff volume must also be considered. From October-April, average total N losses from the conventionally tilled and no-till watersheds were 0.93 and 1.24 pounds/acre, respectively, without a cover, and 1.18 and 1.78 pounds/acre, respectively, with a cover. Total P losses during this period for the conventionally tilled and no-till watersheds were 0.27 and 0.51 pounds/acre, respectively, without a cover, and 0.48 and 1.39 pounddacre, respectively, with a cover.
The rye cover crop in the no-till study area accumulated relatively high levels of P, which leached readily following herbicide treatment (Figures 4 and 5) . Unfortunately, we did not synchronize herbicide treatment between the leaching and watershed components of this study, however, surface runoff results (Figure 6) suggest that only a minor percentage of P leached from cover crop residues is lost through surface runoff.
The inherently low rates of erosion in Coastal Plain agricul- tural areas generally reduce the potential for winter cover crops to suppress surface runoff N and P losses by reducing sediment transport. Cover crop effects on dissolved N and P losses in surface runoff are confounded by annual variability in precipitation patterns, but major short-term effects are not
NT - Surface runolf N (ppm) 4
- No covar-TDN - C a r - T O N +No conr-TN + C a r - T N
3 -
+ + t +
1 -
0 ' I Oct N ov Doc Jan Fob Mar m
Figure 2. Monthly volume weighted total (TN) and total dissolved (TDN) N concentrations in runoff with and without a rye cover crop.
CT - Surfaco runoff P ( o m )
-No Comr-TDP - Conr-TDP +No COWr-TP + CWW-TP &I
- I I " - Oot N w Doo Jan Fe b Mar Apr Oct N ov Dec Jan Fe b Mar m Figure 3. Monthly volume weighted total (TP) and total dissolved (TDP) P concentrations in runoff with and without a rye cover crop.
(c) SWCS. For Individual Use Only.

52 COVER CROPS FOR CLEAN WATER
Leachate nutrient8 (ppm) Daily rainfall (in) 3
Dirsolved N
DI*aolvod N
-+ OI8801ved P I - 0 Ralnfali I 20
15
10
6
0 May 1 June 1
+. I . Ir---
July 1
2.5
2
1.5
1
0.5
0
Figures. Daily rainfallandaveragedissolved Nand Pconcentrations In leachatefromryesamplestreatedwlthparaquatonApril24,1989.
16
12
0
4
0
:umulative leaching loss (Iblac)
Nltroaen
- Phoaphorur 17.5 lblac
Figure5. Cumulative Nand P leachedfromaboveground rye biomass treated with paraquat on April 24,1989.
March April May
Figure 6. Runoff depth and volume weighted dissolved N and P concentrations in runoff beforeand aftertreatment of cover cropwith paraquat.
apparent. We need additional information on the long-term effects of winter cover crops on hydrologic processes before we can accurately assess their value for reducing surface runoff nutrient transport from Coastal Plain agricultural watersheds.
REFERENCES
1.
2.
3.
4.
5.
6.
7.
8.
Barisas, S. G., J. L. Baker, H. P. Johnson, and J. M. Laflen. 1978. Effect of tillage systems on runoff losses of nutrients. a rainfall simulation
Brinsfield, R. B., and K. W. Staver. 1989. Cover crops: A paragon for nitrogen management. In Ground Water Issues and Solutions in the Potomac River BasinlChesapeake Bay Region. Nat. Well Water Assoc., Dublin, Ohio. pp. 271-285. Chesapeake Bay Program. 1988. Baywide nutrient reduction strategy. Annapolis, Md. Morgan, M. F., and 0. E. Street. 1938. The role of cover crops in the maintenance of fertility of tobacco soils. Conn. Agr. Exp. Sta. Bull. 410382-392. New Haven. Staver, K. W., R. B. Brinsfield, and W. L. Magette. 1988. Nitrogen export from Atlantic Coastal Plain soils. Paper No. 88-2040. Am. SOC. Agr. Eng., St. Joseph, Mich. Staver, K. W.. R. B. Brinsfield, and W. L Magette. 1988. Tillage eflects on phosphorus transport from Atlantic Coastal Plain soils. Paper No. 88-2651. Am. SOC. Agr. Eng., St. Joseph, Mich. U.S. Environmental Protection Agency. 1983. A profile of environmen- tal change. Chesapeake Bay Program, Annapolis, Md. Wischmeier, W. H. 1976. Cropland erosion and sedimentation. In Control of Water Pollution from Cropland, Vol. I I . Rpt. No. ARS-H-5- 2. Agr. Res. Serv., US. Dept. Agr., Washington, D.C. pp. 31-57.
study. Tran~., ASAE 21:893-897.
(c) SWCS. For Individual Use Only.

SURFACE WATER IMPACTS 53
Water quality impacts of winter rye cover with selected best management practices
in Pennsylvania
J. M. Hamlett and K. Brannan
As society and the agricultural industry recognized the impacts of runoff, erosion, and nutrient losses on the environ- ment in the 1980s, the Chesapeake Bay began to receive more attention. In fact, a 1983 U.S. Environmental Protection Agency (EPA) report (5) indicated that water quality degra- dation was destroying the aquatic habitat within the bay, Agricultural nonpoint pollution was identified as a principle contributor. Programs were initiated to decrease this source and Pennsylvania, the state with the largest agricultural area in the Chesapeake Bay drainage area, was mandated to reduce total agricultural loading to the bay. For the last 5 years, efforts have been ongoing to identify and implement improved nutrient management programs to minimize excess applica- tion of nutrients to agricultural land and thereby decrease the potential for nutrient runoff and leaching losses.
To fulfill the EPA mandate, the agricultural community pursued alternative tillage practices, cropping systems, and nutrient management programs that would ensure crop pro- ductivity, yet still decrease soil and nutrient losses.
Throughout the 1980s, conservation tillage practices, such as chisel tillage, no-till, and mulch-till, as well as the more traditional soil conservation practices were adopted. Studies by Shirmohammadi and Shoemaker (4) and Hamlett and Epp (1) identified the combinations of nutrient management pro- grams and best management practices that minimize runoff, sediment transport, and nutrient losses from agricultural fields under Pennsylvania conditions. Focus has recently shifted to reducing nutrient and pesticide usage in crop production by relying more on natural crop rotations, green manure crops, and cover crops to provide soil protection and crop nutrient needs. Evidence (2) suggests that nutrient inputs can be decreased while maintaining crop production.
The purpose of our study was to determine if a winter rye cover crop would help protect against erosion and minimize nutrient losses during the nongrowing season. We used the CREAMS simulation model to evaluate the hydrologic, ero- siodsediment transport, and nutrient responses resulting from the rye crop combined with six conservation practices and two nutrient management programs.
Methods and procedures
We used the CREAMS model as described by Knisel (3) to simulate the movement of sediment and nutrients from
J . M Hamlett is assistant professor, and K. Brannan is research assisranre. Department of Agricultural and Biological engineering, Pennsylvania Slate University, University Park, Pennsylvania 16802.
three selected fields in Pennsylvania over a 30-year period. Each field represented a different soil, cropping, and livestock enterprise, and characterized large areas within Pennnsylvania. The sites are referred to as Adams, Union, and Wyoming and are described in table 1. Hamlett and Epp (I) provide detailed descriptions of the fields and crop systems selected for study.
For each site, we investigated six best management prac- tices with and without a winter cover of rye. We used conven- tional tillage without any conservation practice as the baseline best management practice. Other best management practices included no-till, contouring with grassed waterways, graded terraces with grassed waterways, parallel tile outlet terraces, and water and sediment control basins. We assumed conven- tional tillage for all these practices except no-till. Winter rye, where modeled in combination with the best management practices, assumes that the rye provides a cover during winter and early spring. During spring tillage, we plowed under the cover crop for conventional tillage or left it on the surface for no-till. Then we planted the next crop in the rotation. For crop rotations that include meadow, no rye is needed during the winter period following the oats and meadow cropping years.
We selected two nutrient management programs, a typical program and an improved program, for modeling in combina- tion with the six best management practices. The typical nutrient managment program represented traditional appli- cations of manure, as indicated in table 1, where farmers apply commercial fertilizers without any special consideration for water quality or off-site concerns. We obtained data for these nutrient management programs from surveys conducted by the local soil conservation districts.
Improved nutrient management programs incorporated the recommended manure and commercial fertilizer rates and timings that were optimum for the crops, soils, and yield goals at each site. These programs were based on the available county data and recommendations by Pennsylvania state extension specialists. At the Adams site, the improved nutri- ent management program assumed that the turkey manure was stored and applied with incorporation every 4 months. Likewise, for improved nutrient management programs at the Union and Wyoming sites, it was also assumed that the manure was stored over winter and applied with incorporation during early spring. Table 2 provides a comparison of the nutrients applied for the typical and improved nutrient man- agement programs for the Union site.
Results and discussion
The rye winter cover affected the hydrologic, sediment transport, and nutrient movement responses at all sites; the magnitude of the changes depended on nutrient management, best management practices, and field characteristics.
Hydrology. In all cases, runoff and percolation decreased, and the evapotranspiration increased as a result of the rye crop. Terraces combined with rye cover decreased runoff the most, whereas the sediment basin at the field edge was no more effective in reducing runoff than the baseline best management practice. When analyzing all practices with rye or all practices without rye, percolation was greater for all the
(c) SWCS. For Individual Use Only.

54 COVER CROPS FOR CLEAN WATER
best management practices as compared with the baseline best management practices.
Sediment transport. At each site, the cover crop reduced sediment loss for all the best management practices. This undoubtedly resulted because the rye cover protected the surface and decreased runoff from the field. Of the best man- agement practices evaluated at the Union site, terraces and the sediment basin with and without rye were most effective in reducing sediment loss from the field. Contouring was least effective and no-till was slightly less effective than the terraces.
Nutrient movement. Total nitrogen (N) losses varied con- siderably from site to site, likely because of the differences in runoff, percolation, and sediment losses and the tremendous differences in nutrient management we used. In all cases, the improved nutrient management programs decreased the total N losses. Figure 1 shows this effect for the Union site. In addition, the rye cover also decreased N losses for any given best management practice and type of nutrient management program. For example, at the Union site the total N losses were greater than 125 pounds/acre/year for the baseline best management practice with the typical nutrient management program and no rye cover. With the rye cover, N losses were reduced to less than 90 pounds1acreJyear. When rye was combined with the improved nutrient management program, losses were reduced to 65 pounds/acre/year. No-till or the structural best management practices combined with the improved nutrient management program and rye cover re- duced N losses the most.
Typically, best management practices that decrease runoff and erosion result in increased percolation, which can lead to increased nitrate (NO,) leaching. This was not the case for the rye cover crops used in combination with any of the best management practices. The rye cover reduced runoff and
erosion while reducing percolation for any given best manage- ment practice. The N uptake of rye during the winter-spring season (a time when leaching is often greatest) tended to decrease the amount of soil NO, available for leaching. Figure 2 illustrates the effects of the rye cover, best management practices, and nutrient management programs on NO, leach- ing losses at the Union site. Note that the use of the improved nutrient management program is the most effective single approach to reduce NO, leaching; the rye cover combined with the improved nutrient management program is the most effective control program, with total leaching losses at or below 5 pounds/acre/year.
Like N losses, phosphorus (P) losses varied from site to site, depending on best management practices, nutrient manage- ment programs, and the use of rye. Total P losses for the Union site with no control practice were greater than 50 pounds/ acrelyear. The rye cover reduced some losses, however, the use of rye cover with improved nutrient management pro- grams was most effective. The control of P losses was least effective with contouring, and the degree of control was comparable among the three structural best management practices and no-till.
In conclusion, the CREAMS model provides a useful tool for comparing the relative effectiveness of various control alternatives for differing field, soil, cropping, and nutrient management situations. Of the control approaches we evalu- ated in this study, the use of an improved nutrient manage- ment program provided the greatest degree of control. Also, the use of the rye cover appeared to be favorable in all cases, particularly on fields with steeper slopes and for reducing NO, leaching. For the greatest reduction in runoff, sediment loss, and surface nutrient loss, the structural best management practices provide the best control, particularly when com-
Table 1. Summary of field characteristics for the three study sites. Study Site Characteristics
Parameter Adarns Union Wyoming Field size (acres) 4.0 24.0 14.7 Average slope (feetlfeet) 0.075 0.10 0.16 Slope length (feet) 225 300 300 Watershed length to width ratio 1.93 2.76 1 .oo Base curve number 88 86 88
Soil Penn silt loam Edom silty clay loam Wellsboro silt loam Manure 'C-corn, W-winter wheat, S-soybeans. 0-oats, M-meadow.
Crop rotation* C-C-GW-S C CC-C-0-M-M-M
Turkey (spread every 4 months) Dairy (daily spread during winter) Dairy (daily spread during winter)
7 Nutrient Nitrogen Phosphorus Incorporation
Application Date (pounds/acre) (pounds/acre) (inches)
Manure' October 15 to April 15 36 31 Surface Typical nutrient management
Fertilizer April 30 200 26 3 Residual carryover September 30 89 0
Fertilizer May 10 10 9 3 Residual carryover September 30 109 0
Improved nutrient management Manure April 15 80 27 6
'Dairy manure is applied on daily basis.
(c) SWCS. For Individual Use Only.

SURFACE WATER IMPACTS 55
Soybean tillage and cover crop effects on water runoff
and soil erosion IzI Improved NMP with rye cover Improved NMP no cover crop Typical NMP with rye cover 1 Tvuical NMP no cover crop
Nod11
Bascline
0 50 I 0 0 150 200 Nitrogen Loss (Ib/ac/yr)
Flgure1.TotalN lossesforvariousbestmanagementpractices(BMP) and nutrlentmanagemen programs(NMP) withandwithout ryecover at the Union site.
I e/l linnrrrverl NMP with we cover 1 ii in+roved N M P 110 c o k crop Typjcal NMP with rye cover Typical NMP no cover crop
Sedimenl Basin
Par:illel Terraces
Graded Terraces
Baseline
0 10 20 30 Niuste Leached (Ibldclyr)
Figure 2. Nitrate leaching for various best management practices (BMP) and nutrient management programs (NMP) with and without rye cover at the Union site.
b i n d with the improved nutrient management programs and rye cover. No-till combined with the improved nutrient man- agement program was also quite effective in reducing pollut- ant losses.
As agricultural programs continue to develop, improved nutrient management and the use of protective cover crops may provide a balanced management plan. However, eco- nomic analyses of these various control approaches should be conducted to determine management practices that not only reduce nonpoint pollution but also conform to each farmers total financial plan.
REFERENCES
1.
2.
3.
4.
5.
Hamlett, J. M., and D. J. Epp. 1991. Effects of conservation and nutrient management practices on pollutant losses in Pennsylvania. In New Perspectives in the Chesapeake System: A Research and Management Partnership. Chesapeake Res. Consortium, Inc., Solomons, Md. Keeney, D. 1990. Sustainable agriculture: Definition and concepts. J. Production Agr. 3:281-285. Knisel, W. G., ed. 1980. CREAMS: Afield-scale model for chemical, runoff, and erosion for agricultural management systems. Cons. Serv. Rpt. 26. U.S. Dept. Agr., Washington, D.C. 640 pp. Shirmohammadi, A., and L. L Shoemaker. 1988. impact of best man- agement practices on water quality in Pennsylvania. Interstate Comm. on the Potomac River Basin Rpt. No. 88-7. Dept. Agr. Eng., Univ. Md., College Park. U.S. Environmental Protection Agency. 1983. Chespaeake Bay: A frameworkfor action. Region 111, Philadelpha, Pa.
Monroe Rasnake
Soybeans are a major cash crop in Kentucky. Soybeans were grown on 1.21 million acres in the state in 1990 and produced 37.5 million bushels of grain. This acreage repre- sents about one-third of the row-crop acreage in the state. Most of the soybeans are grown in western Kentucky on loess soils that are highly erodible (I). Add this to the fact that soybeans leave the soil more susceptible to erosion than corn (2) and other grain crops, and it is obvious that a potential for excessive erosion exists.
Small grain cover crops are effective in reducing soil erosion where the soil surface is otherwise unprotected (4). However, they have been less effective in some situations where crop residue from the soybean crop was left on the soil surface (3).
Establishing a small grain cover crop is expensive. Other benefits include nutrient conservation, but the primary reason for using a cover crop with soybeans is soil erosion control. The purpose of our study was to determine the effectiveness of a small grain cover crop in reducing soil erosion in a full- season soybean cropping system.
Methodology
I established research plots in the spring of 1985 to measure water runoff and soil loss from soybeans with different tillage systems. Individual plots were 12.5 feet wide and 72 feet long with all tillage and planting operations performed up and down the slope. I bordered plots on the upper end with a diversion terrace, on the sides with plywood edging, and at the lower-end with rain gutters designed to collect the runoff from each plot.
Runoff was directed through a 10-inch H-flume and onto a 12-inch Coshocton wheel designed to collect 1% of the runoff volume. I collected the runoff sample in a 30-gallon, plastic-lined container. The volume of each sample was mea- sured after each rainfall event and subsamples were collected to determine sediment, phosphorus (P), and potassium (K), content.
The treatments consisted of soybeans no-till planted in soybean residue, conventional tillage with fall chisel plowing and spring disking, and no-till planting in a wheat cover crop established with a fall disking. We replicated treatments three times in a randomized complete block design.
The soil was a Zanesville silt loam (Typic Fragiudalf, fine- silty, mixed, mesic) with slows of 7% to 9%. The soil has a
Monroe Ramake is an associate extension professor, University ofKenmky, Lexington, 40546. Project support was provided by the Tennessee Valley Authority Agricultural Institute. Muscle Shoals, Alabama.
(c) SWCS. For Individual Use Only.

SURFACE WATER IMPACTS 55
Soybean tillage and cover crop effects on water runoff
and soil erosion IzI Improved NMP with rye cover Improved NMP no cover crop
Tvuical NMP no cover crop
Nod11
Bascline
0 50 I 0 0 150 200 Nitrogen Loss (Ib/ac/yr)
Flgure1.TotalN lossesforvariousbestmanagementpractices(BMP) and nutrlentmanagemen programs(NMP) withandwithout ryecover at the Union site.
I e/l linnrrrverl NMP with we cover 1 ii in+roved N M P 110 c o k crop Typjcal NMP with rye cover Typical NMP no cover crop
Sedimenl Basin
Par:illel Terraces
Graded Terraces
Baseline
0 10 20 30 Niuste Leached (Ibldclyr)
Figure 2. Nitrate leaching for various best management practices (BMP) and nutrient management programs (NMP) with and without rye cover at the Union site.
b i n d with the improved nutrient management programs and rye cover. No-till combined with the improved nutrient man- agement program was also quite effective in reducing pollut- ant losses.
As agricultural programs continue to develop, improved nutrient management and the use of protective cover crops may provide a balanced management plan. However, eco- nomic analyses of these various control approaches should be conducted to determine management practices that not only reduce nonpoint pollution but also conform to each farmers total financial plan.
REFERENCES
1.
2.
3.
4.
5.
Hamlett, J. M., and D. J. Epp. 1991. Effects of conservation and nutrient management practices on pollutant losses in Pennsylvania. In New Perspectives in the Chesapeake System: A Research and Management Partnership. Chesapeake Res. Consortium, Inc., Solomons, Md. Keeney, D. 1990. Sustainable agriculture: Definition and concepts. J. Production Agr. 3:281-285. Knisel, W. G., ed. 1980. CREAMS: Afield-scale model for chemical, runoff, and erosion for agricultural management systems. Cons. Serv. Rpt. 26. U.S. Dept. Agr., Washington, D.C. 640 pp. Shirmohammadi, A., and L. L Shoemaker. 1988. impact of best man- agement practices on water quality in Pennsylvania. Interstate Comm. on the Potomac River Basin Rpt. No. 88-7. Dept. Agr. Eng., Univ. Md., College Park. U.S. Environmental Protection Agency. 1983. Chespaeake Bay: A frameworkfor action. Region 111, Philadelpha, Pa.
Monroe Rasnake
Soybeans are a major cash crop in Kentucky. Soybeans were grown on 1.21 million acres in the state in 1990 and produced 37.5 million bushels of grain. This acreage repre- sents about one-third of the row-crop acreage in the state. Most of the soybeans are grown in western Kentucky on loess soils that are highly erodible (I). Add this to the fact that soybeans leave the soil more susceptible to erosion than corn (2) and other grain crops, and it is obvious that a potential for excessive erosion exists.
Small grain cover crops are effective in reducing soil erosion where the soil surface is otherwise unprotected (4). However, they have been less effective in some situations where crop residue from the soybean crop was left on the soil surface (3).
Establishing a small grain cover crop is expensive. Other benefits include nutrient conservation, but the primary reason for using a cover crop with soybeans is soil erosion control. The purpose of our study was to determine the effectiveness of a small grain cover crop in reducing soil erosion in a full- season soybean cropping system.
Methodology
I established research plots in the spring of 1985 to measure water runoff and soil loss from soybeans with different tillage systems. Individual plots were 12.5 feet wide and 72 feet long with all tillage and planting operations performed up and down the slope. I bordered plots on the upper end with a diversion terrace, on the sides with plywood edging, and at the lower-end with rain gutters designed to collect the runoff from each plot.
Runoff was directed through a 10-inch H-flume and onto a 12-inch Coshocton wheel designed to collect 1% of the runoff volume. I collected the runoff sample in a 30-gallon, plastic-lined container. The volume of each sample was mea- sured after each rainfall event and subsamples were collected to determine sediment, phosphorus (P), and potassium (K), content.
The treatments consisted of soybeans no-till planted in soybean residue, conventional tillage with fall chisel plowing and spring disking, and no-till planting in a wheat cover crop established with a fall disking. We replicated treatments three times in a randomized complete block design.
The soil was a Zanesville silt loam (Typic Fragiudalf, fine- silty, mixed, mesic) with slows of 7% to 9%. The soil has a
Monroe Ramake is an associate extension professor, University ofKenmky, Lexington, 40546. Project support was provided by the Tennessee Valley Authority Agricultural Institute. Muscle Shoals, Alabama.
(c) SWCS. For Individual Use Only.

56 COVER CROPS FOR CLEAN WATER
fragipan at a depth of about 2 feet. The soil is typical of a large percentage of the soils used for soybean production in western Kentucky.
Results and discussion
Water runoff varied from year to year, depending on rainfall quantity and intensity (Table 1). The 1988-1989 winter period had abnormally high precipitation; November and February totals were more than twice the average. This resulted in extremely high levels of water runoff for that year. However, the relative amounts of runoff for the different treatments were similar to previous years. Water loss from conventional tillage plots was more than double that of the no- till plots. Use of a cover crop did not reduce water runoff as compared to soybean residue, but it did in two of the four seasons (1986-1987 and 1988-1989) compared with conven- tional tillage.
The pattern of soil loss was somewhat similar to that of water runoff, but the differences due to treatment were even more dramatic (Table 2). In all cases, soil loss with no-till was only a small percentage of that compared with conventional tillage. We recorded the greatest differences in the 1988-1989 season, when the heavy rainfall caused severe erosion on the unprotected conventional till plots. Even in this extreme situation, the soybean residue provided good protection on the no-till plots. As with water runoff, the wheat cover crop significantly reduced soil loss compared with conventional tillage without a cover crop. The cover crop, however, was apparently no more effective than soybean residue in reducing runoff and erosian.
We disked the soil after soybean harvest in preparation for planting wheat, burying most of the soybean residue. Because
Table 1. Effect of soybean tillage systems on water runoff, November-March.
Water Runoff by Tillage Practice Growing Conventional NO-Till + Season Tillage No-Till Cover Crop Precipitation
1985-86 26a' 19a 28a 409 1986-87 119a 56b 28b 453 1987-88 231 a 59b 178a 752 198889 578a 236b 314b 1.148 'Values within years followed by the same letter are not significantly different
7,000 gallons/acre
(.05 DMR)
Table 2. Effect of soybean tillage systems on soil loss, November-March.
Growing Conventional No-Till + Soil Loss by Tillage Practice
Season Tiliage NO-Till cover crop tonslacre
198586 0.33a" 0.03a 0.06a 1986-87 1.25a 0.12b 0.21 b 1987-88 3.56a 0.l lC 0.50b 1988-89 55.35a 0.62b 1.35b 'Values within years followed by the same letter are not significantly different (.05 DMR)
soybeans were not harvested until late October, wheat growth in the fall was small, which left the soil largely unprotected. These fragipan soils tend to stay wet and cold during winter and spring, which also delays and reduces the growth of cover crops.
Our research shows that soybean residue effectively pro- tected this soil during the winter seasons. Due to the disking used to establish a wheat cover crop and the reduced growth of wheat on this soil, a winter wheat cover crop did not reduce runoff and soil erosion compared with no-till with soybean residue, but it did reduce these factors in comparison with conventional tillage, except during 1985-1986 season.
REFERENCES
Bailey, H. H., and J. H. Winsor. 1964. Kentucky soils. Misc. 308. Ky. Agr. Exp. Sta., Lexington. 174 pp. M e n , J. M., and W. C. Moldenhauer. 1979. Soil and water lossesfrom corn-soybean rotutions. Soil Sci. SOC. Am. J. 431213-1215. Shelton. C. H., F. D. Tompkins, and D. D. Tyler. 1983. Soil erosion from jive soybean tillage systems. J. Soil and Water Cons. 38425-428. Wendt, R C.. and R E BanvelL 1985. R w f f and soil losses for conventional. reduced, and no-till corn. J. Soil and Water Cons. 40450- 454.
(c) SWCS. For Individual Use Only.