surgeon results - phc4 results.pdf · surgeon results phc4 • cardiac surgery report • jan 2014...
TRANSCRIPT

Surgeon Results
PHC4 • Cardiac Surgery Report • Jan 2014 – Mar 2016 Data
Surgeon Results • 1
Table Notes Total Number of Cases includes all cases after exclusions (patients less than 30 years of age, patients who left against medical advice and clinically complex cases were excluded). The total number of cases includes inpatient hospital discharges from January 1, 2014 through March 31, 2016. In-Hospital Mortality represents the number of patients who died during the hospitalization in which the procedure was performed. This analysis includes inpatient hospital discharges from January 1, 2014 through March 31, 2016. 30-Day Readmission represents the number of patients who were readmitted to any general acute care hospital in Pennsylvania for a heart-related condition, an infection or a complication. This analysis is based on inpatient hospital discharges from January 1, 2014 through August 31, 2015. Actual Percent is the percent (rate) of patients who died (In-Hospital Mortality) or who were readmitted (30-Day Readmission). Expected Range is the range (upper and lower limits) of the percent of patients one could reasonably expect to die (In-Hospital Mortality) or be readmitted (30-Day Readmission) after accounting for patient risk. Rating identifies whether the actual percent (rate) is significantly higher than, significantly lower than or not significantly different than expected. See Understanding the Statistical Rating Symbols below. See About the Report section or the Technical Notes for further details.
Understanding the Statistical Rating Symbols
The rating symbols displayed in this report represent a comparison of a surgeon’s actual percent of mortality or readmission to the
surgeon’s expected range, which takes into account varying illness levels among patients. See example below.
In-Hospital Mortality
Actual
Percent Expected
Range Rating
Sample Surgeon A
CABG without Valve 1.3% 0.4% - 3.5%
Surgeon’s actual percent is within the surgeon’s
expected range. The surgeon’s rating is not
significantly different than expected.
Sample Surgeon B
CABG without Valve 0.0% 0.5% - 3.8%
Surgeon’s actual percent is less than the surgeon’s
expected range. The surgeon’s rating is
significantly lower (better) than expected.
Sample Surgeon C
CABG without Valve 4.0% 0.0% - 2.9%
Surgeon’s actual percent is more than the
surgeon’s expected range. The surgeon’s rating is
significantly higher (worse) than expected.

Surgeon Results
Rate was significantly lower than expected.
Rate was not significantly different than expected.
Rate was significantly higher than expected.
NR: Not reported. Too few cases after exclusions.
PHC4 • Cardiac Surgery Report • Jan 2014 – Mar 2016 Data
Surgeon Results • 2
In-Hospital Mortality 30-Day
Readmission
Total Number of Cases
Actual Percent
Actual Percent
Statewide Statistics
CABG without Valve 16,641 1.5% 10.2%
Total Valve 12,937 2.7% 13.7%
Valve without CABG 8,618 1.8% 13.3%
Valve with CABG 4,319 4.4% 14.5%
In-Hospital Mortality 30-Day Readmission
Surgeon
Total Number of Cases
Actual Percent
Expected Range Rating
Actual Percent
Expected Range Rating
Abrishamchian, A. Reza
CABG without Valve 159 0.0% 0.0% - 2.5% 10.8% 4.9% - 14.7%
Total Valve 68 1.5% 0.0% - 4.4% 11.8% 3.9% - 19.6%
Valve without CABG 41 2.4% 0.0% - 4.9% 13.3% 3.3% - 20.0%
Valve with CABG 27 NR NR NR NR NR NR
Acker, Michael A.
CABG without Valve 117 6.0% 0.9% - 5.1% 13.8% 3.4% - 15.5%
Total Valve 358 4.2% 2.0% - 5.0% 16.3% 8.9% - 17.9%
Valve without CABG 279 2.9% 1.1% - 4.3% 15.6% 8.2% - 18.4%
Valve with CABG 79 8.9% 1.3% - 10.1% 18.6% 4.7% - 23.3%
Aharon, Alon S.
CABG without Valve 14 NR NR NR NR NR NR
Total Valve 10 NR NR NR NR NR NR
Valve without CABG 5 NR NR NR NR NR NR
Valve with CABG 5 NR NR NR NR NR NR

Surgeon Results
Rate was significantly lower than expected.
Rate was not significantly different than expected.
Rate was significantly higher than expected.
NR: Not reported. Too few cases after exclusions.
PHC4 • Cardiac Surgery Report • Jan 2014 – Mar 2016 Data
Surgeon Results • 3
In-Hospital Mortality 30-Day Readmission
Surgeon
Total Number of Cases
Actual Percent
Expected Range Rating
Actual Percent
Expected Range Rating
Amortegui, Jose D.
CABG without Valve 147 0.7% 0.0% - 2.7% 4.0% 5.1% - 15.2%
Total Valve 70 4.3% 0.0% - 5.7% 10.9% 6.5% - 26.1%
Valve without CABG 35 2.9% 0.0% - 2.9% NR NR NR
Valve with CABG 35 5.7% 0.0% - 11.4% NR NR NR
Anastasi, John S.
CABG without Valve 207 1.4% 0.0% - 2.4% 15.4% 5.8% - 14.7%
Total Valve 162 1.9% 0.6% - 4.9% 21.6% 8.6% - 19.8%
Valve without CABG 124 1.6% 0.0% - 3.2% 18.2% 8.0% - 20.5%
Valve with CABG 38 2.6% 0.0% - 13.2% NR NR NR
Anderson, Mark
CABG without Valve 185 2.2% 0.0% - 2.7% 17.0% 5.0% - 16.0%
Total Valve 261 2.3% 0.8% - 3.8% 17.2% 9.3% - 19.2%
Valve without CABG 230 1.7% 0.4% - 3.5% 17.2% 9.0% - 19.4%
Valve with CABG 31 6.5% 0.0% - 9.7% NR NR NR
Angelico, Richard J.
CABG without Valve 101 1.0% 0.0% - 4.0% 13.6% 3.4% - 16.9%
Total Valve 57 0.0% 0.0% - 5.3% 12.1% 6.1% - 27.3%
Valve without CABG 32 0.0% 0.0% - 6.3% NR NR NR
Valve with CABG 25 NR NR NR NR NR NR
Atluri, Pavan
CABG without Valve 141 1.4% 0.0% - 3.5% 12.5% 4.2% - 18.8%
Total Valve 149 2.0% 1.3% - 6.0% 12.8% 6.4% - 20.5%
Valve without CABG 108 0.0% 0.0% - 5.6% 13.3% 6.7% - 21.7%
Valve with CABG 41 7.3% 0.0% - 9.8% NR NR NR

Surgeon Results
Rate was significantly lower than expected.
Rate was not significantly different than expected.
Rate was significantly higher than expected.
NR: Not reported. Too few cases after exclusions.
PHC4 • Cardiac Surgery Report • Jan 2014 – Mar 2016 Data
Surgeon Results • 4
In-Hospital Mortality 30-Day Readmission
Surgeon
Total Number of Cases
Actual Percent
Expected Range Rating
Actual Percent
Expected Range Rating
Auteri, Joseph S.
CABG without Valve 104 0.0% 0.0% - 1.9% 6.8% 2.7% - 12.3%
Total Valve 159 0.0% 0.0% - 3.8% 18.5% 5.6% - 16.1%
Valve without CABG 113 0.0% 0.0% - 3.5% 19.6% 5.4% - 16.3%
Valve with CABG 46 0.0% 0.0% - 6.5% 15.6% 3.1% - 21.9%
Badami, Chirag
CABG without Valve 1 NR NR NR NR NR NR
Total Valve 0 NR NR NR NR NR NR
Valve without CABG 0 NR NR NR NR NR NR
Valve with CABG 0 NR NR NR NR NR NR
Badhwar, Vinay
CABG without Valve 23 NR NR NR NR NR NR
Total Valve 316 2.5% 0.9% - 4.1% 11.2% 10.8% - 19.7%
Valve without CABG 278 1.8% 1.1% - 4.0% 12.1% 10.6% - 19.7%
Valve with CABG 38 7.9% 0.0% - 7.9% NR NR NR
Bailey, Stephen H.
CABG without Valve 86 0.0% 0.0% - 2.3% 14.6% 2.1% - 14.6%
Total Valve 233 2.1% 0.4% - 3.9% 12.9% 7.2% - 18.0%
Valve without CABG 179 2.8% 0.0% - 3.4% 14.1% 6.1% - 18.2%
Valve with CABG 54 0.0% 0.0% - 7.4% 10.0% 5.0% - 22.5%
Bajwa, Gurjyot
CABG without Valve 40 0.0% 0.0% - 2.5% 6.5% 3.2% - 19.4%
Total Valve 65 1.5% 0.0% - 4.6% 19.0% 4.8% - 21.4%
Valve without CABG 49 2.0% 0.0% - 4.1% 20.6% 2.9% - 23.5%
Valve with CABG 16 NR NR NR NR NR NR

Surgeon Results
Rate was significantly lower than expected.
Rate was not significantly different than expected.
Rate was significantly higher than expected.
NR: Not reported. Too few cases after exclusions.
PHC4 • Cardiac Surgery Report • Jan 2014 – Mar 2016 Data
Surgeon Results • 5
In-Hospital Mortality 30-Day Readmission
Surgeon
Total Number of Cases
Actual Percent
Expected Range Rating
Actual Percent
Expected Range Rating
Bavaria, Joseph E.
CABG without Valve 6 NR NR NR NR NR NR
Total Valve 241 1.2% 0.4% - 3.3% 7.2% 6.3% - 16.2%
Valve without CABG 199 0.5% 0.0% - 2.5% 7.8% 5.6% - 16.7%
Valve with CABG 42 4.8% 0.0% - 9.5% NR NR NR
Benoit, Charles H.
CABG without Valve 85 0.0% 0.0% - 3.5% 3.6% 3.6% - 15.7%
Total Valve 98 5.1% 0.0% - 5.1% 14.3% 6.6% - 18.7%
Valve without CABG 68 4.4% 0.0% - 2.9% 12.7% 4.8% - 19.0%
Valve with CABG 30 6.7% 0.0% - 10.0% NR NR NR
Bermudez, Christian
CABG without Valve 23 NR NR NR NR NR NR
Total Valve 13 NR NR NR NR NR NR
Valve without CABG 5 NR NR NR NR NR NR
Valve with CABG 8 NR NR NR NR NR NR
Bhama, Jay K.
CABG without Valve 2 NR NR NR NR NR NR
Total Valve 0 NR NR NR NR NR NR
Valve without CABG 0 NR NR NR NR NR NR
Valve with CABG 0 NR NR NR NR NR NR
Boonswang, Narongsak Ab
CABG without Valve 18 NR NR NR NR NR NR
Total Valve 7 NR NR NR NR NR NR
Valve without CABG 5 NR NR NR NR NR NR
Valve with CABG 2 NR NR NR NR NR NR

Surgeon Results
Rate was significantly lower than expected.
Rate was not significantly different than expected.
Rate was significantly higher than expected.
NR: Not reported. Too few cases after exclusions.
PHC4 • Cardiac Surgery Report • Jan 2014 – Mar 2016 Data
Surgeon Results • 6
In-Hospital Mortality 30-Day Readmission
Surgeon
Total Number of Cases
Actual Percent
Expected Range Rating
Actual Percent
Expected Range Rating
Boova, Robert S.
CABG without Valve 114 1.8% 0.0% - 3.5% 12.7% 6.3% - 19.0%
Total Valve 88 0.0% 0.0% - 5.7% 15.2% 7.6% - 24.2%
Valve without CABG 68 0.0% 0.0% - 4.4% 16.3% 6.1% - 24.5%
Valve with CABG 20 NR NR NR NR NR NR
Brown, Paul
CABG without Valve 79 2.5% 0.0% - 2.5% 8.9% 1.8% - 16.1%
Total Valve 29 NR NR NR NR NR NR
Valve without CABG 14 NR NR NR NR NR NR
Valve with CABG 15 NR NR NR NR NR NR
Burlingame, Mark W.
CABG without Valve 162 3.1% 0.0% - 2.5% 8.3% 5.0% - 14.9%
Total Valve 177 4.0% 0.6% - 4.5% 15.5% 8.5% - 19.4%
Valve without CABG 87 2.3% 0.0% - 3.4% 11.3% 4.8% - 19.4%
Valve with CABG 90 5.6% 0.0% - 6.7% 19.4% 7.5% - 22.4%
Bush, Bryan S.
CABG without Valve 29 NR NR NR NR NR NR
Total Valve 9 NR NR NR NR NR NR
Valve without CABG 5 NR NR NR NR NR NR
Valve with CABG 4 NR NR NR NR NR NR
Butler, Michael D.
CABG without Valve 148 0.0% 0.0% - 2.7% 9.0% 3.8% - 15.4%
Total Valve 68 2.9% 0.0% - 5.9% 16.1% 3.2% - 22.6%
Valve without CABG 36 2.8% 0.0% - 2.8% NR NR NR
Valve with CABG 32 3.1% 0.0% - 9.4% NR NR NR

Surgeon Results
Rate was significantly lower than expected.
Rate was not significantly different than expected.
Rate was significantly higher than expected.
NR: Not reported. Too few cases after exclusions.
PHC4 • Cardiac Surgery Report • Jan 2014 – Mar 2016 Data
Surgeon Results • 7
In-Hospital Mortality 30-Day Readmission
Surgeon
Total Number of Cases
Actual Percent
Expected Range Rating
Actual Percent
Expected Range Rating
Cahill, Anne T.
CABG without Valve 12 NR NR NR NR NR NR
Total Valve 2 NR NR NR NR NR NR
Valve without CABG 0 NR NR NR NR NR NR
Valve with CABG 2 NR NR NR NR NR NR
Campbell, David B.
CABG without Valve 42 0.0% 0.0% - 4.8% 11.4% 0.0% - 17.1%
Total Valve 52 1.9% 0.0% - 5.8% 15.8% 2.6% - 23.7%
Valve without CABG 32 3.1% 0.0% - 3.1% NR NR NR
Valve with CABG 20 NR NR NR NR NR NR
Campbell, James P.
CABG without Valve 1 NR NR NR NR NR NR
Total Valve 0 NR NR NR NR NR NR
Valve without CABG 0 NR NR NR NR NR NR
Valve with CABG 0 NR NR NR NR NR NR
Carter, Russell A.
CABG without Valve 123 0.8% 0.0% - 3.3% 4.3% 4.3% - 15.2%
Total Valve 242 1.2% 1.2% - 4.5% 8.0% 8.0% - 16.6%
Valve without CABG 160 0.0% 0.0% - 3.8% 8.0% 7.2% - 17.6%
Valve with CABG 82 3.7% 1.2% - 8.5% 8.1% 4.8% - 21.0%
Casale, Alfred S.
CABG without Valve 38 0.0% 0.0% - 5.3% 10.0% 3.3% - 20.0%
Total Valve 12 NR NR NR NR NR NR
Valve without CABG 2 NR NR NR NR NR NR
Valve with CABG 10 NR NR NR NR NR NR

Surgeon Results
Rate was significantly lower than expected.
Rate was not significantly different than expected.
Rate was significantly higher than expected.
NR: Not reported. Too few cases after exclusions.
PHC4 • Cardiac Surgery Report • Jan 2014 – Mar 2016 Data
Surgeon Results • 8
In-Hospital Mortality 30-Day Readmission
Surgeon
Total Number of Cases
Actual Percent
Expected Range Rating
Actual Percent
Expected Range Rating
Casey, Kevin
CABG without Valve 3 NR NR NR NR NR NR
Total Valve 3 NR NR NR NR NR NR
Valve without CABG 0 NR NR NR NR NR NR
Valve with CABG 3 NR NR NR NR NR NR
Chu, Danny
CABG without Valve 7 NR NR NR NR NR NR
Total Valve 2 NR NR NR NR NR NR
Valve without CABG 0 NR NR NR NR NR NR
Valve with CABG 2 NR NR NR NR NR NR
Clark, Joseph B.
CABG without Valve 0 NR NR NR NR NR NR
Total Valve 3 NR NR NR NR NR NR
Valve without CABG 3 NR NR NR NR NR NR
Valve with CABG 0 NR NR NR NR NR NR
Cook, Chris C.
CABG without Valve 284 1.4% 0.4% - 2.8% 12.1% 5.8% - 13.1%
Total Valve 206 0.0% 1.0% - 4.9% 13.3% 8.4% - 18.2%
Valve without CABG 123 0.0% 0.0% - 3.3% 12.4% 5.6% - 18.0%
Valve with CABG 83 0.0% 1.2% - 8.4% 14.8% 7.4% - 24.1%
Cope, Jeffrey T.
CABG without Valve 231 2.6% 0.0% - 2.6% 11.5% 5.7% - 14.6%
Total Valve 146 2.7% 0.0% - 4.1% 11.1% 7.7% - 18.8%
Valve without CABG 89 2.2% 0.0% - 3.4% 11.3% 5.6% - 21.1%
Valve with CABG 57 3.5% 0.0% - 7.0% 10.9% 4.3% - 21.7%

Surgeon Results
Rate was significantly lower than expected.
Rate was not significantly different than expected.
Rate was significantly higher than expected.
NR: Not reported. Too few cases after exclusions.
PHC4 • Cardiac Surgery Report • Jan 2014 – Mar 2016 Data
Surgeon Results • 9
In-Hospital Mortality 30-Day Readmission
Surgeon
Total Number of Cases
Actual Percent
Expected Range Rating
Actual Percent
Expected Range Rating
Costic, Joseph T.
CABG without Valve 3 NR NR NR NR NR NR
Total Valve 0 NR NR NR NR NR NR
Valve without CABG 0 NR NR NR NR NR NR
Valve with CABG 0 NR NR NR NR NR NR
Culig, Michael H.
CABG without Valve 125 3.2% 0.0% - 3.2% 12.0% 4.3% - 14.1%
Total Valve 93 2.2% 0.0% - 5.4% 18.2% 7.6% - 22.7%
Valve without CABG 57 0.0% 0.0% - 3.5% 19.0% 4.8% - 23.8%
Valve with CABG 36 5.6% 0.0% - 11.1% NR NR NR
Dasika, Uday K.
CABG without Valve 96 0.0% 0.0% - 3.1% 7.6% 4.5% - 18.2%
Total Valve 29 NR NR NR NR NR NR
Valve without CABG 15 NR NR NR NR NR NR
Valve with CABG 14 NR NR NR NR NR NR
Davliakos, George P.
CABG without Valve 141 1.4% 0.0% - 2.8% 7.1% 5.1% - 15.3%
Total Valve 97 5.2% 0.0% - 5.2% 6.8% 5.5% - 19.2%
Valve without CABG 50 2.0% 0.0% - 4.0% 7.7% 2.6% - 20.5%
Valve with CABG 47 8.5% 0.0% - 8.5% 5.9% 2.9% - 23.5%
Derby, Christopher D.
CABG without Valve 8 NR NR NR NR NR NR
Total Valve 1 NR NR NR NR NR NR
Valve without CABG 1 NR NR NR NR NR NR
Valve with CABG 0 NR NR NR NR NR NR

Surgeon Results
Rate was significantly lower than expected.
Rate was not significantly different than expected.
Rate was significantly higher than expected.
NR: Not reported. Too few cases after exclusions.
PHC4 • Cardiac Surgery Report • Jan 2014 – Mar 2016 Data
Surgeon Results • 10
In-Hospital Mortality 30-Day Readmission
Surgeon
Total Number of Cases
Actual Percent
Expected Range Rating
Actual Percent
Expected Range Rating
Desai, Nimesh Dilip
CABG without Valve 64 3.1% 0.0% - 6.3% 15.8% 2.6% - 18.4%
Total Valve 124 1.6% 0.8% - 5.6% 8.3% 6.7% - 21.7%
Valve without CABG 88 0.0% 0.0% - 4.5% 7.0% 4.7% - 20.9%
Valve with CABG 36 5.6% 0.0% - 8.3% NR NR NR
Diehl, James T.
CABG without Valve 62 0.0% 0.0% - 4.8% 10.8% 2.7% - 18.9%
Total Valve 47 4.3% 0.0% - 6.4% NR NR NR
Valve without CABG 32 3.1% 0.0% - 6.3% NR NR NR
Valve with CABG 15 NR NR NR NR NR NR
DiMarco Jr., Ross F.
CABG without Valve 68 1.5% 0.0% - 2.9% 14.0% 3.5% - 15.8%
Total Valve 25 NR NR NR NR NR NR
Valve without CABG 8 NR NR NR NR NR NR
Valve with CABG 17 NR NR NR NR NR NR
DiMuzio, Paul J.
CABG without Valve 1 NR NR NR NR NR NR
Total Valve 0 NR NR NR NR NR NR
Valve without CABG 0 NR NR NR NR NR NR
Valve with CABG 0 NR NR NR NR NR NR
El-Khatib, Hazem N.
CABG without Valve 110 0.0% 0.0% - 2.7% 12.2% 4.1% - 16.2%
Total Valve 142 1.4% 0.0% - 4.2% 16.1% 6.5% - 19.4%
Valve without CABG 83 2.4% 0.0% - 2.4% 12.3% 5.3% - 21.1%
Valve with CABG 59 0.0% 0.0% - 8.5% 22.2% 2.8% - 22.2%

Surgeon Results
Rate was significantly lower than expected.
Rate was not significantly different than expected.
Rate was significantly higher than expected.
NR: Not reported. Too few cases after exclusions.
PHC4 • Cardiac Surgery Report • Jan 2014 – Mar 2016 Data
Surgeon Results • 11
In-Hospital Mortality 30-Day Readmission
Surgeon
Total Number of Cases
Actual Percent
Expected Range Rating
Actual Percent
Expected Range Rating
Entwistle III, John W.
CABG without Valve 77 3.9% 0.0% - 5.2% 19.4% 3.2% - 22.6%
Total Valve 39 10.3% 0.0% - 10.3% NR NR NR
Valve without CABG 20 NR NR NR NR NR NR
Valve with CABG 19 NR NR NR NR NR NR
Epler, Mark J.
CABG without Valve 221 1.8% 0.0% - 2.7% 13.0% 6.2% - 14.8%
Total Valve 145 3.4% 0.7% - 4.8% 14.5% 8.2% - 20.9%
Valve without CABG 82 3.7% 0.0% - 3.7% 13.3% 6.7% - 21.7%
Valve with CABG 63 3.2% 0.0% - 7.9% 16.0% 6.0% - 24.0%
Esrig, Barry
CABG without Valve 10 NR NR NR NR NR NR
Total Valve 13 NR NR NR NR NR NR
Valve without CABG 8 NR NR NR NR NR NR
Valve with CABG 5 NR NR NR NR NR NR
Farivar, Robert S.
CABG without Valve 11 NR NR NR NR NR NR
Total Valve 2 NR NR NR NR NR NR
Valve without CABG 2 NR NR NR NR NR NR
Valve with CABG 0 NR NR NR NR NR NR
Fazi, Burt
CABG without Valve 0 NR NR NR NR NR NR
Total Valve 1 NR NR NR NR NR NR
Valve without CABG 1 NR NR NR NR NR NR
Valve with CABG 0 NR NR NR NR NR NR

Surgeon Results
Rate was significantly lower than expected.
Rate was not significantly different than expected.
Rate was significantly higher than expected.
NR: Not reported. Too few cases after exclusions.
PHC4 • Cardiac Surgery Report • Jan 2014 – Mar 2016 Data
Surgeon Results • 12
In-Hospital Mortality 30-Day Readmission
Surgeon
Total Number of Cases
Actual Percent
Expected Range Rating
Actual Percent
Expected Range Rating
Ferdinand, Francis D.
CABG without Valve 35 0.0% 0.0% - 2.9% 8.8% 0.0% - 17.6%
Total Valve 19 NR NR NR NR NR NR
Valve without CABG 10 NR NR NR NR NR NR
Valve with CABG 9 NR NR NR NR NR NR
Fischer, Wade L.
CABG without Valve 16 NR NR NR NR NR NR
Total Valve 11 NR NR NR NR NR NR
Valve without CABG 7 NR NR NR NR NR NR
Valve with CABG 4 NR NR NR NR NR NR
Fitzgibbon, Leo D.
CABG without Valve 129 0.0% 0.0% - 3.1% 9.9% 4.9% - 16.0%
Total Valve 72 4.2% 0.0% - 4.2% 21.6% 2.7% - 21.6%
Valve without CABG 53 0.0% 0.0% - 3.8% NR NR NR
Valve with CABG 19 NR NR NR NR NR NR
Fitzpatrick, J. Raymond
CABG without Valve 155 0.0% 0.0% - 2.6% 8.9% 5.0% - 14.9%
Total Valve 74 1.4% 0.0% - 4.1% 11.3% 5.7% - 20.8%
Valve without CABG 46 2.2% 0.0% - 4.3% 3.0% 3.0% - 21.2%
Valve with CABG 28 NR NR NR NR NR NR
Friscia, Michael E.
CABG without Valve 66 0.0% 0.0% - 3.0% 14.3% 2.9% - 20.0%
Total Valve 32 0.0% 0.0% - 6.3% NR NR NR
Valve without CABG 20 NR NR NR NR NR NR
Valve with CABG 12 NR NR NR NR NR NR

Surgeon Results
Rate was significantly lower than expected.
Rate was not significantly different than expected.
Rate was significantly higher than expected.
NR: Not reported. Too few cases after exclusions.
PHC4 • Cardiac Surgery Report • Jan 2014 – Mar 2016 Data
Surgeon Results • 13
In-Hospital Mortality 30-Day Readmission
Surgeon
Total Number of Cases
Actual Percent
Expected Range Rating
Actual Percent
Expected Range Rating
Fuller, Stephanie
CABG without Valve 0 NR NR NR NR NR NR
Total Valve 13 NR NR NR NR NR NR
Valve without CABG 13 NR NR NR NR NR NR
Valve with CABG 0 NR NR NR NR NR NR
Furukawa, Satoshi
CABG without Valve 131 1.5% 0.0% - 3.1% 11.8% 3.9% - 15.8%
Total Valve 103 3.9% 0.0% - 4.9% 15.7% 5.9% - 23.5%
Valve without CABG 75 1.3% 0.0% - 4.0% 14.6% 4.9% - 22.0%
Valve with CABG 28 NR NR NR NR NR NR
Fuzesi, Laszlo
CABG without Valve 119 0.0% 0.0% - 2.5% 5.4% 4.5% - 14.4%
Total Valve 44 4.5% 0.0% - 4.5% 24.4% 4.9% - 22.0%
Valve without CABG 27 NR NR NR NR NR NR
Valve with CABG 17 NR NR NR NR NR NR
Garrido, Mauricio
CABG without Valve 134 1.5% 0.0% - 3.7% 12.5% 5.0% - 17.5%
Total Valve 112 4.5% 0.0% - 4.5% 9.5% 5.4% - 20.3%
Valve without CABG 68 4.4% 0.0% - 2.9% 11.1% 4.4% - 20.0%
Valve with CABG 44 4.5% 0.0% - 6.8% NR NR NR
Garzia, Fernando M.
CABG without Valve 3 NR NR NR NR NR NR
Total Valve 1 NR NR NR NR NR NR
Valve without CABG 0 NR NR NR NR NR NR
Valve with CABG 1 NR NR NR NR NR NR

Surgeon Results
Rate was significantly lower than expected.
Rate was not significantly different than expected.
Rate was significantly higher than expected.
NR: Not reported. Too few cases after exclusions.
PHC4 • Cardiac Surgery Report • Jan 2014 – Mar 2016 Data
Surgeon Results • 14
In-Hospital Mortality 30-Day Readmission
Surgeon
Total Number of Cases
Actual Percent
Expected Range Rating
Actual Percent
Expected Range Rating
Geller, Charles
CABG without Valve 53 0.0% 0.0% - 1.9% 21.9% 0.0% - 18.8%
Total Valve 70 7.1% 1.4% - 8.6% 11.4% 2.9% - 22.9%
Valve without CABG 45 4.4% 0.0% - 4.4% NR NR NR
Valve with CABG 25 NR NR NR NR NR NR
Ghalili, Kourosh C.
CABG without Valve 3 NR NR NR NR NR NR
Total Valve 0 NR NR NR NR NR NR
Valve without CABG 0 NR NR NR NR NR NR
Valve with CABG 0 NR NR NR NR NR NR
Gilbert, Christian L.
CABG without Valve 74 1.4% 0.0% - 2.7% 10.0% 5.0% - 18.3%
Total Valve 19 NR NR NR NR NR NR
Valve without CABG 12 NR NR NR NR NR NR
Valve with CABG 7 NR NR NR NR NR NR
Gleason, Thomas G.
CABG without Valve 95 0.0% 0.0% - 4.2% 10.0% 5.7% - 18.6%
Total Valve 254 4.3% 1.2% - 4.7% 15.7% 10.1% - 19.7%
Valve without CABG 154 2.6% 0.0% - 3.9% 12.8% 8.3% - 19.3%
Valve with CABG 100 7.0% 1.0% - 8.0% 20.3% 8.7% - 24.6%
Gluhovsky, Maxim Y.
CABG without Valve 5 NR NR NR NR NR NR
Total Valve 0 NR NR NR NR NR NR
Valve without CABG 0 NR NR NR NR NR NR
Valve with CABG 0 NR NR NR NR NR NR

Surgeon Results
Rate was significantly lower than expected.
Rate was not significantly different than expected.
Rate was significantly higher than expected.
NR: Not reported. Too few cases after exclusions.
PHC4 • Cardiac Surgery Report • Jan 2014 – Mar 2016 Data
Surgeon Results • 15
In-Hospital Mortality 30-Day Readmission
Surgeon
Total Number of Cases
Actual Percent
Expected Range Rating
Actual Percent
Expected Range Rating
Goldberg, Aron T.
CABG without Valve 133 1.5% 0.0% - 3.0% 9.9% 4.4% - 15.4%
Total Valve 59 0.0% 0.0% - 3.4% 12.8% 2.6% - 23.1%
Valve without CABG 28 NR NR NR NR NR NR
Valve with CABG 31 0.0% 0.0% - 6.5% NR NR NR
Goldman, Scott M.
CABG without Valve 0 NR NR NR NR NR NR
Total Valve 210 1.9% 0.0% - 2.9% 9.7% 6.7% - 17.2%
Valve without CABG 187 1.1% 0.0% - 2.7% 9.8% 6.5% - 17.1%
Valve with CABG 23 NR NR NR NR NR NR
Grunewald, Karl E.
CABG without Valve 88 1.1% 0.0% - 3.4% 10.3% 4.4% - 16.2%
Total Valve 20 NR NR NR NR NR NR
Valve without CABG 9 NR NR NR NR NR NR
Valve with CABG 11 NR NR NR NR NR NR
Guy, T. Sloane
CABG without Valve 77 2.6% 0.0% - 5.2% 2.2% 4.4% - 22.2%
Total Valve 158 4.4% 0.6% - 5.7% 18.9% 11.3% - 24.5%
Valve without CABG 138 4.3% 0.7% - 5.1% 21.3% 10.6% - 24.5%
Valve with CABG 20 NR NR NR NR NR NR
Hakki, Abdul-Hadi
CABG without Valve 77 1.3% 0.0% - 2.6% 7.4% 4.4% - 17.6%
Total Valve 10 NR NR NR NR NR NR
Valve without CABG 8 NR NR NR NR NR NR
Valve with CABG 2 NR NR NR NR NR NR

Surgeon Results
Rate was significantly lower than expected.
Rate was not significantly different than expected.
Rate was significantly higher than expected.
NR: Not reported. Too few cases after exclusions.
PHC4 • Cardiac Surgery Report • Jan 2014 – Mar 2016 Data
Surgeon Results • 16
In-Hospital Mortality 30-Day Readmission
Surgeon
Total Number of Cases
Actual Percent
Expected Range Rating
Actual Percent
Expected Range Rating
Hargrove III, W. Clark
CABG without Valve 103 1.0% 0.0% - 3.9% 13.3% 0.0% - 20.0%
Total Valve 271 1.5% 0.4% - 3.3% 12.6% 5.7% - 17.2%
Valve without CABG 229 0.9% 0.4% - 3.1% 14.5% 5.3% - 18.4%
Valve with CABG 42 4.8% 0.0% - 7.1% NR NR NR
Harostock, Michael
CABG without Valve 269 2.2% 0.0% - 1.9% 8.6% 5.9% - 12.7%
Total Valve 78 6.4% 0.0% - 5.1% 26.7% 4.4% - 22.2%
Valve without CABG 28 NR NR NR NR NR NR
Valve with CABG 50 8.0% 0.0% - 6.0% 29.0% 3.2% - 22.6%
Haupt, Hans M.
CABG without Valve 116 0.0% 0.0% - 3.4% 10.3% 3.8% - 16.7%
Total Valve 44 2.3% 0.0% - 4.5% 6.1% 3.0% - 21.2%
Valve without CABG 21 NR NR NR NR NR NR
Valve with CABG 23 NR NR NR NR NR NR
Haybron, David M.
CABG without Valve 80 0.0% 0.0% - 3.8% 14.3% 3.6% - 17.9%
Total Valve 61 1.6% 0.0% - 6.6% 17.4% 6.5% - 23.9%
Valve without CABG 32 0.0% 0.0% - 6.3% NR NR NR
Valve with CABG 29 NR NR NR NR NR NR
Ishac, Roger
CABG without Valve 1 NR NR NR NR NR NR
Total Valve 0 NR NR NR NR NR NR
Valve without CABG 0 NR NR NR NR NR NR
Valve with CABG 0 NR NR NR NR NR NR

Surgeon Results
Rate was significantly lower than expected.
Rate was not significantly different than expected.
Rate was significantly higher than expected.
NR: Not reported. Too few cases after exclusions.
PHC4 • Cardiac Surgery Report • Jan 2014 – Mar 2016 Data
Surgeon Results • 17
In-Hospital Mortality 30-Day Readmission
Surgeon
Total Number of Cases
Actual Percent
Expected Range Rating
Actual Percent
Expected Range Rating
Jaik, Nikhil P.
CABG without Valve 185 0.5% 0.0% - 2.2% 6.1% 4.0% - 13.1%
Total Valve 6 NR NR NR NR NR NR
Valve without CABG 4 NR NR NR NR NR NR
Valve with CABG 2 NR NR NR NR NR NR
Jain, Harsh
CABG without Valve 115 0.9% 0.0% - 3.5% 10.6% 3.5% - 14.1%
Total Valve 19 NR NR NR NR NR NR
Valve without CABG 11 NR NR NR NR NR NR
Valve with CABG 8 NR NR NR NR NR NR
Kaczorowski, David J.
CABG without Valve 176 5.7% 0.0% - 3.4% 11.7% 5.8% - 15.8%
Total Valve 63 3.2% 0.0% - 4.8% 17.9% 2.6% - 23.1%
Valve without CABG 44 4.5% 0.0% - 2.3% 16.7% 3.3% - 23.3%
Valve with CABG 19 NR NR NR NR NR NR
Kaushik, Raj
CABG without Valve 75 1.3% 0.0% - 4.0% 14.6% 4.2% - 20.8%
Total Valve 45 2.2% 0.0% - 6.7% NR NR NR
Valve without CABG 26 NR NR NR NR NR NR
Valve with CABG 19 NR NR NR NR NR NR
Khawaja, Fawad
CABG without Valve 1 NR NR NR NR NR NR
Total Valve 0 NR NR NR NR NR NR
Valve without CABG 0 NR NR NR NR NR NR
Valve with CABG 0 NR NR NR NR NR NR

Surgeon Results
Rate was significantly lower than expected.
Rate was not significantly different than expected.
Rate was significantly higher than expected.
NR: Not reported. Too few cases after exclusions.
PHC4 • Cardiac Surgery Report • Jan 2014 – Mar 2016 Data
Surgeon Results • 18
In-Hospital Mortality 30-Day Readmission
Surgeon
Total Number of Cases
Actual Percent
Expected Range Rating
Actual Percent
Expected Range Rating
Lagazzi, Luigi
CABG without Valve 20 NR NR NR NR NR NR
Total Valve 3 NR NR NR NR NR NR
Valve without CABG 3 NR NR NR NR NR NR
Valve with CABG 0 NR NR NR NR NR NR
Laub, Glenn W.
CABG without Valve 56 0.0% 0.0% - 5.4% 19.4% 2.8% - 19.4%
Total Valve 28 NR NR NR NR NR NR
Valve without CABG 22 NR NR NR NR NR NR
Valve with CABG 6 NR NR NR NR NR NR
Lazar, Michael J.
CABG without Valve 171 1.2% 0.0% - 2.3% 11.4% 4.9% - 14.6%
Total Valve 159 3.8% 0.0% - 3.8% 15.5% 6.8% - 19.4%
Valve without CABG 101 2.0% 0.0% - 3.0% 13.9% 5.6% - 19.4%
Valve with CABG 58 6.9% 0.0% - 5.2% 19.4% 3.2% - 25.8%
LeBoutillier III, Martin
CABG without Valve 177 0.6% 0.0% - 2.3% 2.1% 4.8% - 13.0%
Total Valve 78 1.3% 0.0% - 3.8% 16.4% 4.9% - 19.7%
Valve without CABG 39 2.6% 0.0% - 2.6% NR NR NR
Valve with CABG 39 0.0% 0.0% - 5.1% 12.1% 3.0% - 21.2%
Lico, Serrie C.
CABG without Valve 132 2.3% 0.0% - 3.0% 14.4% 4.8% - 15.4%
Total Valve 75 4.0% 0.0% - 8.0% 25.0% 5.6% - 25.0%
Valve without CABG 35 2.9% 0.0% - 5.7% NR NR NR
Valve with CABG 40 5.0% 0.0% - 12.5% NR NR NR

Surgeon Results
Rate was significantly lower than expected.
Rate was not significantly different than expected.
Rate was significantly higher than expected.
NR: Not reported. Too few cases after exclusions.
PHC4 • Cardiac Surgery Report • Jan 2014 – Mar 2016 Data
Surgeon Results • 19
In-Hospital Mortality 30-Day Readmission
Surgeon
Total Number of Cases
Actual Percent
Expected Range Rating
Actual Percent
Expected Range Rating
Lima, Claudio A. B.
CABG without Valve 172 1.7% 0.0% - 2.9% 10.8% 4.9% - 15.7%
Total Valve 118 5.1% 0.8% - 6.8% 14.1% 9.9% - 25.4%
Valve without CABG 59 3.4% 0.0% - 5.1% 20.6% 5.9% - 29.4%
Valve with CABG 59 6.8% 0.0% - 10.2% 8.1% 5.4% - 27.0%
Lomago, Dean F.
CABG without Valve 170 0.6% 0.0% - 2.4% 4.0% 4.8% - 13.6%
Total Valve 20 NR NR NR NR NR NR
Valve without CABG 12 NR NR NR NR NR NR
Valve with CABG 8 NR NR NR NR NR NR
Loran, David B.
CABG without Valve 332 0.6% 0.0% - 2.1% 6.7% 5.6% - 12.3%
Total Valve 66 0.0% 0.0% - 6.1% 6.8% 2.3% - 18.2%
Valve without CABG 25 NR NR NR NR NR NR
Valve with CABG 41 0.0% 0.0% - 7.3% NR NR NR
Lotano, Vincent
CABG without Valve 107 1.9% 0.0% - 2.8% 11.8% 2.9% - 16.2%
Total Valve 12 NR NR NR NR NR NR
Valve without CABG 6 NR NR NR NR NR NR
Valve with CABG 6 NR NR NR NR NR NR
Machiraju, Venkata R.
CABG without Valve 147 2.0% 0.0% - 2.7% 12.0% 5.6% - 15.7%
Total Valve 195 5.1% 1.0% - 5.6% 10.9% 9.5% - 20.4%
Valve without CABG 100 0.0% 0.0% - 4.0% 8.6% 7.4% - 21.0%
Valve with CABG 95 10.5% 1.1% - 8.4% 14.3% 7.1% - 25.0%

Surgeon Results
Rate was significantly lower than expected.
Rate was not significantly different than expected.
Rate was significantly higher than expected.
NR: Not reported. Too few cases after exclusions.
PHC4 • Cardiac Surgery Report • Jan 2014 – Mar 2016 Data
Surgeon Results • 20
In-Hospital Mortality 30-Day Readmission
Surgeon
Total Number of Cases
Actual Percent
Expected Range Rating
Actual Percent
Expected Range Rating
Magovern Jr., George J.
CABG without Valve 85 0.0% 0.0% - 2.4% 14.8% 3.7% - 16.7%
Total Valve 52 1.9% 0.0% - 7.7% 9.4% 6.3% - 25.0%
Valve without CABG 34 2.9% 0.0% - 5.9% NR NR NR
Valve with CABG 18 NR NR NR NR NR NR
Marbey, Mark
CABG without Valve 122 0.0% 0.0% - 2.5% 5.3% 4.0% - 16.0%
Total Valve 41 2.4% 0.0% - 4.9% 10.0% 3.3% - 23.3%
Valve without CABG 23 NR NR NR NR NR NR
Valve with CABG 18 NR NR NR NR NR NR
Marra, Steven
CABG without Valve 75 1.3% 0.0% - 2.7% NR NR NR
Total Valve 16 NR NR NR NR NR NR
Valve without CABG 6 NR NR NR NR NR NR
Valve with CABG 10 NR NR NR NR NR NR
Marrone, Gary C.
CABG without Valve 35 0.0% 0.0% - 2.9% NR NR NR
Total Valve 13 NR NR NR NR NR NR
Valve without CABG 10 NR NR NR NR NR NR
Valve with CABG 3 NR NR NR NR NR NR
Martella, Arthur T.
CABG without Valve 21 NR NR NR NR NR NR
Total Valve 1 NR NR NR NR NR NR
Valve without CABG 0 NR NR NR NR NR NR
Valve with CABG 1 NR NR NR NR NR NR

Surgeon Results
Rate was significantly lower than expected.
Rate was not significantly different than expected.
Rate was significantly higher than expected.
NR: Not reported. Too few cases after exclusions.
PHC4 • Cardiac Surgery Report • Jan 2014 – Mar 2016 Data
Surgeon Results • 21
In-Hospital Mortality 30-Day Readmission
Surgeon
Total Number of Cases
Actual Percent
Expected Range Rating
Actual Percent
Expected Range Rating
Mascio, Christopher E.
CABG without Valve 0 NR NR NR NR NR NR
Total Valve 8 NR NR NR NR NR NR
Valve without CABG 7 NR NR NR NR NR NR
Valve with CABG 1 NR NR NR NR NR NR
Mavridis, Savas
CABG without Valve 208 2.4% 0.5% - 2.9% 8.0% 5.7% - 13.8%
Total Valve 116 4.3% 0.0% - 5.2% 10.6% 6.4% - 18.1%
Valve without CABG 60 3.3% 0.0% - 3.3% 10.2% 4.1% - 18.4%
Valve with CABG 56 5.4% 0.0% - 7.1% 11.1% 4.4% - 22.2%
Mayor, Kevin
CABG without Valve 34 2.9% 0.0% - 5.9% NR NR NR
Total Valve 4 NR NR NR NR NR NR
Valve without CABG 3 NR NR NR NR NR NR
Valve with CABG 1 NR NR NR NR NR NR
McCarty, Christine M.
CABG without Valve 243 0.8% 0.0% - 2.5% 10.9% 5.7% - 13.7%
Total Valve 106 1.9% 0.0% - 2.8% 10.6% 5.9% - 18.8%
Valve without CABG 75 2.7% 0.0% - 2.7% 13.1% 4.9% - 19.7%
Valve with CABG 31 0.0% 0.0% - 6.5% NR NR NR
McClurken, James B.
CABG without Valve 86 0.0% 0.0% - 3.5% 4.8% 1.6% - 14.3%
Total Valve 52 0.0% 0.0% - 5.8% 14.0% 4.7% - 20.9%
Valve without CABG 21 NR NR NR NR NR NR
Valve with CABG 31 0.0% 0.0% - 6.5% NR NR NR

Surgeon Results
Rate was significantly lower than expected.
Rate was not significantly different than expected.
Rate was significantly higher than expected.
NR: Not reported. Too few cases after exclusions.
PHC4 • Cardiac Surgery Report • Jan 2014 – Mar 2016 Data
Surgeon Results • 22
In-Hospital Mortality 30-Day Readmission
Surgeon
Total Number of Cases
Actual Percent
Expected Range Rating
Actual Percent
Expected Range Rating
McGregor, Walter E.
CABG without Valve 176 3.4% 0.0% - 2.8% 11.2% 4.7% - 14.0%
Total Valve 177 4.0% 1.1% - 5.1% 15.4% 7.7% - 19.2%
Valve without CABG 122 3.3% 0.0% - 3.3% 16.2% 5.9% - 19.1%
Valve with CABG 55 5.5% 0.0% - 10.9% 13.9% 5.6% - 25.0%
McMurtry, Kirk A.
CABG without Valve 56 3.6% 0.0% - 5.4% 16.2% 2.7% - 21.6%
Total Valve 107 2.8% 0.9% - 6.5% 16.5% 8.9% - 22.8%
Valve without CABG 79 1.3% 0.0% - 5.1% 13.3% 6.7% - 23.3%
Valve with CABG 28 NR NR NR NR NR NR
Mehta, Sanjay M.
CABG without Valve 97 1.0% 0.0% - 3.1% 5.9% 2.9% - 14.7%
Total Valve 76 1.3% 0.0% - 3.9% 9.6% 3.8% - 19.2%
Valve without CABG 50 0.0% 0.0% - 4.0% 15.6% 3.1% - 21.9%
Valve with CABG 26 NR NR NR NR NR NR
Misselbeck, Timothy
CABG without Valve 176 1.1% 0.0% - 2.8% 13.0% 5.3% - 15.3%
Total Valve 90 2.2% 0.0% - 6.7% 15.4% 9.2% - 24.6%
Valve without CABG 60 1.7% 0.0% - 5.0% 17.8% 6.7% - 24.4%
Valve with CABG 30 3.3% 0.0% - 13.3% NR NR NR
Moraca, Robert J.
CABG without Valve 96 0.0% 0.0% - 3.1% 13.0% 3.7% - 16.7%
Total Valve 97 4.1% 1.0% - 7.2% 24.0% 6.0% - 24.0%
Valve without CABG 62 4.8% 0.0% - 6.5% 23.3% 3.3% - 26.7%
Valve with CABG 35 2.9% 2.9% - 11.4% NR NR NR

Surgeon Results
Rate was significantly lower than expected.
Rate was not significantly different than expected.
Rate was significantly higher than expected.
NR: Not reported. Too few cases after exclusions.
PHC4 • Cardiac Surgery Report • Jan 2014 – Mar 2016 Data
Surgeon Results • 23
In-Hospital Mortality 30-Day Readmission
Surgeon
Total Number of Cases
Actual Percent
Expected Range Rating
Actual Percent
Expected Range Rating
Morris, Rohinton J.
CABG without Valve 122 0.8% 0.0% - 3.3% 9.1% 3.9% - 16.9%
Total Valve 135 2.2% 0.0% - 4.4% 14.1% 7.1% - 20.0%
Valve without CABG 90 2.2% 0.0% - 4.4% 13.8% 5.2% - 20.7%
Valve with CABG 45 2.2% 0.0% - 8.9% NR NR NR
Mott, Brian D.
CABG without Valve 76 0.0% 0.0% - 2.6% 10.5% 3.5% - 15.8%
Total Valve 42 0.0% 0.0% - 2.4% 15.2% 3.0% - 21.2%
Valve without CABG 32 0.0% 0.0% - 3.1% NR NR NR
Valve with CABG 10 NR NR NR NR NR NR
Mumtaz, Mubashir
CABG without Valve 24 NR NR NR NR NR NR
Total Valve 555 1.3% 1.3% - 3.4% 7.0% 9.7% - 15.7%
Valve without CABG 408 0.5% 0.5% - 2.5% 6.0% 8.9% - 15.9%
Valve with CABG 147 3.4% 2.0% - 7.5% 9.8% 8.0% - 19.6%
Murtaza, Mohammed
CABG without Valve 2 NR NR NR NR NR NR
Total Valve 0 NR NR NR NR NR NR
Valve without CABG 0 NR NR NR NR NR NR
Valve with CABG 0 NR NR NR NR NR NR
Myers, John L.
CABG without Valve 0 NR NR NR NR NR NR
Total Valve 5 NR NR NR NR NR NR
Valve without CABG 5 NR NR NR NR NR NR
Valve with CABG 0 NR NR NR NR NR NR
Surgeon Results
Rate was significantly lower than expected.
Rate was not significantly different than expected.
Rate was significantly higher than expected.
NR: Not reported. Too few cases after exclusions.
PHC4 • Cardiac Surgery Report • Jan 2014 – Mar 2016 Data
Surgeon Results • 24
In-Hospital Mortality 30-Day Readmission
Surgeon
Total Number of Cases
Actual Percent
Expected Range Rating
Actual Percent
Expected Range Rating
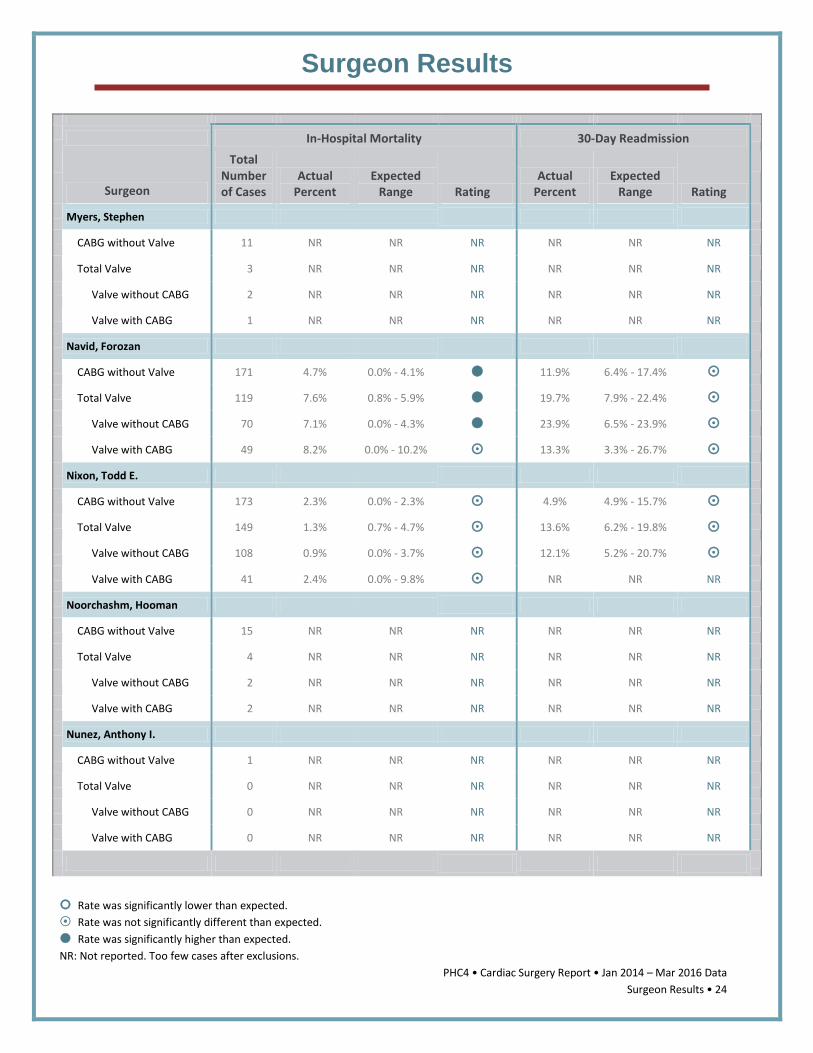
Myers, Stephen
CABG without Valve 11 NR NR NR NR NR NR
Total Valve 3 NR NR NR NR NR NR
Valve without CABG 2 NR NR NR NR NR NR
Valve with CABG 1 NR NR NR NR NR NR
Navid, Forozan
CABG without Valve 171 4.7% 0.0% - 4.1% 11.9% 6.4% - 17.4%
Total Valve 119 7.6% 0.8% - 5.9% 19.7% 7.9% - 22.4%
Valve without CABG 70 7.1% 0.0% - 4.3% 23.9% 6.5% - 23.9%
Valve with CABG 49 8.2% 0.0% - 10.2% 13.3% 3.3% - 26.7%
Nixon, Todd E.
CABG without Valve 173 2.3% 0.0% - 2.3% 4.9% 4.9% - 15.7%
Total Valve 149 1.3% 0.7% - 4.7% 13.6% 6.2% - 19.8%
Valve without CABG 108 0.9% 0.0% - 3.7% 12.1% 5.2% - 20.7%
Valve with CABG 41 2.4% 0.0% - 9.8% NR NR NR
Noorchashm, Hooman
CABG without Valve 15 NR NR NR NR NR NR
Total Valve 4 NR NR NR NR NR NR
Valve without CABG 2 NR NR NR NR NR NR
Valve with CABG 2 NR NR NR NR NR NR
Nunez, Anthony I.
CABG without Valve 1 NR NR NR NR NR NR
Total Valve 0 NR NR NR NR NR NR
Valve without CABG 0 NR NR NR NR NR NR
Valve with CABG 0 NR NR NR NR NR NR

Surgeon Results
Rate was significantly lower than expected.
Rate was not significantly different than expected.
Rate was significantly higher than expected.
NR: Not reported. Too few cases after exclusions.
PHC4 • Cardiac Surgery Report • Jan 2014 – Mar 2016 Data
Surgeon Results • 25
In-Hospital Mortality 30-Day Readmission
Surgeon
Total Number of Cases
Actual Percent
Expected Range Rating
Actual Percent
Expected Range Rating
Olenchock Jr., Stephen A.
CABG without Valve 70 0.0% 0.0% - 2.9% 8.5% 2.1% - 17.0%
Total Valve 135 0.0% 0.0% - 3.7% 8.4% 6.3% - 18.9%
Valve without CABG 87 0.0% 0.0% - 2.3% 9.8% 4.9% - 19.7%
Valve with CABG 48 0.0% 0.0% - 6.3% 5.9% 2.9% - 23.5%
Osevala, Mark A.
CABG without Valve 158 0.6% 0.0% - 2.5% 9.5% 5.7% - 16.2%
Total Valve 22 NR NR NR NR NR NR
Valve without CABG 11 NR NR NR NR NR NR
Valve with CABG 11 NR NR NR NR NR NR
Ovadia, Philip
CABG without Valve 140 2.9% 0.0% - 2.9% 8.8% 3.3% - 14.3%
Total Valve 58 5.2% 0.0% - 6.9% 12.5% 3.1% - 25.0%
Valve without CABG 27 NR NR NR NR NR NR
Valve with CABG 31 9.7% 0.0% - 9.7% NR NR NR
Pae, Walter E.
CABG without Valve 4 NR NR NR NR NR NR
Total Valve 149 0.7% 0.7% - 4.7% 16.0% 7.5% - 19.8%
Valve without CABG 121 0.8% 0.0% - 5.0% 16.7% 7.1% - 20.2%
Valve with CABG 28 NR NR NR NR NR NR
Park, Chong S.
CABG without Valve 88 2.3% 0.0% - 3.4% 6.3% 3.2% - 17.5%
Total Valve 80 2.5% 0.0% - 6.3% 10.9% 5.5% - 21.8%
Valve without CABG 43 2.3% 0.0% - 4.7% NR NR NR
Valve with CABG 37 2.7% 0.0% - 8.1% NR NR NR

Surgeon Results
Rate was significantly lower than expected.
Rate was not significantly different than expected.
Rate was significantly higher than expected.
NR: Not reported. Too few cases after exclusions.
PHC4 • Cardiac Surgery Report • Jan 2014 – Mar 2016 Data
Surgeon Results • 26
In-Hospital Mortality 30-Day Readmission
Surgeon
Total Number of Cases
Actual Percent
Expected Range Rating
Actual Percent
Expected Range Rating
Park, Kyung S.
CABG without Valve 213 0.9% 0.0% - 3.3% 8.5% 6.5% - 15.7%
Total Valve 146 1.4% 2.1% - 7.5% 14.4% 12.6% - 26.1%
Valve without CABG 62 0.0% 0.0% - 4.8% 6.3% 8.3% - 25.0%
Valve with CABG 84 2.4% 2.4% - 11.9% 20.6% 12.7% - 30.2%
Park, Sung J.
CABG without Valve 157 1.9% 0.0% - 2.5% 7.0% 5.2% - 14.8%
Total Valve 42 9.5% 0.0% - 4.8% 5.6% 2.8% - 19.4%
Valve without CABG 19 NR NR NR NR NR NR
Valve with CABG 23 NR NR NR NR NR NR
Pellegrini, Ronald V.
CABG without Valve 103 1.0% 0.0% - 2.9% 15.3% 4.2% - 16.7%
Total Valve 133 1.5% 0.0% - 4.5% 19.4% 7.5% - 20.4%
Valve without CABG 92 0.0% 0.0% - 3.3% 16.2% 5.9% - 19.1%
Valve with CABG 41 4.9% 0.0% - 7.3% NR NR NR
Pendergast, Thomas W.
CABG without Valve 6 NR NR NR NR NR NR
Total Valve 0 NR NR NR NR NR NR
Valve without CABG 0 NR NR NR NR NR NR
Valve with CABG 0 NR NR NR NR NR NR
Pennock, John L.
CABG without Valve 46 4.3% 0.0% - 4.3% 12.2% 2.4% - 17.1%
Total Valve 0 NR NR NR NR NR NR
Valve without CABG 0 NR NR NR NR NR NR
Valve with CABG 0 NR NR NR NR NR NR

Surgeon Results
Rate was significantly lower than expected.
Rate was not significantly different than expected.
Rate was significantly higher than expected.
NR: Not reported. Too few cases after exclusions.
PHC4 • Cardiac Surgery Report • Jan 2014 – Mar 2016 Data
Surgeon Results • 27
In-Hospital Mortality 30-Day Readmission
Surgeon
Total Number of Cases
Actual Percent
Expected Range Rating
Actual Percent
Expected Range Rating
Person, Thomas
CABG without Valve 95 2.1% 0.0% - 3.2% 5.5% 1.8% - 16.4%
Total Valve 78 3.8% 0.0% - 5.1% 7.3% 5.5% - 20.0%
Valve without CABG 33 0.0% 0.0% - 3.0% NR NR NR
Valve with CABG 45 6.7% 0.0% - 8.9% 10.0% 3.3% - 23.3%
Phillips, Theodore G.
CABG without Valve 297 0.7% 0.3% - 2.7% 14.3% 6.7% - 14.3%
Total Valve 63 4.8% 0.0% - 7.9% 7.7% 5.8% - 23.1%
Valve without CABG 24 NR NR NR NR NR NR
Valve with CABG 39 5.1% 0.0% - 10.3% 9.1% 3.0% - 24.2%
Pierce, Alice M.
CABG without Valve 38 0.0% 0.0% - 5.3% 9.1% 3.0% - 21.2%
Total Valve 4 NR NR NR NR NR NR
Valve without CABG 2 NR NR NR NR NR NR
Valve with CABG 2 NR NR NR NR NR NR
Plestis, Konstadinos
CABG without Valve 58 0.0% 0.0% - 3.4% 9.5% 2.4% - 16.7%
Total Valve 196 1.0% 1.0% - 5.1% 14.1% 8.6% - 20.3%
Valve without CABG 152 1.3% 0.7% - 3.9% 13.2% 7.7% - 20.9%
Valve with CABG 44 0.0% 0.0% - 9.1% 16.2% 5.4% - 24.3%
Polimenakos, Anastasios C.
CABG without Valve 0 NR NR NR NR NR NR
Total Valve 1 NR NR NR NR NR NR
Valve without CABG 1 NR NR NR NR NR NR
Valve with CABG 0 NR NR NR NR NR NR

Surgeon Results
Rate was significantly lower than expected.
Rate was not significantly different than expected.
Rate was significantly higher than expected.
NR: Not reported. Too few cases after exclusions.
PHC4 • Cardiac Surgery Report • Jan 2014 – Mar 2016 Data
Surgeon Results • 28
In-Hospital Mortality 30-Day Readmission
Surgeon
Total Number of Cases
Actual Percent
Expected Range Rating
Actual Percent
Expected Range Rating
Priest, Brian P.
CABG without Valve 118 1.7% 0.0% - 2.5% 9.8% 4.5% - 14.3%
Total Valve 57 3.5% 0.0% - 7.0% 21.8% 5.5% - 23.6%
Valve without CABG 34 2.9% 0.0% - 2.9% 24.2% 3.0% - 24.2%
Valve with CABG 23 NR NR NR NR NR NR
Ravishankar, Raman
CABG without Valve 53 0.0% 0.0% - 3.8% NR NR NR
Total Valve 5 NR NR NR NR NR NR
Valve without CABG 2 NR NR NR NR NR NR
Valve with CABG 3 NR NR NR NR NR NR
Reitknecht, Felice L.
CABG without Valve 106 0.0% 0.0% - 3.8% 10.5% 2.6% - 21.1%
Total Valve 119 2.5% 0.0% - 4.2% 12.2% 4.9% - 24.4%
Valve without CABG 75 1.3% 0.0% - 2.7% NR NR NR
Valve with CABG 44 4.5% 0.0% - 6.8% NR NR NR
Rizzoni, Walter E.
CABG without Valve 24 NR NR NR NR NR NR
Total Valve 4 NR NR NR NR NR NR
Valve without CABG 2 NR NR NR NR NR NR
Valve with CABG 2 NR NR NR NR NR NR
Rodriguez, Roberto
CABG without Valve 27 NR NR NR NR NR NR
Total Valve 75 2.7% 0.0% - 5.3% 14.3% 4.8% - 23.8%
Valve without CABG 53 1.9% 0.0% - 3.8% NR NR NR
Valve with CABG 22 NR NR NR NR NR NR

Surgeon Results
Rate was significantly lower than expected.
Rate was not significantly different than expected.
Rate was significantly higher than expected.
NR: Not reported. Too few cases after exclusions.
PHC4 • Cardiac Surgery Report • Jan 2014 – Mar 2016 Data
Surgeon Results • 29
In-Hospital Mortality 30-Day Readmission
Surgeon
Total Number of Cases
Actual Percent
Expected Range Rating
Actual Percent
Expected Range Rating
Rothberg, Martin Lee
CABG without Valve 3 NR NR NR NR NR NR
Total Valve 0 NR NR NR NR NR NR
Valve without CABG 0 NR NR NR NR NR NR
Valve with CABG 0 NR NR NR NR NR NR
Rushing, Gregory
CABG without Valve 2 NR NR NR NR NR NR
Total Valve 0 NR NR NR NR NR NR
Valve without CABG 0 NR NR NR NR NR NR
Valve with CABG 0 NR NR NR NR NR NR
Russo, Louis
CABG without Valve 156 1.3% 0.0% - 2.6% 11.9% 3.6% - 15.5%
Total Valve 75 1.3% 0.0% - 5.3% 10.4% 4.2% - 20.8%
Valve without CABG 42 0.0% 0.0% - 4.8% NR NR NR
Valve with CABG 33 3.0% 0.0% - 6.1% NR NR NR
Samuels, Louis E.
CABG without Valve 130 0.8% 0.0% - 3.8% 11.1% 3.7% - 16.0%
Total Valve 25 NR NR NR NR NR NR
Valve without CABG 13 NR NR NR NR NR NR
Valve with CABG 12 NR NR NR NR NR NR
Samy, Sanjay
CABG without Valve 95 1.1% 0.0% - 3.2% 5.6% 2.8% - 19.4%
Total Valve 75 2.7% 0.0% - 4.0% NR NR NR
Valve without CABG 50 4.0% 0.0% - 4.0% NR NR NR
Valve with CABG 25 NR NR NR NR NR NR

Surgeon Results
Rate was significantly lower than expected.
Rate was not significantly different than expected.
Rate was significantly higher than expected.
NR: Not reported. Too few cases after exclusions.
PHC4 • Cardiac Surgery Report • Jan 2014 – Mar 2016 Data
Surgeon Results • 30
In-Hospital Mortality 30-Day Readmission
Surgeon
Total Number of Cases
Actual Percent
Expected Range Rating
Actual Percent
Expected Range Rating
Seibel, P. Scott
CABG without Valve 19 NR NR NR NR NR NR
Total Valve 5 NR NR NR NR NR NR
Valve without CABG 5 NR NR NR NR NR NR
Valve with CABG 0 NR NR NR NR NR NR
Shah, Salil
CABG without Valve 282 2.5% 0.7% - 3.2% 14.0% 7.8% - 16.1%
Total Valve 58 8.6% 0.0% - 8.6% 16.1% 6.5% - 29.0%
Valve without CABG 40 5.0% 0.0% - 5.0% NR NR NR
Valve with CABG 18 NR NR NR NR NR NR
Shariff, Haji M.
CABG without Valve 6 NR NR NR NR NR NR
Total Valve 4 NR NR NR NR NR NR
Valve without CABG 2 NR NR NR NR NR NR
Valve with CABG 2 NR NR NR NR NR NR
Shears II, Larry
CABG without Valve 373 3.2% 0.5% - 2.9% 10.9% 7.6% - 14.5%
Total Valve 250 2.0% 0.4% - 3.6% 14.7% 8.5% - 17.5%
Valve without CABG 174 1.1% 0.0% - 2.9% 14.0% 7.4% - 18.2%
Valve with CABG 76 3.9% 0.0% - 6.6% 16.1% 5.4% - 21.4%
Shiose, Akira
CABG without Valve 2 NR NR NR NR NR NR
Total Valve 0 NR NR NR NR NR NR
Valve without CABG 0 NR NR NR NR NR NR
Valve with CABG 0 NR NR NR NR NR NR

Surgeon Results
Rate was significantly lower than expected.
Rate was not significantly different than expected.
Rate was significantly higher than expected.
NR: Not reported. Too few cases after exclusions.
PHC4 • Cardiac Surgery Report • Jan 2014 – Mar 2016 Data
Surgeon Results • 31
In-Hospital Mortality 30-Day Readmission
Surgeon
Total Number of Cases
Actual Percent
Expected Range Rating
Actual Percent
Expected Range Rating
Singer, Raymond L.
CABG without Valve 11 NR NR NR NR NR NR
Total Valve 246 0.0% 0.0% - 2.4% 14.2% 7.1% - 15.8%
Valve without CABG 217 0.0% 0.0% - 2.3% 14.9% 6.8% - 16.1%
Valve with CABG 29 NR NR NR NR NR NR
Singh, Deepak
CABG without Valve 78 5.1% 1.3% - 7.7% 10.9% 3.6% - 16.4%
Total Valve 101 5.9% 2.0% - 7.9% 9.3% 6.7% - 20.0%
Valve without CABG 65 3.1% 0.0% - 6.2% 6.4% 6.4% - 23.4%
Valve with CABG 36 11.1% 0.0% - 13.9% NR NR NR
Soleimani, Behzad
CABG without Valve 54 0.0% 0.0% - 3.7% 18.9% 2.7% - 16.2%
Total Valve 23 NR NR NR NR NR NR
Valve without CABG 12 NR NR NR NR NR NR
Valve with CABG 11 NR NR NR NR NR NR
Sortino, Antonio
CABG without Valve 49 0.0% 0.0% - 4.1% 10.4% 2.1% - 16.7%
Total Valve 32 6.3% 0.0% - 6.3% 26.7% 3.3% - 23.3%
Valve without CABG 16 NR NR NR NR NR NR
Valve with CABG 16 NR NR NR NR NR NR
Spray, Thomas L.
CABG without Valve 0 NR NR NR NR NR NR
Total Valve 1 NR NR NR NR NR NR
Valve without CABG 1 NR NR NR NR NR NR
Valve with CABG 0 NR NR NR NR NR NR
This surgeon submitted comments available at www.phc4.org.

Surgeon Results
Rate was significantly lower than expected.
Rate was not significantly different than expected.
Rate was significantly higher than expected.
NR: Not reported. Too few cases after exclusions.
PHC4 • Cardiac Surgery Report • Jan 2014 – Mar 2016 Data
Surgeon Results • 32
In-Hospital Mortality 30-Day Readmission
Surgeon
Total Number of Cases
Actual Percent
Expected Range Rating
Actual Percent
Expected Range Rating
Stahl, Russell
CABG without Valve 118 1.7% 0.0% - 2.5% 3.5% 4.7% - 16.5%
Total Valve 70 4.3% 0.0% - 7.1% 9.6% 5.8% - 23.1%
Valve without CABG 38 5.3% 0.0% - 2.6% NR NR NR
Valve with CABG 32 3.1% 0.0% - 12.5% NR NR NR
Stella, Joseph
CABG without Valve 98 1.0% 0.0% - 4.1% 9.0% 4.5% - 17.9%
Total Valve 55 1.8% 0.0% - 5.5% 13.0% 4.3% - 21.7%
Valve without CABG 34 0.0% 0.0% - 5.9% 10.0% 3.3% - 23.3%
Valve with CABG 21 NR NR NR NR NR NR
Stephenson, Edward R.
CABG without Valve 65 0.0% 0.0% - 3.1% 17.3% 1.9% - 15.4%
Total Valve 50 2.0% 0.0% - 4.0% 13.9% 2.8% - 22.2%
Valve without CABG 38 2.6% 0.0% - 5.3% NR NR NR
Valve with CABG 12 NR NR NR NR NR NR
Stivala, Charles
CABG without Valve 91 2.2% 0.0% - 3.3% 7.2% 2.9% - 15.9%
Total Valve 38 5.3% 0.0% - 7.9% NR NR NR
Valve without CABG 11 NR NR NR NR NR NR
Valve with CABG 27 NR NR NR NR NR NR
Sullivan, Lawrence X.
CABG without Valve 93 4.3% 0.0% - 3.2% 9.3% 3.7% - 18.5%
Total Valve 11 NR NR NR NR NR NR
Valve without CABG 8 NR NR NR NR NR NR
Valve with CABG 3 NR NR NR NR NR NR

Surgeon Results
Rate was significantly lower than expected.
Rate was not significantly different than expected.
Rate was significantly higher than expected.
NR: Not reported. Too few cases after exclusions.
PHC4 • Cardiac Surgery Report • Jan 2014 – Mar 2016 Data
Surgeon Results • 33
In-Hospital Mortality 30-Day Readmission
Surgeon
Total Number of Cases
Actual Percent
Expected Range Rating
Actual Percent
Expected Range Rating
Sutter, Francis P.
CABG without Valve 537 0.6% 0.6% - 2.0% 10.4% 7.3% - 13.2%
Total Valve 6 NR NR NR NR NR NR
Valve without CABG 2 NR NR NR NR NR NR
Valve with CABG 4 NR NR NR NR NR NR
Suzuki, Mark Masaru
CABG without Valve 148 1.4% 0.0% - 2.7% 9.4% 4.7% - 14.2%
Total Valve 51 3.9% 0.0% - 3.9% 15.4% 2.6% - 20.5%
Valve without CABG 28 NR NR NR NR NR NR
Valve with CABG 23 NR NR NR NR NR NR
Sylvin, Erik
CABG without Valve 2 NR NR NR NR NR NR
Total Valve 1 NR NR NR NR NR NR
Valve without CABG 0 NR NR NR NR NR NR
Valve with CABG 1 NR NR NR NR NR NR
Szeto, Wilson Y.
CABG without Valve 121 2.5% 0.0% - 3.3% NR NR NR
Total Valve 268 4.5% 0.7% - 3.7% 15.4% 6.2% - 20.0%
Valve without CABG 211 4.3% 0.5% - 3.8% 14.3% 6.1% - 22.4%
Valve with CABG 57 5.3% 0.0% - 7.0% NR NR NR
Takahashi, Mitsuko
CABG without Valve 142 0.7% 0.0% - 3.5% 10.1% 5.5% - 16.5%
Total Valve 42 4.8% 0.0% - 7.1% 17.1% 2.9% - 22.9%
Valve without CABG 21 NR NR NR NR NR NR
Valve with CABG 21 NR NR NR NR NR NR

Surgeon Results
Rate was significantly lower than expected.
Rate was not significantly different than expected.
Rate was significantly higher than expected.
NR: Not reported. Too few cases after exclusions.
PHC4 • Cardiac Surgery Report • Jan 2014 – Mar 2016 Data
Surgeon Results • 34
In-Hospital Mortality 30-Day Readmission
Surgeon
Total Number of Cases
Actual Percent
Expected Range Rating
Actual Percent
Expected Range Rating
Thakur, Navin S.
CABG without Valve 1 NR NR NR NR NR NR
Total Valve 0 NR NR NR NR NR NR
Valve without CABG 0 NR NR NR NR NR NR
Valve with CABG 0 NR NR NR NR NR NR
Theman, Terrill
CABG without Valve 4 NR NR NR NR NR NR
Total Valve 0 NR NR NR NR NR NR
Valve without CABG 0 NR NR NR NR NR NR
Valve with CABG 0 NR NR NR NR NR NR
Toyoda, Yoshiya
CABG without Valve 165 0.6% 2.4% - 7.3% 15.7% 9.6% - 24.1%
Total Valve 58 8.6% 1.7% - 12.1% NR NR NR
Valve without CABG 31 9.7% 0.0% - 12.9% NR NR NR
Valve with CABG 27 NR NR NR NR NR NR
Trivedi, Dhaval
CABG without Valve 206 2.4% 0.5% - 3.4% 4.4% 6.7% - 16.3%
Total Valve 69 1.4% 1.4% - 8.7% 9.1% 4.5% - 25.0%
Valve without CABG 25 NR NR NR NR NR NR
Valve with CABG 44 2.3% 2.3% - 13.6% NR NR NR
Trocciola, Susan M.
CABG without Valve 40 2.5% 0.0% - 2.5% 5.1% 2.6% - 17.9%
Total Valve 16 NR NR NR NR NR NR
Valve without CABG 12 NR NR NR NR NR NR
Valve with CABG 4 NR NR NR NR NR NR

Surgeon Results
Rate was significantly lower than expected.
Rate was not significantly different than expected.
Rate was significantly higher than expected.
NR: Not reported. Too few cases after exclusions.
PHC4 • Cardiac Surgery Report • Jan 2014 – Mar 2016 Data
Surgeon Results • 35
In-Hospital Mortality 30-Day Readmission
Surgeon
Total Number of Cases
Actual Percent
Expected Range Rating
Actual Percent
Expected Range Rating
Tsukashita, Masaki
CABG without Valve 7 NR NR NR NR NR NR
Total Valve 1 NR NR NR NR NR NR
Valve without CABG 0 NR NR NR NR NR NR
Valve with CABG 1 NR NR NR NR NR NR
Tuluca, Alexandra
CABG without Valve 153 1.3% 0.0% - 3.3% 16.9% 6.0% - 18.1%
Total Valve 26 NR NR NR NR NR NR
Valve without CABG 16 NR NR NR NR NR NR
Valve with CABG 10 NR NR NR NR NR NR
Vallabhajosyula, Prashanth
CABG without Valve 75 4.0% 0.0% - 4.0% 15.6% 3.1% - 18.8%
Total Valve 92 1.1% 1.1% - 7.6% 13.3% 6.7% - 26.7%
Valve without CABG 70 1.4% 0.0% - 5.7% 17.1% 5.7% - 25.7%
Valve with CABG 22 NR NR NR NR NR NR
Vasilakis, Alexander
CABG without Valve 127 0.8% 0.0% - 2.4% 9.5% 3.6% - 14.3%
Total Valve 103 2.9% 0.0% - 3.9% 8.7% 4.3% - 17.4%
Valve without CABG 71 1.4% 0.0% - 2.8% 6.7% 2.2% - 17.8%
Valve with CABG 32 6.3% 0.0% - 6.3% NR NR NR
Veluz, Jeffrey S.
CABG without Valve 127 1.6% 0.0% - 2.4% 7.5% 3.8% - 16.3%
Total Valve 28 NR NR NR NR NR NR
Valve without CABG 15 NR NR NR NR NR NR
Valve with CABG 13 NR NR NR NR NR NR

Surgeon Results
Rate was significantly lower than expected.
Rate was not significantly different than expected.
Rate was significantly higher than expected.
NR: Not reported. Too few cases after exclusions.
PHC4 • Cardiac Surgery Report • Jan 2014 – Mar 2016 Data
Surgeon Results • 36
In-Hospital Mortality 30-Day Readmission
Surgeon
Total Number of Cases
Actual Percent
Expected Range Rating
Actual Percent
Expected Range Rating
Vitvitsky, Eugene
CABG without Valve 1 NR NR NR NR NR NR
Total Valve 0 NR NR NR NR NR NR
Valve without CABG 0 NR NR NR NR NR NR
Valve with CABG 0 NR NR NR NR NR NR
Von Koch, Lear
CABG without Valve 96 7.3% 0.0% - 3.1% 10.2% 3.4% - 16.9%
Total Valve 194 1.5% 0.5% - 4.1% 14.9% 9.2% - 19.9%
Valve without CABG 129 0.8% 0.0% - 3.1% 15.1% 7.5% - 21.5%
Valve with CABG 65 3.1% 0.0% - 7.7% 14.6% 6.3% - 22.9%
Wechsler, Andrew S.
CABG without Valve 1 NR NR NR NR NR NR
Total Valve 1 NR NR NR NR NR NR
Valve without CABG 0 NR NR NR NR NR NR
Valve with CABG 1 NR NR NR NR NR NR
Wei, Lawrence M.
CABG without Valve 175 2.3% 0.0% - 2.3% 8.2% 4.9% - 14.8%
Total Valve 207 1.9% 1.0% - 5.3% 15.4% 9.4% - 19.5%
Valve without CABG 123 3.3% 0.0% - 4.1% 13.3% 6.7% - 20.0%
Valve with CABG 84 0.0% 1.2% - 8.3% 18.6% 6.8% - 23.7%
Weiss, Steven J.
CABG without Valve 64 0.0% 0.0% - 3.1% 18.4% 2.6% - 21.1%
Total Valve 71 1.4% 0.0% - 5.6% 12.5% 6.3% - 28.1%
Valve without CABG 54 1.9% 0.0% - 3.7% NR NR NR
Valve with CABG 17 NR NR NR NR NR NR

Surgeon Results
Rate was significantly lower than expected.
Rate was not significantly different than expected.
Rate was significantly higher than expected.
NR: Not reported. Too few cases after exclusions.
PHC4 • Cardiac Surgery Report • Jan 2014 – Mar 2016 Data
Surgeon Results • 37
In-Hospital Mortality 30-Day Readmission
Surgeon
Total Number of Cases
Actual Percent
Expected Range Rating
Actual Percent
Expected Range Rating
Wenger, Robert
CABG without Valve 134 2.2% 0.0% - 3.0% 14.5% 3.9% - 15.8%
Total Valve 52 0.0% 0.0% - 3.8% 14.3% 4.8% - 23.8%
Valve without CABG 37 0.0% 0.0% - 2.7% 10.0% 3.3% - 26.7%
Valve with CABG 15 NR NR NR NR NR NR
West, David
CABG without Valve 119 0.8% 0.0% - 2.5% 6.2% 3.7% - 14.8%
Total Valve 58 1.7% 0.0% - 5.2% 14.3% 4.8% - 23.8%
Valve without CABG 34 0.0% 0.0% - 2.9% NR NR NR
Valve with CABG 24 NR NR NR NR NR NR
Wheatley, Grayson H.
CABG without Valve 62 4.8% 0.0% - 6.5% 8.9% 8.9% - 26.7%
Total Valve 50 2.0% 0.0% - 6.0% NR NR NR
Valve without CABG 34 2.9% 0.0% - 5.9% NR NR NR
Valve with CABG 16 NR NR NR NR NR NR
Williams, Matthew L.
CABG without Valve 133 0.8% 0.0% - 3.8% NR NR NR
Total Valve 39 0.0% 0.0% - 7.7% NR NR NR
Valve without CABG 20 NR NR NR NR NR NR
Valve with CABG 19 NR NR NR NR NR NR
Woelfel, G. Frederick
CABG without Valve 181 0.0% 0.0% - 2.2% 5.5% 4.7% - 14.1%
Total Valve 106 1.9% 0.0% - 3.8% 15.1% 6.8% - 20.5%
Valve without CABG 77 0.0% 0.0% - 3.9% 17.3% 5.8% - 21.2%
Valve with CABG 29 NR NR NR NR NR NR

Surgeon Results
Rate was significantly lower than expected.
Rate was not significantly different than expected.
Rate was significantly higher than expected.
NR: Not reported. Too few cases after exclusions.
PHC4 • Cardiac Surgery Report • Jan 2014 – Mar 2016 Data
Surgeon Results • 38
In-Hospital Mortality 30-Day Readmission
Surgeon
Total Number of Cases
Actual Percent
Expected Range Rating
Actual Percent
Expected Range Rating
Woods, Edward L.
CABG without Valve 23 NR NR NR NR NR NR
Total Valve 10 NR NR NR NR NR NR
Valve without CABG 4 NR NR NR NR NR NR
Valve with CABG 6 NR NR NR NR NR NR
Wu, James
CABG without Valve 103 1.0% 0.0% - 2.9% 14.7% 4.4% - 16.2%
Total Valve 112 1.8% 0.0% - 4.5% 15.2% 7.6% - 20.3%
Valve without CABG 78 1.3% 0.0% - 3.8% 15.0% 6.7% - 21.7%
Valve with CABG 34 2.9% 0.0% - 8.8% NR NR NR
Yamane, Kentaro
CABG without Valve 110 3.6% 0.0% - 3.6% 14.1% 3.1% - 17.2%
Total Valve 49 0.0% 0.0% - 8.2% 15.6% 3.1% - 25.0%
Valve without CABG 30 0.0% 0.0% - 6.7% NR NR NR
Valve with CABG 19 NR NR NR NR NR NR
Zama, Nche
CABG without Valve 226 0.0% 0.0% - 1.8% 11.7% 4.4% - 13.1%
Total Valve 87 2.3% 0.0% - 5.7% 22.0% 6.0% - 22.0%
Valve without CABG 48 0.0% 0.0% - 4.2% 19.4% 3.2% - 22.6%
Valve with CABG 39 5.1% 0.0% - 10.3% NR NR NR