surrey learning disabilities costing survey cost … · 3 surrey learning disabilities costing...
TRANSCRIPT
1
SURREY LEARNING DISABILITIES COSTING SURVEY
COST ANALYSIS REPORT
Laing and Buisson
11 January 2013
2
SURREY LEARNING DISABILITIES COSTING SURVEY
COST ANALYSIS REPORT
Contents
Page
EXECUTIVE SUMMARY 5
RESULTS SUMMARY, CONCLUSIONS AND IMPLICATIONS DISCUSSION
INTRODUCTION
Introduction, objectives and confidentiality of data 6
Submissions received 7
Reliability of cost data 8
OVERVIEW OF RESULTS IN MEETING OBJECTIVES 8
CONCLUSIONS 19
SUGGESTIONS FOR THE WAY FORWARD 20
DETAILED RESULTS
OVERALL COSTS AND ADEQUACY OF FEES 25
RELATIVE UNIT COSTS AND FEES IN DIFFERENT HOUSING SETTINGS,
AND IN RELATION TO DIFFERENT LEVELS OF NEED 30
COST ANALYSIS WITHIN COST CATEGORIES 40
SALARIES AND STAFF COSTS 43
EXPENSES AND OVERHEADS
Individual Support Expenses 50
Support Overheads 50
Living Expenditure 51
Other Accommodation Costs 52
Rent and Returns on Property 52
Central Overheads 54
3
SURREY LEARNING DISABILITIES COSTING SURVEY
COST ANALYSIS REPORT
EXECUTIVE SUMMARY
Objective
The overall objective of this study has been to establish the actual, true costs of care being incurred
by providers of residential care and supported living services, in relation to individuals with learning
disabilities in Surrey, through a costing survey.
For this purpose, direct costs of support as well as a proportion of all organisational overhead costs
have been allocated within each individual costing, and both a required mark-up on operational
costs and return on property (where owned), added in, to arrive at the true cost of care.
Responses received
20 residential care and 12 supported living examples have been reviewed, validated and included in
the results. This sample is considered sufficient to draw some indicative conclusions on actual/ true
current costs of care, as well as for initial consideration of sustainable cost issues.
Overview of results
For residential care, mark-up percentages on total current operational costs reflected by existing
fees range from -35.5% to +18.5%, with an average of -8.1%, across the sample of 20 analysed. The
median mark-up is -6.9%. There are wide differences between actual current mark-ups, in relation to
individuals, arising for many different reasons, including changes in support needs not reflected in
increased or reduced fees, inflation not matched by equal fee increases etc. It is difficult to draw
firm conclusions about the overall margins across 900 individuals in Surrey from this small sample.
However, the fact that the average level of mark-up is negative when most providers need a
certain minimum mark-up to continue in business is a cause for concern.
In terms of mark-ups required by providers these vary between 7 and 13% for ‘for profit’ providers
and 0 to 5% for ‘not for profit’ providers, within the sample, across residential care and supported
living. Comparing actual current or ‘true’ costs of care with the mark-ups required by providers
indicates a shortfall averaging 9 % across the residential care sample.
For supported living, mark-up percentages on total current support costs reflected by existing fees
range from -16.2% to +15.4%, with an average of +0.4%, for the 12 examples analysed. The median
mark-up is +2.6%. Comparing actual current or ‘true’ costs of care with the mark-ups required by
providers indicates a shortfall averaging 3.4 % across the sample.
There is a wide divergence of unit cost levels between different examples within the sample,
particularly as regards salary costs. Six of the residential care examples relate to individuals
supported in settings where very high cost salaries continue to need to be paid under TUPE transfer
arrangements, where support has been transferred from the NHS or other public sector provision.
There is no evidence that higher or lower positive or negative mark-ups than in the rest of the
4
sample result from TUPE provision, as fees have normally been set to take these higher costs into
account (some show quite large deficits, whilst others show quite large profits/ surpluses).
Sustainability and implications
The lack of inflationary fee increases together with downward pressures on fees have reduced
provider margins and meant that many providers have not been able to increase salaries over the
last two to three years. However, provider feedback now suggests that current low pay rates
(excluding TUPE situations,) for those providers paying average or below average salaries, are
unsustainably low, and that some increases are required soon if there is not to be a serious problem
with staff retention and a knock-on effect in ensuring that high quality services can continue to be
provided.
Providers are indicating that the mark-ups calculated in the sample are not untypical of those for
other Surrey clients, supported in the same housing and elsewhere in Surrey (i.e. there is a mix of
positive and negative mark-ups). Although the small size of sample used cannot possibly be
concluded to have produced statistically valid results, there is no reason, given the broad mix of
examples in the sample, in our view, to believe that the results in this ‘snapshot’ sample would not
be broadly mirrored if the analysis was extended across the whole population of individuals with
learning disabilities in Surrey. We would expect that mark-ups on average would fall well short of
provider requirements and it seems more likely that there would be a net deficit position overall
than net positive mark-ups.
The additional pressures of the increasing burden of regulatory compliance, the move towards
greater personalisation, the need to make higher employer pension contributions, continuing
inflation in expenses, as well as the pressures to increase salaries for many are likely to exacerbate
this situation. The impact of increasing voids in residential care and higher financing costs are also
putting extra pressure on financial viability.
Justifiability of costs and opportunities for further cost savings
Of course, this is not to say that all provider true cost levels are fully justifiable, or that there may
not be scope for further cost-savings, particularly given the wide diversity in cost levels indicated in
the sample.
This wide divergence in unit costs has also meant that it has proved difficult to ascertain clear
differences in this small sample between the salary costs per hour of supporting individuals with
lower and higher hours of support need, and between unit costs in different housing settings.
However, it has proved possible to compute average costs for each major cost component, and to
estimate these differences, so as to illustrate the likely overall cost ranges for different levels of need
within both residential care and supported living, and for different housing sizes within residential
care. Detailed analysis of the breakdown of average costs within each cost component has also been
produced, to aid cost benchmarking and identification of cost saving opportunities.
Whilst many providers have undertaken significant cost reduction initiatives over recent years and
would claim that there is very limited scope for further savings, the disparity in unit costs,
particularly in relation to the most significant area of salary costs, merits further detailed
5
consideration. It is not just rates of pay which affect these substantial costs, but also the mix of
senior and standard support staff and the levels and cost of supervision.
Previous experience suggests that while pay rates may not be high, in many instances, staffing mix
can become top heavy and overly costly over time, as promoted staff are sometimes not re-
deployed and staffing structures not fully adjusted to achieve the most cost-effective mix of
experience.
The large number of high salary cost ‘TUPE’ constrained salaries also poses a significant cost problem
in Surrey. Although, it is very difficult to change commitments to continue to respect previous salary
terms and conditions, some providers are now successfully arguing the case for harmonisation of
salaries on economic grounds. This would therefore seem to be an important area for further work
in reducing the demands on very limited budgets.
There is also wide variation in central overheads, in particular, which typically constitute 8 or 9% of
total costs, and seem to merit more detailed review.
Suggestions for the way forward
It may be appropriate to extend some aspects of the work to date, to validate initial findings at
individual level, and to consider the extent of financial deficits and related financial risks at overall
home/service levels and across businesses, bearing in mind sustainability, voids etc.
Suggestions have also been made for further work which could now be undertaken, to identify
different staff support unit costs per hour for different levels and types of need, as well as types of
support. This could also embrace better calibration of differences in unit costs for different housing
settings, paving the way for better informed calculation of the levels of unit costs justified.
We believe that serious consideration ought also to be given to the way in which fees are agreed
and, in particular, the way in which hourly fee rates are used in supported living. The mixing of direct
salary costs, which simply increase with extra hours of support, and a variety of variable and fixed
overheads which do not, gives rise to significant distortions in rates and their adequacy, in meeting
lower and higher levels of need. These mask genuine, justifiable differences in costs and can lead to
poor decisions on the cost-effectiveness of relative proposals and fees by the local authority, as well
as poor assessment of financial viability and pricing by providers.
An improved approach to fee setting could also greatly facilitate providers and the local authority
working much more cohesively together, collaborating more effectively in identifying 'efficient/
economic' cost levels, which also take account of economies of scale.
These and other suggestions could also be used to better address the re-assessment of individual,
future, more personalised support needs and related costs, in relation to which a major exercise is
under way. Whilst consideration of the level of support needs of individuals and personal budgets
has been outside our scope, this is clearly a very important, complementary area of study. There is
genuine potential to better respect individual choice in relation to support options, as well as to
identify opportunities to employ a more cost-effective mix of support resources, including greater
levels of community support. Better approaches to investing in developing independent living skills
and reducing dependency levels and support costs over time also need to be addressed.
6
SURREY LEARNING DISABILITIES COSTING SURVEY
COST ANALYSIS REPORT
RESULTS SUMMARY, CONCLUSIONS AND IMPLICATIONS DISCUSSION
INTRODUCTION
This report summarises findings and conclusions arising from the learning disabilities service
provision costing survey conducted by Laing and Buisson, on behalf of Surrey CC during October and
November 2012.
The Results Summary, Conclusions and Implications Discussion section sets out the detailed
objectives and discusses the sample and data received back, before summarising results achieved
against each of these objectives, and then exploring the issues relating to results, drawing
conclusions and setting out how the results might be used , in some possible next steps. For those
wishing to explore and use the results in more detail, the Detailed Results section includes a range
of charts and tables, as well as commentary on average costs under each cost component, which
may be of particular interest as benchmarks and to explore opportunities for improving cost-
effectiveness. The Executive Summary before this current section summarises the overall results
and conclusions in relation to actual/true costs of care in straightforward terms, and highlights a few
suggestions, as a basis for agreeing next steps.
Objectives
The overall objective of this study has been to establish the actual, true costs of care being incurred
by providers of residential care and supported living services, in relation to individuals with learning
disabilities in Surrey, through a costing survey.
More specifically, the subsidiary objectives have been to provide a range of different analyses, for
different purposes, including:
1) Overall costs by individual, to consider both the adequacy of current fees and to provide a
basis for calculating sustainable overall cost and fee levels for the future
2) An indication of the relative unit costs of supporting individuals in different housing settings
(particularly 3, 6, 8 and 10 bedroom homes within residential care), so as to take account of
this in future fee setting
3) An indication of any differences in unit support costs for individuals with different levels of
requirement, so as to help inform thinking around setting overall fee budgets and personal
budgets for those with different levels of need
4) An analysis of costs across providers within different cost categories, to provide benchmark
comparisons for providers, in furthering their (and Surrey CC’s) cost reduction objectives
In finalising the original proposal, a slightly revised definition of terms was agreed which then
described actual/true costs as being ‘current costs’, distinguishing these from ‘sustainable’ costs for
the future.
The idea of establishing sustainable cost levels is to recognise that in some cases current costs might
not be sufficient, for example, to recruit and retain sufficient numbers of good staff to deliver the
7
level of quality service required. On the other hand, particularly where staff have had to be taken on
from the public sector, as a result of service outsourcing, on guaranteed TUPE transfer
arrangements, then current costs might exceed sustainable, economic cost levels.
Sustainable costs need to be paid to ensure that good outcomes can continue to be provided for
individuals, that good quality providers continue to be financially viable and that future market
supply of services is sufficient to meet needs.
Confidentiality of data
In agreeing to provide data on current costs and actual margins, an undertaking was made in the
letter to providers that: “Only Surrey County Council (SCC) will ever know which individuals you have
been asked to provide cost data for, but only Laing and Buisson will ever know the individual cost
data you provide. Costs will never be reported back to SCC or anyone else on an individual or
organisation basis. All reporting will be at aggregate or average level”.
This has obviously meant that we have had to constrain the detailed reporting back on the results of
the exercise, especially in not disclosing individual costs and fees directly, but it has still been
possible to take into account the resultant actual mark-ups and deficits, in calculating averages and
in summarising the range of results obtained, as well as in drawing conclusions, focussing on
highlighting the true costs of care.
Submissions received
Residential Care:
Included in the analysis:
3 bed – 4
5 bed – 1
6 bed –7
7 bed - 1
8 bed –5
9 bed - 1
10 bed – 1
Total – 20 (out of a sample of 40)
Of these, 10 for profit and 10 not-for-profit. These cover only 14 providers, as some providers
submitted extra examples, to make up for shortfalls in other responses.
A further 2 examples were received but have not been included in the analysis, due to corrections
not having been received back, despite repeated requests. A further example has been received
from Surrey CC, but not analysed in detail, as received too late to include in the analysis.
(An additional 10 in the sample were not followed through as these were duplicate costings within the same
homes, and a further 7 examples were provided, beyond the initial sample).
Supported Living:
Total, for range of housing settings: - 12 (out of a sample of 20).
4 for profit and 8 not-for-profit.
A further 2 examples have been received but have not been included in the analysis; one of these
8
was not corrected/completed, due to difficulties in aligning overhead costs in the midst of
restructuring, whilst one was excluded as not representative of typical supported living costs or fees.
Failure to respond can be put down to a combination of reasons, but mainly lack of resources arising
from other work pressures (particularly as many providers are now also finalising budgets for next
year), absence of in-house costing skills or temporary non-availability of key management, rather
than lack of support for the initiative.
Whilst overall numbers of useable responses are somewhat disappointing, there are considered to
be sufficient to draw worthwhile conclusions and to provide a basis to build on for cost estimation
and fee setting.
Reliability of cost data
A lot of time was spent at the outset to produce robust and flexible costing templates, to ensure that
costings can be properly computed, as well as to provide flexible options for providers to be able to
compute costs, and to allocate overhead costs in particular, especially within supported living.
Although the range of options incorporated has meant additional complexity at first sight, and more
time required for providers to understand and get to grips with the templates, this does seem to
have worked well in terms of the results produced. Where input has looked incorrect, or
unexpected results have been produced, these have been questioned rigorously with providers and
amended where necessary. The fact that data for each provider is being treated confidentially and
that all the results have been reviewed for reasonableness means that the results are considered to
be reliable, for purpose, as actual current costs (though this is different from confirming the levels as
necessarily fully justifiable).
Overall margins have first been compared with fees, before the detailed cost analysis has been
reviewed and comments made on cost levels, including consideration of justifiability. All submissions
have been tabled in a range of cost analyses, which have then been used to calculate and compare
key unit costs and ratios.
As well as including an overview of results in meeting objectives, this section of the report includes
consideration of the impact of inadequate mark-ups and deficits, overall fees and the use of
different cost data for different purposes, as well as conclusions and suggestions for further work,
with a range of questions to consider.
OVERVIEW OF RESULTS IN MEETING OBJECTIVES
Results in meeting specific objectives have been summarised below.
OVERALL COSTS AND THE ADEQUACY OF FEES
Objective 1: Analyse overall costs by individual, to consider both the adequacy of current fees and
to provide a basis for calculating sustainable overall cost and fee levels for the future
9
Given the number and mix of submissions received back from providers, and the effective operation
of the tailored costing models developed, it has been possible to fully analyse submissions received,
to calculate current costs and identify mark-ups being achieved in relation to actual fee levels.
This is at an individual level and highlights the extent of any over or under funding, assuming that
levels of need are already correctly assessed i.e. no consideration has been given to whether the
hours of support commissioned and other support arrangements are sufficient or greater than
necessary, as this was outside the scope of the survey. Useful insights have also been gained in
relation to sustainable costs, although more work is needed to consider sustainable fee levels for the
future.
For residential care, mark-up percentages on total current operational costs reflected by existing
fees range from -35.5% to +18.5%, with an average of -8.1%, across the sample of 20 analysed. The
median mark-up is -6.9%. Of 7 with positive mark-ups, only 2 have mark-ups in excess of 15%, while
the remaining 5 show mark-ups of less than 10%. Whereas, of the 13 with deficits, only 4 show
deficits of under 6%, while the remaining 9 all show deficits of over 13%. There are wide differences
between actual current mark-ups, in relation to individuals, arising for many different reasons,
including changes in support needs not reflected in increased or reduced fees, inflation not matched
by equal fee increases etc.
Neither whether the provider is a ‘for profit’ or ‘not for profit’ provider, nor whether the individual is
in a ‘high salary cost’ placement or otherwise seems to have a clear, discernible bearing on surpluses
or deficits arising. 6 out of 20 examples relate to situations where ‘high salary costs’ continue to
need to be paid under TUPE arrangements, for individuals transferred from hospitals and other
public sector provision. Fees have generally been increased to address these higher cost
commitments, but some are now showing surpluses while others are in deficit. It is difficult to draw
firm conclusions about the overall margins across 900 individuals in Surrey from this small sample.
However, the fact that the average level of mark-up is negative when most providers need a
certain minimum mark-up to continue in business is a cause for concern.
In terms of mark-ups required by providers (per their submissions, across both residential care and
supported living examples), these vary between 7 and 13% for ‘for profit’ providers and 0 to 5% for
‘not for profit’ providers, within the sample, taking account of different financing and ownership
arrangements, particularly for ‘for profit’ providers, as well as charity restrictions on a making a
surplus, for ‘not for profits’. Comparing actual current or ‘true’ costs of care with the mark-ups
required by providers indicates a shortfall averaging 9 % across the residential care sample,
reflecting the fact that some of the largest deficits are offset by zero or low mark-up requirements,
in some cases, reducing the average gap.
For supported living, mark-up percentages on total current support costs reflected by existing fees
range from -16.2% to +15.4%, with an average of +0.4%, for the 12 examples analysed. The median
mark-up is +2.6%. Of the 7 with positive mark-ups, 3 have mark-ups over 10%, with 3 of the
remaining 4 being 5% or below. All of the 5 deficits exceed 6%, with 3 over 10%. There are no
discernible differences between ‘for profit’ and ‘not for profit’ in this regard. Comparing actual
current or ‘true’ costs of care with the mark-ups required by providers indicates a shortfall averaging
3.4 % across the supported living care sample. At face value this seems slightly less an adverse
overall situation than in residential care.
10
However, results have been distorted somewhat by some providers allocating overheads based on
relative individual hours or relative income, when there is no evidence that the costs concerned vary
in relation to levels of individual need. This tends to overstate profits/surpluses or understate
deficits for individuals with lower needs and, conversely, understate profits/ surpluses or overstate
deficits for those with high needs. Within the sample there are 4 out of 12 examples where losses
are likely to be understated and only one where the surplus is likely to be understated. Although the
impact of this effect hasn’t been calculated, this is thought not likely to be significant, but
nevertheless likely to turn the average mark-up negative overall.
RELATIVE UNIT COSTS AND FEES IN DIFFERENT HOUSING SETTINGS, AND IN RELATION TO DIFFERENT LEVELS
OF NEED
Objective 2: Provide an indication of the relative unit costs of supporting individuals in different
housing settings (particularly 3, 6, 8 and 10 bedroom homes within residential care), so as to take
account of this in future fee setting.
The low numbers of responses received in relation to home sizes other than 6 bedroom homes and
the quite significant differences in unit costs between providers, in relation to different levels of
need, have made it difficult to provide fully differentiated cost models to meet both these
requirements in full. However, it has still been possible to use overall averages.
This has enabled us to produce charts indicating approximate total cost ranges, including mark-up,
for lower, moderate and high needs individuals in varying size housing settings, as illustrated in the
detailed report, for residential care. We know that unit costs tend to decline slightly as the size of
housing increases, as fixed costs are shared between more residents, based on economies of scale
principles. Whilst there was some evidence of this in the data, there were also anomalies arising
from the wide range of provider cost levels, so this effect has had to be broadly estimated, rather
than being highly accurate.
More work could quite readily be done to refine and confirm the relative unit costs for different
sizes of home, to fully meet Objective 2, including looking at relative property costs. It is not
necessary to provide precise ratios to take account of the differences in unit costs by home size,
simply broad adjustment factors.
Objective 3: Provide an indication of any differences in unit support costs for individuals with
different levels of requirement, so as to help inform thinking around setting overall fee budgets
and personal budgets for those with different levels of need.
Nor has it been possible, for the same reasons, to identify differences in staff unit costs per hour, as
between individuals with lower needs and those with higher average needs. We would expect that
staff working with those with higher needs would need to be more experienced and higher paid
individuals, but this cannot be identified from the data, due to differences in levels of cost between
providers, when looking at examples for individuals with different hours of support requirements.
In practice this is likely to have more of an effect in supported living, where there is more dedicated
staffing, as opposed to shared staffing in group living. There will be some difference in residential
11
care, but it should not be so material, in the context of the range of overall average unit costs
produced. An estimated adjustment has, though, been made in charts produced for supported
living. The best way to fully meet objective 3, would be to calibrate this effect first within a single
cost structure (by looking at costs in support of different levels of need for a single provider, where
pay structures are consistent), and then to validate and refine the differentials for staff unit costs, by
repeating the exercise within one or two other providers, for different levels of need.
It would also be expected that levels of management supervision, behaviour management support
and individual expenses would increase for individuals with higher support needs, increasing average
unit costs accordingly. But again this cannot be discerned from the data received given, in addition,
that many submissions were for similar levels of moderate to high needs placements in residential
are. Refinement of unit costs for different levels of need for these factors could also be achieved as
part of the same exercise to understand differences in staff unit costs.
Nonetheless, it has been possible to produce a considerable amount of analysis of average costs
across providers, for both residential care and supported living, and this has proved useful in
identifying the main differences in unit costs for different levels of need, based on a combination of
variable and semi-variable salary related hourly costs and fixed or semi-fixed weekly costs, for all the
other major cost categories. These analyses have been included in the detailed report.
So overall, these total costs can be considered a good starting point, in identifying the current costs
of care, and showing how the overall total unit costs are likely to vary with different levels of need
and in different housing settings. A full spectrum of indicative cost levels per week for different
levels of need can readily be produced if needed, using average costs calculated and the cost models
developed and refined specifically for this purpose. However, the figures produced here should still
be viewed as indicative, rather than definitive, for individuals with these levels of need.
COST ANALYSIS WITHIN COST CATEGORIES
Objective 1: Analyse overall costs by individual, to consider both the adequacy of current fees and
to provide a basis for calculating sustainable overall cost and fee levels for the future
Objective 4: Provide an analysis of costs across providers within different cost categories, to
provide benchmark comparisons for providers, in furthering their (and Surrey CC’s) cost reduction
objectives
Sections have been set out in the main report which consider each major component of costs in
turn, commenting on the level and variability of these costs, as well as considerations relating to
sustainability- in addressing Objective 1. Some useful analysis has also been produced in support of
Objective 4, with average costs being adjusted by line item within each cost category, so that
averages are not distorted by different numbers of times that costs are reported in each line item.
This analysis is also described in detail in the main report. Only a few key points from the three key
cost category sections are summarised here.
12
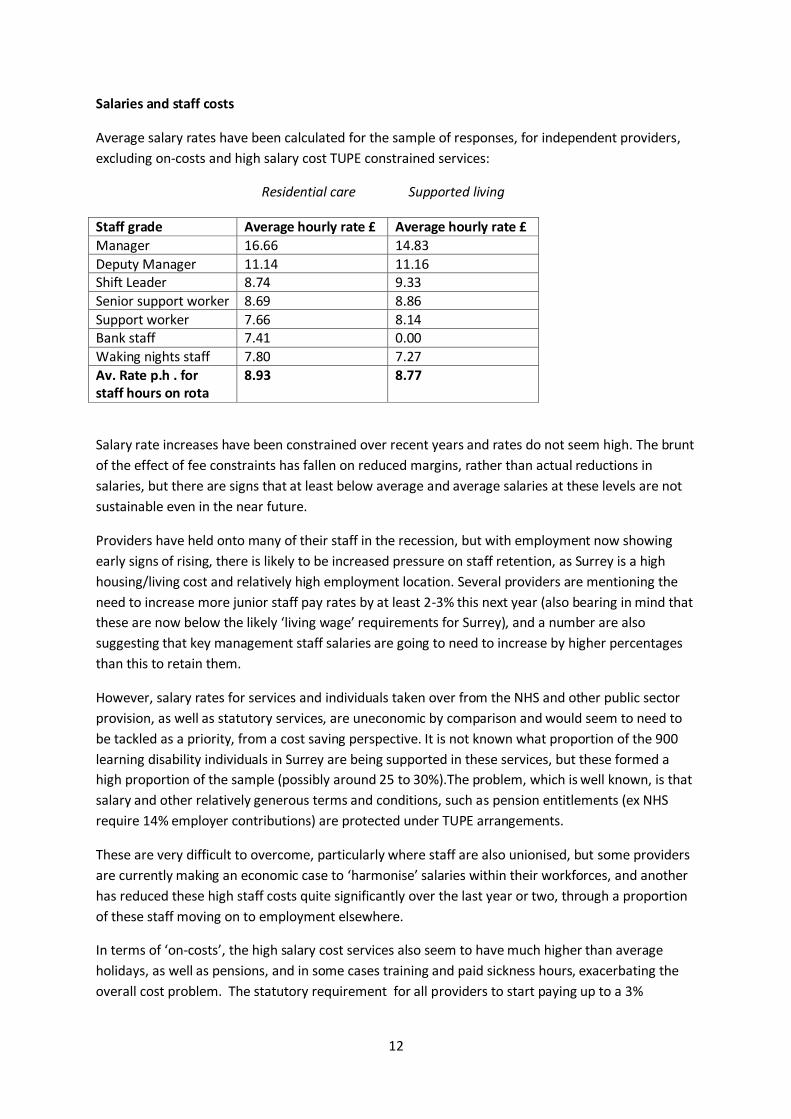
Salaries and staff costs
Average salary rates have been calculated for the sample of responses, for independent providers,
excluding on-costs and high salary cost TUPE constrained services:
Residential care Supported living
Staff grade Average hourly rate £ Average hourly rate £
Manager 16.66 14.83
Deputy Manager 11.14 11.16 Shift Leader 8.74 9.33
Senior support worker 8.69 8.86
Support worker 7.66 8.14 Bank staff 7.41 0.00
Waking nights staff 7.80 7.27
Av. Rate p.h . for staff hours on rota
8.93 8.77
Salary rate increases have been constrained over recent years and rates do not seem high. The brunt
of the effect of fee constraints has fallen on reduced margins, rather than actual reductions in
salaries, but there are signs that at least below average and average salaries at these levels are not
sustainable even in the near future.
Providers have held onto many of their staff in the recession, but with employment now showing
early signs of rising, there is likely to be increased pressure on staff retention, as Surrey is a high
housing/living cost and relatively high employment location. Several providers are mentioning the
need to increase more junior staff pay rates by at least 2-3% this next year (also bearing in mind that
these are now below the likely ‘living wage’ requirements for Surrey), and a number are also
suggesting that key management staff salaries are going to need to increase by higher percentages
than this to retain them.
However, salary rates for services and individuals taken over from the NHS and other public sector
provision, as well as statutory services, are uneconomic by comparison and would seem to need to
be tackled as a priority, from a cost saving perspective. It is not known what proportion of the 900
learning disability individuals in Surrey are being supported in these services, but these formed a
high proportion of the sample (possibly around 25 to 30%).The problem, which is well known, is that
salary and other relatively generous terms and conditions, such as pension entitlements (ex NHS
require 14% employer contributions) are protected under TUPE arrangements.
These are very difficult to overcome, particularly where staff are also unionised, but some providers
are currently making an economic case to ‘harmonise’ salaries within their workforces, and another
has reduced these high staff costs quite significantly over the last year or two, through a proportion
of these staff moving on to employment elsewhere.
In terms of ‘on-costs’, the high salary cost services also seem to have much higher than average
holidays, as well as pensions, and in some cases training and paid sickness hours, exacerbating the
overall cost problem. The statutory requirement for all providers to start paying up to a 3%
13
employer pension contribution within the next year or two is also already adding to the burden of
staff costs.
Management supervision costs vary considerably across providers and may still offer some scope for
improving cost-effectiveness. Several large ‘not for profit’, as well as some ’for profit’ providers
have taken layers out of area management supervision, increasing spans of control. In other cases
there are different approaches being followed to use or otherwise of management staff on the rota,
which might be a fruitful area to explore, in terms of relative costs.
It is therefore important for providers to look at staff costs overall, rather than simply treating
supervision as totally separate from ‘on rota’ costs. It is also important to look at the mix of staff
used both on and off rota, in exploring whether the overall average staffing cost might be too high,
even if hourly staff pay rates are not in any way excessive, or even perhaps sufficient.
Cost saving exercises we have undertaken for learning disabilities providers in the past have
revealed opportunities to manage staff costs down in the medium term, where the mix of staff has
become ‘top heavy’ relative to support requirements over time, as staff have been promoted and
not many have been re-deployed or moved on. There was also scope to change the mix of staff
undertaking the overtime work, as this can tend to be the prerogative of the more senior staff.
However, this requires a balanced approach, as more experienced staff tend to provide more
effective, quality support (though not necessarily), and excessive short-term staff turnover can also
undermine quality and lead to increased costs of recruitment, training and supervision.
Return on Property
A new approach has been used (for the first time in learning disabilities) to calculate these costs for
residential care, splitting out the return on the property from the mark-up on operational costs
needed, to replace the approach based on calculating an overall return on capital, as used in the
care funding calculator. (This has been shown to give rise to some anomalous results, for smaller
homes and higher needs residents). A 7% return has been used, based on Laing and Buisson
research on the rate of return a commercial investor would typically require from a property leased
to a customer with a reasonably good covenant (i.e. representing a good risk). This is consistent with
the approach which has now been adopted in the Laing & Buisson ‘fair market price’ models for
older peoples’ residential and nursing social care.
Property costs have been updated from original cost to a very broad estimate of current market
value for each property, to allow for the maintenance of returns in real terms, due to the impact of
inflation. Provider estimates of market values have been discounted somewhat to recognise that
conversion of homes for alternative use might reduce values. It is recognised that the figures used
for these returns are only approximate and that more work ought to be done in this area, to assess
market values more rigorously, and to analyse and justify the impact on overall fees, if this approach
is to be taken forward and applied more widely.
Central Overheads
These represent quite a large proportion of overall operational costs. Within the charts produced
and already discussed, average central overheads derived from the sample and included for
residential care amount to £144 per week (9.2% of average operational costs) and for supported
14
living £89 per week (8.6% of average operational costs) per individual. It is not clear exactly why
there is such a big difference between residential care and supported living and this might usefully
be explored further, along with the differences between organisations of different sizes.
One would expect some central costs not to be applicable to supported living, and in particular
property maintenance costs, as housing-related costs need to be covered by housing benefits, rather
than social care budgets. Other complications relate to the basis of charging for central overheads,
sometimes based on relative income for each scheme, sometimes as a percentage of direct costs,
occasionally including a margin (all of which have hopefully been stripped out in the sample data).
Central overheads are an important area for further exploration from a cost-saving perspective.
IMPACT OF INADEQUATE MARK-UPS AND DEFICITS
Providers have been asked specifically, wherever individual costings show a surplus or a deficit,
whether this result is expected or surprising, what the reasons might be, and whether the result is
typical of the results which might be found for other individuals in the same home or service, or in
other Surrey services. Generally, the feedback has been that these are not untypical results, and that
similar costings and financial outcomes would be likely to be found in looking at other Surrey
individuals for the same provider.
Of course, there are some exceptions to this, where individuals are known to be over or under
funded relative to their needs, but these may tend to balance out across the sample. Although the
small size of sample used cannot possibly be concluded to have produced statistically valid results,
there is therefore no reason to believe that the results in this ‘snapshot’ sample would not be
broadly mirrored if the analysis was extended across the whole population of learning disability
individuals in Surrey. Given the reasonably typical mix of individuals and providers in the sample, as
well as our discussions with providers, we believe that the overall picture should be broadly similar,
although average costs and mark-ups calculated within the sample will be bound to differ to a
degree from those for the whole population of individuals. It should be emphasised that this is a
judgement based on our knowledge and experience, rather than a definitive conclusion.
Given that the sample results indicated that on average providers are experiencing deficits in
residential care and probably also in supported living, or possibly breakeven on average at best,
discussion within the project steering committee considered the question as to whether these net
overall deficit results are being fully evidenced in practice by providers. Various reasons were
suggested as to why the adverse effect of inadequate margins may not be as evident as expected:
1) Where providers are supporting individuals from other local authorities, those fees may not
be as restricted as in Surrey
2) Where residential care providers are long established and have substantially paid off their
mortgages, cash-flow may not be as adverse as deficits indicated; or not-for-profit providers
may not require a full commercial return on property
3) Timing – the adverse effect of fee restrictions/ reductions is only now being felt most
significantly in the current years trading, but will be reflected in the accounts to be
prepared/ published within the next year, so the impact has not yet been publicised
4) Some small private providers are prepared to treat their own time costs for proprietor
supervision and central management as not fully recoverable, and can therefore continue in
15
business despite suffering losses, if accounts and costings for pricing purposes had been
drawn up on a fully costed basis
5) The mix of examples within the sample may not be typical, or costings may be
disproportionately affected by allocation of overheads; in particular, a provider may, in
practice, have a high proportion of supported living clients with high needs, where even low
hourly rates might pay off, if there are plenty of hours of support to provide a high
contribution to overheads
6) The effects of inflation on costs have been minimised by holding down salaries for the last
few years (but are these salary rates sustainable?- increases may need to be conceded soon
or staff retention will become a major problem)
7) Deficits may be offset/ subsidised by surpluses elsewhere in the business, (say) in other
areas of social care or healthcare.
The answers to this question may be to some extent a matter of conjecture, in the absence of more
detailed investigation, but a few additional comments may be helpful.
1. Whilst anecdotally, some providers think they are under more fee pressure in Surrey than
elsewhere, they are typically under fee pressure throughout the country, so it is unlikely that
margins are still high enough with other local authorities to materially subsidise shortfalls in Surrey.
From discussions with providers, it is also clear that quite a number are currently involved or have
recently been involved in some major restructuring and other cost saving initiatives. In particular,
several large ‘not for profit’ providers are currently experiencing overall deficits, so the combination
of the high inherited cost levels (where staff have been taken on through TUPE arrangements), as
well as inadequate fee levels in some cases, coupled with voids in particular in residential care,
means that this is certainly not an isolated problem. In fact, the feedback from major local and
national ‘not for profit’ providers in particular, that they are currently, and have in the recent past
been experiencing overall deficits, is evidence contradicting the perception that serious financial
difficulties for providers are not fully apparent.
2. The examples in the sample do not seem to include situations where mortgages have been paid
off and costs are still being recognised, thereby overstating the potential cash-flow implications, if
not the true full costs of care. In the wider local learning disabilities support provision market, there
are known to be many situations where fees have been reduced as a result of reduced property
costs, so presumably there will also be situations where this has not been the case and the cash-flow
implications of deficits on a profit and loss basis are not quite so severe as calculated deficits might
suggest. However, other additional cash-flow demands and the requirement for additional working
capital also need to be taken into account (see comments under ‘overall fee considerations’, below).
3. Anecdotal comments from providers support the contention that results for the current year will
show reduced profitability.
4. Several small private providers selected for the sample were unable to complete the survey due to
lack of time and costing resources, so only one example is actually included in the results. So, it is not
the case that survey results include material elements of full proprietor costs which providers are
prepared to operate without fully recouping in fees. For these small providers as a whole, across
Surrey, full costs are likely to be understated in current fees, thus understating net deficits or
16
shortfalls in meeting mark-ups required (although some of these proprietors may still be able to
continue in business without recouping them in full).
5. Although we are not fully aware of the mix of individuals supported by different providers, we
understand that many of the lower needs clients in supported living are supported by the larger ‘not
for profit ‘ providers. It therefore seems unlikely that the overall financial situation and cover for
fixed overheads will be substantially more favourable, at least for these organisations than the
indicative results within our sample.
6. Sustainable levels of cost are very likely to be higher than most of the costs included within the
results of this survey, both for salary and other costs (with the exception of high salary cost, TUPE
constrained staffing); one provider quoted a committed 3% increase in rents this year, which will
simply further reduce margins by a material amount, in the absence of fee increases.
7. There are unlikely to be many providers who can draw on large surpluses from other areas of
social care business, given the similar fee pressures across the board, unless the bulk of other clients
comprise self-funders, who pay far more than local authorities in fees.
OVERALL FEE CONSIDERATIONS
‘Not for profit’ providers tend to be facing greater problems as a result of high inherited staffing
costs, and consequent difficulties in maintaining price competitiveness for new business.
Positive margins in residential care have often in the past had to be used to supplement supported
living housing deficits, especially by private providers. However, with the continuing move to use
supported living for nearly all new placements resulting in increasing numbers of residential care
voids, coupled with fee restraints, this is increasingly no longer possible. Private providers are also
typically finding it much more difficult than ‘not for profits’ to deregister and restructure residential
care to convert this to supported living, because of inadequate housing allowances and more
stringent bank financing conditions which continue to need to be satisfied.
The cost of any recent restructuring, as well as the recent extra financing costs of having to receive
fees later than previously (as local authority payments in advance are eliminated), are not likely to
be fully covered in individual costings. Equally, the financing costs of establishing and only filling any
new provision over an extended period will not be allowed for. These factors increase overall costs
either directly (for restructuring), or indirectly, via the need for extra working capital financing and
additional interest costs. Once the cost becomes on-going it should be included in central overheads,
but any new costs are unlikely to be budgeted in advance and therefore covered and allocated.
DIFFERENT COSTS FOR DIFFERENT PURPOSES
This costing survey and the costing models used are based on the accounting principle that the full
costs of any organisation, including central overheads in particular, need to be recovered, plus a
margin or surplus on top, if the service and business is going to be viable. So the true costs of care
need to recognise the total actual costs, and this is what needs to be focussed on, amongst other fee
related issues commented on above, in looking at on-going provider financial viability.
However, the related questions regarding how fees are calculated in practice, how overheads are
allocated in pricing, what levels of cost are justified in diverse particular situations, and how prices
17
for services are agreed, involve a range of additional considerations and may require modified
approaches. This is not so straightforward in practice, but merits some clarification here, especially
in view of the different approaches adopted by providers in response to the survey, when allocating
overhead costs.
For one thing, start-up businesses, and small established businesses may not have the economies of
scale to expect to fully recover all their overheads, if these need to be high initially relative to the
scale of the business, whereas the allocated cost of largely fixed central overheads to individuals
supported in a very large business may be low, and therefore fully recoverable in fees.
Fixed and variable costs and the basis of overhead allocation
This also begs the question as to what extent these central costs are actually fixed, and which central
costs will vary, and to what extent, as further individuals need to be supported. For example, any
accounting and payroll work would be expected to increase as more individuals are taken on, as well
as more staff to support them, also increasing the human resources department workload.
Providers and local authorities both really need to understand fixed and variable costs, and the
impact of changes in key variables on unit costs, especially in relation to supported living fees. By
using a standard hourly fee rate, the local authority is enabling the variable direct salary costs to be
calculated and covered in the hourly rate, but has to make an assumption about the allowance in the
rate for fixed costs which do not vary with the level of support provided. This can therefore result in
over or under recovery of a fair proportion of the fixed overheads, in costings relating to individual
individuals.
For an individual with lower needs and low hours of support, the amount of fixed overheads
recovered in the hourly rate available for just a few hours will be very small, whereas for high needs
individuals, a proportion of fixed overheads will be recovered for every hour of support, potentially
leading to over-recovery of fixed overheads. This is assuming that all individuals ought to share these
equally, where these costs tend to increase with extra numbers of individuals, if at all, rather than in
any way being influenced by the different levels of support which individuals need. So high needs
individuals tend to end up subsidising lower needs individuals, in terms of the fees received, based
on standard hourly rates, and lower needs clients can be unprofitable to support.
However, this is only one perspective and does not deal with the whole picture. An established
provider can still afford to take on some new low needs and low fee individuals, if the fee obtained is
sufficient to cover all the variable costs and still make a positive financial contribution to what are
the truly fixed elements of the central costs. But, if most of the individuals supported are already
lower need, then there may still simply be insufficient overall contribution to cover all the fixed costs
and the provider could end up in an overall deficit situation.
So the mix of individuals is important and, if hourly rates are set at low tight levels, it will only
probably be possible for providers to take on a lot of lower needs clients if they also have a
reasonable number of high needs clients providing a much greater financial contribution. The
implications of this standard hourly rate pricing policy can therefore be significant in the market-
place.
18
For the local authority seeking to place quite a number of individuals with lower hours support
requirements , they need to find providers who can utilise economies of scale in relation to central
costs and who also probably have sufficient numbers of high hour needs individuals, so as to still be
receiving enough income overall.
For a new provider entering the market, with(say) a good supported living housing scheme, but no
other existing business across which to absorb relatively fixed costs (until they are able to expand
and spread the overheads around better), low standard hourly rates can be prohibitive. For one
such new scheme advised relatively recently, the proposition from the local authority was that they
were attracted by the service offered and would recommend a compatible mix of some higher needs
and some lower needs individual placements.
However, based on the overall budget and individual costings we prepared, the conclusion and
advice was that the low standard hourly fee rate available would preclude taking on any but
moderately high to high needs clients, if fixed costs were to be fully covered, and the enterprise was
to be financially viable. The practical downside was that to have too many higher needs individuals
together often just does not work, in compatibility and behaviour management terms. As a result,
the prediction has in part come to pass, in that the hourly rate agreed is simply too low to achieve
sufficient profitability with the mix of high and lower needs clients supported.
This demonstrates the complexity and risks associated with using standard, low, hourly fee rates
across the board, without wider consideration of the mix of support needs and the underlying cost
structures, as well as the flexibility to modify rates where necessary and still address the business
proposition cost-effectively. There are no easy answers to this, in an environment where budgets are
so heavily constrained, but there is a need to understand the issues, in formulating future fee
policies and in optimum use of budgets.
These points are made simply to illustrate that determining appropriate levels of fees to pay for the
true costs of care is likely to be more complicated than simply looking at individual costings. There is
a multiplicity of issues around sustainability, financial risks (such as in relation to voids), and the
overall business mix and financial context of providers need to be considered (as already discussed
in the previous section on ‘overall fee considerations’).
Overhead allocation and pricing
Returning to the basis of overhead allocation used by providers, it is useful in conclusion to
comment on this in relation to this survey and the wider pricing issues. Just over half of the
supported living providers in the survey have allocated at least some overheads based on relative
individual hours or relative income, rather than simply individual numbers. In effect this means that
costs are aligned with fees based on the extent to which fees are able to fully pay for a proportion of
the costs, given the problem of using fixed hourly fee rates highlighted above.
If this approach is used by providers in pricing their services for individuals with low hours support
needs, this is similar or equivalent to treating these overheads as fixed, and not needing to be added
in in full, in agreeing fees for new lower hours needs individuals. For high hours needs individuals,
even a relatively low add-on within the hourly rate for central overheads may be sufficient,
particularly if the bulk of these overheads are relatively fixed. So this can represent a practical and
19
pragmatic way of pricing for providers, provided that they also understand the variability of costs
and can manage profitability effectively overall.
For the local authority, it is important to recognise how provider costs vary and to obtain
information from the providers to aid their understanding. There is then the trade off to consider,
as between the simplicity of continuing to wish to use a single range of hourly fee rates, (recognising
that some provision will be underpaid for and some possibly overpaid for), versus the benefits of
being able to tailor these rates better to different real differences in cost levels, in support of making
the most cost-effective commissioning decisions, and possibly being able to support providers more
flexibly and better.
Inflation
Finally, it is also important to stress that this discussion about fixed and variable costs only really
deals with the variability of costs and ‘cost drivers’ i.e. the factors which influence the level of any
activity, and the resultant cost levels. All costs are, in addition, subject to variability year on year,
based on inflationary pressures, so no costs are really fixed in the medium term, from this
perspective.
Inflation affects different cost components in different ways, so both providers and the local
authorities really need to monitor inflation by cost component, bearing in mind the varying
proportion of total costs which each component represents, given different cost structures and
mixes of business between providers. Changes to cost levels need then to be reflected in
modifications to fee rates and levels year on year, to support on-going provider financial viability.
CONCLUSIONS
Establishing reliable data for the current costs of care for the provision of social care support
services for young adults in Surrey has not been a straightforward exercise and one which could ever
have expected to come up with a single set of simple figures.
However, we believe that the costing models developed and deployed have proved to be fit for
purpose, supported by a thorough review process, to ensure as far as possible that not only have
templates been filled in correctly, but that the cost data submitted is as reliable as practicable.
No guarantees can be made about the accuracy of provider figures, or that some figures might not
be overstated, as there must still be some margin of error, but the additional comparative review
process, including asking providers to justify and correct figures which looked out of line, coupled
with the confidentiality of data has, we think, enabled the provision of some very useful cost data
and insights in relation to cost levels and behaviour, as well as how current costs compare with
actual fees. In addition, where figures still looked too unusual, they have been set on one side.
This is not a precise science and a number of assumptions have had to be made in calculating costs,
but there is at least now a stronger basis and set of tools to show what it costs to provide support in
different situations, rather than simply rely on costing data which may not tie back to actual support
levels, staff rotas or the accounting records. Perhaps this can be the start of greater cost
20
transparency and trust on both sides, so that providers feel more willing to ‘open their books’ and
prove the validity of their costs and required fee estimates for the future.
The actual/ current cost figures produced indicate what the costs are, but not what they need to be
in some areas to be sustainable for the future, or on the other hand what they could be reduced to,
to be really efficient, economic and cost-effective. There is a surprisingly wide diversity in some
elements of the costs as between providers, which makes it more difficult to say what cost ‘norms’
might be developed for the future.
There should still be scope for improving cost-effectiveness and for providers to make further
efficiency savings, rather than simply taking the cost figures provided within this survey as a ‘given’.
The wide disparity in relative cost levels between individual costings and providers across the
sample, set out in the cost analysis which follows, can provide an important starting point, which is
considered, on an initial basis, in the cost analysis which follows.
It is also interesting to note that the resulting surpluses or deficits produced seem quite sensitive to
relatively small adjustments in the individual costs or allocation methods, particularly where these
relate to the key/ material areas of staff costs, central overheads and to a lesser extent the return on
property.
Nevertheless, the results indicate that there is a problem, with many providers in the sample not
receiving an adequate margin on the support they are providing, whilst for others the fees are in
excess of what is required. On balance, in our judgement, the evidence suggests that more fees are
likely to be insufficient than are excessive, and that this situation is likely to deteriorate further, with
inflation and other increasing cost pressures, unless the specific issues can be addressed, with
ramifications for provider on-going financial viability and supply of sufficient good quality services in
the market.
From the local authority’s perspective, there is a need to apply scarce financial budgets in the
optimum way possible, ideally, to provide additional funding where it is most justified, rather than a
‘blanket’ approach, adjusting individual fees in the wrong direction, in relation to surpluses and
deficits.
SUGGESTIONS FOR THE WAY FORWARD
Broader validation of results
A key question is :
1) Whether the evidence in relation to negative (and positive) mark-ups produced in the
examples is really typical of the homes/ services covered, in relation to other individuals
and of the organisations as a whole?
Providers in the survey have already been asked this question informally and the majority have
indicated that results submitted are generally typical (so some have negative mark-ups for many
individuals, but equally some also still have a range of positive mark-ups for individuals). This has

21
already been discussed at some length under ‘the impact of inadequate mark-ups and deficits’,
above.
However, it will be important to substantiate these assertions not only with providers already
covered within the sample, but also to obtain additional insights, from other providers not covered.
Sustainable costs and financial viability
Some comments on the lack of sustainability of salary rates have already been included under the
section above on salaries and staff costs.
The key issues and questions in relation to salary rates have already been raised but require further
consideration:
2) Will these be sufficient at current, or even only marginally increased levels to retain good
quality staff, and to recruit new staff, so as to maintain the provision of high quality
services?
3) In this regard, what might happen to employment locally in Surrey, in terms of the
increase or otherwise in job opportunities in the near future, in potentially increasing
competition for prospective care workers?
4) What is happening to inflation currently and what will be likely to happen in the next year
or so?
The salary sustainability risk will affect providers across the board, but those whose margins are
currently healthier (less restricted or less negative overall) are going to be better placed to respond
in terms of making any increases possible to retain and recruit staff. Arguably many or most (?)
providers will struggle to increase salary levels, in the absence of fee increases to fund these, given
that they have found it difficult to do so in the recent past, and the financial environment has
deteriorated recently, for providers and local authorities alike.
Current and future inflation will also affect other costs, although for most providers salary costs still
represent the bulk of the cost base (between 55 and 80% of overall costs).
There is also the question of the impact of voids, which could be having an even greater impact on
overall financial viability currently than reduced margins. The models already developed, as well as
other (Laing and Buisson) models developed which consider the financial viability of homes and
services overall, and the impact of voids, can be utilised to explore the financial impact of risks. The
specific overall suggestion is therefore:
A. Extend some aspects of the work to date, to validate initial findings at individual level, and to
consider the extent of financial deficits and related financial risks at overall home/service levels
and across businesses, bearing in mind sustainability, voids etc.
The models and data on key cost ratios could be used to estimate the combined effect of changes
required for inflation and to address sustainability issues, and to consider the budget implications,
across the whole learning disability population in Surrey.
22
Establishing ‘normal’ cost allowances and fee levels
Given the above:
5) Should and how can an approach now be developed to take the disparate results obtained
forward to establish new ‘norms’ for cost levels, which can then be used to calibrate how
overall costs need to increase with increasing levels of individual need, in terms of hours
of support?
Broad suggestions have already been made above about how to take forward the work to better
assess the different unit costs associated with providing support in houses of different sizes, as well
as using the cost models developed to calibrate the levels of costs for individuals with different
hours of support.
However, we would counsel against an approach which tries to over-standardise the costs of
support, in terms of ‘norms’, given the very wide range of different support and housing
arrangements possible in the learning disabilities marketplace. This could be counter-productive, in
moving the focus away from working closely with providers in choosing the most cost-effective
solutions offered to meet specific requirements, to ‘one-size fits all’ thinking. Ranges of costs or
hourly rates may be more appropriate, with guidelines as to the factors to be considered, in terms of
where individual fees should fit within the range.
Bearing this in mind, the suggestion is that more specific work might be undertaken as follows:
B. Identify different staff support unit costs per hour for different levels and types of need, as well
as types of support. This could combine consideration of sustainable local salary rates by grade
with study of the mix of staffing, including supervision needed and related costs, to better
calibrate both supported living hourly rate ranges and residential support fees for different levels
of need.
C. Better calibrate differences in unit costs for different housing settings (affecting staffing and
support, as well as housing costs, so at least in part relevant for supported living as well as
residential care); this would be used in conjunction with B to provide guidance re broad
adjustment factors which might be applied.
(It should be recognised that the housing cost part is quite complicated, as a basis for calculating
return on property. This work might therefore be done in conjunction with IESE, who are responsible
for the care funding calculator nationally, to re-visit, revalidate and refine where necessary the ratios
they currently use for adjusting general house prices for different sizes of housing).
This work could then logically be extended to improve the tools used to review provider costs and
agree appropriate fees, both for supported living and residential care.
D. Revise the basis for setting hourly fee rates in supported living, to incorporate results of B and C
re different levels of staff unit cost (on a costs per hour basis), but then use weekly allowances for
all other variable and fixed costs. This would overcome the problems of allocation for lower and
high needs illustrated by the survey and enable SCC to debate with providers/decide what levels of
central overhead allocated cost represent 'efficient/economic' cost levels, bearing in mind
23
economies of scale, and to what extent fixed costs should be included in prices agreed (as well as
whether exceptions should be made for start-up and smaller specialist, high quality operators).
E. Similarly, residential care fees could be established in future based on reviewing costs relating to
each component of overall costs, as these vary in practice i.e. average direct staff costs set per
hour, and all other variable and fixed costs, including return on property, based on costs per week.
This more consistent approach would also have the advantage that supported living and residential
care costings would be compatible and it would be easier to compare relative costs, as well as paving
the way for further deregistration of residential care, where this might be suitable to convert to
supported living.
A further logical extension to this revised approach would be to extend the scope of fee setting to
embrace a full cost and benefits review for each individual, including consideration of housing costs
and all benefits and allowances, whether individuals be in residential care or supported living. This
more holistic approach would have the advantages of enabling overall housing and support
propositions to be formulated which could be tested for financial viability and cost-effectiveness at
the outset, including ensuring that every individual had sufficient benefits and allowances to support
the arrangements proposed, and that individuals contributed an appropriate amount to the overall
costs of their support packages. The specific suggestion is therefore:
E. Consider the benefits (and costs) of moving to an holistic ‘total costs and benefits’ approach to
commissioning, building on suggestions in C and D above.
Budget considerations
These questions also prompt the further key question:
6) Given very limited financial resources for next year, how does Surrey CC, within its social
care budgets, best respond to these shortfalls and surpluses, as well as overall provider
financial risks, and risks to future supply?
For example, will the optimum approach be to try to provide equal extra support to providers,
across the board, or somehow to prioritise support, in relation to relative financial risks and/or
strategic market supply risks?
7) Depending on the answer to this, what should be the focus for further cost analysis, if
further work is needed, and with what relative priority?
Improving cost-effectiveness of support and housing
Given that none of the above is likely to anywhere near fully address the scale of the problem:
8) How can the local authority and providers work more effectively together to identify
genuine ways to improve cost-effectiveness of services?
The fact that provider unit costs vary so much across our sample ought to yield at least some new
opportunities to jointly explore additional cost savings potential.

24
Cost benchmarks for providers can be further developed to aid this task, so:
9) What else needs to be done now, to promote effective use of the benchmarking approach
and data already assembled and analysed?
Cost benchmarking can be fraught with difficulties of consistency of analysis and comparability.
Other sources of reliable comparative data should be considered, as well as how the results of the
current exercise might best be built on.
Re-assessing the support needs of individuals
Surrey CC has embarked on a major exercise to reassess the support needs of individuals. However,
this is time and experience intensive and there is a shortage of suitable expertise and resources.
10) How can the models developed and approach to costing applied be harnessed to expedite
this exercise and best integrate work on re-assessing hours of support required with more
cost-effective support options?
The models developed for the survey, coupled with adoption of the suggestions above, could form
the basis for the costing elements of re-assessing the support needs of individuals more effectively,
as well as supporting benchmarking and cost-effectiveness improvement initiatives and revised fee
setting.
The missing ingredient is the tool or tools to be used to re-assess individual needs and help
formulate improved, personalised approaches to supporting them more cost-effectively. Whilst the
needs matrix within the care funding calculator and resource allocation system points-based
assessment may still have some role to play, both of these are somewhat ‘continuing dependency’
oriented, rather than facilitating ways to increase independence and reduce support needs over
time, or to use and realistically cost a more flexible mix of support resources, in line with personal
choice, harnessing community support and other novel approaches to improve the cost-
effectiveness of support utilised.
We are familiar with new tools, specially designed for learning disabilities support, which might be
used to enhance this re-assessment and which might pave the way for a more dynamic approach to
improving personal outcomes and reducing support budgets over time, coupled with better
calculating the cost of mixed resourcing approaches, to feed in to fee and personal budget setting.
These might be supplemented by our own spreadsheet models. The suggestion therefore is to:
F. Review the overall approach being adopted to re-assessment of individual needs, to consider
whether enhancements might be made to the tools used and approach.
A prioritised plan of action
There is probably a need to consider the efficacy, inter-relationships, timescales and priorities of
these various potential initiatives to come up with a logical and prioritised plan of action. Future
costing work required should also be considered in the context of the limitations of analysis so far,
the funding constraints, relative financial and market risks and cost improvement potential. The
thinking can now be further developed.
25
SURREY LEARNING DISABILITIES COSTING SURVEY
COST ANALYSIS REPORT
DETAILED RESULTS
All submissions have been tabled in a range of cost analyses, which have been used to calculate and
compare key unit costs and ratios, as a basis for addressing each specific objective.
OVERALL COSTS AND THE ADEQUACY OF FEES
Objective 1: Analyse overall costs by individual, to consider both the adequacy of current fees and
to provide a basis for calculating sustainable overall cost and fee levels for the future
Given the number and mix of submissions received back from providers, and the effective operation
of the tailored costing models developed, it has been possible to fully analyse submissions received,
to calculate current costs and identify mark-ups being achieved in relation to actual fee levels.
This is at an individual level and highlights the extent of any over or under funding, assuming that
levels of need are already correctly assessed i.e. no consideration has been given to whether the
hours of support commissioned and other support arrangements are sufficient or greater than
necessary, as this was outside the scope of the survey. Useful insights have also been gained in
relation to sustainable costs, although more work is needed to consider sustainable fee levels for the
future.
For residential care, mark-up percentages on total current operational costs reflected by existing
fees range from -35.5% to +18.5%, with an average of -8.1%, across the sample of 20 analysed. The
median mark-up is -6.9%. Of 7 with positive mark-ups, only 2 have mark-ups in excess of 15%, while
the remaining 5 show mark-ups of less than 10%. Whereas, of the 13 with deficits, only 4 show
deficits of under 6%, while the remaining 9 all show deficits of over 13%. There are wide differences
between actual current mark-ups, in relation to individuals, arising for many different reasons,
including changes in support needs not reflected in increased or reduced fees, inflation not matched
by equal fee increases etc.
Whether the individual is in a ‘high salary cost’ placement or otherwise seems to have no clear,
discernible bearing on surpluses or deficits arising. 6 out of 20 examples relate to situations where
‘high salary costs’ continue to need to be paid under TUPE arrangements, for individuals transferred
from hospitals and other public sector provision. Fees have generally been increased to address
these higher cost commitments, but some are now showing surpluses while others are in deficit. In
one case the mark-up reflected by the actual fee has been adjusted down to incorporate the effect
of the provider having agreed to and actually paying a volume discount rebate on its fees.
It is difficult to draw firm conclusions about the overall margins across 900 individuals in Surrey
from this small sample. However, the fact that the average level of mark-up is negative when most
providers need a certain minimum mark-up to continue in business is a cause for concern.
In calculating these figures, where properties are rented then the actual rent figures have been
simply included, as expected. In contrast, where properties are owned, a return on property has
been calculated based on an approximate estimated current market value, and using a standard

26
return required of 7%, to obtain a current cost. This new approach has been mentioned in the Short
Report and replaces the basis used in the care funding calculator, by which an overall return on
capital is applied to the current adjusted property value.
10 of the 20 residential care homes in the sample are owned and so a 7% return on property has
been applied to estimated approximate current market values for these properties. Had this update
from original to current value not been applied, then the average overall mark-up for the residential
sample as a whole, based on original cost, would have still been negative, at -6.6%, with a median
deficit of -5.0%. However, it must be emphasised that an approach based on original cost is not
considered appropriate, as it does not reflect the true costs of continuing to provide the housing (as
further discussed in a section below).
In one case, the Surrey fee covers only a proportion of the costs, with the balance being a
contribution from the individual to the costs of rent, transport and other costs, amounting to £122
per week, out of allowances and benefits, or 12% of the fee. This is quite a large contribution, fully
covering the rent and travel, as well as some other support overheads. Whether the individual can
really afford to pay so much has not been considered in this survey, but apparently this practice
occurs quite widely and is particularly widespread in local authorities within London. (In this case
costs have been reduced in proportion to match just what Surrey fees pay for, in looking at the
mark-up or deficit, though ideally, for benchmarking, the costs might have been still shown in full
with the individual contribution added to Surrey fees).
This example in fact also seems to relate to an individual living very close to the boundary with a
London borough, or possibly just outside Surrey, who is apparently paid fees only at lower Surrey
rates, when staff costs are at higher London levels, providing another reason for a shortfall occurring
for the provider. Individuals located outside Surrey boundaries have generally been excluded from
the sample, but this problem might be a broader issue, if other higher cost placements near or in
London need to be funded. Of course, alternatively, there may be other placements outside Surrey
where costs are cheaper.
There does not seem to be any greater likelihood of negative mark-ups being experienced by ‘for
profits’ or ‘not-for-profit’ providers. However, the gap between actual and required mark-ups is
obviously greater for ‘for profit’ organisations. ‘Not for profits’ are suffering a smaller shortfall
relative to their requirements, but equally significant implications of operating with actual deficits.
In terms of mark-ups required by providers (per their submissions, across both residential care and
supported living examples), these vary between 7 and 13% for ‘for profit’ providers and 0 to 5% for
‘not for profit’ providers, within the sample, taking account of different financing and ownership
arrangements, particularly for ‘for profit’ providers, as well as charity restrictions on a making a
surplus, for ‘not for profits’. Comparing actual current or ‘true’ costs of care with the mark-ups
required by providers indicates a shortfall averaging 9 % across the residential care sample,
reflecting the fact that some of the largest deficits are offset by zero or low mark-up requirements,
in some cases, reducing the average gap.
However, whilst some charities are currently restricted to operating to achieve no overall surplus,
this is not considered to be sensible, given the need for future investment, the financial risks to be
covered and the need for some contingency, in looking at sustainability.
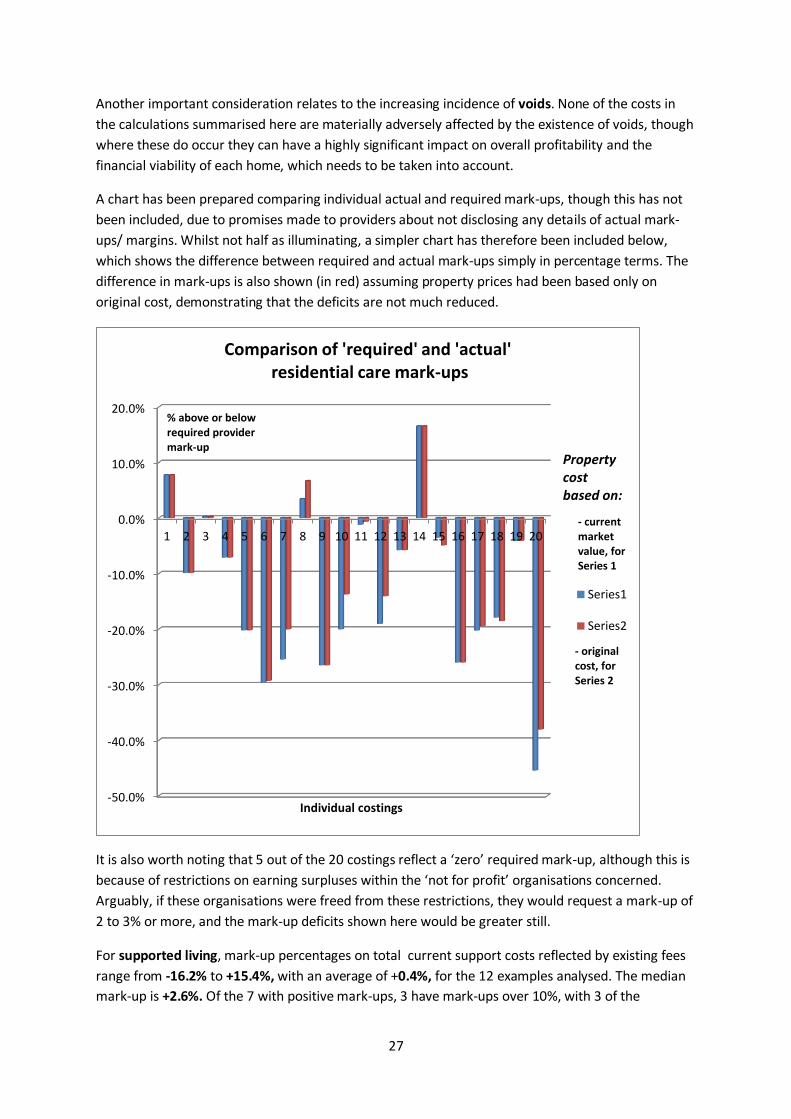
27
Another important consideration relates to the increasing incidence of voids. None of the costs in
the calculations summarised here are materially adversely affected by the existence of voids, though
where these do occur they can have a highly significant impact on overall profitability and the
financial viability of each home, which needs to be taken into account.
A chart has been prepared comparing individual actual and required mark-ups, though this has not
been included, due to promises made to providers about not disclosing any details of actual mark-
ups/ margins. Whilst not half as illuminating, a simpler chart has therefore been included below,
which shows the difference between required and actual mark-ups simply in percentage terms. The
difference in mark-ups is also shown (in red) assuming property prices had been based only on
original cost, demonstrating that the deficits are not much reduced.
It is also worth noting that 5 out of the 20 costings reflect a ‘zero’ required mark-up, although this is
because of restrictions on earning surpluses within the ‘not for profit’ organisations concerned.
Arguably, if these organisations were freed from these restrictions, they would request a mark-up of
2 to 3% or more, and the mark-up deficits shown here would be greater still.
For supported living, mark-up percentages on total current support costs reflected by existing fees
range from -16.2% to +15.4%, with an average of +0.4%, for the 12 examples analysed. The median
mark-up is +2.6%. Of the 7 with positive mark-ups, 3 have mark-ups over 10%, with 3 of the
-50.0%
-40.0%
-30.0%
-20.0%
-10.0%
0.0%
10.0%
20.0%
1 2 3 4 5 6 7 8 9 10 11 12 13 14 15 16 17 18 19 20
Individual costings
Comparison of 'required' and 'actual'residential care mark-ups
Series1
Series2
- current market value, for Series 1
- original cost, for Series 2
Property cost based on:
% above or below required providermark-up
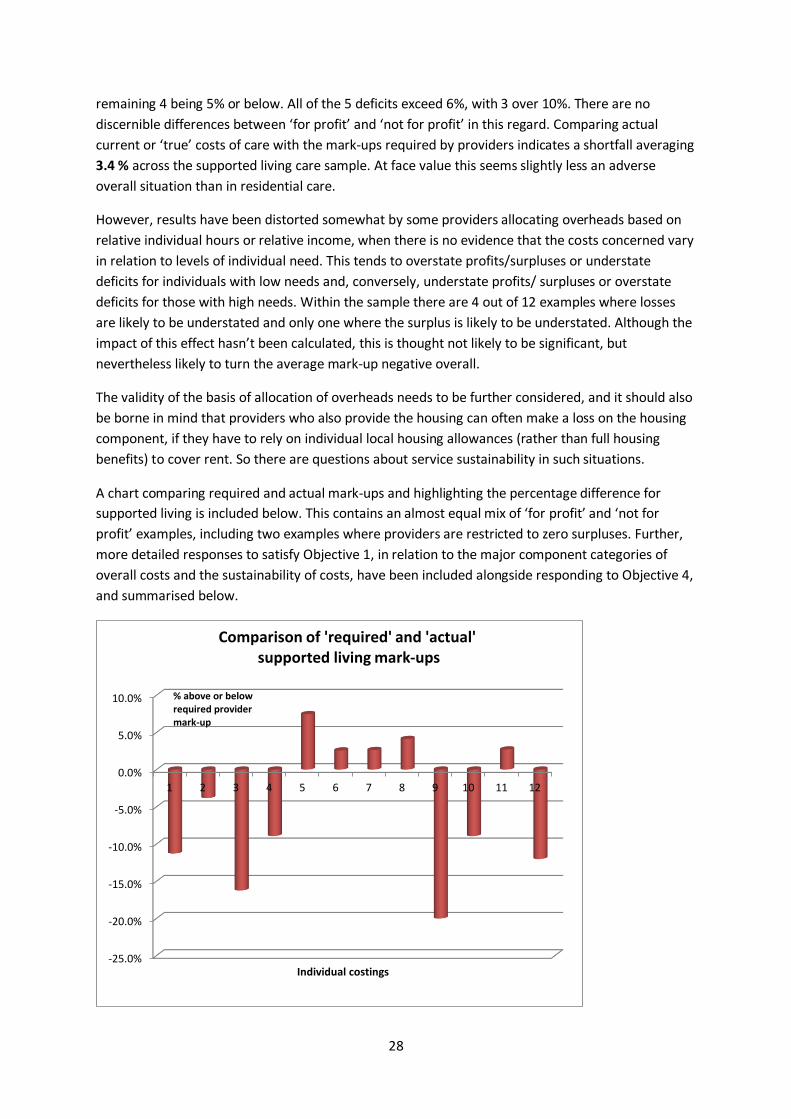
28
remaining 4 being 5% or below. All of the 5 deficits exceed 6%, with 3 over 10%. There are no
discernible differences between ‘for profit’ and ‘not for profit’ in this regard. Comparing actual
current or ‘true’ costs of care with the mark-ups required by providers indicates a shortfall averaging
3.4 % across the supported living care sample. At face value this seems slightly less an adverse
overall situation than in residential care.
However, results have been distorted somewhat by some providers allocating overheads based on
relative individual hours or relative income, when there is no evidence that the costs concerned vary
in relation to levels of individual need. This tends to overstate profits/surpluses or understate
deficits for individuals with low needs and, conversely, understate profits/ surpluses or overstate
deficits for those with high needs. Within the sample there are 4 out of 12 examples where losses
are likely to be understated and only one where the surplus is likely to be understated. Although the
impact of this effect hasn’t been calculated, this is thought not likely to be significant, but
nevertheless likely to turn the average mark-up negative overall.
The validity of the basis of allocation of overheads needs to be further considered, and it should also
be borne in mind that providers who also provide the housing can often make a loss on the housing
component, if they have to rely on individual local housing allowances (rather than full housing
benefits) to cover rent. So there are questions about service sustainability in such situations.
A chart comparing required and actual mark-ups and highlighting the percentage difference for
supported living is included below. This contains an almost equal mix of ‘for profit’ and ‘not for
profit’ examples, including two examples where providers are restricted to zero surpluses. Further,
more detailed responses to satisfy Objective 1, in relation to the major component categories of
overall costs and the sustainability of costs, have been included alongside responding to Objective 4,
and summarised below.
-25.0%
-20.0%
-15.0%
-10.0%
-5.0%
0.0%
5.0%
10.0%
1 2 3 4 5 6 7 8 9 10 11 12
Individual costings
Comparison of 'required' and 'actual'supported living mark-ups
% above or below required providermark-up
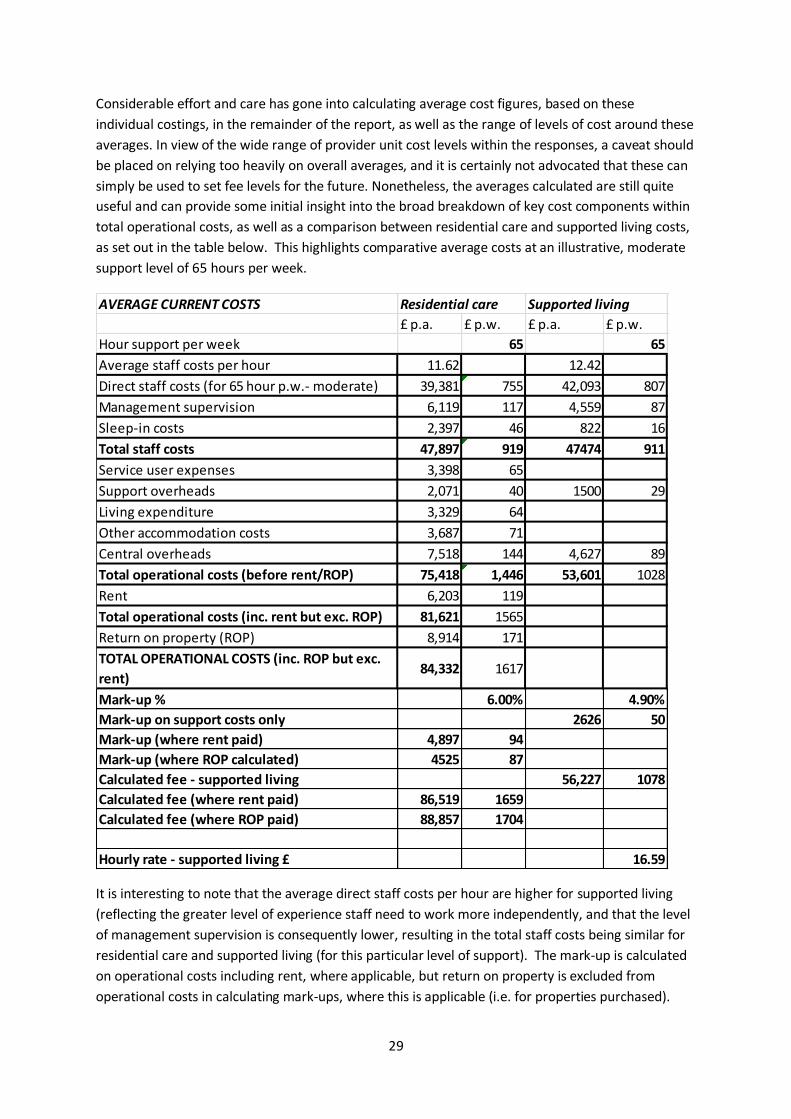
29
Considerable effort and care has gone into calculating average cost figures, based on these
individual costings, in the remainder of the report, as well as the range of levels of cost around these
averages. In view of the wide range of provider unit cost levels within the responses, a caveat should
be placed on relying too heavily on overall averages, and it is certainly not advocated that these can
simply be used to set fee levels for the future. Nonetheless, the averages calculated are still quite
useful and can provide some initial insight into the broad breakdown of key cost components within
total operational costs, as well as a comparison between residential care and supported living costs,
as set out in the table below. This highlights comparative average costs at an illustrative, moderate
support level of 65 hours per week.
It is interesting to note that the average direct staff costs per hour are higher for supported living
(reflecting the greater level of experience staff need to work more independently, and that the level
of management supervision is consequently lower, resulting in the total staff costs being similar for
residential care and supported living (for this particular level of support). The mark-up is calculated
on operational costs including rent, where applicable, but return on property is excluded from
operational costs in calculating mark-ups, where this is applicable (i.e. for properties purchased).
AVERAGE CURRENT COSTS Residential care Supported living
£ p.a. £ p.w. £ p.a. £ p.w.
Hour support per week 65 65
Average staff costs per hour 11.62 12.42
Direct staff costs (for 65 hour p.w.- moderate) 39,381 755 42,093 807
Management supervision 6,119 117 4,559 87
Sleep-in costs 2,397 46 822 16
Total staff costs 47,897 919 47474 911
Service user expenses 3,398 65
Support overheads 2,071 40 1500 29
Living expenditure 3,329 64
Other accommodation costs 3,687 71
Central overheads 7,518 144 4,627 89
Total operational costs (before rent/ROP) 75,418 1,446 53,601 1028
Rent 6,203 119
Total operational costs (inc. rent but exc. ROP) 81,621 1565
Return on property (ROP) 8,914 171
TOTAL OPERATIONAL COSTS (inc. ROP but exc.
rent)84,332 1617
Mark-up % 6.00% 4.90%
Mark-up on support costs only 2626 50
Mark-up (where rent paid) 4,897 94
Mark-up (where ROP calculated) 4525 87
Calculated fee - supported living 56,227 1078
Calculated fee (where rent paid) 86,519 1659
Calculated fee (where ROP paid) 88,857 1704
Hourly rate - supported living £ 16.59
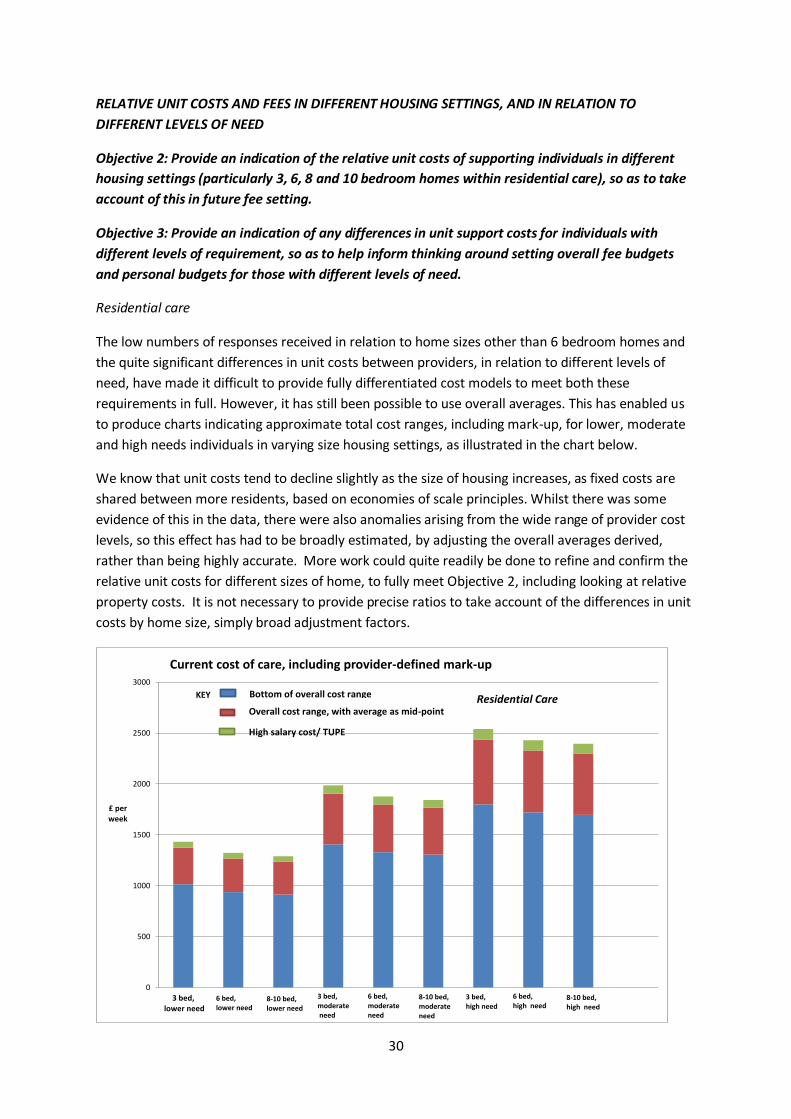
30
RELATIVE UNIT COSTS AND FEES IN DIFFERENT HOUSING SETTINGS, AND IN RELATION TO
DIFFERENT LEVELS OF NEED
Objective 2: Provide an indication of the relative unit costs of supporting individuals in different
housing settings (particularly 3, 6, 8 and 10 bedroom homes within residential care), so as to take
account of this in future fee setting.
Objective 3: Provide an indication of any differences in unit support costs for individuals with
different levels of requirement, so as to help inform thinking around setting overall fee budgets
and personal budgets for those with different levels of need.
Residential care
The low numbers of responses received in relation to home sizes other than 6 bedroom homes and
the quite significant differences in unit costs between providers, in relation to different levels of
need, have made it difficult to provide fully differentiated cost models to meet both these
requirements in full. However, it has still been possible to use overall averages. This has enabled us
to produce charts indicating approximate total cost ranges, including mark-up, for lower, moderate
and high needs individuals in varying size housing settings, as illustrated in the chart below.
We know that unit costs tend to decline slightly as the size of housing increases, as fixed costs are
shared between more residents, based on economies of scale principles. Whilst there was some
evidence of this in the data, there were also anomalies arising from the wide range of provider cost
levels, so this effect has had to be broadly estimated, by adjusting the overall averages derived,
rather than being highly accurate. More work could quite readily be done to refine and confirm the
relative unit costs for different sizes of home, to fully meet Objective 2, including looking at relative
property costs. It is not necessary to provide precise ratios to take account of the differences in unit
costs by home size, simply broad adjustment factors.
0
500
1000
1500
2000
2500
3000
£ per week
3 bed,lower need
Current cost of care, including provider-defined mark-up
6 bed,lower need
8-10 bed, lower need
3 bed, moderateneed
6 bed, moderate need
8-10 bed, moderate need
3 bed,high need
6 bed, high need
8-10 bed, high need
Bottom of overall cost range
Overall cost range, with average as mid-point
High salary cost/ TUPE
KEY Residential Care
31
Nor has it been possible, for the same reasons, to identify differences in staff unit costs per hour, as
between individuals with lower needs and those with higher average needs. We would expect that
staff working with those with higher needs would need to be more experienced and higher paid
individuals, but this cannot be identified from the data, due to differences in levels of cost between
providers, when looking at examples for individuals with different hours of support requirements.
In practice this is likely to have more of an effect in supported living, where there is more dedicated
staffing, as opposed to shared staffing in group living. There will be some difference in residential
care, but it should not be so material, in the context of the range of overall average unit costs
produced. An adjustment has, though, been made for supported living (see below). The best way to
fully meet objective 3, would be to calibrate this effect first within a single cost structure (by looking
at costs in support of different levels of need for a single provider, where pay structures are
consistent), and then to validate and refine the differentials for staff unit costs, by repeating the
exercise within one or two other providers, for different levels of need.
It would also be expected that levels of management supervision, behaviour management support
and individual expenses would increase for individuals with higher support needs, increasing average
unit costs accordingly; but again this cannot be discerned from the data received, given, in addition,
that many submissions were for similar levels of moderate to high needs placements in residential
care. Refinement of unit costs for different levels of need for these factors could also be achieved as
part of the same exercise to understand differences in staff unit costs.
An average mark-up of 6% on total operational costs has been included in these figures, which is
based on an equal number of ‘for profit’ and ‘not for profit’ examples in the sample (whereas the
average mark-up required by ‘for profit’ providers is around 11%, and by ‘not for profits’ around
2.5%).
Data for the 8 and 10 bed homes has also been combined, due to the small number of submissions
received for the latter (only 1 9 bed and 1 10 bed home).
The costs calculated have excluded high salary placements in TUPE or statutory settings (quite a high
proportion, representing 6 out of the 20 examples submitted), as likely to distort the results, in
calculating the average salary cost figures, but included these examples in calculating other costs
and overhead average costs, as more compatible. For ‘on rota’ salary costs average costs per hour
have been used, whereas for management supervision and sleep-in, as well as all other costs,
average costs per week have been used, making approximate adjustments for the slight expected
reduction in unit costs as the size of home increases.
The bulk of examples are for relatively high needs individuals (86 hours a week on average), so using
standard average hourly salary costs may mean that the costs of lower needs individuals are slightly
understated in these figures. Refinements can be made if this is thought material, if the analysis is to
be taken forward and further used in future costing work.
A range of total cost figures has been estimated (in red) as plus or minus 15% of the average costs
calculated (which therefore represent the mid-point in this range). A further allowance has then
been added for the estimated extra cost of high salary cost (TUPE) placements (in green), over and
above the top end of the range of costs for all other placements . Although salary costs are typically

32
much higher than in other services, other expenditure can sometimes be lower than average,
reducing the average extra overall differential to approximately 5%. Costs for Surrey’s own services
as well as other statutory/ public sector services, which are on average even higher than
independent (TUPE) services, have not been included in the detailed analysis at all, as these figures
were not received in time for incorporation.
So overall, these total costs can be considered a good starting point, in identifying the current costs
of care, and showing how the overall total unit costs are likely to vary with different levels of need
and in different housing settings. A full spectrum of indicative cost levels per week for different
levels of need can readily be produced if needed, using average costs calculated and the cost models
developed and refined specifically for this purpose. However, the figures produced here should still
be viewed as indicative, rather than definitive, for individuals with these levels of need, so need
some refinement.
An analysis of average residential care costs for different levels of support has nevertheless been
included below, simply to show the broad breakdown of costs on which the chart above is based,
and to illustrate the effect of spreading weekly variable and fixed costs across individuals in a six
bedroom home, without any estimated differentiation in salary rates and levels of management
supervision. (In any event, quite a number of providers indicate that there is either no or very little
difference in these variables in residential care, particularly where staffing is simply on a shared
rather than dedicated basis, and takes little account of different levels of need).
Average costs per hour of support have been calculated and included for each cost component,
partly to facilitate comparisons with supported living hourly rates. These demonstrate the strong
impact which increasing hours of support normally has on reducing the unit hourly costs, given that
many weekly costs, including management supervision, are fixed or semi-fixed in relation to
RESIDENTIAL CARE
AVERAGE COSTS AND REQUIRED HOURLY RATES 6 bed home
(for different levels of need) low av. total medium av. total high av. total
cost per hour cost per hour cost per hour
Number of hours 30 65 100
Average direct staff cost per hour (on rota only) 12.15 12.15 12.15
Direct staff costs (on rota) per week 365 790 1215
Management supervision per week 120 4.00 120 1.85 120 1.20
Sleep-in costs per week 35 1.17 35 0.54 35 0.35
Staff cost per week 520 17.32 945 14.53 1370 13.70
Service user expenses per week 55 1.83 65 1.00 75 0.75
Support overheads 40 1.33 40 0.62 40 0.40
Living expenses 70 2.33 70 1.08 70 0.70
Other accommodation 70 2.33 70 1.08 70 0.70
Rent (combined with ROP)
Central overheads 144 4.80 144 2.22 144 1.44
sub-total - Operational costs 899 29.95 1334 20.52 1769 17.69
Return on property 150 5.00 150 2.31 150 1.50
Mark-up average (actual sample) 6% 54 1.80 80 1.23 106 1.06
Total 1102 36.75 1564 24.06 2025 20.25
Lower end of range 85% 937 31.23 1329 20.45 1721 17.21
Higher end of range 115% 1268 42.26 1798 27.67 2329 23.29
Difference between lower & higher end of range 30% 331 11.02 469 7.22 608 6.08
TUPE level staff costs 120% 1323 44.10 1877 28.87 2430 24.30
Difference between higher end of range & TUPE 5% 55 1.84 78 1.20 101 1.01
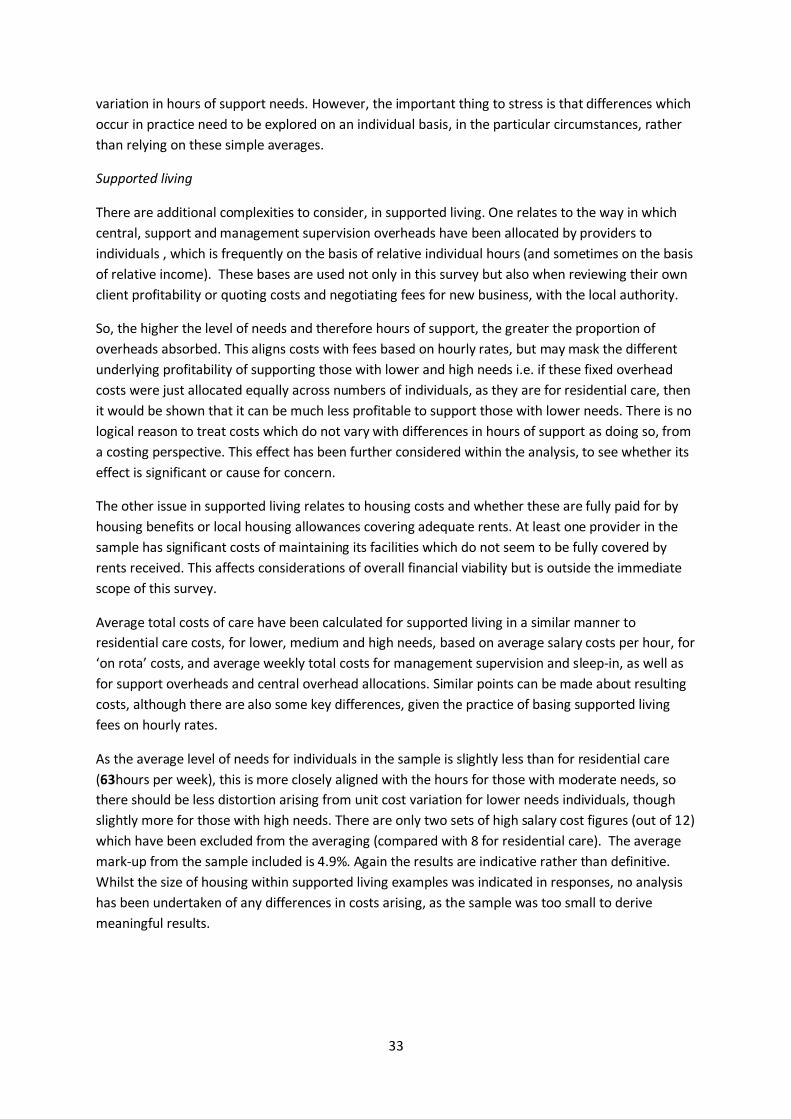
33
variation in hours of support needs. However, the important thing to stress is that differences which
occur in practice need to be explored on an individual basis, in the particular circumstances, rather
than relying on these simple averages.
Supported living
There are additional complexities to consider, in supported living. One relates to the way in which
central, support and management supervision overheads have been allocated by providers to
individuals , which is frequently on the basis of relative individual hours (and sometimes on the basis
of relative income). These bases are used not only in this survey but also when reviewing their own
client profitability or quoting costs and negotiating fees for new business, with the local authority.
So, the higher the level of needs and therefore hours of support, the greater the proportion of
overheads absorbed. This aligns costs with fees based on hourly rates, but may mask the different
underlying profitability of supporting those with lower and high needs i.e. if these fixed overhead
costs were just allocated equally across numbers of individuals, as they are for residential care, then
it would be shown that it can be much less profitable to support those with lower needs. There is no
logical reason to treat costs which do not vary with differences in hours of support as doing so, from
a costing perspective. This effect has been further considered within the analysis, to see whether its
effect is significant or cause for concern.
The other issue in supported living relates to housing costs and whether these are fully paid for by
housing benefits or local housing allowances covering adequate rents. At least one provider in the
sample has significant costs of maintaining its facilities which do not seem to be fully covered by
rents received. This affects considerations of overall financial viability but is outside the immediate
scope of this survey.
Average total costs of care have been calculated for supported living in a similar manner to
residential care costs, for lower, medium and high needs, based on average salary costs per hour, for
‘on rota’ costs, and average weekly total costs for management supervision and sleep-in, as well as
for support overheads and central overhead allocations. Similar points can be made about resulting
costs, although there are also some key differences, given the practice of basing supported living
fees on hourly rates.
As the average level of needs for individuals in the sample is slightly less than for residential care
(63hours per week), this is more closely aligned with the hours for those with moderate needs, so
there should be less distortion arising from unit cost variation for lower needs individuals, though
slightly more for those with high needs. There are only two sets of high salary cost figures (out of 12)
which have been excluded from the averaging (compared with 8 for residential care). The average
mark-up from the sample included is 4.9%. Again the results are indicative rather than definitive.
Whilst the size of housing within supported living examples was indicated in responses, no analysis
has been undertaken of any differences in costs arising, as the sample was too small to derive
meaningful results.
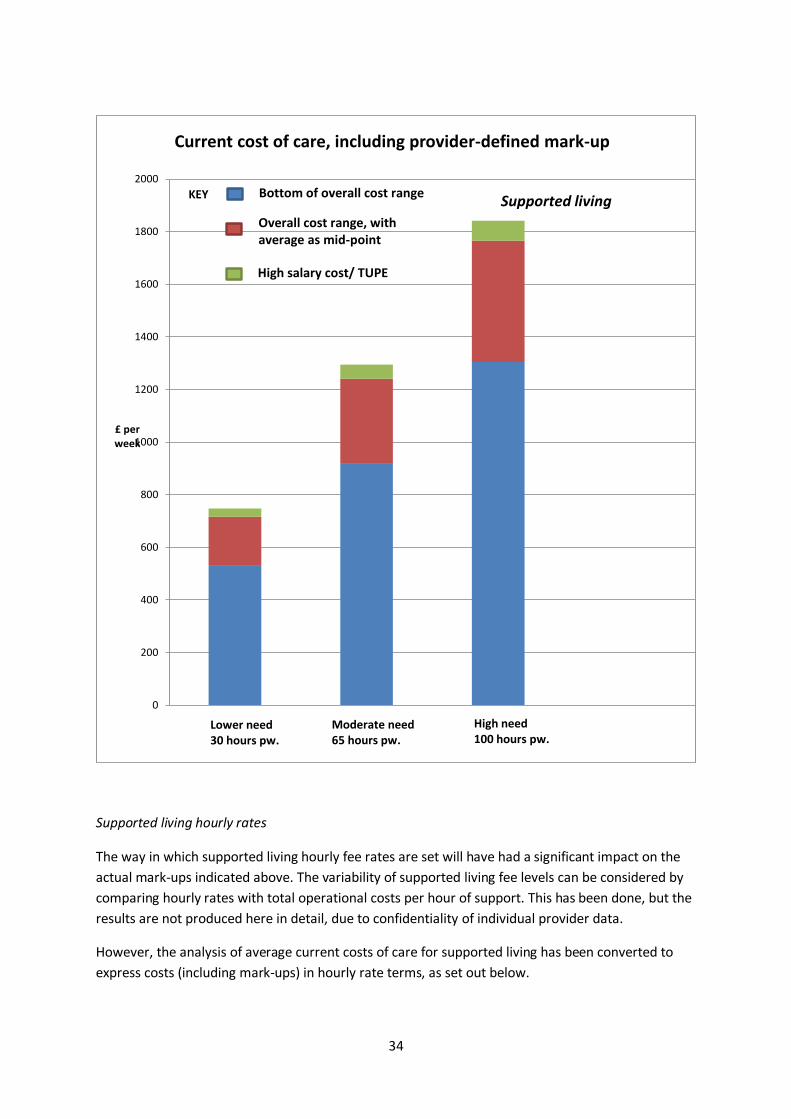
34
Supported living hourly rates
The way in which supported living hourly fee rates are set will have had a significant impact on the
actual mark-ups indicated above. The variability of supported living fee levels can be considered by
comparing hourly rates with total operational costs per hour of support. This has been done, but the
results are not produced here in detail, due to confidentiality of individual provider data.
However, the analysis of average current costs of care for supported living has been converted to
express costs (including mark-ups) in hourly rate terms, as set out below.
0
200
400
600
800
1000
1200
1400
1600
1800
2000
£ per week
Current cost of care, including provider-defined mark-up
Lower need30 hours pw.
Moderate need65 hours pw.
High need100 hours pw.
Bottom of overall cost range
Overall cost range, with average as mid-point
High salary cost/ TUPE
KEY Supported living
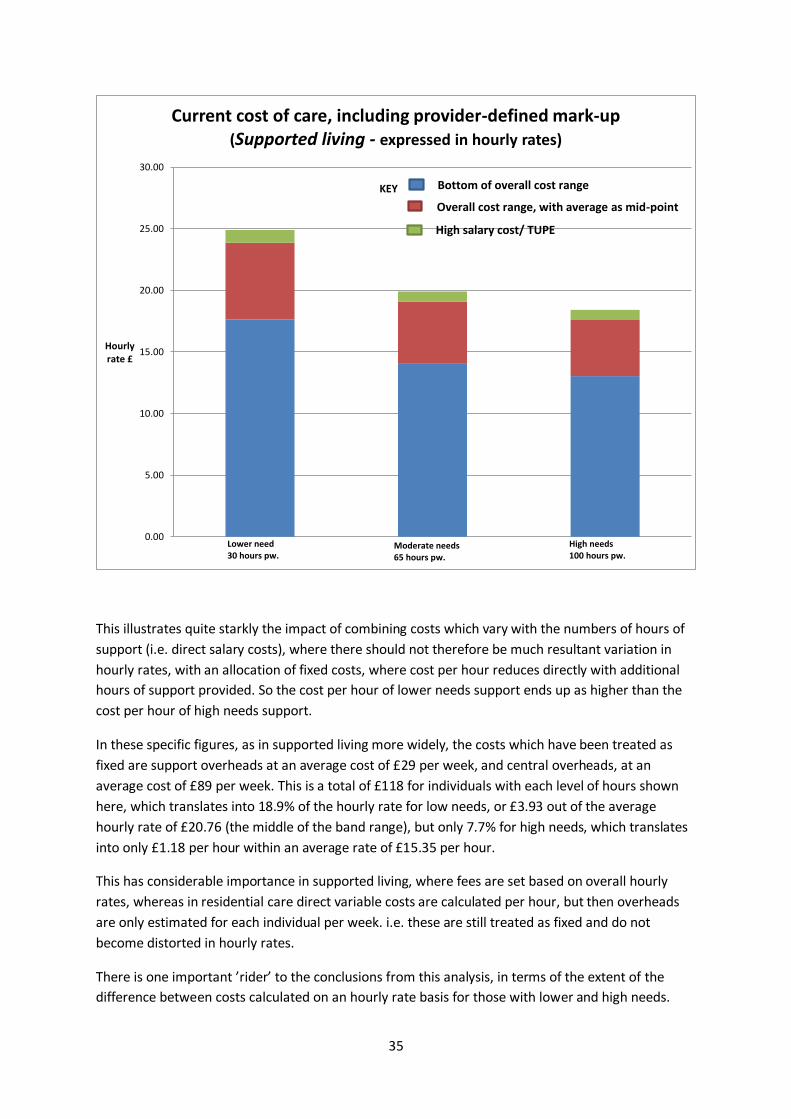
35
This illustrates quite starkly the impact of combining costs which vary with the numbers of hours of
support (i.e. direct salary costs), where there should not therefore be much resultant variation in
hourly rates, with an allocation of fixed costs, where cost per hour reduces directly with additional
hours of support provided. So the cost per hour of lower needs support ends up as higher than the
cost per hour of high needs support.
In these specific figures, as in supported living more widely, the costs which have been treated as
fixed are support overheads at an average cost of £29 per week, and central overheads, at an
average cost of £89 per week. This is a total of £118 for individuals with each level of hours shown
here, which translates into 18.9% of the hourly rate for low needs, or £3.93 out of the average
hourly rate of £20.76 (the middle of the band range), but only 7.7% for high needs, which translates
into only £1.18 per hour within an average rate of £15.35 per hour.
This has considerable importance in supported living, where fees are set based on overall hourly
rates, whereas in residential care direct variable costs are calculated per hour, but then overheads
are only estimated for each individual per week. i.e. these are still treated as fixed and do not
become distorted in hourly rates.
There is one important ’rider’ to the conclusions from this analysis, in terms of the extent of the
difference between costs calculated on an hourly rate basis for those with lower and high needs.
0.00
5.00
10.00
15.00
20.00
25.00
30.00
Hourly rate £
Current cost of care, including provider-defined mark-up(Supported living - expressed in hourly rates)
Lower need30 hours pw.
Moderate needs65 hours pw.
High needs100 hours pw.
Bottom of overall cost range
Overall cost range, with average as mid-point
High salary cost/ TUPE
KEY
36
This relates to the likely difference in pay rates, and therefore the difference in average staff costs
per hour of support, as between supporting individuals with lower and high needs. Providers will
tend to need to pay a higher rate of pay for more experienced staff to support those with high needs
than they do for those supporting individuals with lower needs.
However, as discussed in the detailed section on salary rates and staff costs which follows, it has not
proved possible to discern these differences in pay rates from the survey submissions, as most of the
individual responses relate to moderate or high needs individuals, and there are marked differences
in the staff cost levels reported by different providers.
Nevertheless, this means that the average overall hourly rate for lower needs support probably
needs to be somewhat lower than calculated here, but the hourly rate for higher needs support
would be higher. Without doing more research it is not possible to be precise about the impact of
this effect. However, a reasonable assumption might be that it would make a difference of (say)
£0.75 an hour, in both directions, so that average staff costs for lower needs support would be £0.75
lower than for moderate needs support, whilst average staff costs for high needs support would be
£0.75 more than for moderate support, giving rise to a £1.50 overall differential overall, for lower to
high needs. The charts have been re-plotted using these modified figures and the results are shown
below.
0
500
1000
1500
2000
2500
£ per week
Current cost of care, including provider-defined mark-up
Lower need30 hours pw.
Moderate need65 hours pw.
High need100 hours pw.
Bottom of overall cost range
Overall cost range, with average as mid-point
High salary cost/ TUPE
KEY Supported living
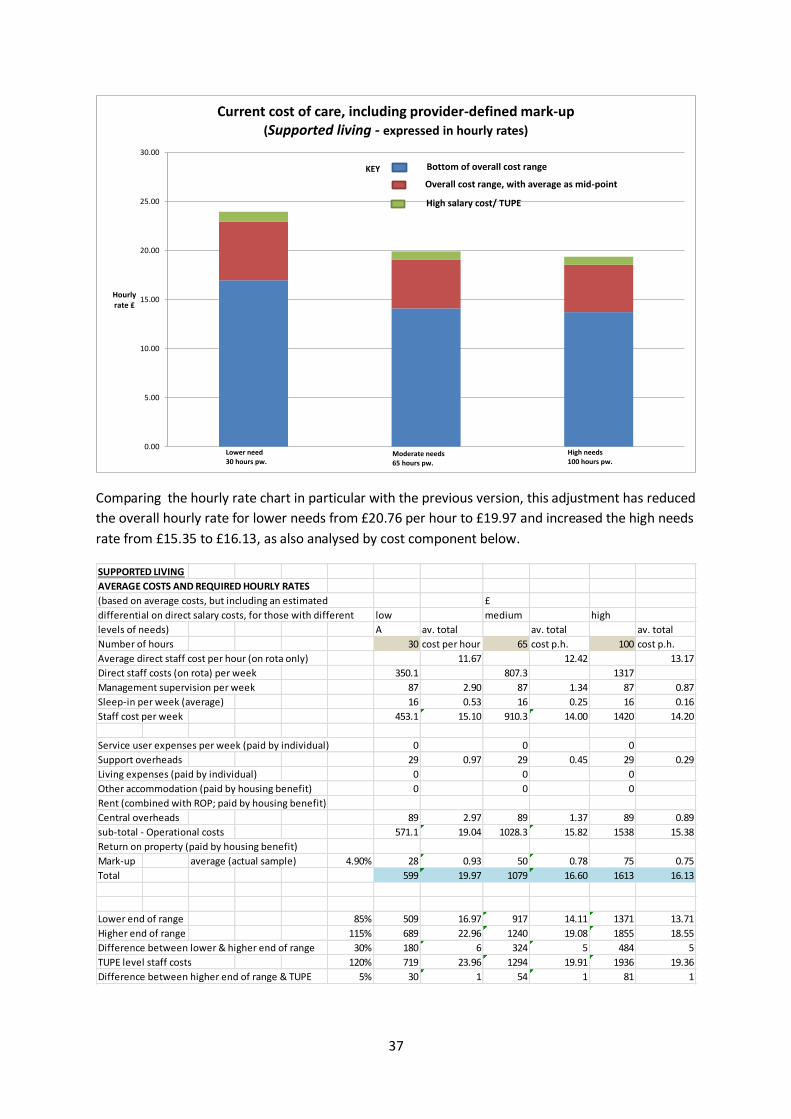
37
Comparing the hourly rate chart in particular with the previous version, this adjustment has reduced
the overall hourly rate for lower needs from £20.76 per hour to £19.97 and increased the high needs
rate from £15.35 to £16.13, as also analysed by cost component below.
0.00
5.00
10.00
15.00
20.00
25.00
30.00
Hourly rate £
Current cost of care, including provider-defined mark-up(Supported living - expressed in hourly rates)
Lower need30 hours pw.
Moderate needs65 hours pw.
High needs100 hours pw.
Bottom of overall cost range
Overall cost range, with average as mid-point
High salary cost/ TUPE
KEY
SUPPORTED LIVING
AVERAGE COSTS AND REQUIRED HOURLY RATES
(based on average costs, but including an estimated £
differential on direct salary costs, for those with different low medium high
levels of needs) A av. total av. total av. total
Number of hours 30 cost per hour 65 cost p.h. 100 cost p.h.
Average direct staff cost per hour (on rota only) 11.67 12.42 13.17
Direct staff costs (on rota) per week 350.1 807.3 1317
Management supervision per week 87 2.90 87 1.34 87 0.87
Sleep-in per week (average) 16 0.53 16 0.25 16 0.16
Staff cost per week 453.1 15.10 910.3 14.00 1420 14.20
Service user expenses per week (paid by individual) 0 0 0
Support overheads 29 0.97 29 0.45 29 0.29
Living expenses (paid by individual) 0 0 0
Other accommodation (paid by housing benefit) 0 0 0
Rent (combined with ROP; paid by housing benefit)
Central overheads 89 2.97 89 1.37 89 0.89
sub-total - Operational costs 571.1 19.04 1028.3 15.82 1538 15.38
Return on property (paid by housing benefit)
Mark-up average (actual sample) 4.90% 28 0.93 50 0.78 75 0.75
Total 599 19.97 1079 16.60 1613 16.13
Lower end of range 85% 509 16.97 917 14.11 1371 13.71
Higher end of range 115% 689 22.96 1240 19.08 1855 18.55
Difference between lower & higher end of range 30% 180 6 324 5 484 5
TUPE level staff costs 120% 719 23.96 1294 19.91 1936 19.36
Difference between higher end of range & TUPE 5% 30 1 54 1 81 1
38
Overall, then, even as adjusted, it is still the case that the hourly rate cost for those with lower needs
is considerably higher than that for high needs, although this pay rate effect has more or less
balanced out the difference in rates between moderate and high needs support. However, also bear
in mind that this is simply given the numbers of hours selected as representing moderate and high
needs respectively, and would not be expected to apply so closely to other numbers of hours
selected for moderate or high needs. The average hourly rate fees (inclusive of the average provider
mark-up of £4.90 per hour across ‘for profit’ and ‘not for profit’ providers in the sample), vary
between £16.13 for high needs, £16.60 for moderate need and £19.97 for low needs.
In undertaking analysis of the components of hourly rates, it is important to consider the overall
average staffing costs per hour, rather than just the ‘on-rota’ cost, to consider the combined effect
of variable hourly salary rates and different levels of supervision, including any trade-offs. The table
illustrates that the overall staff cost alone makes up between £14.00 and £15.10 per hour, for
different levels of need, based on average staff hourly rates, adjusted for different levels of need.
There is, though, a further potential distortion in looking at these figures, in that many providers
have actually allocated overheads based on relative individual hours or relative income, whereas we
have produced these charts and tables allocating costs equally across individuals. There are two
aspects to this to consider:
1) The effect that the allocation bases may have had on the average level of overheads across
providers, which might have had an effect on the total costs of care calculated here
2) The impact of changing the basis of allocation in these summary charts to one based on
relative individual hours support needs.
1) Within this supported living sample, of 10 individuals being analysed, it is interesting to note that
only the ‘not for profit’ have allocated central overheads by relative individual hours, whereas all the
‘for profit’ providers have shared these costs equally across individuals. For support overheads the
picture is a little more mixed.
For each example where the individual hours basis was used for central overheads, we have
recalculated the allocation based on individual numbers and found that this has made a difference of
only £5 a week on average to an overall average overhead allocation per week of £89. In this case
the individual basis overstated central overhead charges, but this could just as easily become an
understatement, given a different mix of individuals with different levels of need in the sample.
If a similar overstatement applied to support overheads in this sample, as would be likely, then these
would be recalculated at £23, as opposed to £29 per week, resulting in a combined overstatement of
hourly costs amounting to £11. If this is applied within the costing for low needs support, then this
would reduce the calculated average hourly rate from £19.97 to £19.58, a reduction of only £0.39.
This would have an even lower effect on hourly rates as the hours of support increased. This is not
considered to be very significant, for this sample and the indicative costs calculated, given the wide
range of average provider costs incorporated in the charts.
2) If the allocation basis was changed from individual numbers to relative individual hours, or
relative income, in these charts, this would simply broadly eliminate the effect of the fixed costs on
average hourly rates, so that hourly rates would be similar for lower, moderate and high needs,
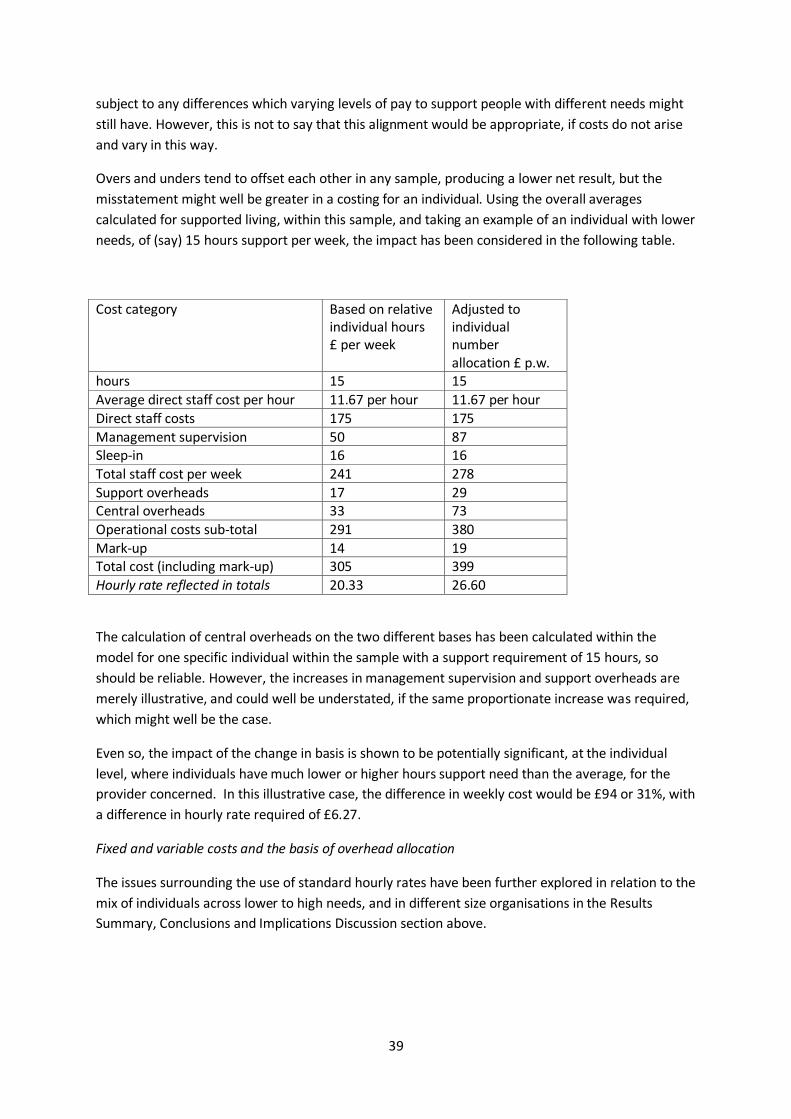
39
subject to any differences which varying levels of pay to support people with different needs might
still have. However, this is not to say that this alignment would be appropriate, if costs do not arise
and vary in this way.
Overs and unders tend to offset each other in any sample, producing a lower net result, but the
misstatement might well be greater in a costing for an individual. Using the overall averages
calculated for supported living, within this sample, and taking an example of an individual with lower
needs, of (say) 15 hours support per week, the impact has been considered in the following table.
Cost category Based on relative individual hours £ per week
Adjusted to individual number allocation £ p.w.
hours 15 15
Average direct staff cost per hour 11.67 per hour 11.67 per hour
Direct staff costs 175 175
Management supervision 50 87 Sleep-in 16 16
Total staff cost per week 241 278
Support overheads 17 29 Central overheads 33 73
Operational costs sub-total 291 380
Mark-up 14 19 Total cost (including mark-up) 305 399
Hourly rate reflected in totals 20.33 26.60
The calculation of central overheads on the two different bases has been calculated within the
model for one specific individual within the sample with a support requirement of 15 hours, so
should be reliable. However, the increases in management supervision and support overheads are
merely illustrative, and could well be understated, if the same proportionate increase was required,
which might well be the case.
Even so, the impact of the change in basis is shown to be potentially significant, at the individual
level, where individuals have much lower or higher hours support need than the average, for the
provider concerned. In this illustrative case, the difference in weekly cost would be £94 or 31%, with
a difference in hourly rate required of £6.27.
Fixed and variable costs and the basis of overhead allocation
The issues surrounding the use of standard hourly rates have been further explored in relation to the
mix of individuals across lower to high needs, and in different size organisations in the Results
Summary, Conclusions and Implications Discussion section above.
40
COST ANALYSIS WITHIN COST CATEGORIES
Objective 1: Analyse overall costs by individual, to consider both the adequacy of current fees and
to provide a basis for calculating sustainable overall cost and fee levels for the future
Objective 4: Provide an analysis of costs across providers within different cost categories, to
provide benchmark comparisons for providers, in furthering their (and Surrey CC’s) cost reduction
objectives
Sections have been set out below which consider each major component of costs in turn,
commenting on the level and variability of these costs, as well as considerations relating to
sustainability- in addressing Objective 1.
Some useful analysis has also been produced in support of Objective 4, with average costs being
adjusted by line item within each cost category, so that averages are not distorted by different
numbers of times that costs are reported in each line item.
Each component of costs has been analysed, comparing costs between providers, computing
averages and exploring key cost ratios, for which results are summarised below.
There are several uses to which this analysis might be put:
1) To see where individual / provider costs are out of line with averages, and particularly where
cost levels look too expensive or inefficient, as a basis for exploring opportunities for cost
reduction
2) To explore the variability of costs, including allocation bases affecting unit costs, to consider,
in particular, the implications of setting fee levels based on standard hourly rates, which
combine some variable and some allocated fixed costs
3) To consider whether some normal or standard cost levels can be established, in due course,
as a basis for agreeing ‘fair’ economic/ efficient cost levels to be included in fees, which are
also sufficient to ensure sustainability of services.
As a basic principle, where costs are variable, broadly in line with levels/hours of support provided,
as is the case for direct staff costs, then comparisons of unit costs between providers, using
averages, should work well in identifying overly expensive support. In these cases use of average
unit costs per hour are useful and not misleading, to identify differences more clearly.
However, where costs are largely fixed, at least in the short-term, then the basis of allocation, as
well as the scale of the operation (and economies of scale) both impact unit costs, so make
comparability more problematic. Overhead allocation by relative individual hours or income makes
unit cost comparisons easier, but may mask true costs, if specific costs do not vary at all in line with
increasing individual hours.
Key ratios, such as the percentage of total operational costs represented by a particular category of
costs (e.g. support overheads, other accommodations costs), can be useful, both in identifying
unusually high or low levels of particular costs, as well as the materiality of different costs in
contributing to total costs (e.g. staff costs frequently account for around 60 to 70% of total costs, so
41
any proportion saved will tend to have a much bigger impact on overall costs and profitability than a
similar proportion saved in any other cost category).
However, key ratios can be misleading if used alone, because it could be that the total is unusually
high or low because of other costs than those being specifically considered, distorting simple
comparisons with ratios for other providers. Ratios are only therefore indicative of anomalies and
need to be used in conjunction with comparisons of average costs. Obviously, ratios are also only
applicable for a particular level of hours of support, and will change significantly as between the
costing for an individual with lower or high needs, based on the significant difference in staff costs.
Nonetheless, they could also be useful in determining how much overall budgets need to be
increased by, to take account of different inflationary and other increases in different cost categories
(staff costs, living expenditure, housing etc.).
Equally, averages can be misleading, if these are unduly influenced by high values which are outside
the core range of data. So these ‘outliers’ should be left out of the calculations, and/or median data
also used. Simply indicating the range of costs can also be misleading, as this focuses attention on
the ‘outlier’ extreme values, when most of the data might actually be concentrated closely round
the average. Calculation and use of standard deviations would then help in appreciating to what
extent it might be practicable to establish ‘norms’ for the data in these cost categories. A low
standard deviation would indicate low variability and greater opportunity to establish ‘norms’.
This level of analysis is beyond the scope of this initial survey. A major caveat therefore needs to be
made in viewing all the cost analysis data which follows. Whilst considering overall cost levels, a
reasonable level of reliance can probably be given to the figures, the analysis of sample data is likely
to be much less reliable for benchmarking at a detailed ‘line item’ level, due to the small sample, lack
of consistency in classification and wide variation in provider cost levels.
There has also had to be some approximation in calculating averages and other ratios, without this
becoming a very time consuming exercise. In particular, averages have been calculated within
groups of services, for residential homes of different sizes (3, 6, 8 and 10 bedroom), and then simply
averaged across these resulting averages, which might give rise to some disproportionate emphasis
on individual costs where numbers in each sub-sample are small (compared to averaging across the
whole residential sample). This should not have a significant impact, but reinforces the point that all
benchmarking comparative cost data should therefore be considered only as indicative, rather than
definitive.
Nevertheless, this provides a start which might be built on over time, through much more
submission, analysis and open, joint comparative review of provider cost data for the future, sharing
insights (between providers as well as with the local authority), on where and how costs can
genuinely be saved, rather than cuts in what is paid for simply imposed while underlying levels of
cost remain unaltered.
There is quite a lot of further analysis which might usefully be undertaken with the cost data already
submitted, so the analysis below provides indicative findings which can be further extended and
developed.

42
Overall key ratios
A broad analysis of key ratios by major cost category, for the illustrative support level of 65 hours
support per week, as used in the charts and tables used above, reveals the following:
Note: The cost ratios, in terms of the % of total operational costs represented by each major cost
element will obviously vary as hours of support and related staff costs vary.
In looking at residential care ratios, it is recognised that either rent is paid or, where the property is
owned, a return on property is used. Whilst ROP is included in total operational costs here, as an
alternative to rent, for comparability in looking at key cost ratios, the mark-up on operational costs is
calculated only on operational costs excluding return on property.
For residential care, staff costs obviously make up the bulk of total operational costs, and for
supported living almost all of the costs. So attention clearly needs to be focused principally on staff
costs, to consider scope for more cost-effective provision.
Individual expenses are a very small, and highly variable, but extremely important category of costs,
from the individual’s perspective, which can make the difference between living a fulfilling life, with
good outcomes, out in the community, and being restricted and unhappy at home. So this is not the
area to look for restrictive and excessive cost cutting.
Living expenditure is probably the most routine and readily comparable area of spending, with
variation in spending around norms being most easily benchmarked. Support overheads and other
accommodation are not so significant overall, more variable and subject to more diverse
classification of costs, while rent is only applicable in in a few residential care settings within this
sample, so it is difficult to draw meaningful conclusions.
Return on property is a complex but significant area, with a variety of possible approaches which
might be followed and considerable variation in housing utilised, levels of cost, and market values, as
well as difficulties in making comparisons between costs in different locations. However, it is difficult
to change the costs once incurred.
ILLUSTRATION OF KEY RATIOS AND Residential care Supported living
AVERAGE CURRENT COSTS £ p.a. £ p.w. % of total % of total £ p.a. £ p.w. % of total
Hour support per week 65 inc. rent inc. ROP 65
Average staff costs per hour 11.62 12.42
Direct staff costs (for 65 hour p.w.- moderate) 39,381 755 48.2% 46.7% 42,093 807 78.5%
Management supervision 6,119 117 7.5% 7.3% 4,559 87 8.5%
Sleep-in costs 2,397 46 2.9% 2.8% 822 16 1.5%
Total staff costs 47,897 919 58.7% 56.8% 47474 911 88.6%
Service user expenses 3,398 65 4.2% 4.0%
Support overheads 2,071 40 2.5% 2.5% 1500 29 2.8%
Living expenditure 3,329 64 4.1% 3.9%
Other accommodation costs 3,687 71 4.5% 4.4%
Central overheads 7,518 144 9.2% 8.9% 4,627 89 8.6%
Total operational costs (before rent/ROP) 75,418 1,446 92.4% 89.4% 53,601 1028 100.0%
Rent 6,203 119 7.6%
Total operational costs (inc. rent but exc. ROP) 81,621 1565 100%
Return on property (ROP) 8,914 171 10.6%
TOTAL OPERATIONAL COSTS (inc. ROP but exc.
rent)84,332 1617 100%
43
Central overheads also represent a significant area of spend, with a surprising amount of variation in
cost levels, given the wide diversity in size and complexity of provider organisations, differing scope
for economies of scale, but also considerable differences in the way in which central costs are
charged out and allocated to take into account. This must also therefore be a key area for
assessment of potential savings.
Differences in the mix, levels and classification of costs
Some providers tend to be relatively expensive in some cost areas and cheaper in others, in some
cases because costs have been classified differently from other providers. For example, some
providers tend to have managers working substantially on shift, increasing average rota staff costs,
but reducing management supervision costs. Some include activity costs under local expenditure,
within individual expenses, whilst for others these form part of central overheads; equally, some
costs form part of local administration, while for others all these costs are centralised. So often it is
necessary to look at the overall costs for a provider, not just to compare costs levels within single
categories.
Differences in costs can also arise because of the different mix of support provided across all
individuals. Some providers concentrate on supporting those with high needs and challenging
behaviour, requiring higher overall central costs relating to behavioural support, but also, for
example, (marginally) higher property maintenance costs. Sharing allocated central costs equally
across individuals also produces quite different results from sharing costs on the basis of relative
individual hours, or relative income. In addition, unit costs vary depending on the size of the
organisation, with central overheads being subject to economies of scale.
It is therefore slightly easier to establish overall fee levels rather than to build this up in terms of
what is allowed in each discrete category of costs. If averages or even medians are used, then these
run the risk of increasing costs and fees for those whose support costs less than average at the
moment, whilst jeopardising some provider costs which, although high, are justified and cannot be
further reduced, as they may represent the most economic which can be achieved in a specific
existing situation or location.
SALARIES AND STAFF COSTS
Salary levels
In analysing current salary rates and costs, costs for services where staff have been transferred in to
independent services from NHS or local authority services, and where their previous salary terms
and conditions, as well as pension arrangements, are protected by TUPE contractual conditions,
have been separated out. Typically costs for these services are much higher than norms in the
independent sector, and so these have not been included in averages calculated. Similarly, costs for
continuing local authority and related public services have been excluded from averages calculated.
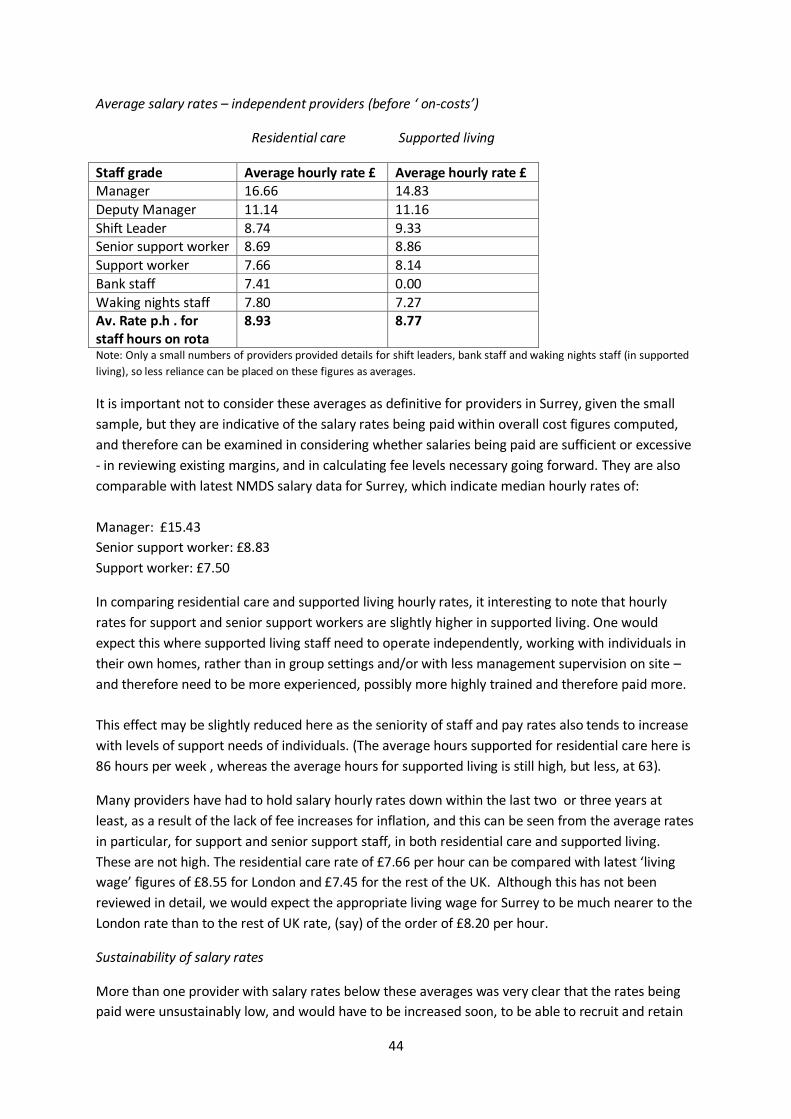
44
Average salary rates – independent providers (before ‘ on-costs’)
Residential care Supported living
Staff grade Average hourly rate £ Average hourly rate £ Manager 16.66 14.83
Deputy Manager 11.14 11.16
Shift Leader 8.74 9.33 Senior support worker 8.69 8.86
Support worker 7.66 8.14
Bank staff 7.41 0.00
Waking nights staff 7.80 7.27 Av. Rate p.h . for staff hours on rota
8.93 8.77
Note: Only a small numbers of providers provided details for shift leaders, bank staff and waking nights staff (in supported
living), so less reliance can be placed on these figures as averages.
It is important not to consider these averages as definitive for providers in Surrey, given the small
sample, but they are indicative of the salary rates being paid within overall cost figures computed,
and therefore can be examined in considering whether salaries being paid are sufficient or excessive
- in reviewing existing margins, and in calculating fee levels necessary going forward. They are also
comparable with latest NMDS salary data for Surrey, which indicate median hourly rates of:
Manager: £15.43
Senior support worker: £8.83
Support worker: £7.50
In comparing residential care and supported living hourly rates, it interesting to note that hourly
rates for support and senior support workers are slightly higher in supported living. One would
expect this where supported living staff need to operate independently, working with individuals in
their own homes, rather than in group settings and/or with less management supervision on site –
and therefore need to be more experienced, possibly more highly trained and therefore paid more.
This effect may be slightly reduced here as the seniority of staff and pay rates also tends to increase
with levels of support needs of individuals. (The average hours supported for residential care here is
86 hours per week , whereas the average hours for supported living is still high, but less, at 63).
Many providers have had to hold salary hourly rates down within the last two or three years at
least, as a result of the lack of fee increases for inflation, and this can be seen from the average rates
in particular, for support and senior support staff, in both residential care and supported living.
These are not high. The residential care rate of £7.66 per hour can be compared with latest ‘living
wage’ figures of £8.55 for London and £7.45 for the rest of the UK. Although this has not been
reviewed in detail, we would expect the appropriate living wage for Surrey to be much nearer to the
London rate than to the rest of UK rate, (say) of the order of £8.20 per hour.
Sustainability of salary rates
More than one provider with salary rates below these averages was very clear that the rates being
paid were unsustainably low, and would have to be increased soon, to be able to recruit and retain
45
sufficient numbers of quality staff, to deliver a good service and outcomes. Several others with rates
around average levels also indicated that current rates were unsustainably low, and that they
anticipated needing to increase support staff salaries shortly, by between 2% and 8%, although the
8% was an outlier, with most of the few who addressed this suggesting 2 to 3%.
Interestingly, several suggested that slightly higher increases than this were needed to retain
individual good managers and deputy managers, who are so critical to successful quality and cost
management of the support services provided.
However, overall the number of providers offering feedback and evidence on what sustainable cost
levels should be was somewhat disappointing. We were hoping for tangible evidence of the impact
that having to hold salaries down has been having on staff retention levels, but this was not
forthcoming. Perhaps better evidence can be gleaned from NMDS statistics on staff turnover. This
lack of responses is thought to be as much a function of simply not having devoted enough time to
consider the questions about sustainability and related cost figures, as it was about any lack of this
being an issue.
For many providers, the immediate danger of losing good staff has been temporarily reduced during
the recession, with relatively high levels of unemployment, but this risk is likely to increase as and
when employment picks up again. Latest employment statistics week indicate that unemployment is
now falling faster than previously. Pressure to be able to increase salaries will therefore increase as
consumer spending increases again and as staff are tempted away by traditional and new
competitors for employment, such as the supermarkets.
Surrey is a still an affluent and high employment county, relatively, which has a scarcity of people
willing to work in care, given both the greater opportunities for higher paid work in other jobs, and
the high costs of housing, to live and work in Surrey, for lower paid workers. It also has a larger than
average number of self-funding older people requiring social care. Pressures on employers to pay
minimum ‘living wage’ salaries will also add to the difficulties in holding salaries down, while fees are
not increasing to pay for these increases but still remain financially viable. So this also puts upward
pressure on salary rates, if providers funded by the local authority are to be able to continue to
recruit good quality staff and retain them in the near future.
High salary cost placements
Whilst the brunt of the effect of static or reduced fees seems to have fallen on reduced margins,
rather than actual salary reductions, to date, at least one major provider is known to be now in the
process of having to re-align and harmonise its salary levels locally, including the high salary costs of
TUPE staff, to help eliminate overall operational financial deficits, , given that it has now proved
possible to put forward a strong economic case to do so.
Some providers who are paying high TUPE constrained salaries also indicated that sustainable salary
levels are below those currently paid, as would be expected. Whilst contractual commitments
cannot easily be abandoned, one other major provider has managed to reduce its average salary
cost levels significantly since taking on these obligations through, it is thought (though not
validated), encouraging some highly paid staff to move on and natural wastage.
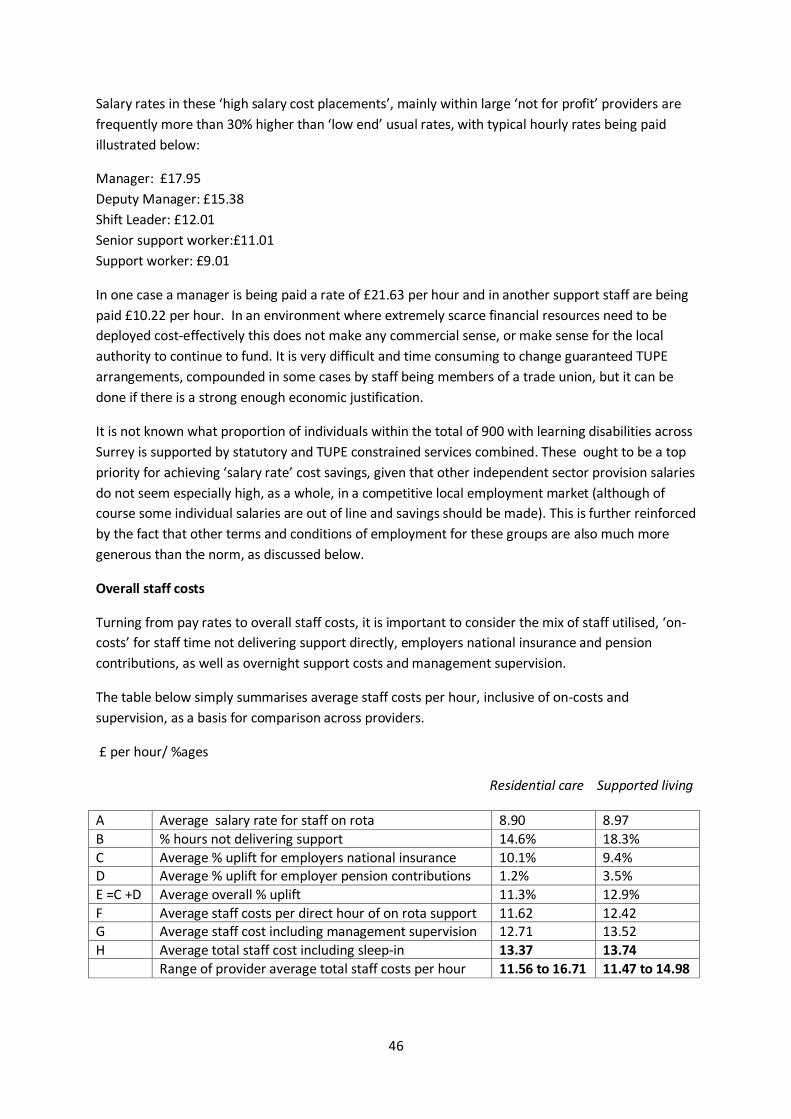
46
Salary rates in these ‘high salary cost placements’, mainly within large ‘not for profit’ providers are
frequently more than 30% higher than ‘low end’ usual rates, with typical hourly rates being paid
illustrated below:
Manager: £17.95
Deputy Manager: £15.38
Shift Leader: £12.01
Senior support worker:£11.01
Support worker: £9.01
In one case a manager is being paid a rate of £21.63 per hour and in another support staff are being
paid £10.22 per hour. In an environment where extremely scarce financial resources need to be
deployed cost-effectively this does not make any commercial sense, or make sense for the local
authority to continue to fund. It is very difficult and time consuming to change guaranteed TUPE
arrangements, compounded in some cases by staff being members of a trade union, but it can be
done if there is a strong enough economic justification.
It is not known what proportion of individuals within the total of 900 with learning disabilities across
Surrey is supported by statutory and TUPE constrained services combined. These ought to be a top
priority for achieving ‘salary rate’ cost savings, given that other independent sector provision salaries
do not seem especially high, as a whole, in a competitive local employment market (although of
course some individual salaries are out of line and savings should be made). This is further reinforced
by the fact that other terms and conditions of employment for these groups are also much more
generous than the norm, as discussed below.
Overall staff costs
Turning from pay rates to overall staff costs, it is important to consider the mix of staff utilised, ‘on-
costs’ for staff time not delivering support directly, employers national insurance and pension
contributions, as well as overnight support costs and management supervision.
The table below simply summarises average staff costs per hour, inclusive of on-costs and
supervision, as a basis for comparison across providers.
£ per hour/ %ages
Residential care Supported living
A Average salary rate for staff on rota 8.90 8.97
B % hours not delivering support 14.6% 18.3%
C Average % uplift for employers national insurance 10.1% 9.4% D Average % uplift for employer pension contributions 1.2% 3.5%
E =C +D Average overall % uplift 11.3% 12.9%
F Average staff costs per direct hour of on rota support 11.62 12.42 G Average staff cost including management supervision 12.71 13.52
H Average total staff cost including sleep-in 13.37 13.74
Range of provider average total staff costs per hour 11.56 to 16.71 11.47 to 14.98
47
Note that these average costs per hour do not include TUPE schemes or statutory sector staff, where
these averages are increased considerably, due to staff tending to have much higher holiday
entitlements and high employer pension contributions, as well as higher salary rates. Costs for TUPE
schemes do, however vary, not only between providers, but also between homes/ schemes,
depending on where imported staff have come from.
Note, also, that averages G and H cannot be broadly used, in this form, as they are only valid for this
mix of levels of support, combining as they do a relatively fixed level of supervision per week with
direct staff costs based on a range of levels of support. It has nevertheless been thought useful for
these to be calculated, as in some cases there are trade-offs between direct and indirect staff
support, so it is useful to look at both sets of costs together, for any particular level of support.
Some individual providers have higher ‘on rota’ staff costs and lower ‘off rota’ management costs
and vice versa. Whilst some of these differences tend to balance out, to some degree, in looking at
total staff costs, there is still quite a wide range of average total staff costs between providers. Some
of these differences are undoubtedly as a result of the different mix of seniority and pay of staff,
including greater management supervision required, in supporting those individuals with higher
needs.
However, these differences are masked in simply comparing costs between individuals with different
needs, supported by different providers, due to the different cost structures of providers and other
differences, such as location, and possibly housing size and related staffing models. What would be
needed to explore the effect of varying levels of need on average hourly costs would be an exercise
to consider this for single providers, separately, within the same overall cost structures. Percentage
variations required to unit costs, to meet different levels of need, could then be estimated, if the
exercise was repeated for several providers, and results then averaged.
On-costs
B. % hours not delivering support
This comprises direct individual support time which needs to be replaced, when staff are involved in
training, on holiday, or on paid sick leave. There is considerable variation in these costs which on
average add a significant overall 14.6% (in residential care examples) and 18.3% (in supported living
examples) to the hours which need to be paid for. These costs tend to be higher in supported living,
in particular, because of the downtime sometimes between support sessions and need to pay for
travelling time. Whilst investment in staff training is very important, so that there is limited scope for
reducing the cost of days out on training, there is often scope for improving training effectiveness,
and sometimes to use spare time for self-study, perhaps when individuals are out and not needing
support, which could not otherwise be saved, and this can lead to some reduction in training days
spent and costs.
Holiday entitlements form part of staff terms and conditions, so cannot readily be changed, and
there could be a loss of some staff if entitlements are significantly cut, but there is significant
divergence within the sample, with entitlements ranging from the standard 210 hours (28 days) per
year, to up to 270 hours in many cases, and in one case 314 hours per annum. These possibly
‘excessive’ entitlements seem difficult to justify but all seem to fall within TUPE schemes so may be
48
difficult to restructure, given guarantees on contractual conditions, without a lot of effort. However,
this does not mean that one shouldn’t try.
Sickness levels also vary, between 1% minimum, a norm of around 1.5 to 2% and up to extremes in
three or four cases of 5%. These should, to some extent be within the control of good management,
but it is interesting to note that these very high rates are occurring particularly at a large ‘not for
profit’ provider in deficit and a large commercial provider paying the lowest salary rates. It seems at
least a reasonable assumption to think that staff dissatisfaction where there is a lot of cost reduction
turmoil on the one hand, and where salaries may be below sustainable staff retention levels, on the
other, are contributing to these adverse ratios.
There should therefore be some actions which management can take where these ratios are
particularly high, to reduce costs, with good payback in terms of overall cost savings, albeit with
constraints to be overcome.
C. Average % uplift for employers’ national insurance
This percentage simply varies largely depending on the mix of staff, with reductions in the overall
average rate payable increasing as the proportion of part-time staff increases. As such, there is very
little that employers can do to influence this, other than change the mix of staff. However, there are
disadvantages for staff management and productivity in terms of increasing the proportion of part-
time staff too far, just to reduce this ‘on-cost’.
D. Average % uplift for employer pension contributions
This has typically historically been very low or zero, for many independent providers, but can be high
where services have been taken over from the NHS or other public sector statutory provision, under
TUPE arrangements (NHS employer contributions can be as high as 14% of salary). Certain ‘not for
profit’ providers, in particular, have contributed around 5%. However, as there is now a statutory
requirement for employers to contribute up to 3% being brought in, over the next couple of years,
providers are now moving progressively towards this level, at extra overall staff cost.
Broad overall allowances are often made in agreeing fees, for ‘on-costs’. As can be seen, there are a
lot of variables within ‘on-costs’ which can affect the total uplift required in particular
circumstances. Nonetheless, if higher ratios associated with specific high salary cost placements are
excluded, the overall uplifts required from this sample indicate average overall % uplifts required
currently of:
Residential care Supported living
Hours not delivering support 14.6% 18.3%
Employers NI & pension contributions 11.3% 12.9%
Total uplift required 25.9% 31.2%
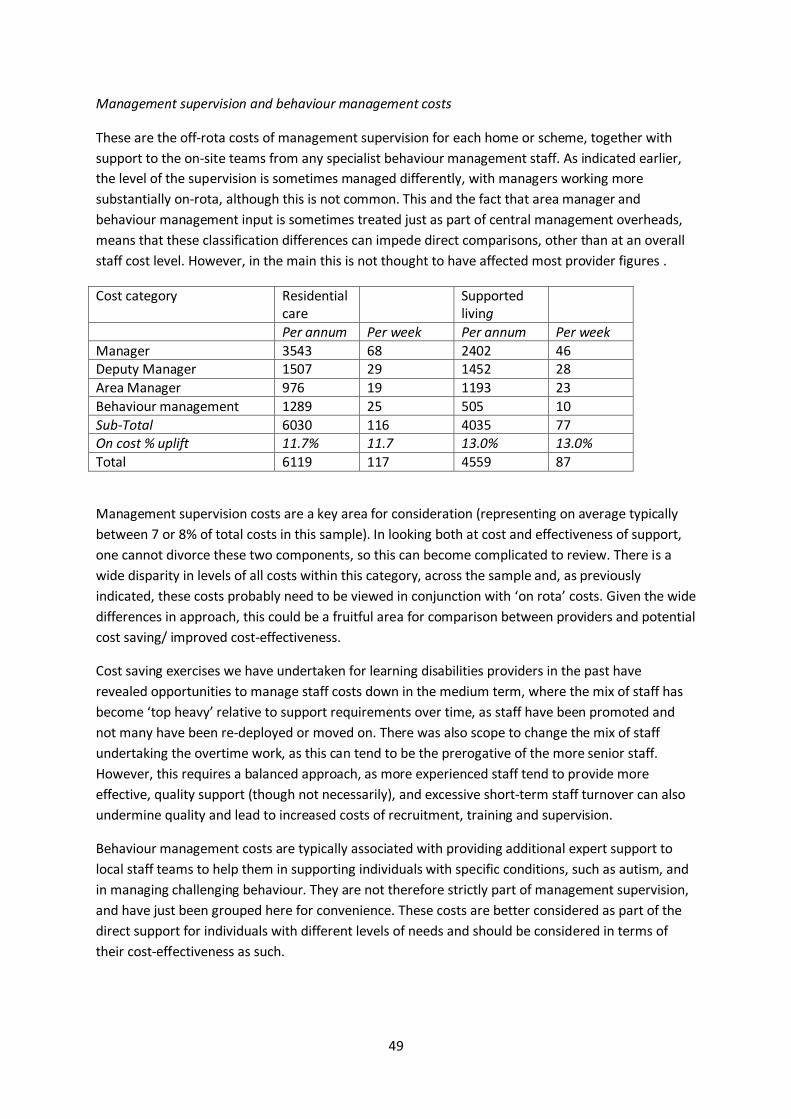
49
Management supervision and behaviour management costs
These are the off-rota costs of management supervision for each home or scheme, together with
support to the on-site teams from any specialist behaviour management staff. As indicated earlier,
the level of the supervision is sometimes managed differently, with managers working more
substantially on-rota, although this is not common. This and the fact that area manager and
behaviour management input is sometimes treated just as part of central management overheads,
means that these classification differences can impede direct comparisons, other than at an overall
staff cost level. However, in the main this is not thought to have affected most provider figures .
Cost category Residential care
Supported living
Per annum Per week Per annum Per week
Manager 3543 68 2402 46 Deputy Manager 1507 29 1452 28
Area Manager 976 19 1193 23
Behaviour management 1289 25 505 10
Sub-Total 6030 116 4035 77 On cost % uplift 11.7% 11.7 13.0% 13.0%
Total 6119 117 4559 87
Management supervision costs are a key area for consideration (representing on average typically
between 7 or 8% of total costs in this sample). In looking both at cost and effectiveness of support,
one cannot divorce these two components, so this can become complicated to review. There is a
wide disparity in levels of all costs within this category, across the sample and, as previously
indicated, these costs probably need to be viewed in conjunction with ‘on rota’ costs. Given the wide
differences in approach, this could be a fruitful area for comparison between providers and potential
cost saving/ improved cost-effectiveness.
Cost saving exercises we have undertaken for learning disabilities providers in the past have
revealed opportunities to manage staff costs down in the medium term, where the mix of staff has
become ‘top heavy’ relative to support requirements over time, as staff have been promoted and
not many have been re-deployed or moved on. There was also scope to change the mix of staff
undertaking the overtime work, as this can tend to be the prerogative of the more senior staff.
However, this requires a balanced approach, as more experienced staff tend to provide more
effective, quality support (though not necessarily), and excessive short-term staff turnover can also
undermine quality and lead to increased costs of recruitment, training and supervision.
Behaviour management costs are typically associated with providing additional expert support to
local staff teams to help them in supporting individuals with specific conditions, such as autism, and
in managing challenging behaviour. They are not therefore strictly part of management supervision,
and have just been grouped here for convenience. These costs are better considered as part of the
direct support for individuals with different levels of needs and should be considered in terms of
their cost-effectiveness as such.
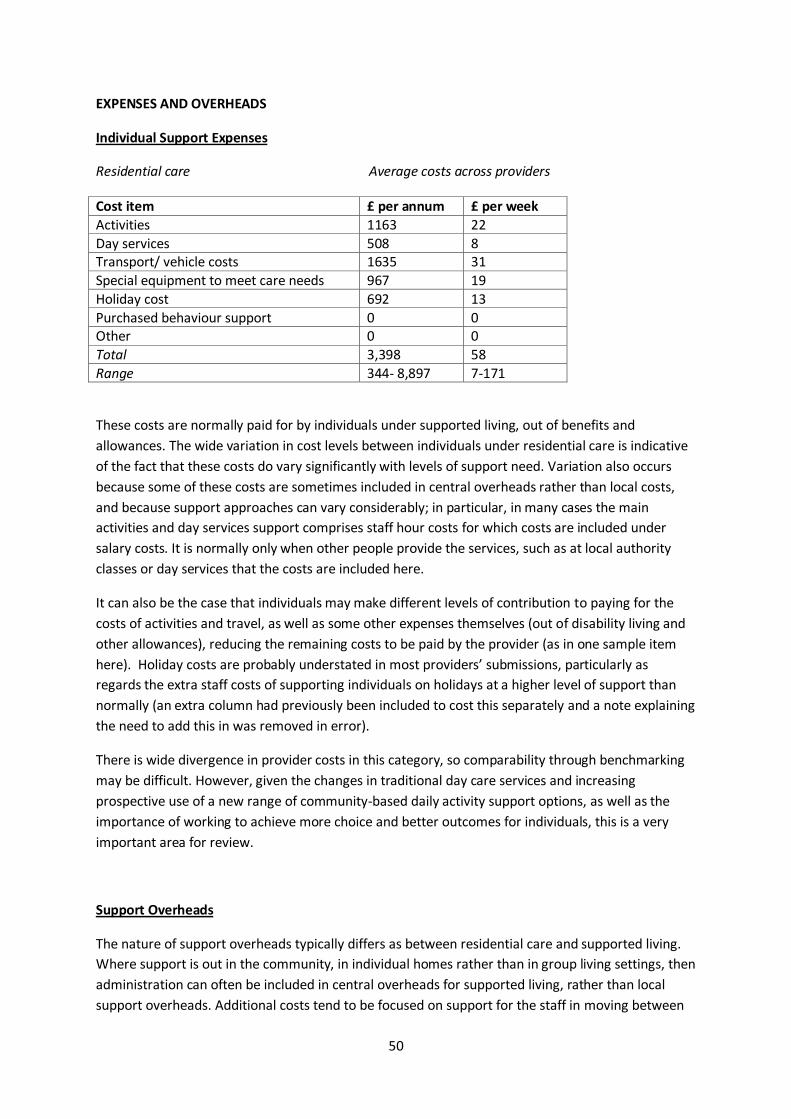
50
EXPENSES AND OVERHEADS
Individual Support Expenses
Residential care Average costs across providers
Cost item £ per annum £ per week
Activities 1163 22
Day services 508 8 Transport/ vehicle costs 1635 31
Special equipment to meet care needs 967 19
Holiday cost 692 13
Purchased behaviour support 0 0 Other 0 0
Total 3,398 58
Range 344- 8,897 7-171
These costs are normally paid for by individuals under supported living, out of benefits and
allowances. The wide variation in cost levels between individuals under residential care is indicative
of the fact that these costs do vary significantly with levels of support need. Variation also occurs
because some of these costs are sometimes included in central overheads rather than local costs,
and because support approaches can vary considerably; in particular, in many cases the main
activities and day services support comprises staff hour costs for which costs are included under
salary costs. It is normally only when other people provide the services, such as at local authority
classes or day services that the costs are included here.
It can also be the case that individuals may make different levels of contribution to paying for the
costs of activities and travel, as well as some other expenses themselves (out of disability living and
other allowances), reducing the remaining costs to be paid by the provider (as in one sample item
here). Holiday costs are probably understated in most providers’ submissions, particularly as
regards the extra staff costs of supporting individuals on holidays at a higher level of support than
normally (an extra column had previously been included to cost this separately and a note explaining
the need to add this in was removed in error).
There is wide divergence in provider costs in this category, so comparability through benchmarking
may be difficult. However, given the changes in traditional day care services and increasing
prospective use of a new range of community-based daily activity support options, as well as the
importance of working to achieve more choice and better outcomes for individuals, this is a very
important area for review.
Support Overheads
The nature of support overheads typically differs as between residential care and supported living.
Where support is out in the community, in individual homes rather than in group living settings, then
administration can often be included in central overheads for supported living, rather than local
support overheads. Additional costs tend to be focused on support for the staff in moving between
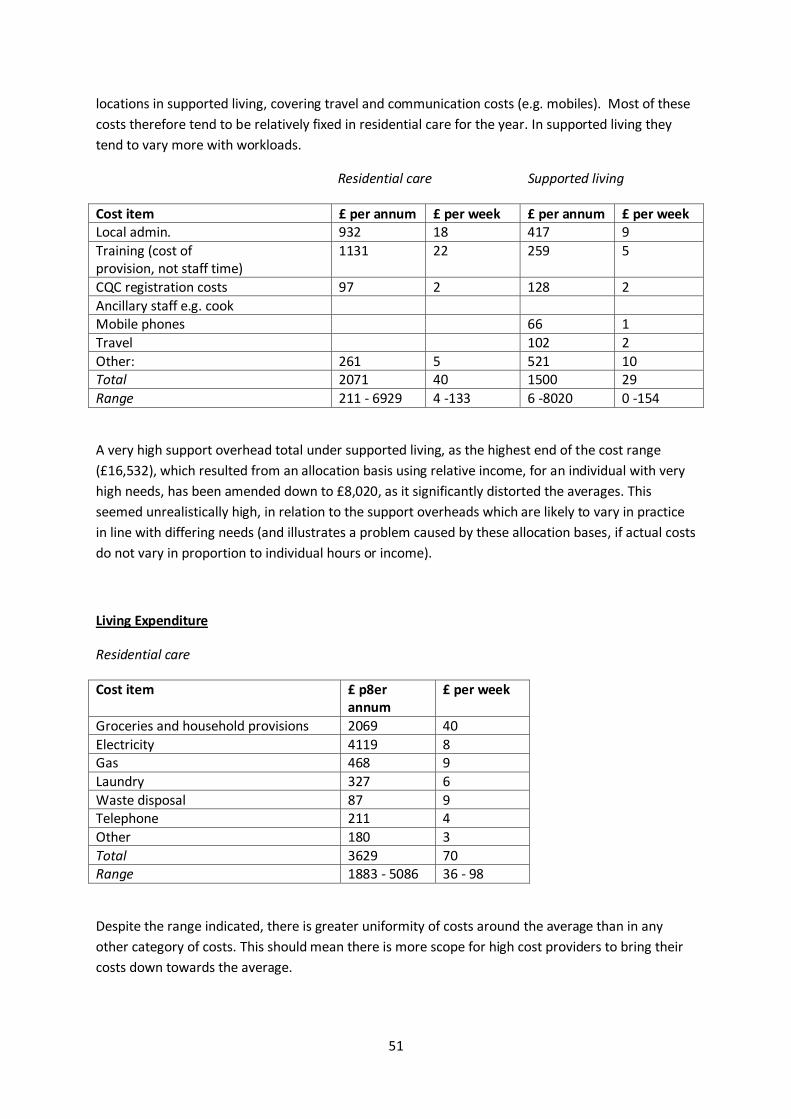
51
locations in supported living, covering travel and communication costs (e.g. mobiles). Most of these
costs therefore tend to be relatively fixed in residential care for the year. In supported living they
tend to vary more with workloads.
Residential care Supported living
Cost item £ per annum £ per week £ per annum £ per week Local admin. 932 18 417 9
Training (cost of provision, not staff time)
1131 22 259 5
CQC registration costs 97 2 128 2
Ancillary staff e.g. cook Mobile phones 66 1
Travel 102 2
Other: 261 5 521 10 Total 2071 40 1500 29
Range 211 - 6929 4 -133 6 -8020 0 -154
A very high support overhead total under supported living, as the highest end of the cost range
(£16,532), which resulted from an allocation basis using relative income, for an individual with very
high needs, has been amended down to £8,020, as it significantly distorted the averages. This
seemed unrealistically high, in relation to the support overheads which are likely to vary in practice
in line with differing needs (and illustrates a problem caused by these allocation bases, if actual costs
do not vary in proportion to individual hours or income).
Living Expenditure
Residential care
Cost item £ p8er annum
£ per week
Groceries and household provisions 2069 40
Electricity 4119 8 Gas 468 9
Laundry 327 6
Waste disposal 87 9 Telephone 211 4
Other 180 3
Total 3629 70 Range 1883 - 5086 36 - 98
Despite the range indicated, there is greater uniformity of costs around the average than in any
other category of costs. This should mean there is more scope for high cost providers to bring their
costs down towards the average.
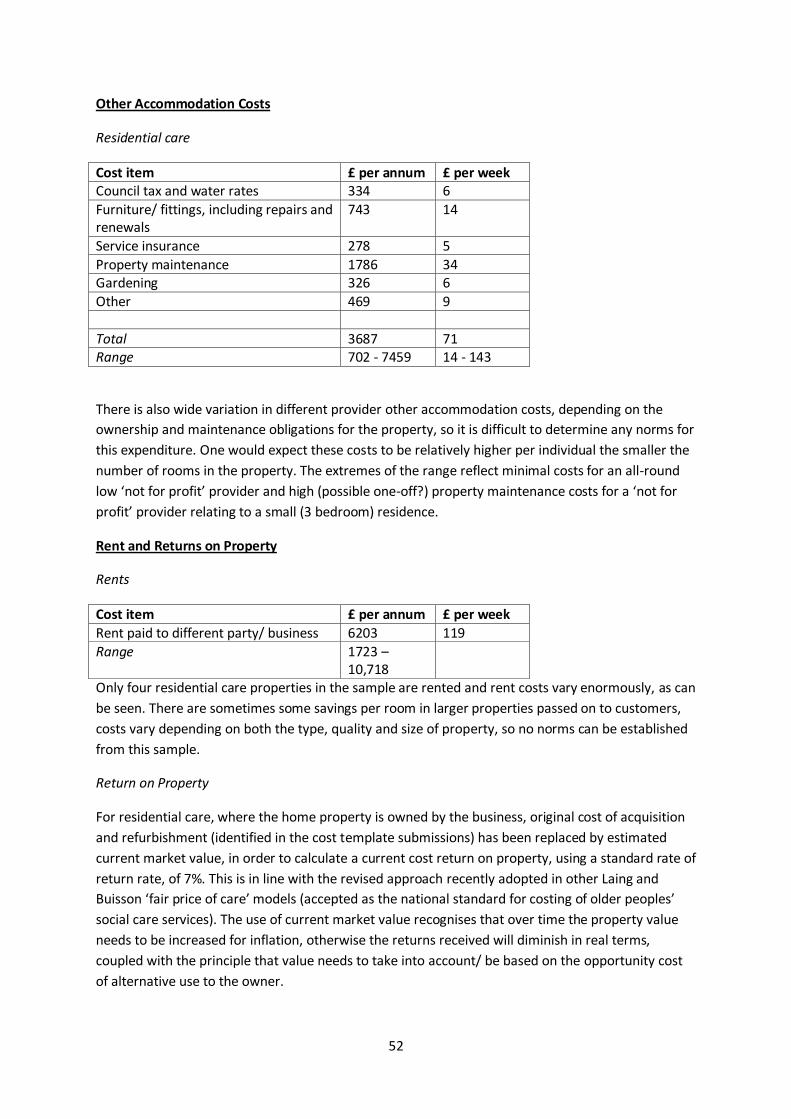
52
Other Accommodation Costs
Residential care
Cost item £ per annum £ per week Council tax and water rates 334 6
Furniture/ fittings, including repairs and renewals
743 14
Service insurance 278 5
Property maintenance 1786 34 Gardening 326 6
Other 469 9
Total 3687 71 Range 702 - 7459 14 - 143
There is also wide variation in different provider other accommodation costs, depending on the
ownership and maintenance obligations for the property, so it is difficult to determine any norms for
this expenditure. One would expect these costs to be relatively higher per individual the smaller the
number of rooms in the property. The extremes of the range reflect minimal costs for an all-round
low ‘not for profit’ provider and high (possible one-off?) property maintenance costs for a ‘not for
profit’ provider relating to a small (3 bedroom) residence.
Rent and Returns on Property
Rents
Cost item £ per annum £ per week
Rent paid to different party/ business 6203 119
Range 1723 – 10,718
Only four residential care properties in the sample are rented and rent costs vary enormously, as can
be seen. There are sometimes some savings per room in larger properties passed on to customers,
costs vary depending on both the type, quality and size of property, so no norms can be established
from this sample.
Return on Property
For residential care, where the home property is owned by the business, original cost of acquisition
and refurbishment (identified in the cost template submissions) has been replaced by estimated
current market value, in order to calculate a current cost return on property, using a standard rate of
return rate, of 7%. This is in line with the revised approach recently adopted in other Laing and
Buisson ‘fair price of care’ models (accepted as the national standard for costing of older peoples’
social care services). The use of current market value recognises that over time the property value
needs to be increased for inflation, otherwise the returns received will diminish in real terms,
coupled with the principle that value needs to take into account/ be based on the opportunity cost
of alternative use to the owner.
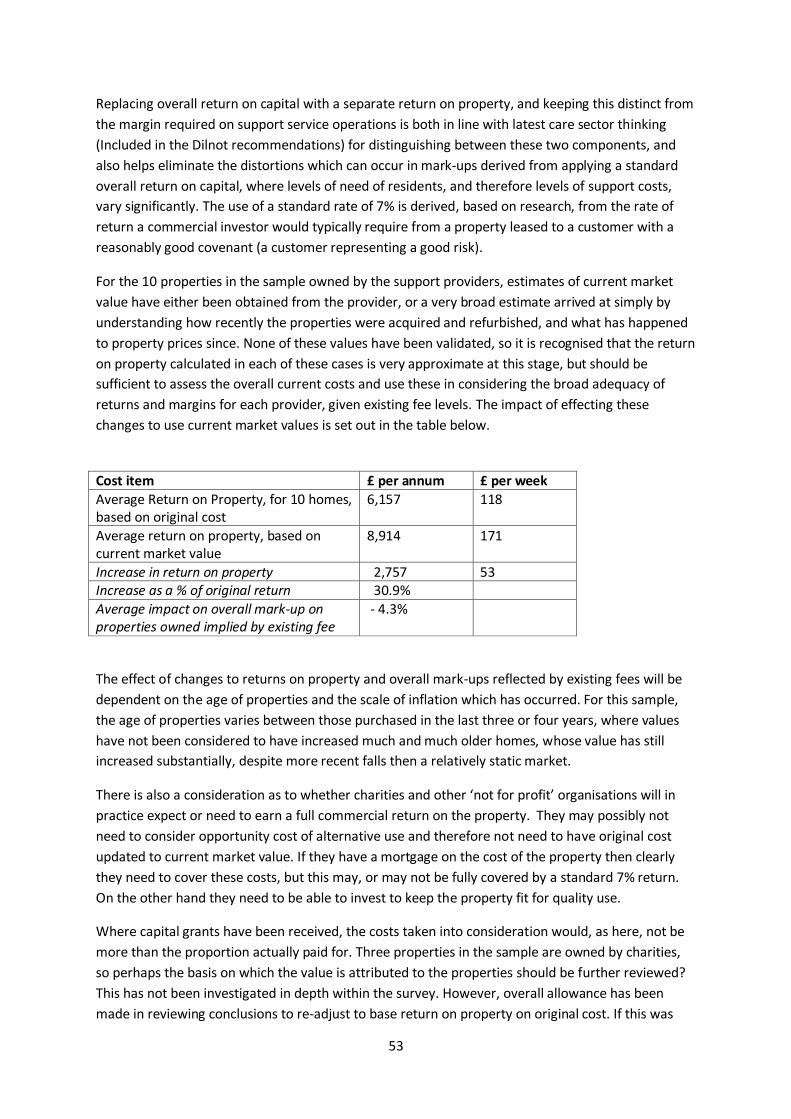
53
Replacing overall return on capital with a separate return on property, and keeping this distinct from
the margin required on support service operations is both in line with latest care sector thinking
(Included in the Dilnot recommendations) for distinguishing between these two components, and
also helps eliminate the distortions which can occur in mark-ups derived from applying a standard
overall return on capital, where levels of need of residents, and therefore levels of support costs,
vary significantly. The use of a standard rate of 7% is derived, based on research, from the rate of
return a commercial investor would typically require from a property leased to a customer with a
reasonably good covenant (a customer representing a good risk).
For the 10 properties in the sample owned by the support providers, estimates of current market
value have either been obtained from the provider, or a very broad estimate arrived at simply by
understanding how recently the properties were acquired and refurbished, and what has happened
to property prices since. None of these values have been validated, so it is recognised that the return
on property calculated in each of these cases is very approximate at this stage, but should be
sufficient to assess the overall current costs and use these in considering the broad adequacy of
returns and margins for each provider, given existing fee levels. The impact of effecting these
changes to use current market values is set out in the table below.
Cost item £ per annum £ per week
Average Return on Property, for 10 homes, based on original cost
6,157 118
Average return on property, based on current market value
8,914 171
Increase in return on property 2,757 53 Increase as a % of original return 30.9%
Average impact on overall mark-up on properties owned implied by existing fee
- 4.3%
The effect of changes to returns on property and overall mark-ups reflected by existing fees will be
dependent on the age of properties and the scale of inflation which has occurred. For this sample,
the age of properties varies between those purchased in the last three or four years, where values
have not been considered to have increased much and much older homes, whose value has still
increased substantially, despite more recent falls then a relatively static market.
There is also a consideration as to whether charities and other ‘not for profit’ organisations will in
practice expect or need to earn a full commercial return on the property. They may possibly not
need to consider opportunity cost of alternative use and therefore not need to have original cost
updated to current market value. If they have a mortgage on the cost of the property then clearly
they need to cover these costs, but this may, or may not be fully covered by a standard 7% return.
On the other hand they need to be able to invest to keep the property fit for quality use.
Where capital grants have been received, the costs taken into consideration would, as here, not be
more than the proportion actually paid for. Three properties in the sample are owned by charities,
so perhaps the basis on which the value is attributed to the properties should be further reviewed?
This has not been investigated in depth within the survey. However, overall allowance has been
made in reviewing conclusions to re-adjust to base return on property on original cost. If this was

54
appropriate for any or all of these three properties here, the impact on surpluses /deficits would
probably not be very material. This is an area which needs further investigation if an improved
approach is to be developed to be applied to residential care property investments across Surrey,
within the true costs of care.
Central Overheads
Residential care Supported living
Cost item £ per annum £ per week £ per annum £ per week
Central management, including proprietor
1415 27 1063 20
Central clinical and activity support
332 6 24 1
Quality function 485 9 212 4 Finance function 1167 22 745 14
Human Resources function (including recruitment)
1085 21 738 14
Central administrative costs 777 15 336 7
Office costs 1248 24 779 15 Maintenance salaries and associated costs
927 18 0 0
Central legal and finance costs 314 6 191 4
Other: 680 13 361 7
Total 7518 144 4627 89
Range 3065 – 13,523 59 - 259 456 -15327 9 - 294
There is a wide range of variation in central overheads allocated to individual costings, at least in
part due to the different impact of allocating these costs based on alternative bases of allocation (by
individual number, relative individual hours or income). As these costs can represent quite a high
proportion of total costs (8 or 9% or more), the impact of differing bases of allocation should be
analysed.
Other reasons why costs vary relate to the size of the provider organisation as a whole and therefore
the availability of economies of scale, as well as the mix of residential care and supported living
supported. Certain central costs, such as property and car fleet management, cannot be included as
support costs (but need to be recovered through rents paid via housing benefits, or through
individuals’ own benefits and allowances), and so supported living allocations tend to be lower.
This area of cost would clearly merit much greater comparison between providers and analysis, to
look for cost savings, and possibly also to utilise economies of scale better, through cost sharing
between providers.
David Roe. Laing and Buisson. 11 January 2013
Further analysis of many of report issues (including voids, fixed, variable & unit costs, financing and
cost saving opportunities) can be obtained by consulting our Illustrative Cost Models & Cost and
Cost-effectiveness issues in LD reports at www.laingbuisson.co.uk/MarketReports/FreeReports. n