surveillance of covid-19 in israel
TRANSCRIPT

Israel Center for Disease
Control
Surveillance of COVID-19 in Israel
Report for week 19 ending May 09, 2020

1
Israel Center for Disease Control ministry of Health Gertner Institute, Chaim Sheba Medical Center, Tel Hashomer 52621 [email protected] Tel: 03-7371500 Fax: 03-5349881
ICDC-Israel Center for Disease Control Ministry of Health Gertner Institute, Chaim Sheba Medical Center [email protected] Tel: 03-7371500 Fax: 03-5349881
Attention: Despite the changes in guidelines and the partial return to routine,
consumption of health services in the community continues to be low compared
to the same period in recent years, affecting the rate of visits due to respiratory
illness.
Summary: As of week 19, the low level of visits to community clinics and the emergency
departments due to respiratory morbidity is continued. This trend was also reflected in
the low number of samples from the sentinel clinics. All samples received were negative
for SARS-CoV-2.
Clinical: From the data provided by Maccabi and Clalit Health Service funds,
stabilization was observed in the rates of visits to community clinics due to upper
respiratory infections and pneumonia in all age groups. In the emergency departments,
there is not material change in the percentage and absolute number of visits due to
pneumonia.
Laboratory: On Week 19, 70 samples were collected from the sentinel clinics, in both
tracks. All samples were negative for SARS-CoV-2.

2
Israel Center for Disease Control ministry of Health Gertner Institute, Chaim Sheba Medical Center, Tel Hashomer 52621 [email protected] Tel: 03-7371500 Fax: 03-5349881
ICDC-Israel Center for Disease Control Ministry of Health Gertner Institute, Chaim Sheba Medical Center [email protected] Tel: 03-7371500 Fax: 03-5349881
1. Visits to Community Clinics due to Upper Respiratory Infections
(URI)
As of Week 19, there is continued stabilization in the rates of visits to "Maccabi
Health Services" community clinics due to upper respiratory infections in all age
groups (Figures 1 & 2). A similar picture was observed at “Clalit Health Services".
0
20
40
60
80
100
120
cases/1
0,0
00
week
Figure 1: Weelky rate of visits due to the upper respiratory tract infections,2017-2020, compared to multi-annual
average
- - -
0
20
40
60
80
100
120
140
160
case
s/1
0,0
00
year & week
Figure 2: Weekly rate of visits due to the upper respiratory tract infections by age and year, 2017-2020
- -

3
Israel Center for Disease Control ministry of Health Gertner Institute, Chaim Sheba Medical Center, Tel Hashomer 52621 [email protected] Tel: 03-7371500 Fax: 03-5349881
ICDC-Israel Center for Disease Control Ministry of Health Gertner Institute, Chaim Sheba Medical Center [email protected] Tel: 03-7371500 Fax: 03-5349881
2. Visits to community clinics due to pneumonia
On Week 19 stabilization in the rates of visits to "Maccabi Health Services"
community clinics due to pneumonia continues in all age groups (Figures 3 & 4). A
similar picture was observed at “Clalit Health Services".
0
2
4
6
8
10
12
14
16
case
s/1
0,0
00
week
Figure 3: Weekly rate of visits due to pneumonia, 2017-2020, compared to multi-annual average
- - -
0
5
10
15
20
25
30
case
s/1
0,0
00
year & week
Figure 4: Weekly rate of visits due to pneumonia, by age and year, 2019-2020
- -

4
Israel Center for Disease Control ministry of Health Gertner Institute, Chaim Sheba Medical Center, Tel Hashomer 52621 [email protected] Tel: 03-7371500 Fax: 03-5349881
ICDC-Israel Center for Disease Control Ministry of Health Gertner Institute, Chaim Sheba Medical Center [email protected] Tel: 03-7371500 Fax: 03-5349881
Calls to the nurses call center, Maccabi Health Services
Generally speakig, on Week 19 there is no material change in the number of calls to
"Maccabi Health Services’ nurses call center due to respiratory symproms, sore throat
and fever is continued (Figure 5).
0
200
400
600
800
1000
1200
Nu
mb
er
year and week
Fig. 5: Calls to the Nursing Call center due to sore throat and cough, Maccabi Health Services
Fever in adults sore throat cough shortness of breath fever in children

5
Israel Center for Disease Control ministry of Health Gertner Institute, Chaim Sheba Medical Center, Tel Hashomer 52621 [email protected] Tel: 03-7371500 Fax: 03-5349881
ICDC-Israel Center for Disease Control Ministry of Health Gertner Institute, Chaim Sheba Medical Center [email protected] Tel: 03-7371500 Fax: 03-5349881
3. Visits to hospital Emergency Medicine Departments (ED) due to
pneumonia (Based on the Ministry of Health's database managed by the Health
Information Division).
Generally speaking, on week 19, - there was no material change in the percentage
and the absolute number of visits to emergency departments at "Clalit Health
Services" hospitals due to pneumonia (Figures 6-8).
0
1
2
3
4
5
percen
tag
e
year & week
Fig. 6: Percentage of visits to internal medicine ERs due to pneumonia, Clalit hospitals, 2018-2020, compared to multi-annual average
0
1
2
3
4
5
6
percen
tag
e
year & week
Fig. 7: Percentage of visits to pediatric medicine ERs due to pneumonia, Clalit hospitals, 2018-2020, compared to multi-annual average
0
50
100
150
200
250
300
Nu
mb
er
Year & week
Fig. 8: Number of visits to Clalit ERs due to pneumonia, 2019-2020
pediatric ERs Internal ERs

6
Israel Center for Disease Control ministry of Health Gertner Institute, Chaim Sheba Medical Center, Tel Hashomer 52621 [email protected] Tel: 03-7371500 Fax: 03-5349881
ICDC-Israel Center for Disease Control Ministry of Health Gertner Institute, Chaim Sheba Medical Center [email protected] Tel: 03-7371500 Fax: 03-5349881
4. Clusters of respiratory morbidity
Identification of clusters is based on data obtained daily from Maccabi and Clalit
Health Services. The clusters are identified by focusing on two diagnostic categories:
upper respiratory tract infections and pneumonia. Data analysis is performed based
on statistical geographic areas.
During week 19 and as of 09/05/2020, areas with a clear consistency in the presence
of the clusters, of the two diagnostic categories and on the basis of data from the
two health funds, were:
Jerusalem
Beit Shemesh
Nazereth, Yafia
Tel Aviv, Ramat Gan, Givatayim and Azur
Cluster identified for the first time:
Rahat
Beitar Ilit area
5. Sentinel clinics in the community
Sentinel clinic activity for surveillance of morbidity caused by SARS-CoV-2 began on
week 12. As of Week 19, the network includes 41 clinics nationwide. At this time
there are two sampling tracks. In Track A, nasopharyngeal samples are taken from
patients attending clinics with fever and/or respiratory symptoms with or without a
diagnosis of pneumonia and with no known exposure to a confirmed COVID-19

7
Israel Center for Disease Control ministry of Health Gertner Institute, Chaim Sheba Medical Center, Tel Hashomer 52621 [email protected] Tel: 03-7371500 Fax: 03-5349881
ICDC-Israel Center for Disease Control Ministry of Health Gertner Institute, Chaim Sheba Medical Center [email protected] Tel: 03-7371500 Fax: 03-5349881
patient or returning from a foreign country in the 14 days prior to onset. In addition,
for patients who do not physically come to the clinic but rather consult their
physician using digital technology methods, testing is possible using track B, where
the sample is collected by Magen David Adom (MDA) Emergency Services in patients'
homes or at drive-thru centers.
5.1. Track A - samples obtained at sentinel clinics
Table 1. Number of patients that tested positive for SARS-CoV-2 of the total number of
patients sampled (track A)
Week 19 03/05-09/05/2020
Accumulated Data from Week 12
15/03-09/05/2020
Positive 0 (0%) 16 (2.1%)
Negative 67 (100%) 764 (97.9%)
Total 67 780
* There may be a retroactive update of the number of samples and their results.
5.2. Track 2 - Samples of sentinel clinic patients obtained by MDA

8
Israel Center for Disease Control ministry of Health Gertner Institute, Chaim Sheba Medical Center, Tel Hashomer 52621 [email protected] Tel: 03-7371500 Fax: 03-5349881
ICDC-Israel Center for Disease Control Ministry of Health Gertner Institute, Chaim Sheba Medical Center [email protected] Tel: 03-7371500 Fax: 03-5349881
Table 2. Number of patients that tested positive for SARS-CoV-2 of the total number of
patients sampled in Track B (Sentinel clinics - MDA)
Week 19 03/05-09/05/2020
Accumulated Data from Week 12
15/03-09/05/2020
Positive 0 (0%) 8 (6.4%)
Negative 3 (100%) 117 (93.6%)
Total 3 125
* There may be a retroactive update of the number of samples and their results.
5.3. Patients that tested positive for SARS-CoV-2 in both sentinel clinics’ tracks (Tables 3, 5 and Figure 9)
9
Israel Center for Disease Control ministry of Health Gertner Institute, Chaim Sheba Medical Center, Tel Hashomer 52621 [email protected] Tel: 03-7371500 Fax: 03-5349881
ICDC-Israel Center for Disease Control Ministry of Health Gertner Institute, Chaim Sheba Medical Center [email protected] Tel: 03-7371500 Fax: 03-5349881
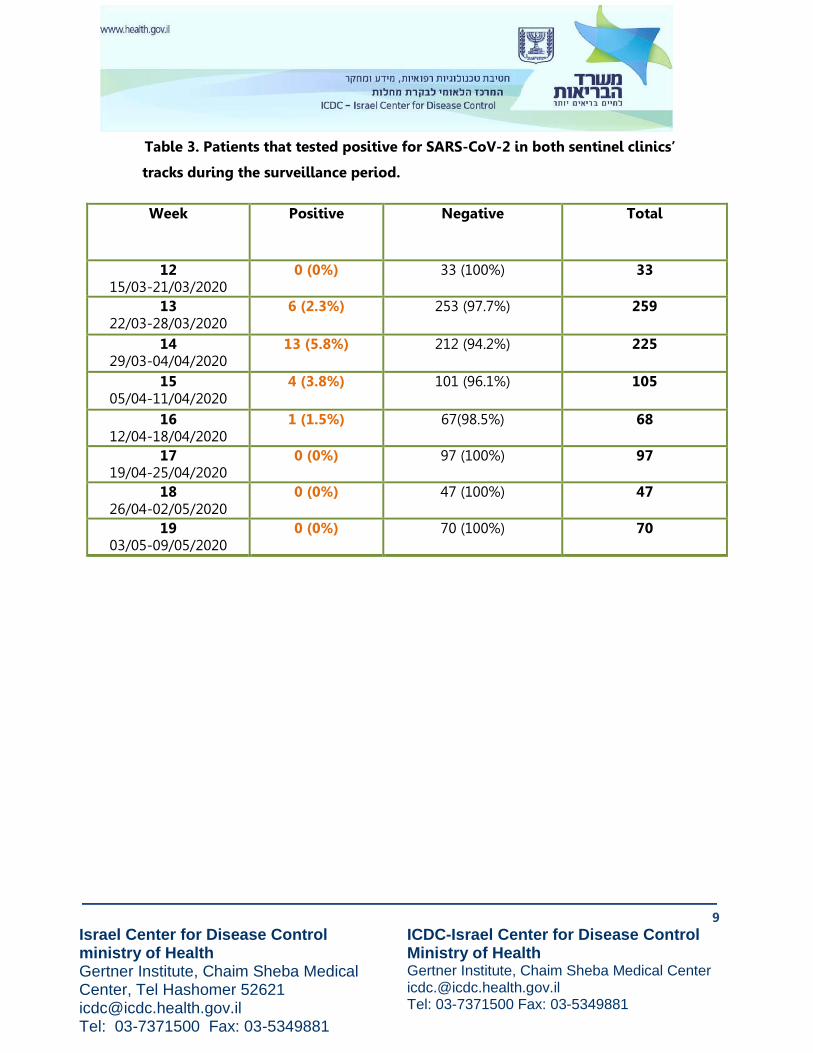
Table 3. Patients that tested positive for SARS-CoV-2 in both sentinel clinics’
tracks during the surveillance period.
Week Positive Negative
Total
12 15/03-21/03/2020
0 (0%) 33 (100%) 33
13 22/03-28/03/2020
6 (2.3%) 253 (97.7%) 259
14 29/03-04/04/2020
13 (5.8%) 212 (94.2%) 225
15 05/04-11/04/2020
4 (3.8%) 101 (96.1%) 105
16 12/04-18/04/2020
1 (1.5%) 67(98.5%) 68
17 19/04-25/04/2020
0 (0%) 97 (100%) 97
18 26/04-02/05/2020
0 (0%) 47 (100%) 47
19 03/05-09/05/2020
0 (0%) 70 (100%) 70

10
Israel Center for Disease Control ministry of Health Gertner Institute, Chaim Sheba Medical Center, Tel Hashomer 52621 [email protected] Tel: 03-7371500 Fax: 03-5349881
ICDC-Israel Center for Disease Control Ministry of Health Gertner Institute, Chaim Sheba Medical Center [email protected] Tel: 03-7371500 Fax: 03-5349881
Table 4. Number of Patients that tested positive for the COVID-19 by location in both
monitoring tracks during the surveillance period
(Only the localities in which there was at least one positive sample during the surveillance period
are specified)
Municipality Number of positive samples
(Total no. of samples) Week 19
03/05-09/05/2020
Accumulated number of positive samples
(Total no. of samples) since Week 12
15/03-09/05/2020
Elad 0 (0) 3 (18)
Beit Shemesh 0 (0) 1 (53)
Bnei Brak 0 (0) 1 (5)
Jerusalem 0 (8) 12 (127)
Acre 0 (1) 1 (35)
Rosh HaAyin 0 (3) 1 (21)
Ramat HaSharon 0 (0) 1 (31)
Sderot 0 (0) 2 (11)
Tel Aviv 0 (3) 2 (51)
As of Week 19, no SARS-CoV-2 -positive samples were detected in both surveillance tracks.
11
Israel Center for Disease Control ministry of Health Gertner Institute, Chaim Sheba Medical Center, Tel Hashomer 52621 [email protected] Tel: 03-7371500 Fax: 03-5349881
ICDC-Israel Center for Disease Control Ministry of Health Gertner Institute, Chaim Sheba Medical Center [email protected] Tel: 03-7371500 Fax: 03-5349881
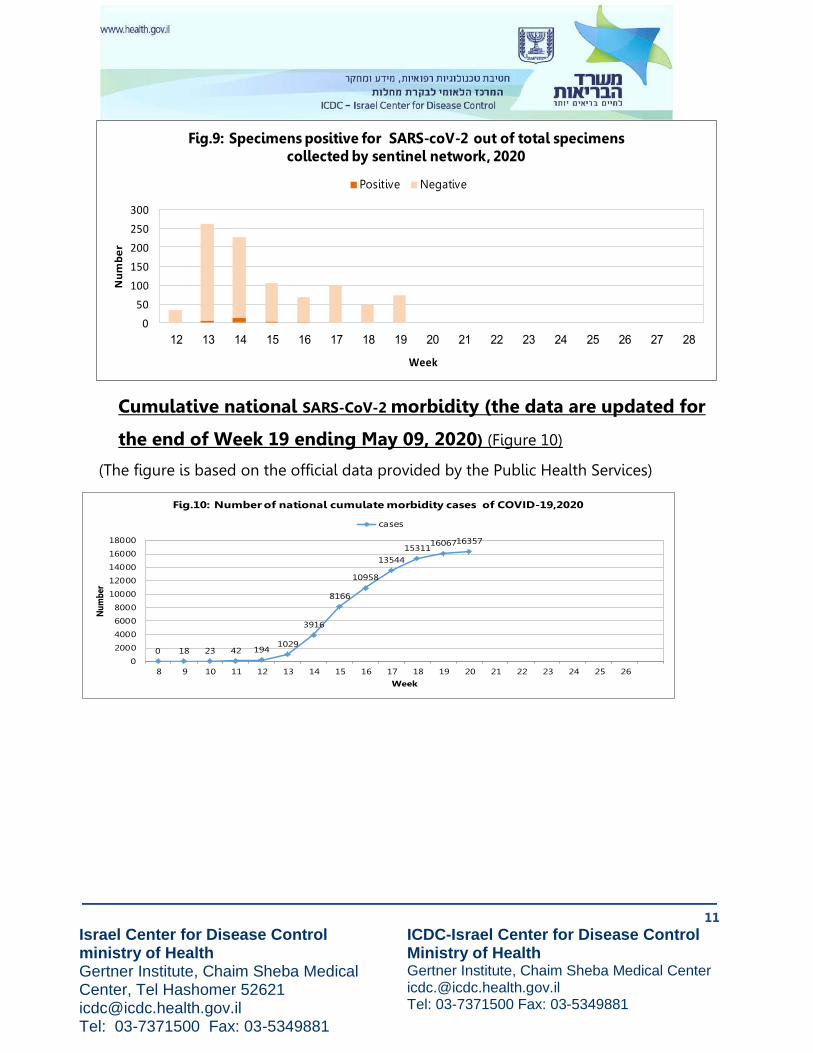
Cumulative national SARS-CoV-2 morbidity (the data are updated for
the end of Week 19 ending May 09, 2020) (Figure 10)
(The figure is based on the official data provided by the Public Health Services)
0
50
100
150
200
250
300
Number
Week
Fig.9: Specimens positive for SARS-coV-2 out of total specimens collected by sentinel network, 2020
Positive Negative
0 18 23 42 1941029
3916
8166
10958
13544
153111606716357
0
2000
4000
6000
8000
10000
12000
14000
16000
18000
Nu
mb
er
Week
Fig.10: Number of national cumulate morbidity cases of COVID-19,2020
cases
12
Israel Center for Disease Control ministry of Health Gertner Institute, Chaim Sheba Medical Center, Tel Hashomer 52621 [email protected] Tel: 03-7371500 Fax: 03-5349881
ICDC-Israel Center for Disease Control Ministry of Health Gertner Institute, Chaim Sheba Medical Center [email protected] Tel: 03-7371500 Fax: 03-5349881
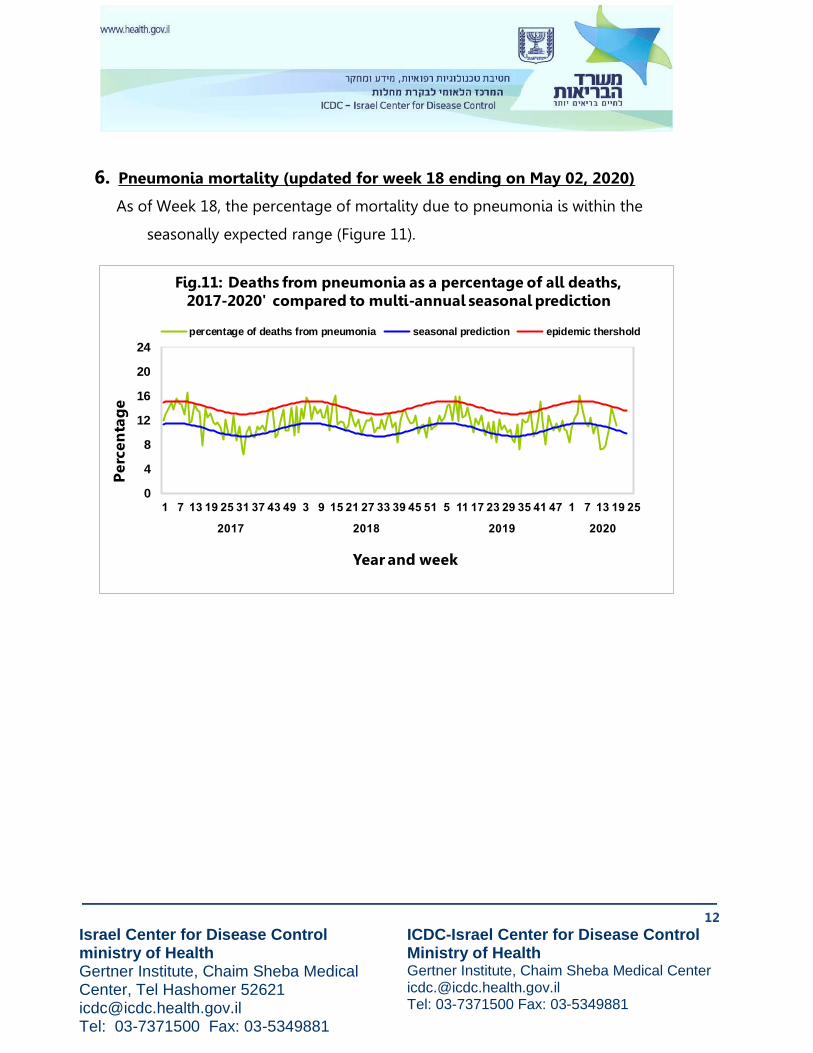
6. Pneumonia mortality (updated for week 18 ending on May 02, 2020)
As of Week 18, the percentage of mortality due to pneumonia is within the
seasonally expected range (Figure 11).
0
4
8
12
16
20
24
Pe
rce
nta
ge
Year and week
Fig.11: Deaths from pneumonia as a percentage of all deaths, 2017-2020' compared to multi-annual seasonal prediction
percentage of deaths from pneumonia seasonal prediction epidemic thershold

13
Israel Center for Disease Control ministry of Health Gertner Institute, Chaim Sheba Medical Center, Tel Hashomer 52621 [email protected] Tel: 03-7371500 Fax: 03-5349881
ICDC-Israel Center for Disease Control Ministry of Health Gertner Institute, Chaim Sheba Medical Center [email protected] Tel: 03-7371500 Fax: 03-5349881
8. Global COVID-19 snapshot
The upward trend in the number of people contracting SARS-CoV-2 is continued. As of
10/05/20, the total number of confirmed COVID-19 cases was 3,916,654, of which 61,578
were new cases. The total number of deaths is 274,348, of which 8,499 were new deaths.
Countries with the highest number of deaths were: USA (75,364), United Kingdom
(31,587), Italy (30,395), Spain (26,478), France (26,268), Brazil (9,897), Belgium (8,581),
Germany (7,395) and Iran (6,589). (The data was gathered from the World Health
Organization Report - Status Report 111).
https://www.who.int/docs/default-source/coronaviruse/situation-reports/20200510covid-19-sitrep-
111.pdf?sfvrsn=1896976f_2