survey and analysis of pamba river and its...
TRANSCRIPT

Chapter-2
Survey and Analysis of Pamba River and its Pollution

Survey and Analysis of Pamba River and its Pollution
29
2.1 INTRODUCTION
Pollution can be found everywhere on the globe, even in the Polar Regions.
Pollution destroys and harms not only the air, the water, and the environment, but
also humans, animals, and plants. Air pollution is anything that contaminates the
natural composition of the chemistry of the air. Examples of things that might
contaminate the air are vehicle exhaust, deforestation and forest fires, smoke and
gases from factories and industries. Water Pollution is effected when the water is no
longer pure and contains bacteria or chemical impurities. All these impurities
decrease and lower the quality of the water and can have serious effects on the
aquatic life. Land or Soil Pollution results is when something happens to the soil or
land that it no longer can keep its growth rate or if something disturbs the natural
balance of growth in that land. Noise Pollution is when humans make and produce
high levels of noise, which are beyond the regular. Sources include traffic; concerts;
airplanes; industrial machinery; construction or demolition.
Water pollution is defined as the undesirable change is physical, chemical
and biological characteristics in the water bodies which may cause harmful effects
on human and aquatic life. Water pollution affects plants and organisms living in
these bodies of water. In almost all cases the effect is damaging not only to
individual species and populations, but also to the natural biological communities
There are two main sources of water pollution; point sources and non-point
sources. Point sources include factories, wastewater treatment facilities, septic
systems, and other sources that are clearly discharging pollutants into water sources.
Non-point sources are more difficult to identify, because they cannot be traced back

Chapter 2
30
to a particular location. Non-point sources include runoff including sediment,
fertilizer, chemicals and animal wastes from farms, fields, construction sites and
mines. Landfills can also be a non-point source of pollution, if substances leach from
the landfill into water supplies.
The United States Environmental Protection Agency (EPA) divides water
pollutants into the following six categories. The most important one is biodegradable
waste consisting mainly of human and animal waste. When biodegradable waste
enters a water supply, the waste provides an energy source (organic carbon) for
bacteria. Organic carbon is converted to carbon dioxide and water, which can cause
atmospheric pollution and acid rain; this form of pollution is far more widespread
and problematic than other forms of pollutants, such as radioactive waste. If there is
a large supply of organic matter in the water, oxygen-consuming (aerobic) bacteria
multiply quickly, consume all available oxygen, and kill all aquatic life. Plant
nutrients, such as phosphates and nitrates, enter the water through sewage, and
livestock and fertilizer runoff. Phosphates and nitrates are also found in industrial
phosphates in water are human-added. When there is too much nitrogen or
phosphorus in a water supply (0.3 parts per million for nitrogen and 0.01 parts per
million for phosphorus), algae begin to develop. When algae blooms, the water can
turn green and cloudy, feel slimy, and smell bad. Weeds start to grow and bacteria
spread. Decomposing plants use up the oxygen in the water, disrupting the aquatic
life, reducing biodiversity, and even killing aquatic life. This process, called
eutrophication, is a natural process, but generally occurs over thousands of years.
Eutrophication allows a lake to age and become more nutrient-rich; without nutrient
pollution, this may take 10,000 years, but pollution can make the process occur 100

Survey and Analysis of Pamba River and its Pollution
31
to 1,000 times faster. Heat can be a source of pollution in water. As the water
temperature increases, the amount of dissolved oxygen decreases. Thermal pollution
can be natural, in the case of hot springs and shallow ponds in the summertime, or
human-made, through the discharge of water that has been used to cool power plants
or other industrial equipment. Fish and plants require certain temperatures and
oxygen levels to survive, so thermal pollution often reduces the aquatic life diversity
in the water. Sediment is one of the most common sources of water pollution.
Sediment consists of mineral or organic solid matter that is washed or blown from
land into water sources. Sediment pollution is difficult to identify, because it comes
from non-point sources, such as construction, agricultural and livestock operations,
logging, flooding, and city runoff. Each year, water sources in the United States are
polluted by over one billion tonnes of sediment! Sediment can cause large problems,
as it can clog municipal water systems, smother aquatic life, and cause water to
become increasingly turbid. And, turbid water can cause thermal pollution, because
cloudy water absorbs more solar radiation. Radioactive pollutants include
wastewater discharges from factories, hospitals and uranium mines. These pollutants
can also come from natural isotopes, such as radon. Radioactive pollutants can be
dangerous, and it takes many years until radioactive substances are no longer
considered dangerous.
2.1.1 Water Resources in India at a Glance
The geographical area of India is 3,287,590 sq km. The length of its
Coastline is about 7500 km. The climate of India varies from tropical monsoon in
south to temperate in north. Its terrain have upland plain (Deccan Plateau) in south,
flat to rolling plain along the Ganges, deserts in west, Himalayas in north. India is

Chapter 2
32
enviably endowed in respect of water resources. The country is literally criss-
crossed with rivers and blessed with high precipitation mainly due to the southwest
monsoon, which accounts for 75% of the annual rainfall. There are thirteen major
river basins (area more than 20,000 square kilometres) in the country, which occupy
82.4% of total drainage basins, contribute eighty five percent of total surface flow
and house eighty percent of the country's population. Major river basins are
Brahmaputra, Ganga (including Yamuna Sub Basin), Indus (including Satluj and
Beas Sub Basin), Godavari, Krishna, Mahanadi, Narmada, Cauvery, Brahmini
(including Baitarni Sub Basin), Tapi, Mahi, Pennar and Sabarmati. The
classification of river basin based on catchment area is given There are few desert
rivers, which flow for some distance and get lost in deserts. There are complete arid
areas where evaporation equals rainfall and hence no surface-flow. The medium and
minor river basins are mainly in coastal area. On the east coast and part of Kerala
State, the width of land between mountain and sea is about 100 km, and hence the
riverine length is also about 100 km. whereas, the rivers in the west coast are much
shorter as the width of the land between sea and mountains is less than 10 to 40 km.
Yet, in spite of the nature’s bounty, paucity of water is an issue of national concern
resulting in deterioration of water quality in aquatic resources. (Central Pollution
Control Board)
Survey and Analysis of Pamba River and its Pollution
33
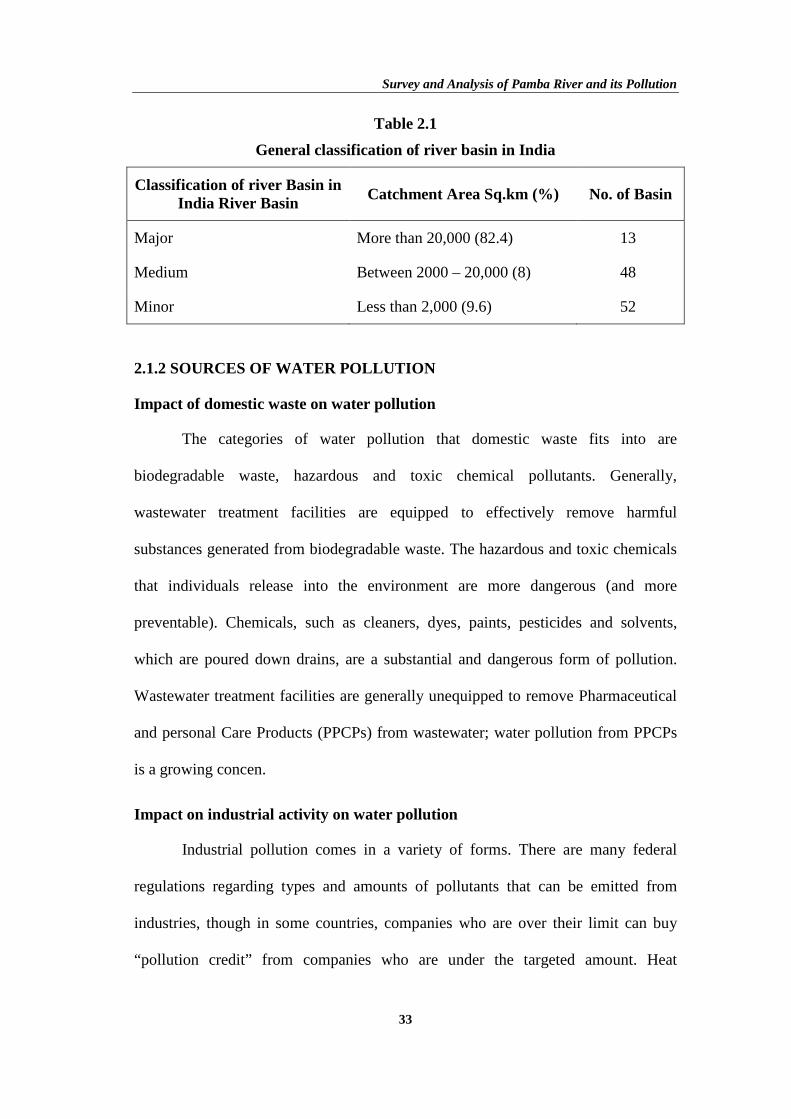
Table 2.1
General classification of river basin in India
Classification of river Basin in India River Basin
Catchment Area Sq.km (%) No. of Basin
Major More than 20,000 (82.4) 13
Medium Between 2000 – 20,000 (8) 48
Minor Less than 2,000 (9.6) 52
2.1.2 SOURCES OF WATER POLLUTION
Impact of domestic waste on water pollution
The categories of water pollution that domestic waste fits into are
biodegradable waste, hazardous and toxic chemical pollutants. Generally,
wastewater treatment facilities are equipped to effectively remove harmful
substances generated from biodegradable waste. The hazardous and toxic chemicals
that individuals release into the environment are more dangerous (and more
preventable). Chemicals, such as cleaners, dyes, paints, pesticides and solvents,
which are poured down drains, are a substantial and dangerous form of pollution.
Wastewater treatment facilities are generally unequipped to remove Pharmaceutical
and personal Care Products (PPCPs) from wastewater; water pollution from PPCPs
is a growing concen.
Impact on industrial activity on water pollution
Industrial pollution comes in a variety of forms. There are many federal
regulations regarding types and amounts of pollutants that can be emitted from
industries, though in some countries, companies who are over their limit can buy
“pollution credit” from companies who are under the targeted amount. Heat
Chapter 2
34
pollution is commonly caused by industries, but many regions have passed
legislation requiring that power plants and industries cool water before they release
it. Construction, mining and logging operations can cause great amounts of sediment
to pollute lakes and streams.
Impact of agriculture on water pollution
The greatest agricultural contributions to water pollution are through nutrient
and sediment pollution. Livestock waste and fertilizers contain nitrogen and
phosphorus, which, if carried to lakes and streams through runoff, can cause
significant problems resulting in excess algae growth.
In the last ten years, the number of livestock in India has increased by about
65 percent, mostly in the form of pigs and cows. The livestock produce a large
amount of waste, which many farmers use as fertilizer on their fields. In the
Winnipeg area, thousands of hectares of farmland have been designed for efficient
runoff, which minimizes flooding. However, when the water runs off, it carries
organic matter from the fertilizers straight into the creeks that feed Lake Winnipeg.
There are several best management practices that can reduce the amount of
agricultural water pollution, such as collecting animal wastes in a lagoon, or
spraying pesticides in small amounts and at minimal runoff times. Agricultural
practices are the leading cause of sediment pollution, because bare lands are
susceptible to large amounts of erosion. Erosion causes problems both for the water
source and the farmland, which loses significant amounts of topsoil each year. Water
pollution is the contamination of water bodies (e.g. lakes, rivers, oceans, aquifers
and groundwater). Water pollution occurs when pollutants are discharged directly or
Survey and Analysis of Pamba River and its Pollution
35
indirectly into water bodies without adequate treatment to remove harmful
compounds.
2.2 REVIEW OF LITERATURE
Kerala, a 550 km long strip of land between the Western Ghats and the
Arabian Sea in the South West corner of India, is divided in to three regions, the
high lands, mid-lands and the low lands. Availability of water at the right time
through plenty of rains and irrigation from rivers and backwaters is what makes
Kerala evergreen and agriculturally rich state. The rivers with their tributaries and
feeders run across like arteries and veins of the land. Vembanad lake, the biggest
backwaters with about 200 sq.km area, receives water drained from six large rivers.
Of the 199 cm rain water that falls in Kerala, 60 percent flows down through the
rivers to the sea. As it happens all over the world, the regions on the banks of the
rivers have witnessed great material and cultural progress from ancient times. The
folklore of Kerala is rich with devotional tributes to rivers. The magnificent
indigenous culture, developed and flourished along the banks of some of the largest
rivers of Kerala, presents certain common features and astonishing similarity.
Bharatapuzha, Periyr and Pamba the longest rivers of the erstwhile Malabar, Cochin
and Travancore States respectively.
The river has always occupied a central place in India’s material life and
scared culture. In common with the other riparian Civilisations of antiquity, the
civilizations of Indus and the Ganga valleys developed a water cosmology, a belief
in the waters as the origin and sustaining principle of life. The association of rivers
with treasure is precise. In the early monsoon economy, the rivers alluvial deposits
rendered the land fertile, made agriculture possible. The river has also been a crucial
Chapter 2
36
pivot in political life. Immortalised as a garden of paradise in various mythic
traditions; the land between the rivers has been a coveted prize too: in India, the
agrarian histories of the Ganga-Yamuna doab in the north and the Krishna –
Thungabhadra doab in the south mark the waxing and warning of imperial destinies.
It is said that the rivers of India have a natural capacity to cleanse themselves. With
growing Urbanization, agricultural demand for water is increasing and sewage
spewing into our depleted river system, by innate capacity of rejuvenates is being
sorely tested. The Yamuna, which in the lean months is reduced to a trickle and the
Sabarmati, are the most polluted rivers of the country. Pollution level rises
phenomenally when the water in the rivers decreases. There are also disturbing a
report of the Ganga drying up because the Gangogtri glacier, its main source of
water, is receding at the rate 10-30 meters a year. Dr. R.C Trivedi, of the Central
Pollution Control Board (CPCB), who is monitoring water quality at 507 points on
all major rivers in the country is extremely concerned about the fate of our rivers.
The horrifying fact is that all government efforts to rejuvenate the water bodies have
come to naught.
Most rivers are facing a water shortage and that is a major problem,
heightening the pollution level. In the last 20 years, the area under agriculture has
been augmented with increased irrigation drawn from our rivers. The use of
fertilizers and pesticides has increased in a big way and this in turn has pushed up
the demand for water for irrigation. In the non- monsoon period it is the
underground water that comes into rivers to recharge them. The subterranean
aquifers are the biggest contributors to the water flow of the rivers in the lean
months. The water table has dropped by two or three meters in most part of the

Survey and Analysis of Pamba River and its Pollution
37
country. The depletion of underground water is matched by over use of surface
water. All our major rivers have been dammed at several points and water diverted
in to canals for irrigation. In Gujarat it is down by four to five meters. In fact, the
water pollution scenario is quite frightening. With the population explosion, urban
centers are spreading and there is a greater generation of waste water. Our
municipalities, even if they have the most honorable intentions, are not able to find
the recourses to treat waste water.
The class 1 cities (population of over 1,00,000 generates 16,000 mld (million
liters daily). Of the 17,600 million liters of waste water generated in the country
every day, only 4,000 million liters are treated. Vast quantities of untreated waste
water are getting into our water bodies and the environment. Of the 45,000 km
length of our rivers. 6,000 km have a bio oxygen demand (BOD) above 3 mg/l,
which means they are unfit for drinking. Dilip Biswas, Chairman of the CPCB.
2001. The Sabarmati has a BOD of 15 to 20 mg/l and the Yamuna, a critically sick
river, a BOD of 35 to 40 mg/l. The Coliform count in the Yamuna is as high as in
raw sewage.
Rivers are lifelines of ecosystem and any disturbance and alteration has
serious repercussions to all living beings. The incessant anthropogenic pressure
profoundly disturbed the balance of aquatic realm and no country is an exception.
Proper treatment methodologies are very much helpful to mitigate pollution effects.
Currently there is a growing awareness of the impact of sewage contamination on
rivers and lakes; wastewater treatment is now receiving greater attention
internationally (Ghayeni et al., 1996). Chemical treatment entails addition of certain
Chapter 2
38
chemicals that cause changes in the structure of the contaminants so that they can be
removed more easily.
Constructed wetlands can serve as wastewater treatment systems which can
treat a variety of wastewaters by the microbial, biological, physical and chemical
processes (Hamilton, et al., 1997; García, et al., 2004; Voeks and Rahmatian, 2004).
Kolawole et al., (2009) evaluated the efficacy and after effects of slacked lime in
treating Agba River water in Nigeria. Jing, et al., (2001) reported that constructed
wetlands could effectively remove the BOD, suspended solids and nutrients from
highly polluted river water. Sakadevan and Bavor (1998), also concluded that the
treatment efficiency of pollutants in a constructed wetland could be improved by
decreasing the hydraulic loading or by increasing the hydraulic retention time. Juang
and Chen (2007), also studied the treatment of polluted river water using constructed
wetlands. Si et al., (2012) analyzed the feasibility of the treatment of polluted river
water in Northern China.
Water quality is a major economic and environmental issue in both
developed and developing countries. Rapid industrialization, urbanization and
development activities, which aim at coping with the population explosion, bring
inevitable water crises (Yerel, 2010). The dwindling quality of water in rivers in
Lebanon was thoroughly explored (Houri and Jeblawi, 2007). Ho et al., (2003)
enumerated the reduction in water quality of samples collected from East River
(Dongjiang), with particular reference to drinking water supply in Hong Kong.

Survey and Analysis of Pamba River and its Pollution
39
The pollution status of Klein River, South Africa was monitored and all
indications are that the pollution identified is linked to sewerage systems which
originate from old and leaking and/or badly managed and constructed subterranean
tanks. The problem is aggravated by the biofilm formed that supports, harbors and
propagates the indicator organisms (Hamilton-Attwell, 2007). He also pointed out
that bacteria become resistant to disinfectants and become viable when residual
disinfectant levels drop. Unequal distribution of water on the surface of the earth and
fast declining activity of useable fresh water are the major concerns in terms of
water quality and quantity. The suspended and precipitated (non-floating) substances
and organic substances in waters are capable of adhering pollutant particles
(adsorption). The sediments, both suspended and precipitated substances stored on
the water bottom, form a reservoir for many pollutants and trace substances of low
solubility and low degree of degradability.
Nkwonta, and Ochieng (2009), assessed the role of human activities in
polluting the Soshanguve environs of South Africa and pointed out that fertilizer
runoff contributes 50% of the pollution while pesticides and sediments contribute up
to 10% respectively in the streams, while household waste contributes up to 30%.
Morrison et al., (2009) evaluated the impact of water scarcity and declining water
quality on business with far-reaching and crippling effects on economies all around
the globe. The drastic level of pollution in New Calabar River, Niger Delta, Nigeria
due to point and non-point sources was also well studied (Utang and Akpan, 2012).

Chapter 2
40
Water quality monitoring is an important practice in environmental studies.
The life in aquatic system is largely governed by physico-chemical characteristics
and their stability. Faecal contamination of water leads to higher bacteria load and
subsequent water-borne diseases. The selected indicator organisms like coliform
bacteria, after having routinely monitored, help to indicate the probability of
pathogenic population in water that make it unsuitable for human consumption
(Triebskorn et al., 2002, Sharma and Sarang., 2004, Cunliff and Nakagomi., 2005).
Ground water is water located beneath the ground surface in soil pore spaces and in
the fractures of lithologic formation. Water quality management is not simply be
elimination of wastes or technological removal of wastes, but economics and
prevailing political situation must be recognized as facts of life when dealing with
the problems of the pollution control (Thomann, 1974).
The pollution in Indian rivers has now reached to a point of crisis due to
rapid industrialization coupled with unplanned urbanization. The entire array of life
in water is affected due to pollution in water. The rapid decline in water quality is
devastating and several epidemiological and ecological perturbances are noted too
(Meitei et al., 2004). Studies depicting water pollution of rivers in India are
available like Godavari, Krishna and Tungbhdra (Mitra, 1982), Jhelum (Raina et al.,
1984), Kosi (Bhatt and Negi, 1985), Morar (Kalpi) (Mishra and Saksena 1991),
Betwa (Datar and Vashishtha, 1992), Cauvery (Batcha, 1997), Brahamani (Mitra,
1997), Ganga (Sahu et al., 2000; Rao et al., 2000), Godavari (Rafeeq and Khan,
2002), Pachin (Hussain and Ahmed, 2002), Tansa (Shaikh and Yeragi, 2004), Irai
(Sawane et al., 2004) and Yamuna (Anand et al., 2006). The water quality of River
Chambal was well investigated with transparency (12.12-110 cm), colour, turbidity
Survey and Analysis of Pamba River and its Pollution
41
(1-178 TNU), electrical conductivity 145.60-884:µS cm-1), total dissolved solids
(260-500 mgl-1), pH (7.60-9.33), dissolved oxygen (4.86-14.59 mgl-1), free carbon
dioxide (0-16.5 mgl-1), total alkalinity (70-290 mgl-1), total hardness (42-140 mgl-1),
chloride (15.62-80.94 mgl-1), nitrate (0.008-0.025 mgl-1), nitrite (0.002-0.022 mgl-1),
sulphate (3.50-45 mgl-1), phosphate (0.004-0.050 mgl-1), silicate (2.80-13.80 mgl-1),
biochemical oxygen demand (0.60-5.67 mgl-1), chemical oxygen demand (2.40-
26.80 mgl-1), ammonia (nil-0.56 mgl-1), sodium (14.30-54.40 mgl -1) and potassium
(2.10 mgl-1-6.30 mgl-1) (Saksena et al., 2008). The quality of water need to be
evaluated thoroughly to generate base line information for welfare of the society. It
becomes important to determine the quality of water so that the suitability of water
for drinking purpose, agriculture purpose and industrial purpose can be evaluated. A
study of river water quality Punnurpuzha was studied by (Abbasi, 1996).
Fresh water is one of the basic necessities for the sustenance of life. Rapid
population growth, urbanization and industrialization have led to a greater demand
of water from an increasingly smaller supply of water resources in the country
(Tyagi et al., 2002), Asadis et.al., 2007, Khandwala and Suthar. (2007), Shah et al.,
2008). Water is not only a vital environmental factor to all form of life, but has also
a great role to play in socio-economical development of human population. Huge
amount of money and efforts have been spent by the municipalities, industries and
government during the last four decades to enhance the quality of water for domestic
and industrial consumption and to reduce its pollution (Dwivedi and Pathak., 2007).
We must take proper measures for water resources management. Otherwise, we have
to face a national catastrophe in the future. The proper water policy is lacking and
there is uncontrolled development of water resources in India due to short term

Chapter 2
42
economic objectives and political expediency. (Borah et al., 2008). Due to
urbanization and human activities, the ground water sources are depleting in terms
of quantity and quality in Indian cities. It was reported that the water quality index
of drinking water in Ahamedabad city is unsafe. Demonstration of seasonal
variations of Physico – Chemical characteristics of River Soan water at Dhoak
Bridge Pakistan was done by Furhan et al., (2004). The physico chemical parameters
of the Andoni River system- Niger delta, Nigeria were conducted by Francis et al.
(2007). Seasonal changes in the physico chemical parameters and the nutrient load
of river sediments in the Ibadan city, Nigeria was clearly studied (Adeyemo et al.,
2008). Till the seventies environment was primly defined in terms of pollution and
its physical and biological effects. However, new perceptions and fresh insight
related to development and environment have broadened the context tremendously
to include a host of problems, not only the biophysical ones, but also the socio
cultural, economic political and administrative elements. The environmental and
development issues have been addressed in number of national and international
forum. While human interests cannot be ignored or downgraded in importance, it is
widely accepted that the long time interest on human beings themselves lie in
maintaining the environment in an overall healthy conditions.
The physico chemical characteristics of the coastal water of Devi estuary,
Orissa and it evaluation of seasonal changes was done using chemometric
techniques (Pradhan et al., 2009). The water quality analysis of Godavari river
carried out in one year from 2004 to 2005 with different sampling stations indicated
the high value of alaklnity, hardness, COD and chlorides. Correlation study on
physico-chemical parameters and assessment of quality river water in Uttarakhand
Survey and Analysis of Pamba River and its Pollution
43
indicated that all the parameters except turbidity and BOD recorded higher value,
(Narendra singh bhandari and Kapil Nayal., 2008). A study of physico-chemical
parameters of Krishna river water particularly in western Maharashtra showed that
the parameters like pH, TDS, BOD, DO were in permissible range of ICMR and
WHO (Prasad and Patil, 2008)). Physico-chemical properties of water samples from
Manipur river system, India showed that all the parameters were within the range of
WHO guidelines and was suitable for drinking purpose (Singh et al., 2010).
Analysis of various physico-chemical parameters of river Bhavani in three stations,
Tamilnadu, India and showed that they were facing severe anthropogenic activities
(Varunprasath and Nicholas A Daniel, 2010). The study on wetlands of Guwahati in
physico-chemical and biological parameters of city sewage revealed all parameters
as highly polluted (Kalita et al., 2010). A comparative study and analysis of water
sources from Dham river of Pawnar, Maharashtra, India evaluated that the
parameters were increasing very high and increasing and crossed the standared limit
(Tekade et al., 2010). The majority of Indian rivers have been studied extensively
for physic chemical aspects by several authors (Ray and David, 1966; Ajmal et al.,
1985). All these studies revealed that the indiscriminate discharge of effluents,
sewage, agricultural runoff, domestic wastes etc., in to the rivers deteriorated the
quality of the water thereby affecting biotic and abiotic components. The extreme
pollution in Bharalu river with very low level of dissolved oxygen, high load of
BOD,COD, phosphate and ammoniacal nitrogen which affect the quality of water
and jeopardizing the survival of aquatic life were observed by Das et al., (2003). The
water quality of analysis of Hathali stream to quantify the pollution status with

Chapter 2
44
respect to seasonal changes and found high in DO and BOD level during summer
season revealing high level of organic pollution.
Rekha et al. (2004) assessed the enviro-ecological status of Mandakini river
during religious festival to know whether the domestic waste from the pilgrim
settlements or the mass bathing degrade the quality of water and reported that the
bacteriological count was very high as was decreses as unfit for domestic purpose.
Investigations of water resources involving the quality, biotic and abiotic
aspects, along with anthropogenic factors have widely been carried out. The
Majority of Indian rivers have been studied extensively for physico-chemical aspects
by several authors (Ajmal et al., 1985., Shukla et al., 1989). Jameel and Hussian
(2003), investigated the seriousness of the discharge of untreated sewage in to the
Uyyakondan channel water, a tributary of river Cauvery by analyzing the Physico-
chemical and biological parameters and observed the sewage water not only
deteriorated the quality of channel water buy also is major source of pollution in the
river. Bhasker et al., (2003). Observed a remarkable sesasonal variation in the
waters of the river Torsa with high alkalinity and high load of faecal bacteria.
The situation in the state of Kerala is also not promising. Majority of the
rivers are polluted at an alarming level. Joy et al., (1990), studied the role of
industrial discharges and its effect on plankton distribution in River Periyar. Joseph
and Claramma (2010), studied the deteriorating water quality in river Pennar.
Chattopadhyay et al., (2010), reported the depleting quality of water in Chalakudy
River, Kerala. Karthick et al., (2010), evaluated the tap water from water supplies
from 14 districts of Kerala state, India and assessed parameters like pH, water
temperature, total dissolved solids, salinity, nitrates, chloride, hardness, magnesium,

Survey and Analysis of Pamba River and its Pollution
45
calcium, sodium, potassium, fluoride, sulphate, phosphates, and coliform bacteria.
The results showed that all water samples were contaminated by coliform bacteria.
About 20% of the tap water samples from Alappuzha and 15% samples from
Palakkad district were above desirable limits. Sujitha et al., (2011), observed the
dwindling quality of water in Karamana River. The environmental and public health
repercussions of depleting water quality in the state of Kerala was well reviewed.
Mini et al., (2003), conducted hydrological study on lotic ecosystem of
Vamanapuram river, Thiruvanamthapuram and found that alkalinity value exhibited
special and temporal variations. Surface water quality of Killi Ar, was studied and
reported by Sanker et al., (2006). Jayaraman et al., (2003), studied the water quality
of Karamana river, Kerala state and reported that spatial and temporal variation were
evident in the case of all parameters investigated. On analyzing the data of surface
and ground water of Parvathy puthanar the value of silicate in ground water were
found to be higher than that of surface water which could be attributed to the
dissolution of silicate present in the soil during seepage in to the wells. The water
quality monitoring done by the Kerala State Pollution Control Board (KSPCB;
2006) in the major water body revealed that the pollution load including pathogenic
organisms were in excess than the tolerable limits. The waters of six out of eight
major rivers were subjected to pollution due to the indiscriminate discharge of trade
effluents from industries, untreated sewage and soil waters from agricultural operations
and municipalities (Nair, 2002 and Harilal et al., 2004) investigated hydrogeochemistry
of two rivers of Kerala, Karamana and Neyyar with special reference to drinking water
quality. The various physico- chemical and bacteriological parameters of water
samples were compared with the prescribed standards and it was found that all the

Chapter 2
46
parameters except BOD and total coliform were within the limit, were as an increase
was noticed with the lower reaches of river which might be due to the anthropogenic
activities and input of waste into the river.
Pamba is one of the most important rivers in the South Western Hills of
Kerala. The famous shrine of Sabarimala is situated in the hills of Pamba plateau
which is one of the most popular pilgrim centres in South India and millions of
pilgrims visit the shrine. Lack of sanitary latrines, lack of facilities for sewage
collection and treatment accumulation of wastes discharged from hotels and
commercial establishments located at Sabarimala are the major sources for the
pollution of Pamba River (CPCB, 2000). The pollution is mainly due to human
excreta and biodegradable waste like used leaves, vegetable wastes, discarded
clothes, food wastes etc. Indiscriminate disposal of used plastic bottles forms the
major portion of the non-biodegradable waste. The gathering of very large crowds
over a short period of time every year in an ecologically sensitive area has given rise
to various environmental problems (Varghese et al., 2007).
The daily average sewage generated in Pamba town was seven mld and 3.5
mld of untreated sewage. This was being discharged into the Pamba River. The daily
average sewage generated in Sabarimala was 10 mld and the entire 10 mld of
untreated sewage was being discharged into the river (CAG, 2011). Even though the
water related problems, issues and threats in river Pamba are surplus, studies are
rather meager depicting the water quality scenario of the River. Koshy and Nair
(2000) reported that water quality at Pamba at Kozhencherry and found maximum
DO value in the Monsoon. The low atmospheric temperature and mixing of rain
water were the reason for high DO value during monsoon. Punnakkadu, (2003),

Survey and Analysis of Pamba River and its Pollution
47
reported that fertilizer and pesticide inflow from agricultural fields and plantations
situated in the upland catchment of Achencovil, Pamba, Manimala and Meenachil
Rivers were significant. Hospital wastes and sewage from all towns in the upstream
part flowed to these rivers. Apart from these 20,000 tons of fertilizer per year added
to the rice fields and 50 tons of pesticides contributed to the pollution load. The total
colifom number per 100 ml was reported to be from 40,000 to 46,000 MPN at
Pamba.The polluted Pamba river water has become host to many waterborne
diseases in the District of Pathanamthitta and Alappuzha. Rivers being polluted by
the discharge of wastes from toilets in the foothills of Sabarimala as well as the
towns of Ranny, Erumely, Kozhencherry and Chengannoor. Dumping of wastes
from slaughter houses and chicken corners in to the Pamba was another major issue.
The purity of water at Pamba is deteriorated day by day due to the heavy influx of
pilgrim tourism in every year. The dumping of huge quantity of water generated at
the oottupura of Sree Parthasarathy Temple at Aranmula on the bank of Pamba river
and the liquid waste flowing directly in to the river have been causing pollution of
the river. The pollution status of the river has gone up considerably with the
beginning of the festival season of vallasadya, ritualistic feast given to Oars men of
snake boats, at the Temple. The Pamba river system has assumed alarming
dimension and is very much essential for reviving the depleting fish stocks as well
as for improving the general water quality.
It has been reported that open defection, discharge of raw sewage, domestic
waste, commercial waste etc, during the sabarimala pilgrim season spread over 65
days turn the Pamba river highly polluted and the count of coliform bacteria was
found to reach a level of three lakhs per 100ml (Kerala State Pollution Control

Chapter 2
48
Board., 2006). Sukumaran Nair. (2009). points out the deteriorating effects of the
pollution in the river Pamba. The rich availability of organic nutrients, besides
nitrate, phosphate and sulphate from agriculre runoff, facilitate the abundant growth
of bacteria in the river which may exert stress on the biota in the downstream
stretches of Pamba. (Revivarma thampuran, 2004).
Thousands of chemicals have been identified in drinking water supplies
around the world and are considered potentially hazardous to human health at
relatively high concentrations (World Health Organisation, 2004). Heavy metals are
the most harmful of the chemical pollutants and are of particular concern due to their
toxicities to humans (Manahan, 2005). Metals and metalloids with atomic weights
ranging from 63 to 200.6 g/mol and densities greater than 4.5 g/cm3 are stable in
nature.There are 59 elements classified as heavy metals and out of these, five are
considered to be highly toxic and hazardous heavy metals (Lata and Rohindra,
2002). These are cadmium (Cd), chromium (Cr), copper (Cu), lead (Pb) and zinc
(Zn) which are released into the environment by human activities or through natural
constituents of the earth’s crust. Cadmium pollutants in water may occur from
industrial discharge and mining waste (Manahan, 2005). Cadmium contamination is
caused by its release in wastewaters and contamination from fertilizers and air
pollutants. Cadmium is more toxic than lead and chromium. Cadmium at extreme levels
causes itai-itai disease and at low levels over prolonged periods causes high blood
pressure, sterility among males, kidney damage and flu disorders (Baird, 1999). Hence,
cadmium removal in water using natural polyelectrolytes such as Moringa seeds would
be an advantage (Muyibi et. al., 2002 a). Chromium is widely distributed in the
earth’s crust and is used in metal plating (Crosby 2002). In general,

Survey and Analysis of Pamba River and its Pollution
49
food appears to be the major source of chromium intake and on the basis of guideline
value, there are no adequate toxicity studies available to provide long-term
carcinogenicity study (Sawyer et al., 2003). In epidemiological studies, an association
has been found between exposure to chromium (VI) by the inhalation route and lung
cancer (World Health Organisation, 2004). Copper is both an essential nutrient and a
drinking water contaminant (Sawyer, et. al., 2003). Recent studies have shown
effects of copper in drinking water on the gastrointestinal tract, but there is some
uncertainty regarding the long term effects of copper on sensitive populations such
as carriers of the gene for Wilson disease and other metabolic disorders of copper
homeostasis (Sawyer et. al., 2003). Lead in water arises from a number of industrial
and mining sources and is the most widely distributed of all toxic metals. Lead in
water causes serious problems such as anemia, kidney disease and affects the
nervous system (Crosby, 2002). Placental transfer of lead in humans affects babies
and young children absorb 4–5 times as much lead as adults. The lead toxicant
accumulates in the skeleton and causes adverse health effects and interferes with
calcium metabolism and with vitamin D metabolism (Baird, 1999). However,
evidence from studies in humans show adverse neurotoxic effects other than cancer
occurring at very low concentrations of lead. Therefore, there is need for the
removal of lead from all drinking water. Zinc is an essential trace element found in
virtually all food and potable water in the form of salts or organic complexes (World
Health Organization, 2004). Zinc is found in industrial waste and used in metal
plating. Therefore, sources of zinc in water are mainly from industrial discharge and
natural sources (Xue and Sigg, 1994). The removal of zinc is important for water

Chapter 2
50
treatment processes in producing good quality water (Fatoki and Ogunfowokan,
2002).
It is imperative that the water quality of Pamba River be improved in the
entire stretch, not only in the pilgrim area but also in the water logged areas of the
Kuttanad and Vembanad lakes. More over people in the townships and downstream
areas depend fully on river Pamba for all their water needs. Ironically, most of these
areas do not have drinking water treatment facilities. There are 18 drinking water
supply projects functioning in the river system and chlorination is the only means of
disinfecting water.
2.3 MATERIALS AND METHODS
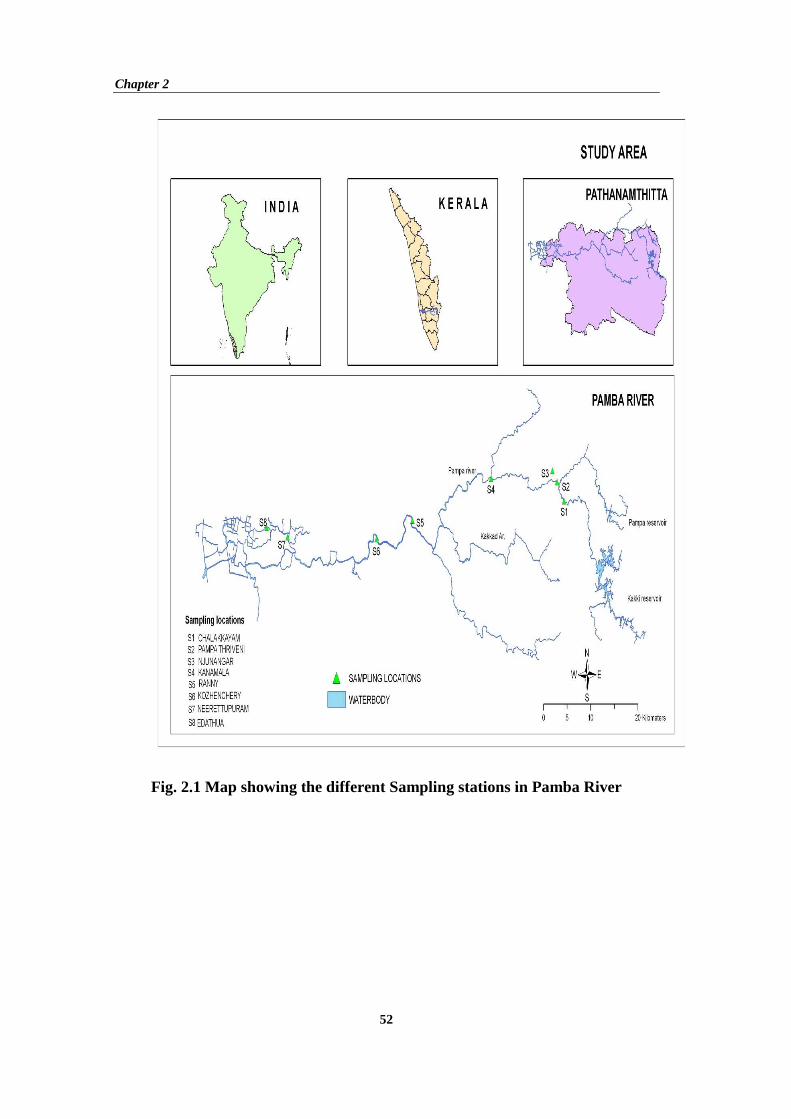
An extensive field work has been conducted in the upper, middle and
downstream of Pamba River and 8 sampling stations were selected from Pamba
Thriveni to Edathua, covering a distance of 102 km for a period of one year (January
2009 to December 2009). The entire period of study is divided in to three seasons
viz. pre monsoon, monsoon and post monsoon season. Water samples were collected
from eight sampling stations of the river representing various quarters. Samples
were collected in sterile bottles and immediately transported to the laboratory.
Samples for heavy metal determination were acidified in situ with 5ml HNO3. The
physical, chemical and biological parameters of samples were done by using
standard methods adopted by APHA (2005) and Trivedi and Goel (1986). Each
sample was analyzed in duplicate and the average of the results was taken for
analysis.

Survey and Analysis of Pamba River and its Pollution
51
2.3.1 SOURCE
Water samples were collected from eight sampling stations of the river
representing the various quarters. The sampling stations are Chalakkayam, Pamba
Thriveni, Njunangar, Kanamala, Ranny, Kozhenchery, Neerettupuram, and Edathua
respectively. For water collection and storage the containers used had been
previously washed and rinsed with 5% nitric acid and then thoroughly rinsed with
deionised water.
2.3.2 METHOD OF COLLECTION
The samples were preserved in a refrigerator at 40C pending analysis.
Samples for heavy metal determination were acidified in situ with 5ml HNO3. The
investigation period was divided in to 3 seasons i.e. Pre-pilgrimage (Monsoon, June-
Sep), Pilgrimage (Post Monsoon, Oct-Jan), Post-pilgrimage (Pre Monsoon, Feb-
May).The sampling started on 2009 January and continued up to December 2009.
Parameters like temperature, pH, were detected at sampling sites while other were
analyzed immediately after reaching in laboratory. The physical, chemical and
biological parameter of sample water analysis was done by using standard methods
adopted by APHA (2005), and Trivedi and Goel (1986).
The water sample of Pamba river, from its different region such as upstream,
middle stream and downstream were collected for water quality study from January
2009 to December 2009. Each sample was taken with an interval of 30 days. For the
collection of water sample, good quality polyethylene and glass bottle of various
sizes were used. During collection the bottle was kept under the surface of water, so
as to eliminate the impurities floating on the surface. Care was taken avoid bubbling
during sampling.
Chapter 2
52
Fig. 2.1 Map showing the different Sampling stations in Pamba River

Survey and Analysis of Pamba River and its Pollution
53
Table 2.2
Instruments /methods used for Estimation of Physico -Chemical Parameters
Sl No Physico-Chemical Parameter
Method Instrument/Model Sensitivity Reference
1 Temperature Digital Thermometer -- --
2 pH Electrometer method
Systronics pH system 335 0.01pH --
3 Turbidity Nephelometric Sytronic Digital Nephelometer ± 2% NTU --
4 Conductivity Conductivity meter Sytronic Conductivity Meter 306 ± 16% mS --
5 Total Solids Gravimetric method
-- -- APHA (2005)
6 Total Dissolved Solids
Gravimetric method
-- -- APHA (2005)
7 Total Alkalinity
Titrimetry -- -- APHA (2005)
8 Dissolved Oxygen
Winkler’s iodometric method
-- -- APHA (2005)
9 Biochemical Oxygen Demand
5 day BOD -- -- APHA (2005)
10 Chemical Oxygen Demand
Closed Reflex Calorimetric method
-- -- APHA (2005)
11 Total Hardiness
EDTA Titrimetric -- -- APHA (2005)
12 Sodium And Potassium
Flame photometer Eliko Flame Photometer 360
0.1 APHA (2005)
13 Calcium And Magnesium
EDTA Titrimetric Systronics UV/VIS Spectrophotometer 119
-- Trivedy and Goel 1984
14 Nitrate- Nitrogen
Calorimetric method
Systronics UV/VIS Spectrophotometer 119
± 0.052 AT 1.0 Abs
APHA (2005)
15 Total Phosphorus
Calorimetric method
Systronics UV/VIS Spectrophotometer 119
± 0.052 AT 1.0 Abs
APHA (2005)
16 Chloride Argentometric method
-- -- APHA (2005)
17 Sulphates Calorimetric method
Systronics UV/VIS Spectrophotometer 119
± 0.052 AT 1.0 Abs
APHA (2005)
18 Heavy Metals HDME Volumetric trace metal analyzer
0.01 APHA (2005)

Chapter 2
54
The following physical, chemical and biological parameters were analyzed.
2.3.3 TEMPERATURE
Temperature of water depends up on water depth besides solar radiation,
climate and topography. Temperature of the water was studied at the site itself.
Usually morning time was selected for temperature studies. Temperature from
different area in a region was taken and its average was tabulated.
2.3.4 pH
Is a logarithmic scale generally used to express the acidic, alkaline or neutral
nature of the solution. In fact, it representing the hydrogen ion concentration or more
precisely, the H+ ion activity, and alkalinity. The pH of any aqueous system is
suggestive of the acid base equilibrium achieved by various dissolved compounds.
pH of the water was determined at the site itself by using portable probe pH and pH
indicator solution, latterly in laboratory by using pH meter.
2.3.5 TOTAL SOLIDS (TS) AND TOTAL DISSOLVED SOLIDS (TDS)
Total solid content is estimated through evaporating the unfiltered samples
by heating at 100 ± 30C till completely evaporated. The residue left after
evaporation is the TS content in the water sample which is expressed in mg/L. Total
dissolved solids was also determined in the same manner after filtering the sample.
2.3.6 TURBIDITY
Turbidity indicates the light-transmitting capability of water and waste water
with respect to colloidal and suspended matter. It is a measure of the extent to which
light is either absorbed or scattered by suspended matter in water, but it is not a

Survey and Analysis of Pamba River and its Pollution
55
direct quantitative measurement of suspended solid. Turbidity was measured by
Nephelometric method
2.3.7 ALKALINITY
Alkalinity is defined as the capability of water and waste water to neutralize
H+ ions. In other words, it is the ability to water and waste water to accept protons or
neutralize acids. It is measured by titration with acid. The amount of a strong acid
needed to neutralize the alkalinity is called total alkalinity (T) and is expressed. In
mg/L. In the first step, water sample were treated against a strong acid using
phenolphthalein as an indicator at pH 8.3 (Phenolphthalein Alkalinity). In the second
step water samples were titrated against a strong acid using methyl orange as an
indicator. The value obtained is total alkalinity.
2.3.8 DISSOLVED OXYGEN (DO), BIOCHEMICAL OXYGEN DEMAND
(BOD) AND CHEMICAL OXYGEN DEMAND (COD)
Oxygen dissolved in water is referred as Dissolved Oxygen (DO). The DO
content in water is estimated titrimetrically following Winkler’s Method.
Biochemical Oxygen Demand (BOD) is used as an approximate measure of the
amount of biochemically degradable organic matter present in water. The 5-day
incubation method suggested by APHA (2005) was adopted to measure the BOD
content in water samples. Chemical Oxygen Demand (COD) is the measure of
oxygen required in oxidizing the organic compounds involving oxidizing agents
under acidic conditions. The COD estimation was done using closed reflux method
as suggested by APHA (2005).

Chapter 2
56
2.3.9 BIOCHEMICAL OXYGEN DEMAND (BOD)
The biochemical oxygen demand was estimated as per the official method in
APHA (2005).
1. The collected samples were diluted before incubation to bring the oxygen
demand and supply into an appropriate balance. One litre of distilled water was
mixed with nutrients. 1ml each of buffer, calcium chloride magnesium sulfate
and ferric chloride. It was aerated overnight and was used as the dilution water.
2. Samples were neutralized to pH 6.5-7.5 with 0.1 M H2SO4 or 0.1 M NaOH.
3. The DO of the sample was determined initially and after 5 days of incubation
in a BOD incubator at 200C.
4. A blank was also carried out simultaneously.
5. The BOD5 was then calculated by the following formula.
BOD5 at 200C in mg/l= (D0-D5)-(C0-C5) × dilution factor
Dilution factor = sample vol.of
1000
Where
D0 = DO content of the sample on the 1st day
D5 = DO content of the sample on the 5th day
C0 = DO content of the blank on the 1st day
C5 = DO content of the blank on the 5th day
Survey and Analysis of Pamba River and its Pollution
57
2.3.10 CHEMICAL OXYGEN DEMAND (COD)
Chemical Oxygen Demand was determined following the official method
mentioned in APHA (2005).
1. 10 ml of the sample was diluted to 500 ml using distilled water.
2. 50 ml of the diluted sample was taken in a round bottom flask (R. B. Flask)
for COD determination.
3. 1g HgSO4 was added to the above sample to overcome the difficulties caused
by chloride ions.
4. 5 ml of con. H2SO4 was added to dissolve the HgSO4.
5. 1 g AgSO4 was then added to the above mixture as a catalyst.
6. To the above solution 25 ml of 0.25 N potassium dichromate was added.
7. The RB flask was attached to the condenser and the water was allowed to
flow.
8. 70 ml of con. H2SO4 was added through the open end of the condenser and
swirling was continued while the acid was being added.
9. The contents in the flask were refluxed for 2h, cooled, washed into a 500 ml
beaker and was suitably diluted and made upto 140 ml.
10. 3-4 drops of ferroin indicator was added and the contents were titrated against
ferrous ammonium sulfate (0.25 N).

Chapter 2
58
11. The end point of the titration was the first sharp colour change from the blue-
green to reddish brown.
12. A blank was also run simultaneously in the same manner using distilled
water.
13. The COD then calculated using the formula.
COD mg/l= ( ) 4 2 4A - B ×normality of Fe(NH ) SO ×8×1000
volume of sample
Where A = volume of Fe (NH4)2 SO4 consumed for blank (ml)
B = volume of Fe (NH4)2 SO4 consumed for sample (ml)
2.3.11 HARDNESS, CALCIUM AND MAGNESIUM
Hardness of water is defined as the presence of significant concentration of
salts of metallic cations may be Ca2+ and Mg2+ ions dissolved in water. Under super
standard conditions, these cations react with anions to form insoluble solid
precipitate. Hardness is classified in to 2 types. Carbonate hardness and Non
carbonate hardness. Carbonate hardness is due to the presence of Calcium and
Magnesium carbonate and bicarbonate in water. It is expressed in terms of CaCo3
concentration in mg/L. This is also known as temporary hardness because it is
highly sensitive to heat and precipitates out readily on boiling. Non Carbonate
hardness, this type of hardness in water occurs due to dissolution of salts of Calcium
other than Carbonates and bicarbonates, such as Calcium Sulfates (CaSo4) or
Calcium Fluoride (CaF2). This hardness is referred as permanent hardness because it
cannot be removed by boiling.

Survey and Analysis of Pamba River and its Pollution
59
Hardness of water was determined by EDTA Titrimetric Method suggested
by APHA (2005). In this method Erichrome Black T is used as an indicator, which
gives a wine red color for samples containing calcium and magnesium ions at a pH
10.0±0.1. Then the sample is titrated against EDTA, till a blue colour developed at
the end point.
Calcium content in water is also determined by EDTA method. When EDTA
is added to water containing calcium and magnesium, it reacts with the calcium
before the magnesium. Calcium is determined in the presence of magnesium by
EDTA titration; using Muroxide indicator, which gives a colour change when all the
calcium has been completed by EDTA. The value of magnesium is obtained by
subtracting the value of calcium from the total hardness and then multiplying it with
0.244 as the method suggested by Trivedi and Goel (1986).
2.3.12 NITRATE
The nitrate was determined by Brucine method. The nitrate and brucine react
to produce a yellow colour and the intensity of the colour was measured at 410 nm
using double beam spectrophotometer (Model, 2203, Systronics, India)
2.3.13 TOTAL PHOSPHOROUS
The H2SO4-K2SO4 digestion is adopted in the present study for the Total
Phosphorus Analysis. The phosphates released during digestion were mixed with
ammonium molybdate and stannous chloride solution and determined its
concentration calorimetrically at 690 nm.

Chapter 2
60
2.3.14 SULPHATES AND CHLORIDES
Sulphates in water samples were measured using turbidmetric method
suggested by APHA (2005). Sulphate ion (SO42-) is precipitated in an acetic acid
medium with barium chloride (BaCl2) so as to form barium sulphate (BaSO4). Light
absorbance of the BaSO4 suspension is measured by photometrically. Chloride in
water samples were measured by argentometric method suggested by APHA (2005).
Water samples were titrated against silver nitrate, using potassium dichromate as an
indicator. Silver chloride is quantitatively precipitated before red silver chromate is
formed.
2.3.15 SODIUM AND POTASSIUM
Flame photometric method suggested by APHA (2005) was adopted for the
estimation of Sodium and Potassium. A characteristic light is produced due to
excitation of electrons when the sample is sprayed into a flame. The intensity of
light is measured by a phototube potentiometer.
2.3.16 TOTAL COLIFORMS AND FAECAL COLIFORMS
Total coliforms and faecal coliforms in water samples were determined by
multiple tube fermentation technique (Eijkman Test). The bacteriological count
expressed in Most Probable Number per ml (MPN/ml).
2.3.17 CONDUCTIVITY
Conductivity is the measure of the ability of an aquous solution to carry an
electric current it was measured with the help of a conductivity measure having a
conductance cell containing electrodes of platinum coated with Pt balck or carbon.
The unit of conductivity measurement is µ/m Siemens(s)/cm. The conductivity of

Survey and Analysis of Pamba River and its Pollution
61
most water is generally low and hence the unit µmhos/cm is commonly used. It was
measured by conductivity meter, Sytronic 306, India
2.3.18 HEAVY METALS (Iron, Cadmium, Copper, Lead, Zinc & Manganese)
The heavy metals presence were determined by HDME method by using
volumetric trace metal analyzer (Metrohm 797) computerized and the unit is mg/l.
2.4 RESULTS
Rivers are the lifelines of development and are considered as cradle of
civilizations. However, deluge of industrial and domestic discharges deteriorates
water with profound repercussions in both the environment and also for human
beings.The past few decades have witnessed many ecological, cultural and
demographic changes including transition from pilgrimage to tourism pilgrimage. In
India, pilgrimage activities are unavoidable part of the culture and many rituals are
noticed with several regional and local disparities. The steady hike in the pilgrimage
tourism resulted in the emergence of several ecological problems adjoining every
pilgrim centres.
Sabarimala shrine, the most famous Sasta temple in Kerala, is deep inside the
dense forest, surrounded by splendid evergreen forests and the shrine is accessed by
a foot path started from the banks of river Pamba. Sabarimala is considered as one of
the most popular deities in Kerala and in South India as a whole. Yearly between 6
and 10 million pilgrims from the southern states of Kerala, Tamil Nadu, Karnataka,
and Andra Pradesh visit Sabarimala (Osello and Osello, 2003) during festival season
alone. Open defecation and flushing out of human excreta and other wastes to the
holy river, are a regular process, during the festival season.

Chapter 2
62
The detailed analysis of the river water sample in various seasons
specifically in Pre Monsoon, Monsoon and Post Monsoon season is absolutely
necessary to assess the average pollution load of Pamba river water. The detailed
analysis of various factors such as temperature, pH, Conductivity, alkalinity, COD,
BOD, Hardness, Manganese, Magnesium, Nitrate, Iron, Zinc Total colioform, Fecal
coliform, Total solids, suspended solids, calcium, nitrate, phosphorous etc was done
in the above three seasons

Survey and Analysis of Pamba River and its Pollution
63
Table 2.3 Distribution of Temperature in the water sample of Pamba River (0C)
Stations
Pre Monsoon Season Monsoon Season Post Monsoon Season F
eb'0
9
Mar
'09
Apr
il'09
May
'09
Ave
rage
June
'09
July
'09
Aug
'09
Sep
'09
Ave
rage
Oct
'09
Nov
'09
Dec
'09
Jan'
09
Ave
rage
S1 31 30 29 30 30 26 26 26 27 26.25 28 27 23 24 25.5
S2 31 30 29 30 30 26 26 26 27 26.25 28 26 23 24 25.25
S3 32 30 28 31 30.25 25 27 26 26 26 27 26 23 25 25.25
S4 31 29 29 30 29.75 26 26 24 27 25.75 27 24 23 24 24.5
S5 28 29 30 29 29 24 26 24 29 25.75 28 25 24 22 24.75
S6 29 29 30 29 29.25 24 28 25 28 26.25 28 25 23 22 24.5
S7 30 30 31 30 30.25 26 29 27 29 27.75 30 26 25 25 26.5
S8 30 30 31 31 30.5 26 30 28 29 28.25 29 25 25 25 26
0
5
10
15
20
25
30
35
Te
mp
era
ture
(0C
)
S1 S2 S3 S4 S5 S6 S7 S8
Number of Samples
Pre Monsoon Season
Monsoon Season
Post Monsoon Season
`
Fig. 2.2 Distribution of Temperature in water sample of Pamba River (0C)

Chapter 2
64
Table 2.4 Distribution of pH in the water sample of Pamba River
Stations
Pre Monsoon Season Monsoon Season Post Monsoon Season F
eb'0
9
Mar
'09
Apr
il'09
May
'09
Ave
rage
June
'09
July
'09
Aug
'09
Sep
'09
Ave
rage
Oct
'09
Nov
'09
Dec
'09
Jan'
09
Ave
rage
S1 6.64 6.94 6.95 6.94 6.86 7.06 6.86 6.9 6.72 6.88 6.07 6.33 6.91 6.87 6.54
S2 6.51 6.92 6.92 6.91 6.81 7.06 6.71 6.9 6.75 6.85 6.08 6.32 6.96 6.83 6.55
S3 6.53 6.56 6.83 6.91 6.7 7.01 6.54 6.9 6.73 6.79 6.93 6.31 6.94 6.61 6.7
S4 6.72 6.72 6.95 6.98 6.84 7.03 6.96 6.85 6.78 6.91 6.75 6.86 6.95 6.82 6.84
S5 6.69 6.91 6.98 6.85 6.85 7.01 6.91 6.93 6.54 6.85 6.73 6.75 6.73 6.51 6.68
S6 6.64 6.83 6.96 7.42 6.96 7.02 6.83 6.65 6.28 6.69 6.91 6.16 6.69 6.52 6.57
S7 6.69 7.12 7.13 7.51 7.11 6.98 6.98 6.83 6.68 6.87 6.82 6.63 6.83 6.73 6.75
S8 6.52 7.3 7.55 7.86 7.3 6.97 6.79 6.92 6.91 6.9 6.79 6.87 6.87 6.86 6.85
6
6.2
6.4
6.6
6.8
7
7.2
7.4
pH
S1 S2 S3 S4 S5 S6 S7 S8
Number of Samples
Pre Monsoon Season
Monsoon Season
Post Monsoon Season
Fig. 2.3 Distribution of pH in the water sample of Pamba River

Survey and Analysis of Pamba River and its Pollution
65
Table 2.5 Distribution of Conductivity in the water sample of Pamba River (mhos/cm)
Stations
Pre Monsoon Season Monsoon Season Post Monsoon Season F
eb'0
9
Mar
'09
Apr
il'09
May
'09
Ave
rage
June
'09
July
'09
Aug
'09
Sep
'09
Ave
rage
Oct
'09
Nov
'09
Dec
'09
Jan'
09
Ave
rage
S1 56 53 49 46 51 41 43 43 40 41.75 37 54 52 48 47.75
S2 55 52 62 61 57.5 44 42 41 39 41.5 43 57 69 62 57.75
S3 70 64 62 62 64.5 46 43 38 41 42 43 121 161 158 120.75
S4 54 57 61 60 58 42 42 38 34 39 37 103 118 121 94.75
S5 40 42 39 46 41.75 30 31 34 36 32.75 35 40 42 39 39
S6 39 41 39 45 41 30 31 34 36 32.75 34 40 42 39 38.75
S7 41 43 40 46 42.5 31 32 34 35 33 34 40 41 39 38.5
S8 40 43 40 46 42.25 32 31 33 35 32.75 35 41 41 40 39.25
0
20
40
60
80
100
120
140
Co
nd
uct
ivit
y (
mh
os/
cm)
S1 S2 S3 S4 S5 S6 S7 S8
Number of Samples
Pre Monsoon Season
Monsoon Season
Post Monsoon Season
Fig. 2.4 Distribution of Conductivity in the water sample of Pamba River (mhos/cm)

Chapter 2
66
The seasonal variations of the physico-chemical and biological parameters of
Pamba river water are given in Table 2.3 to Table 2.29 and Fig.2.2 to Fig. 2.28 It is
clear that there is not much seasonal variation in temperature and pH of Pamba river
water. Water temperature is crucial factor which influences the chemical,
biochemical and biological characteristics of a water body (Manjare et al., 2010). pH
values are more or less acidic throughout the study. pH is an important parameter
which is important in evaluating the acid-base balance of water. The electrical
conductivity of Pamba water showed high fluctuations after the pilgrimage season.
Electrical conductivity measurement is an excellent indicator of TDS that affects the
taste of potable water (Unnisa and Khalilullah, 2004).

Survey and Analysis of Pamba River and its Pollution
67
Table 2.6 Distribution of Turbidity in the water sample of Pamba River (NTU)
Stations
Pre Monsoon Season Monsoon Season Post Monsoon Season
Feb
'09
Mar
'09
Apr
il'09
May
'09
Ave
rage
June
'09
July
'09
Aug
'09
Sep
'09
Ave
rage
Oct
'09
Nov
'09
Dec
'09
Jan'
09
Ave
rage
S1 2.3 1.5 2.1 3.2 2.27 8.4 9.1 8.2 2.8 7.12 3.6 4.5 2.8 1.8 3.17
S2 2.6 1.7 2.2 2.9 2.35 9.2 9.7 6.1 2.7 6.92 3.7 5.1 4.1 4.2 4.27
S3 19 19.3 4.4 2.5 11.3 10.1 9.4 5.9 3.1 7.12 3.5 6.4 18 21 12.22
S4 4.6 2.1 3.2 2.8 3.17 9.7 10.3 6.1 2.9 7.25 3.3 6.8 13 17 10.02
S5 2.2 3.2 3.1 2.2 2.67 9.4 9.7 6.2 3.4 7.17 2.1 2.4 3.7 1.9 2.52
S6 2.3 2.3 2.9 2.5 2.5 8.9 9.5 8.4 3.1 7.47 2.5 2.4 3.1 2.7 2.67
S7 2.1 2.2 2.8 2.7 2.45 8.7 9.7 5.8 2.6 6.7 2.2 3.2 2.9 2.4 2.67
S8 1.9 2.2 2.6 2.5 2.3 8.4 9.6 5.9 2.9 6.7 2.3 3.1 3.1 2.3 2.7
0
2
4
6
8
10
12
14
Tu
rbid
ity
(mh
os/
cm)
S1 S2 S3 S4 S5 S6 S7 S8
Number of Samples
Pre Monsoon Season
Monsoon Season
Post Monsoon Season
Fig. 2.5 Distribution of Turbidity in the water sample of Pamba River (NTU)

Chapter 2
68
A notable increase in turbidity, total solids and dissolved solids during
pilgrimage season was observed. Turbidity is considered as an integral factor which
influences light penetration. The relation between turbidity increase and pathogen
abundance was established earlier (Gupta et al., 2003). Total solids analysis has
great implications in biological and physical waste water treatment processes and the
available reports are also at par with the present results (Bahadur and Chandra,
1996).

Survey and Analysis of Pamba River and its Pollution
69
Table 2.7 Distribution of Total Solids in the water sample of Pamba River
(mg/L)
Stations
Pre Monsoon Season Monsoon Season Post Monsoon Season F
eb'0
9
Mar
'09
Apr
il'09
May
'09
Ave
rage
June
'09
July
'09
Aug
'09
Sep
'09
Ave
rage
Oct
'09
Nov
'09
Dec
'09
Jan'
09
Ave
rage
S1 45.86 55.23 52.61 57.52 52.81 57.31 60.06 53.17 57.43 56.99 53.94 48.72 51.33 55.81 52.45
S2 47.38 53.96 54.17 57.12 53.16 56.5 59.01 49.12 47.52 53.04 52.74 78.53 89.74 80.38 75.35
S3 77.21 63.69 57.48 54.35 63.18 55.69 58.27 48.72 52.41 53.77 53.81 132.05138.65 132.73 114.31
S4 54.97 60.4 56.98 58.74 57.77 54.11 56.01 49.14 44.25 50.88 43.64 95.64 125.71 121.11 96.525
S5 42.21 44.95 47.38 53.35 46.97 55.85 50.07 50.59 42.73 49.81 47.25 46.65 45.45 43.37 45.68
S6 41.53 42.81 47.16 52.81 46.08 54.64 51.16 51.39 41.61 49.7 45.18 45.44 44.19 42.16 44.24
S7 40.81 43.53 47.86 53.16. 44.07 55.22 50.34 50.89 40.65 49.27 43.81 43.56 44.12 40.85 43.08
S8 40.65 42.16 47.53 52.18 45.63 54.85 48.85 50.13 39.64 48.37 42.16 43.15 43.81 39.54 42.16
0
20
40
60
80
100
120
To
tal
soli
ds
(m
ho
s/cm
)
S1 S2 S3 S4 S5 S6 S7 S8
Number of Samples
Pre Monsoon Season
Monsoon Season
Post Monsoon Season
Fig. 2.6. Distribution of Total solids in the water sample of Pamba River (mg/l)

Chapter 2
70
Table 2.8 Distribution of Dissolved Solids in the water sample of Pamba River (mg/L)
Stations
Pre Monsoon Season Monsoon Season Post Monsoon Season
Feb
'09
Mar
'09
Apr
il'09
May
'09
Ave
rage
June
'09
July
'09
Aug
'09
Sep
'09
Ave
rage
Oct
'09
Nov
'09
Dec
'09
Jan'
09
Ave
rage
S1 31.01 43.78 40.89 41.32 39.25 39.92 34.78 32.07 32.31 34.77 33.12 34.45 40.07 42.48 37.53
S2 32.18 41.36 42.28 42.82 39.66 37.87 36.94 31.24 32.71 34.69 36.26 35.03 52.32 64.31 46.98
S3 52.94 47.53 45.02 42.27 46.94 38.41 36.33 32.67 33.42 35.21 35.76 89.42 95.81 91.96 78.23
S4 37.72 43.98 43.21 43.28 42.07 35.37 34.39 31.68 32.71 33.53 32.64 64.81 90.09 88.29 68.95
S5 31.42 33.74 36.24 41.26 35.66 34.71 31.05 31.21 30.48 31.86 35.71 34.91 34.85 31.27 34.18
S6 30.84 33.25 35.85 40.68 35.15 33.95 30.84 30.75 30.12 31.41 39.95 34.58 34.15 31.26 34.98
S7 30.52 33.81 26.42 41.53 33.07 33.18 30.54 30.61 30.24 31.14 35.15 34.25 34.26 30.86 33.63
S8 30.68 33.71 26.15 41.64 33.04 33.24 31.81 31.54 31.75 32.08 33.12 33.68 34.33 31.15 33.07
0
10
20
30
40
50
60
70
80
Dis
solv
ed
so
lid
s (
NT
U)
S1 S2 S3 S4 S5 S6 S7 S8
Number of Samples
Pre Monsoon Season
Monsoon Season
Post Monsoon Season
Fig. 2.7 Distribution of Dissolved solids in the water sample of Pamba River (mg/l)

Survey and Analysis of Pamba River and its Pollution
71
Table 2.9 Distribution of Dissolved Oxygen in the water sample of Pamba River (mg/l)
Stations
Pre Monsoon Season Monsoon Season Post Monsoon Season F
eb'0
9
Mar
'09
Apr
il'09
May
'09
Ave
rage
June
'09
July
'09
Aug
'09
Sep
'09
Ave
rage
Oct
'09
Nov
'09
Dec
'09
Jan'
09
Ave
rage
S1 5.1 5.4 6.7 7.1 6.07 8.6 7.4 6.2 5.1 6.82 6.7 6.4 4.9 4.21 5.55
S2 5.9 5.98 7.2 7.21 6.57 7.5 8.14 7.71 6.56 7.48 6.73 4.5 5.12 4.8 5.29
S3 2.28 3.15 3.85 5.75 3.75 6.02 7.3 6.18 6.45 6.49 5.45 1.25 0.68 0.63 2.01
S4 4.85 4.96 6.85 6.21 5.72 6.58 7.75 7.45 7.15 7.23 6.65 2.58 1.75 2.43 3.35
S5 7.1 6.9 7.1 7.2 7.07 7.1 7.35 7.55 6.65 7.16 7.3 6.9 6.7 6.4 6.82
S6 6.75 6.95 6.92 7.1 6.93 7.55 7.25 7.33 7.15 7.32 7.48 7.1 7.2 6.85 7.16
S7 7.15 7.23 7.13 6.95 7.11 6.98 7.15 7.28 7.12 7.13 7.25 7.05 7.14 6.53 6.99
S8 7.1 6.81 6.92 6.64 6.87 6.58 6.95 7.15 7.15 6.96 7.18 6.95 6.89 6.64 6.91
0
1
2
3
4
5
6
7
8
Dis
solv
ed
Ox
yg
en
(m
g/
l)
S1 S2 S3 S4 S5 S6 S7 S8
Number of Samples
Pre Monsoon Season
Monsoon Season
Post Monsoon Season
Fig. 2.8 Distribution of Dissolved Oxygen in the water sample of Pamba River (mg/l)

Chapter 2
72
A substantial increase in dissolved oxygen in monsoon and decreased during
post and pre monsoon seasons. Dissolved oxygen determines whether the biological
changes are brought about by aerobic or anaerobic organism and reflects the
physical and biological processes prevailing in the water. The BOD analysis
revealed that the obtained values are well above the permissible limits. BOD is
usually defined as the amount of oxygen required by bacteria in stabilizing the
decomposable organic matter which gives a clear picture about the extent of
pollution. Increased BOD disrupts ecological balance with several implications
which are long lasting. COD is a measure of oxygen equivalent to the requirement of
oxidizing organic matter contents by a strong chemical agent which is helpful in
detecting toxic conditions and the presence of biologically resistant organic
substances. The maximum COD was recorded is 30.42 during pilgrimage season,
20.6 with post pilgrimage and 7.45 during pre pilgrimage season. The high values of
COD are due to high level of pollutants present in the river water samples.

Survey and Analysis of Pamba River and its Pollution
73
Table 2.10 Distribution of Biochemical Oxygen Demand in the water sample of
Pamba River (mg/l)
Stations
Pre Monsoon Season Monsoon Season Post Monsoon Season F
eb'0
9
Mar
'09
Apr
il'09
May
'09
Ave
rage
June
'09
July
'09
Aug
'09
Sep
'09
Ave
rage
Oct
'09
Nov
'09
Dec
'09
Jan'
09
Ave
rage
S1 3.65 3.3 2.65 2.21 2.95 0.98 0.83 0.64 2.32 1.09 1.24 5.81 5.8 6.84 4.92
S2 1.35 1.95 2.15 1.85 1.82 0.74 0.98 1.85 1.5 1.27 2.24 8.95 12.9 12.55 9.16
S3 10.65 8.68 10.76 6.68 9.19 3.45 2.25 1.09 1.54 2.08 1.85 22.9 34.12 31.83 22.67
S4 12.61 8.14 5.65 8.64 8.76 1.69 2.21 1.48 1.95 1.83 2.2 2.54 12.85 28.32 11.48
S5 2.8 3.75 2.85 1.8 2.8 0.08 0.95 1.13 1.81 0.99 1.95 2.45 4.62 3.85 3.22
S6 2.71 3.64 2.9 0.98 2.56 0.75 1.25 1.04 1.42 1.11 1.65 2.8 3.92 3.91 3.07
S7 3.05 8.82 3.1 1.85 4.2 1.62 1.95 1.82 1.91 1.82 1.84 3.1 3.85 4.15 3.23
S8 2.95 3.12 3.4 2.25 2.93 1.8 2.21 2.2 2.81 2.25 2.65 2.98 3.15 3.8 3.14
0
5
10
15
20
25
Bio
che
mic
al
Ox
yg
en
(m
g\l
)
S1 S2 S3 S4 S5 S6 S7 S8
Number of Samples
Pre Monsoon Season
Monsoon Season
Post Monsoon Season
Fig. 2.9 Distribution of Biochemical Oxygen Demand in the water sample of Pamba River (mg/l)

Chapter 2
74
Table 2.11 Distribution of Chemical Oxygen Demand in the water sample of Pamba River (mg/l)
Stations
Pre Monsoon Season Monsoon Season Post Monsoon Season
Feb
'09
Mar
'09
Apr
il'09
May
'09
Ave
rage
June
'09
July
'09
Aug
'09
Sep
'09
Ave
rage
Oct
'09
Nov
'09
Dec
'09
Jan'
09
Ave
rage
S1 9.82 9.67 9.28 7.65 9.1 8.32 4.4 4.98 5.25 5.74 3.75 12.55 18.71 19.32 13.58
S2 9.92 9.76 9.82 6.72 9.05 4.82 4.21 5.56 6.38 5.24 7.65 35.73 38.84 40.43 30.66
S3 33.67 39.47 28.56 19.42 30.28 12.81 8.63 8.95 8.52 9.73 6.95 48.83 140.5 138.28 83.64
S4 31.68 30.86 28.62 24.11 28.82 10.86 7.62 6.51 6.78 7.94 13.12 39.84 121.81123.76 74.63
S5 13.24 14.56 9.85 8.71 11.59 6.21 8.75 8.26 11.84 8.76 12.28 10.64 12.08 14.71 12.43
S6 11.53 16.52 8.35 6.58 10.74 6.18 6.83 9.15 10.65 8.2 11.64 10.52 11.81 13.57 11.88
S7 10.51 14.1 6.36 5.8 9.19 5.14 5.75 8.3 10.18 7.34 9.45 8.36 7.55 10.58 8.98
S8 9.42 11.53 5.46 5.71 8.03 4.96 4.64 5.92 11.08 6.65 8.15 6.94 5.64 9.73 7.61
0
10
20
30
40
50
60
70
80
90
Ch
em
ica
l O
xy
ge
n
(mg
\l)
S1 S2 S3 S4 S5 S6 S7 S8
Number of Samples
Pre Monsoon Season
Monsoon Season
Post Monsoon Season
Fig. 2.10 Distribution of Chemical Oxygen Demand in the water sample of Pamba River (mg/l)

Survey and Analysis of Pamba River and its Pollution
75
Table 2.12 Distribution of Hardness in the water sample of Pamba River (mg/l)
Stations
Pre Monsoon Season Monsoon Season Post Monsoon Season F
eb'0
9
Mar
'09
Apr
il'09
May
'09
Ave
rage
June
'09
July
'09
Aug
'09
Sep
'09
Ave
rage
Oct
'09
Nov
'09
Dec
'09
Jan'
09
Ave
rage
S1 15 19 17 14 16.25 13 9 12 10 11 10 14 19 34 19.25
S2 16 18 19 16 17.25 15 13 11 9 12 12 33 28 29 25.5
S3 23 24 23 19 22.25 14 11 9 12 11.5 14 48 59 49 42.5
S4 23 28 21 16 22 15 10 12 13 12.5 15 58 62 56 47.75
S5 15 14 13 15 14.25 10 10 11 13 11 13 13 15 16 14.25
S6 14 14 12 14 13.5 1 9 9 11 7.5 12 12 13 15 13
S7 11 12 10 11 11 9 9 9 10 9.25 11 10 11 12 11
S8 10 11 10 10 10.25 10 9 10 11 10 9 11 9 10 9.75
0
5
10
15
20
25
30
35
40
45
50
Ha
rdn
ess
(m
g/
l)
S1 S2 S3 S4 S5 S6 S7 S8
Number of Samples
Pre Monsoon Season
Monsoon Season
Post Monsoon Season
Fig. 2.11 Distribution of Hardness in the water sample of Pamba River (mg/l)

Chapter 2
76
Table 2.13 Distribution of Alkalinity in the water sample of Pamba River (mg/l)
Stations
Pre Monsoon Season Monsoon Season Post Monsoon Season
Feb
'09
Mar
'09
Apr
il'09
May
'09
Ave
rage
June
'09
July
'09
Aug
'09
Sep
'09
Ave
rage
Oct
'09
Nov
'09
Dec
'09
Jan'
09
Ave
rage
S1 12.54 19.41 24 16.53 18.12 12.94 14.1 15.38 13.7 14.03 20.65 46.8 14.56 49.88 32.97
S2 23 19.54 21.58 19.42 20.88 14.15 11 14.21 13.15 13.13 12.1 56.2 58 56.54 45.71
S3 53.5 48.4 35.3 39 44.05 17.51 13 17.8 15.1 15.82 13 67.51 94 99 68.38
S4 45 38 29 28.21 35.05 13 14 11 13 12.75 12 55 82 78 56.75
S5 14.12 14.94 15 18.7 15.69 9.88 11.61 13.25 13.12 11.96 12.75 13.11 16.28 18.51 15.16
S6 14.64 13.84 14.21 18.24 15.23 9.56 10.42 13.1 13 11.52 12.85 14.16 15.33 19.51 15.46
S7 15.26 15.84 19.43 22.51 18.26 10.64 11.52 16.25 14.81 13.3 13.56 19.42 18.31 21.53 18.2
S8 16.28 16.53 20.83 22.84 19.12 11.21 12.62 19.42 15.55 14.7 14.21 20.55 19.65 21.84 19.06
0
10
20
30
40
50
60
70
Alk
ali
nit
y (
mg
/l)
S1 S2 S3 S4 S5 S6 S7 S8
Number of Samples
Pre Monsoon Season
Monsoon Season
Post Monsoon Season
Fig. 2.12 Distribution of Alkalinity in the water sample of Pamba River (mg/l)
Survey and Analysis of Pamba River and its Pollution
77
In the present investigation, hardness also showed similar pattern. Hardness
of the river water is significant in connection with the discharge of the sewage and
effluents and it has no known health effects. A similar trend was also observed with
alkalinity also. The quantitative capacity of a water sample to neutralize a strong
acid to a designated pH is considered as alkalinity. The obtained values can be
attributed to sewage and effluent inputs during pilgrimage which disrupt quality of
the entire stretch of river Pamba.

Chapter 2
78
Table 2.14 Distribution of Magnisium in the water sample of Pamba River (mg/l)
Stations
Pre Monsoon Season Monsoon Season Post Monsoon Season
Feb
'09
Mar
'09
Apr
il'09
May
'09
Ave
rage
June
'09
July
'09
Aug
'09
Sep
'09
Ave
rage
Oct
'09
Nov
'09
Dec
'09
Jan'
09
Ave
rage
S1 3.18 3.61 3.86 2.89 3.38 2.22 1.86 1.58 2.11 1.94 1.07 2.34 3.92 4.85 3.04
S2 2.21 3.12 3.54 1.56 2.61 1.75 0.95 1.65 1.89 1.56 1.81 1.36 3.98 4.81 2.99
S3 2.08 3.15 3.42 2.14 2.70 2.15 1.84 1.92 1.67 1.89 1.93 3.34 4.94 4.61 3.71
S4 3.52 4.22 4.02 1.87 3.41 2.56 1.92 1.43 2.08 1.99 1.76 5.80 6.96 6.72 5.31
S5 4.69 3.86 3.52 2.25 3.58 1.89 1.86 1.23 1.86 1.71 1.78 6.47 5.71 3.54 4.37
S6 2.64 2.91 3.31 3.16 2.18 1.97 1.54 1.12 1.42 1.51 1.94 2.16 3.46 2.52 2.52
S7 4.79 3.86 4.12 3.58 4.09 2.03 1.21 2.42 0.98 1.66 1.86 2.63 3.87 2.73 2.77
S8 4.51 3.95 4.41 3.86 4.18 2.12 1.35 1.98 1.13 1.64 1.75 2.87 3.53 2.86 2.75
0
1
2
3
4
5
6
Ma
gn
esi
um
(m
g/l
)
S1 S2 S3 S4 S5 S6 S7 S8
Number of Samples
Pre Monsoon Season
Monsoon Season
Post Monsoon Season
Fig. 2.13 Distribution of Magnesium in the water sample of Pamba River (mg/l)

Survey and Analysis of Pamba River and its Pollution
79
The magnesium content was less during monsoon ,was more during the pre
monsoon season and the amount was high during post monsoon season.But there
was no significant change in calcium, copper and phosphorous content during the
seasonal variations. However tne content of nitrates, sulphates, chlorides, sodium,
pottassium, iron, cadmium. Lead, Zinc, Manganese followed the same trend of
magnesium.

Chapter 2
80
Table 2.15 Distribution of Calcium in the water sample of Pamba River (mg/l)
Stations
Pre Monsoon Season Monsoon Season Post Monsoon Season F
eb'0
9
Mar
'09
Apr
il'09
May
'09
Ave
rage
June
'09
July
'09
Aug
'09
Sep
'09
Ave
rage
Oct
'09
Nov
'09
Dec
'09
Jan'
09
Ave
rage
S1 6.64 6.94 6.95 6.94 6.87 7.06 6.86 6.9 6.72 6.88 6.07 6.33 6.91 6.87 6.54
S2 6.51 6.92 6.92 6.91 6.81 7.06 6.71 6.9 6.75 6.85 6.08 6.32 6.96 6.83 6.55
S3 6.53 6.56 6.83 6.91 6.71 7.01 6.54 6.9 6.73 6.79 6.93 6.31 6.94 6.61 6.7
S4 6.72 6.72 6.95 6.98 6.84 7.03 6.96 6.85 6.78 6.9 6.75 6.86 6.95 6.82 6.84
S5 6.69 6.91 6.98 6.85 6.86 7.01 6.91 6.93 6.54 6.85 6.73 6.75 6.73 6.51 6.68
S6 6.64 6.83 6.96 7.42 6.96 7.02 6.83 6.65 6.28 6.69 6.91 6.16 6.69 6.52 6.57
S7 6.69 7.12 7.13 7.51 7.11 6.98 6.98 6.83 6.68 6.87 6.82 6.63 6.83 6.73 6.75
S8 6.52 7.3 7.55 7.86 7.31 6.97 6.79 6.92 6.91 6.9 6.79 6.87 6.87 6.86 6.85
6
6.2
6.4
6.6
6.8
7
7.2
7.4
Ca
lciu
m (
mg
/l)
S1 S2 S3 S4 S5 S6 S7 S8
Number of Samples
Pre Monsoon Season
Monsoon Season
Post Monsoon Season
Fig. 2.14 Distribution of Calcium in the water sample of Pamba River (mg/l)
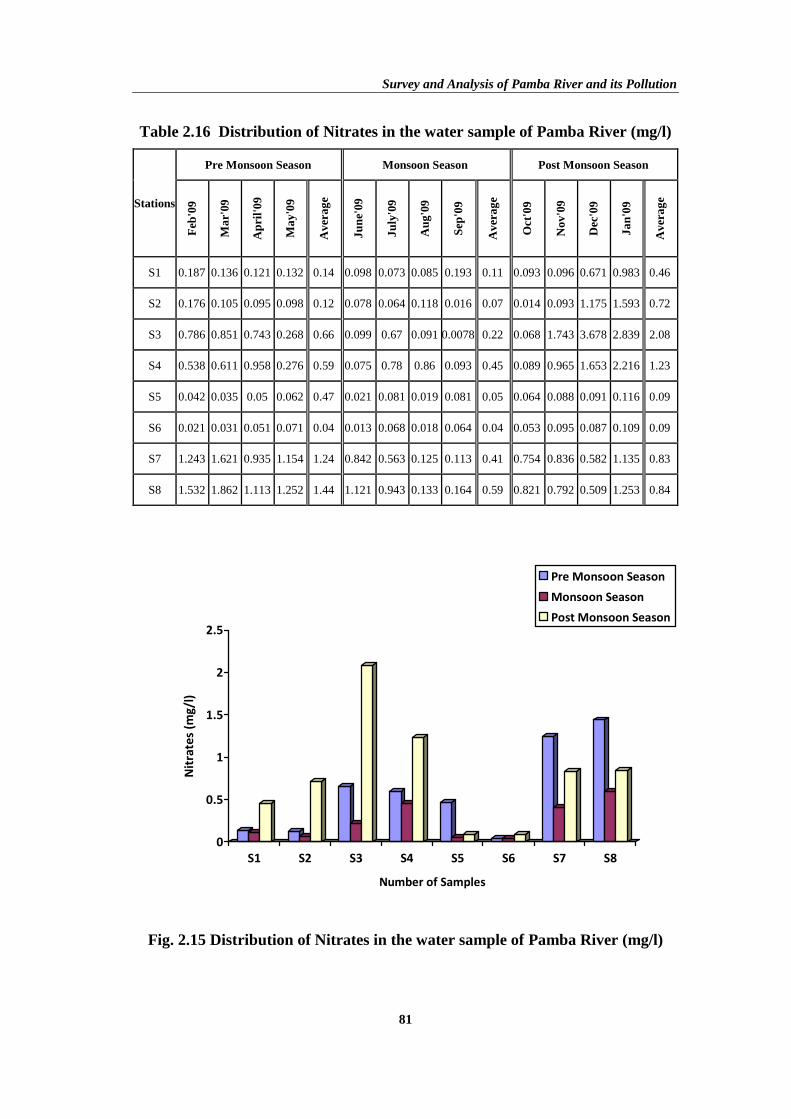
Survey and Analysis of Pamba River and its Pollution
81
Table 2.16 Distribution of Nitrates in the water sample of Pamba River (mg/l)
Stations
Pre Monsoon Season Monsoon Season Post Monsoon Season
Feb
'09
Mar
'09
Apr
il'09
May
'09
Ave
rage
June
'09
July
'09
Aug
'09
Sep
'09
Ave
rage
Oct
'09
Nov
'09
Dec
'09
Jan'
09
Ave
rage
S1 0.187 0.136 0.121 0.132 0.14 0.098 0.073 0.085 0.193 0.11 0.093 0.096 0.671 0.983 0.46
S2 0.176 0.105 0.095 0.098 0.12 0.078 0.064 0.118 0.016 0.07 0.014 0.093 1.175 1.593 0.72
S3 0.786 0.851 0.743 0.268 0.66 0.099 0.67 0.091 0.0078 0.22 0.068 1.743 3.678 2.839 2.08
S4 0.538 0.611 0.958 0.276 0.59 0.075 0.78 0.86 0.093 0.45 0.089 0.965 1.653 2.216 1.23
S5 0.042 0.035 0.05 0.062 0.47 0.021 0.081 0.019 0.081 0.05 0.064 0.088 0.091 0.116 0.09
S6 0.021 0.031 0.051 0.071 0.04 0.013 0.068 0.018 0.064 0.04 0.053 0.095 0.087 0.109 0.09
S7 1.243 1.621 0.935 1.154 1.24 0.842 0.563 0.125 0.113 0.41 0.754 0.836 0.582 1.135 0.83
S8 1.532 1.862 1.113 1.252 1.44 1.121 0.943 0.133 0.164 0.59 0.821 0.792 0.509 1.253 0.84
0
0.5
1
1.5
2
2.5
Nit
rate
s (m
g/l
)
S1 S2 S3 S4 S5 S6 S7 S8
Number of Samples
Pre Monsoon Season
Monsoon Season
Post Monsoon Season
Fig. 2.15 Distribution of Nitrates in the water sample of Pamba River (mg/l)
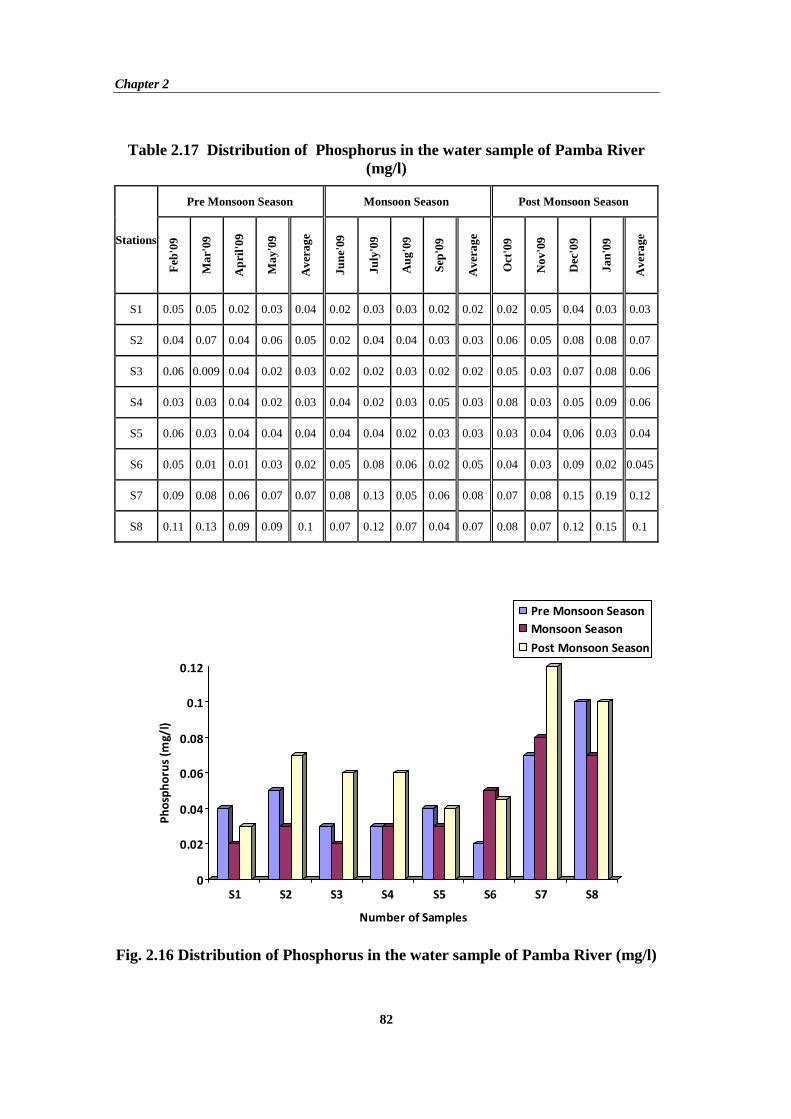
Chapter 2
82
Table 2.17 Distribution of Phosphorus in the water sample of Pamba River (mg/l)
Stations
Pre Monsoon Season Monsoon Season Post Monsoon Season
Feb
'09
Mar
'09
Apr
il'09
May
'09
Ave
rage
June
'09
July
'09
Aug
'09
Sep
'09
Ave
rage
Oct
'09
Nov
'09
Dec
'09
Jan'
09
Ave
rage
S1 0.05 0.05 0.02 0.03 0.04 0.02 0.03 0.03 0.02 0.02 0.02 0.05 0.04 0.03 0.03
S2 0.04 0.07 0.04 0.06 0.05 0.02 0.04 0.04 0.03 0.03 0.06 0.05 0.08 0.08 0.07
S3 0.06 0.009 0.04 0.02 0.03 0.02 0.02 0.03 0.02 0.02 0.05 0.03 0.07 0.08 0.06
S4 0.03 0.03 0.04 0.02 0.03 0.04 0.02 0.03 0.05 0.03 0.08 0.03 0.05 0.09 0.06
S5 0.06 0.03 0.04 0.04 0.04 0.04 0.04 0.02 0.03 0.03 0.03 0.04 0.06 0.03 0.04
S6 0.05 0.01 0.01 0.03 0.02 0.05 0.08 0.06 0.02 0.05 0.04 0.03 0.09 0.02 0.045
S7 0.09 0.08 0.06 0.07 0.07 0.08 0.13 0.05 0.06 0.08 0.07 0.08 0.15 0.19 0.12
S8 0.11 0.13 0.09 0.09 0.1 0.07 0.12 0.07 0.04 0.07 0.08 0.07 0.12 0.15 0.1
0
0.02
0.04
0.06
0.08
0.1
0.12
Ph
osp
ho
rus
(mg
/l)
S1 S2 S3 S4 S5 S6 S7 S8
Number of Samples
Pre Monsoon Season
Monsoon Season
Post Monsoon Season
Fig. 2.16 Distribution of Phosphorus in the water sample of Pamba River (mg/l)

Survey and Analysis of Pamba River and its Pollution
83
Table 2.18 Distribution of Sulphate in the water sample of Pamba River (mg/l)
Stations
Pre Monsoon Season Monsoon Season Post Monsoon Season F
eb'0
9
Mar
'09
Apr
il'09
May
'09
Ave
rage
June
'09
July
'09
Aug
'09
Sep
'09
Ave
rage
Oct
'09
Nov
'09
Dec
'09
Jan'
09
Ave
rage
S1 4.35 4.54 3.28 6.05 4.55 3.56 5.81 4.85 7.72 5.48 6.85 11.51 7.59 7.92 8.47
S2 11.82 11.62 9.98 8.86 10.57 7.05 9.38 6.35 8.05 7.7 8.06 14.53 12.81 14.25 12.41
S3 12.08 9.73 11.85 9.64 10.82 7.28 7.21 9.53 9.82 8.46 9.69 16.88 .18.56 18.08 14.88
S4 14.51 9.85 7.86 7.53 9.93 6.16 12.56 8.45 8.75 8.98 6.25 12.35 17.46 14.25 12.58
S5 12.94 10.42 12.69 8.08 11.03 4.38 7.56 5.29 6.12 5.84 4.07 10.65 8.62 9.64 8.24
S6 11.85 10.21 11.68 9.01 10.69 5.61 6.88 5.57 5.15 5.8 4.21 9.89 9.12 8.84 8.01
S7 12.53 11.83 11.29 9.64 11.32 6.31 6.85 6.12 6.35 6.41 5.31 10.25 10.48 10.63 9.17
S8 13.18 11.96 12.13 9.85 11.78 6.28 6.91 6.58 6.49 6.56 6.28 13.52 12.53 13.12 11.36
0
2
4
6
8
10
12
14
16
Su
lph
ate
(m
g/
l)
S1 S2 S3 S4 S5 S6 S7 S8
Number of Samples
Pre Monsoon Season
Monsoon Season
Post Monsoon Season
Fig. 2.17 Distribution of Sulphate in the water sample of Pamba River (mg/l)
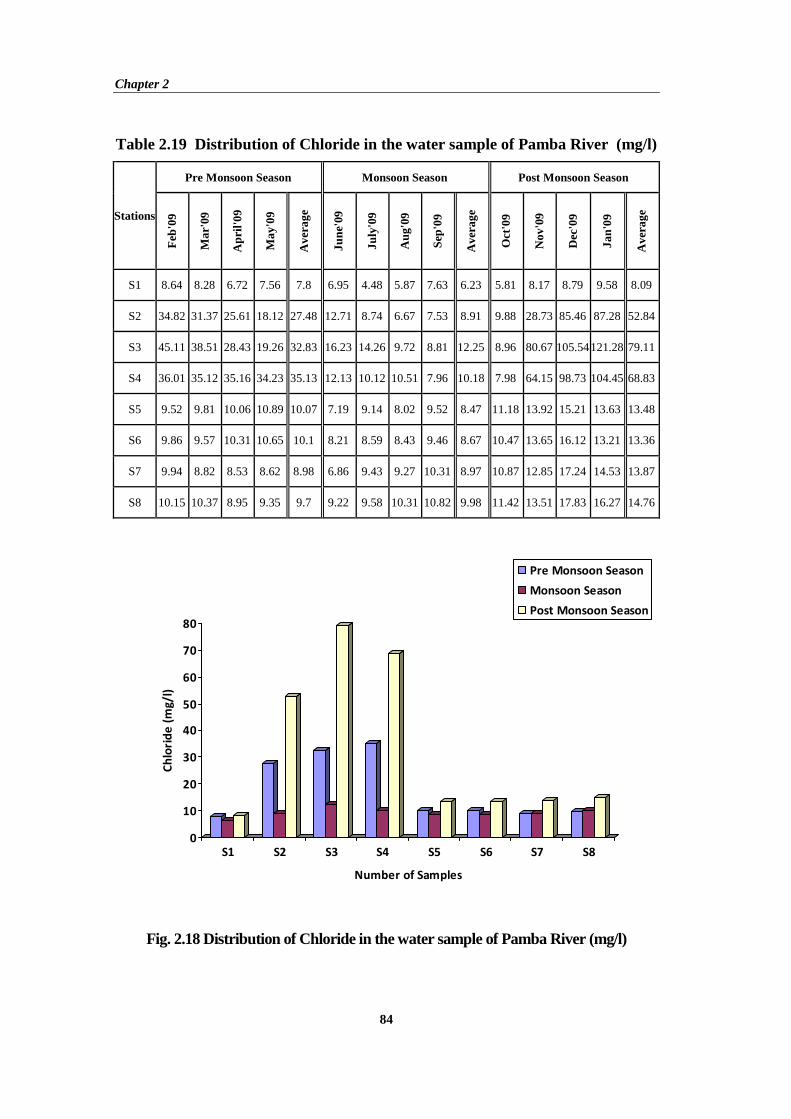
Chapter 2
84
Table 2.19 Distribution of Chloride in the water sample of Pamba River (mg/l)
Stations
Pre Monsoon Season Monsoon Season Post Monsoon Season F
eb'0
9
Mar
'09
Apr
il'09
May
'09
Ave
rage
June
'09
July
'09
Aug
'09
Sep
'09
Ave
rage
Oct
'09
Nov
'09
Dec
'09
Jan'
09
Ave
rage
S1 8.64 8.28 6.72 7.56 7.8 6.95 4.48 5.87 7.63 6.23 5.81 8.17 8.79 9.58 8.09
S2 34.82 31.37 25.61 18.12 27.48 12.71 8.74 6.67 7.53 8.91 9.88 28.73 85.46 87.28 52.84
S3 45.11 38.51 28.43 19.26 32.83 16.23 14.26 9.72 8.81 12.25 8.96 80.67 105.54121.28 79.11
S4 36.01 35.12 35.16 34.23 35.13 12.13 10.12 10.51 7.96 10.18 7.98 64.15 98.73 104.45 68.83
S5 9.52 9.81 10.06 10.89 10.07 7.19 9.14 8.02 9.52 8.47 11.18 13.92 15.21 13.63 13.48
S6 9.86 9.57 10.31 10.65 10.1 8.21 8.59 8.43 9.46 8.67 10.47 13.65 16.12 13.21 13.36
S7 9.94 8.82 8.53 8.62 8.98 6.86 9.43 9.27 10.31 8.97 10.87 12.85 17.24 14.53 13.87
S8 10.15 10.37 8.95 9.35 9.7 9.22 9.58 10.31 10.82 9.98 11.42 13.51 17.83 16.27 14.76
0
10
20
30
40
50
60
70
80
Ch
lori
de
(m
g/
l)
S1 S2 S3 S4 S5 S6 S7 S8
Number of Samples
Pre Monsoon Season
Monsoon Season
Post Monsoon Season
Fig. 2.18 Distribution of Chloride in the water sample of Pamba River (mg/l)
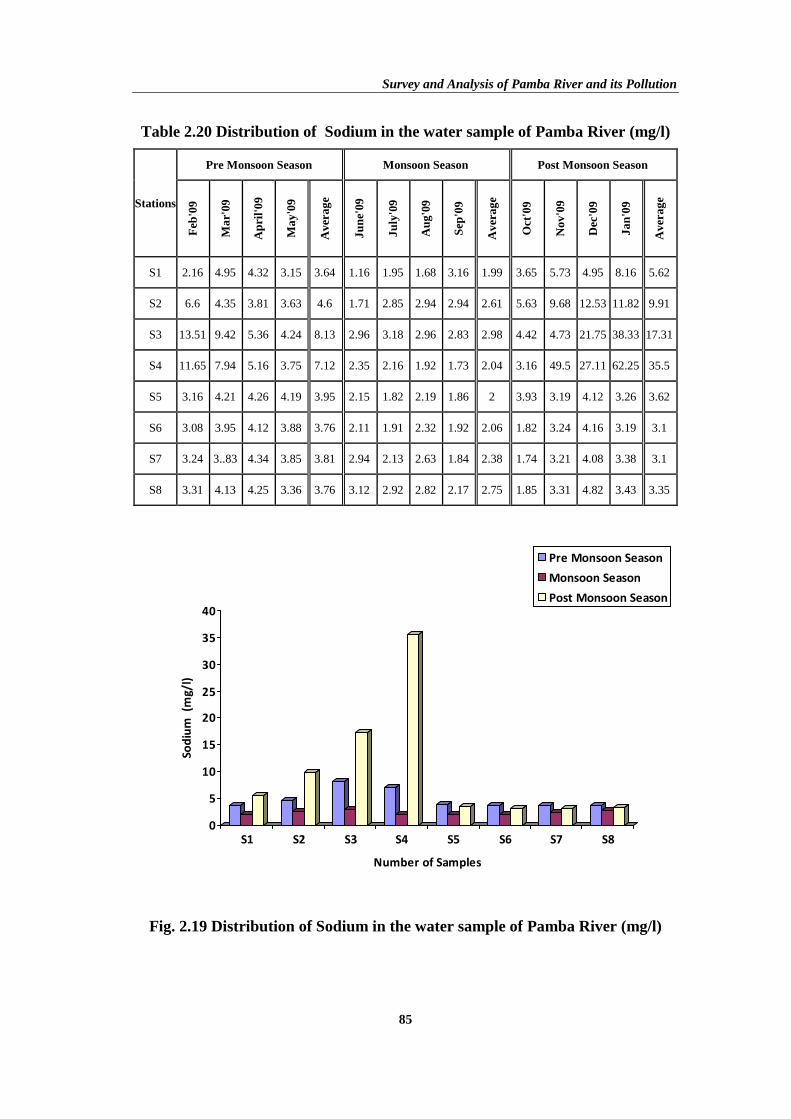
Survey and Analysis of Pamba River and its Pollution
85
Table 2.20 Distribution of Sodium in the water sample of Pamba River (mg/l)
Stations
Pre Monsoon Season Monsoon Season Post Monsoon Season
Feb
'09
Mar
'09
Apr
il'09
May
'09
Ave
rage
June
'09
July
'09
Aug
'09
Sep
'09
Ave
rage
Oct
'09
Nov
'09
Dec
'09
Jan'
09
Ave
rage
S1 2.16 4.95 4.32 3.15 3.64 1.16 1.95 1.68 3.16 1.99 3.65 5.73 4.95 8.16 5.62
S2 6.6 4.35 3.81 3.63 4.6 1.71 2.85 2.94 2.94 2.61 5.63 9.68 12.53 11.82 9.91
S3 13.51 9.42 5.36 4.24 8.13 2.96 3.18 2.96 2.83 2.98 4.42 4.73 21.75 38.33 17.31
S4 11.65 7.94 5.16 3.75 7.12 2.35 2.16 1.92 1.73 2.04 3.16 49.5 27.11 62.25 35.5
S5 3.16 4.21 4.26 4.19 3.95 2.15 1.82 2.19 1.86 2 3.93 3.19 4.12 3.26 3.62
S6 3.08 3.95 4.12 3.88 3.76 2.11 1.91 2.32 1.92 2.06 1.82 3.24 4.16 3.19 3.1
S7 3.24 3..83 4.34 3.85 3.81 2.94 2.13 2.63 1.84 2.38 1.74 3.21 4.08 3.38 3.1
S8 3.31 4.13 4.25 3.36 3.76 3.12 2.92 2.82 2.17 2.75 1.85 3.31 4.82 3.43 3.35
0
5
10
15
20
25
30
35
40
So
diu
m
(mg
/l)
S1 S2 S3 S4 S5 S6 S7 S8
Number of Samples
Pre Monsoon Season
Monsoon Season
Post Monsoon Season
Fig. 2.19 Distribution of Sodium in the water sample of Pamba River (mg/l)

Chapter 2
86
Table 2.21 Distribution of Potassium in the water sample of Pamba River (mg/l)
Stations
Pre Monsoon Season Monsoon Season Post Monsoon Season F
eb'0
9
Mar
'09
Apr
il'09
May
'09
Ave
rage
June
'09
July
'09
Aug
'09
Sep
'09
Ave
rage
Oct
'09
Nov
'09
Dec
'09
Jan'
09
Ave
rage
S1 1.8 0.85 0.86 0.96 1.12 0.68 0.96 0.85 0.87 0.84 0.89 0.97 1.85 2.8 1.63
S2 1.56 0.93 1.53 0.75 1.19 0.62 0.82 0.63 0.68 0.69 0.98 1.38 2.96 3.65 2.24
S3 1.84 0.96 0.95 0.42 1.04 0.48 0.88 0.76 0.67 0.71 0.54 1.96 3.85 2.68 2.26
S4 1.75 0.8 0.91 0.63 1.02 0.31 0.71 0.59 0.61 0.55 0.54 2.75 2.64 3.84 2.44
S5 1.42 2.76 2.85 2.51 2.38 1.49 0.96 1.08 2.01 1.38 1.62 1.46 1.92 1.95 1.74
S6 1.53 2.73 2.65 2.18 2.27 1.52 0.83 0.94 1.86 1.29 1.43 1.62 2.13 2.43 1.9
S7 1.96 2.92 2.81 2.25 2.48 1.94 0.92 0.86 1.75 1.37 1.82 1.94 2.27 2.81 2.21
S8 2.13 2.85 2.94 2.96 2.72 2.12 1.13 0.95 1.83 1.51 1.94 2.16 2.23 2.19 2.13
0
0.5
1
1.5
2
2.5
3
Po
tass
ium
(m
g/
l)
S1 S2 S3 S4 S5 S6 S7 S8
Number of Samples
Pre Monsoon Season
Monsoon Season
Post Monsoon Season
Fig. 2.20 Distribution of Potassium in the water sample of Pamba River (mg/l)
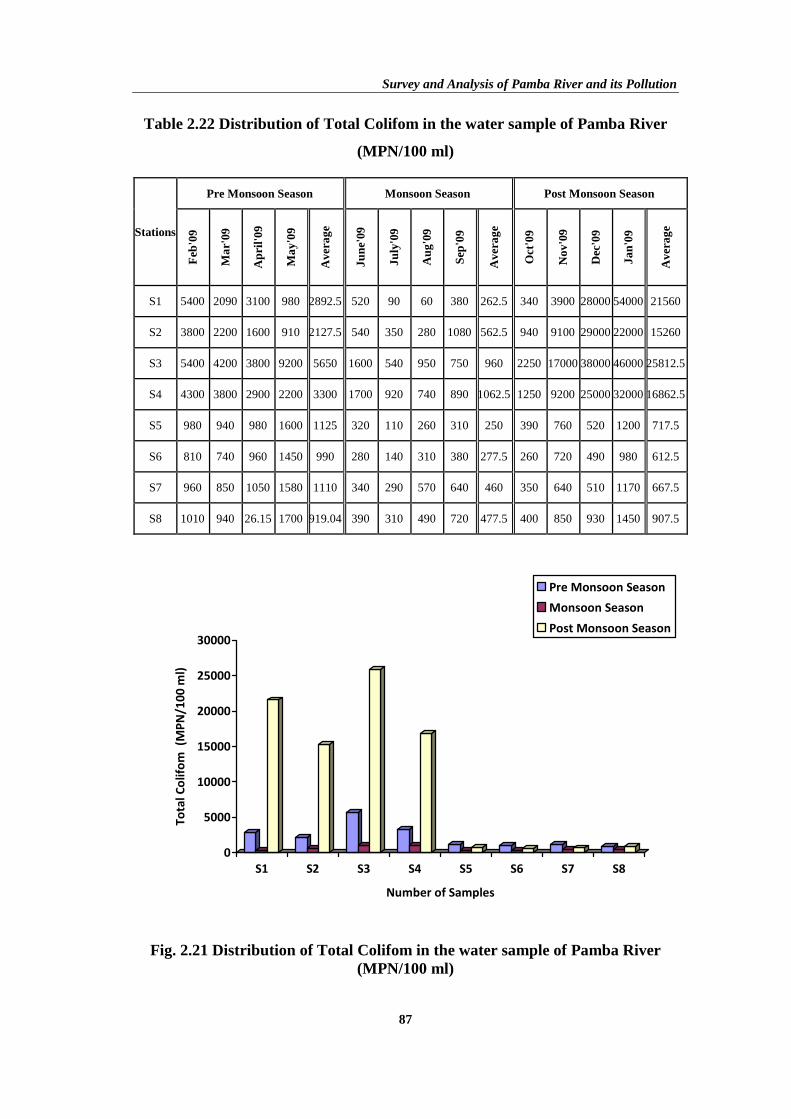
Survey and Analysis of Pamba River and its Pollution
87
Table 2.22 Distribution of Total Colifom in the water sample of Pamba River
(MPN/100 ml)
Stations
Pre Monsoon Season Monsoon Season Post Monsoon Season F
eb'0
9
Mar
'09
Apr
il'09
May
'09
Ave
rage
June
'09
July
'09
Aug
'09
Sep
'09
Ave
rage
Oct
'09
Nov
'09
Dec
'09
Jan'
09
Ave
rage
S1 5400 2090 3100 980 2892.5 520 90 60 380 262.5 340 3900 28000 54000 21560
S2 3800 2200 1600 910 2127.5 540 350 280 1080 562.5 940 9100 29000 22000 15260
S3 5400 4200 3800 9200 5650 1600 540 950 750 960 2250 17000 38000 46000 25812.5
S4 4300 3800 2900 2200 3300 1700 920 740 890 1062.5 1250 9200 25000 32000 16862.5
S5 980 940 980 1600 1125 320 110 260 310 250 390 760 520 1200 717.5
S6 810 740 960 1450 990 280 140 310 380 277.5 260 720 490 980 612.5
S7 960 850 1050 1580 1110 340 290 570 640 460 350 640 510 1170 667.5
S8 1010 940 26.15 1700 919.04 390 310 490 720 477.5 400 850 930 1450 907.5
0
5000
10000
15000
20000
25000
30000
To
tal
Co
lifo
m
(MP
N/1
00
ml)
S1 S2 S3 S4 S5 S6 S7 S8
Number of Samples
Pre Monsoon Season
Monsoon Season
Post Monsoon Season
Fig. 2.21 Distribution of Total Colifom in the water sample of Pamba River (MPN/100 ml)

Chapter 2
88
Table 2.23 Distribution of Faecal Colifom in the water sample of Pamba River (MPN/100 ml)
Stations
Pre Monsoon Season Monsoon Season Post Monsoon Season F
eb'0
9
Mar
'09
Apr
il'09
May
'09
Ave
rage
June
'09
July
'09
Aug
'09
Sep
'09
Ave
rage
Oct
'09
Nov
'09
Dec
'09
Jan'
09
Ave
rage
S1 3200 980 1600 310 1522.5 70 50 45 94 64.75 90 3600 17000 34000 13672.5
S2 3600 1900 980 350 1707.5 120 130 160 345 188.75 280 8000 24000 21000 13320
S3 4400 3900 2800 1650 3187.5 8501 390 700 540 2532.75 920 17000 36000 41000 23730
S4 3500 2750 1900 1450 2400 950 540 670 800 740 950 8500 23000 31000 15862.5
S5 790 640 1010 950 847.5 180 55 90 103 107 110 480 380 860 457.5
S6 740 600 1080 1100 880 90 80 45 90 76.25 70 350 210 640 317.5
S7 910 710 630 940 797.5 250 95 75 115 133.75 120 310 380 910 430
S8 800 850 870 1210 932.5 290 210 110 135 186.25 190 580 860 1200 707.5
0
5000
10000
15000
20000
25000
Fa
eca
l C
oli
fom
(M
PN
/10
0 m
l)
S1 S2 S3 S4 S5 S6 S7 S8
Number of Samples
Pre Monsoon Season
Monsoon Season
Post Monsoon Season
Fig. 2.22 Distribution of Faecal Colifom in the water sample of Pamba River (MPN/100 ml)

Survey and Analysis of Pamba River and its Pollution
89
Total coliform count showed the drastic level of pollution during the
pilgrimage season. It is generally accepted that the more is the coliform count, the
higher is the extent of pollution in a given sample. Likewise, a similar picture was
observed in the case of faecal coliform population also. A notable increase in faecal
coliform count was observed from 503.68 (pre pilgrimage season) to 8652.18
(pilgrimage season) which decreases to 1534.57 during post pilgrimage season.
Anthropogenic activities, open defecation and sewage inputs are the main reason
behind higher faecal contamination in river Pamba.
Previous reports also substantiate the present findings (Varghese et al.,
2007). The exponential pollution of river water due to pilgrimage activities are
reported earlier (Kulshrestha and Sharma, 2006). Reports are available too,
regarding mass bathing in sacred water bodies and its impacts on water quality
(Semwal and Akolkar, 2006).

Chapter 2
90
Table 2-24 Distribution of Iron in the water sample of Pamba River (ppm)
Stations
Pre Monsoon Season Monsoon Season Post Monsoon Season
Feb
'09
Mar
'09
Apr
il'09
May
'09
Ave
rage
June
'09
July
'09
Aug
'09
Sep
'09
Ave
rage
Oct
'09
Nov
'09
Dec
'09
Jan'
09
Ave
rage
S1 0.62 0.58 ND 0.68 0.63 0.48 0.41 0.44 0.23 0.39 0.39 0.42 0.68 0.75 0.56
S2 0.61 0.74 0.54 0.21 0.52 0.31 0.18 0.22 0.21 0.23 0.36 0.51 0.71 0.73 0.57
S3 0.79 0.93 0.79 0.96 0.87 0.95 0.54 0.62 0.38 0.62 0.61 0.72 0.94 .0.77 0.76
S4 0.68 0.62 0.82 0.67 0.71 0.97 0.52 0.12 0.31 0.48 0.48 0.62 0.83 0.75 0.67
S5 0.31 0.04 0.58 0.14 0.27 0.31 0.32 0.01 0.12 0.19 0.11 0.09 0.62 0.13 0.24
S6 0.3 0.06 0.03 0.13 0.13 0.12 0.11 0.01 0.01 0.06 0.09 0.07 0.61 0.09 0.21
S7 0.21 0.01 0.02 0.12 0.09 0.01 0.04 ND 0.01 0.02 0.01 0.01 0.58 0.04 0.16
S8 0.14 0.01 0.02 0.12 0.07 0.01 0.02 ND ND 0.01 0.01 ND 0.57 0.04 0.21
0
0.1
0.2
0.3
0.4
0.5
0.6
0.7
0.8
0.9
Iro
n
(pp
m)
S1 S2 S3 S4 S5 S6 S7 S8
Number of Samples
Pre Monsoon Season
Monsoon Season
Post Monsoon Season
Fig. 2.23 Distribution of Iron in the water sample of Pamba River (ppm)
ND- Not Detected

Survey and Analysis of Pamba River and its Pollution
91
Table 2.25 Distribution of Cadmium in the water sample of Pamba River (ppm)
Stations
Pre Monsoon Season Monsoon Season Post Monsoon Season F
eb'0
9
Mar
'09
Apr
il'09
May
'09
Ave
rage
June
'09
July
'09
Aug
'09
Sep
'09
Ave
rage
Oct
'09
Nov
'09
Dec
'09
Jan'
09
Ave
rage
S1 ND ND 0.01 ND 0.01 ND ND ND ND 0 ND ND 0.01 0.01 0.01
S2 0.1 0.01 0.01 ND 0.04 ND ND ND ND 0 ND ND 0.01 0.01 0.01
S3 0.02 0.01 0.01 0.01 0.01 ND ND ND ND 0 ND 0.02 1.32 1.82 1.57
S4 0.02 0.01 0.02 0.01 0.01 ND ND ND ND 0 ND 0.01 1.14 1.41 1.27
S5 0.02 0.01 0.2 0.01 0.06 ND ND ND ND 0 ND ND 0.95 1.12 1.03
S6 0.02 0.01 0.01 ND 0.01 ND ND ND ND 0 ND ND 0.92 1.11 1.01
S7 0.1 0.01 0.01 ND 0.04 ND ND ND ND 0 ND ND 0.91 0.94 0.92
S8 0.01 0.01 0.01 ND 0.01 ND ND ND ND 0 ND ND 0.92 0.91 0.91
0
0.2
0.4
0.6
0.8
1
1.2
1.4
1.6
Ca
dm
ium
(p
pm
)
S1 S2 S3 S4 S5 S6 S7 S8
Number of Samples
Pre Monsoon Season
Monsoon Season
Post Monsoon Season
Fig. 2.24 Distribution of Cadmium in the water sample of Pamba River (ppm)
ND- Not Detected
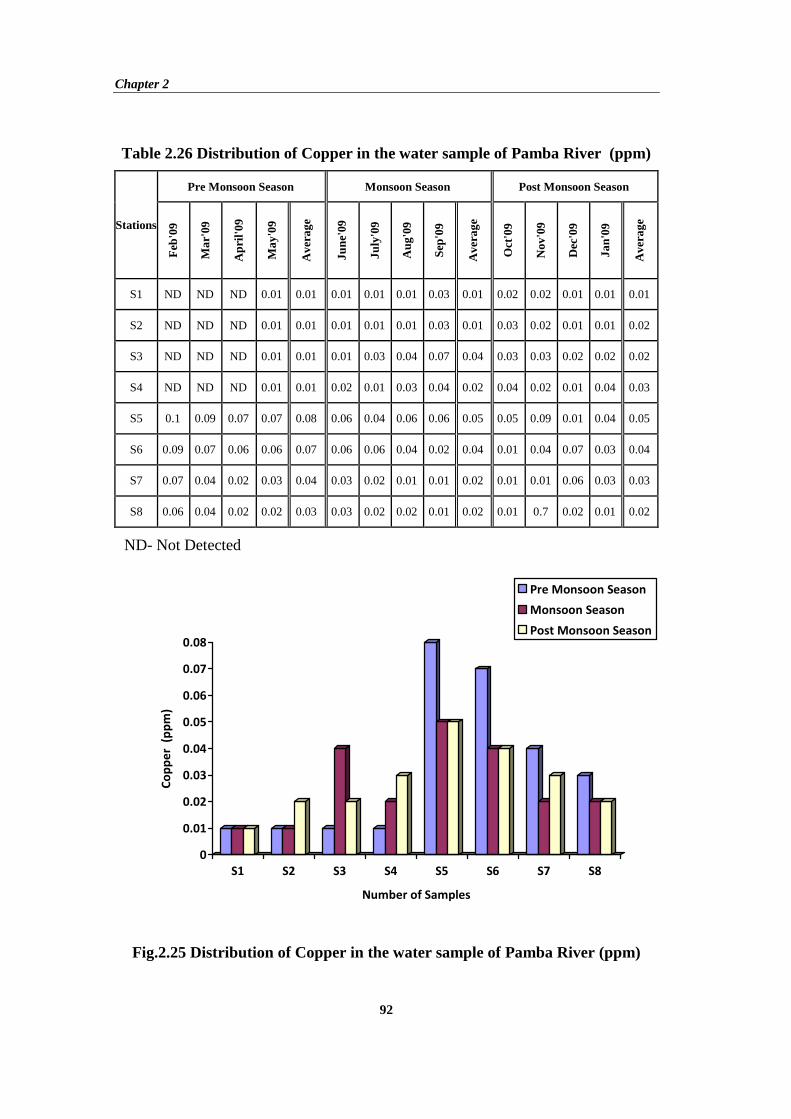
Chapter 2
92
Table 2.26 Distribution of Copper in the water sample of Pamba River (ppm)
Stations
Pre Monsoon Season Monsoon Season Post Monsoon Season F
eb'0
9
Mar
'09
Apr
il'09
May
'09
Ave
rage
June
'09
July
'09
Aug
'09
Sep
'09
Ave
rage
Oct
'09
Nov
'09
Dec
'09
Jan'
09
Ave
rage
S1 ND ND ND 0.01 0.01 0.01 0.01 0.01 0.03 0.01 0.02 0.02 0.01 0.01 0.01
S2 ND ND ND 0.01 0.01 0.01 0.01 0.01 0.03 0.01 0.03 0.02 0.01 0.01 0.02
S3 ND ND ND 0.01 0.01 0.01 0.03 0.04 0.07 0.04 0.03 0.03 0.02 0.02 0.02
S4 ND ND ND 0.01 0.01 0.02 0.01 0.03 0.04 0.02 0.04 0.02 0.01 0.04 0.03
S5 0.1 0.09 0.07 0.07 0.08 0.06 0.04 0.06 0.06 0.05 0.05 0.09 0.01 0.04 0.05
S6 0.09 0.07 0.06 0.06 0.07 0.06 0.06 0.04 0.02 0.04 0.01 0.04 0.07 0.03 0.04
S7 0.07 0.04 0.02 0.03 0.04 0.03 0.02 0.01 0.01 0.02 0.01 0.01 0.06 0.03 0.03
S8 0.06 0.04 0.02 0.02 0.03 0.03 0.02 0.02 0.01 0.02 0.01 0.7 0.02 0.01 0.02
0
0.01
0.02
0.03
0.04
0.05
0.06
0.07
0.08
Co
pp
er
(p
pm
)
S1 S2 S3 S4 S5 S6 S7 S8
Number of Samples
Pre Monsoon Season
Monsoon Season
Post Monsoon Season
Fig.2.25 Distribution of Copper in the water sample of Pamba River (ppm)
ND- Not Detected

Survey and Analysis of Pamba River and its Pollution
93
Table 2.27 Distribution of Lead in the water sample of Pamba River (ppm)
Stations
Pre Monsoon Season Monsoon Season Post Monsoon Season F
eb'0
9
Mar
'09
Apr
il'09
May
'09
Ave
rage
June
'09
July
'09
Aug
'09
Sep
'09
Ave
rage
Oct
'09
Nov
'09
Dec
'09
Jan'
09
Ave
rage
S1 0.01 0.01 ND ND 0.01 ND ND ND ND 0 ND 0.01 0.01 0.02 0.01
S2 0.02 0.02 0.01 0.01 0.01 ND ND ND ND 0 ND 0.03 0.02 0.04 0.03
S3 1.83 1.96 0.02 0.01 0.95 0.02 ND 0.02 ND 0.02 0.02 1.89 1.86 1.08 1.61
S4 1.94 0.98 0.03 0.01 0.74 ND ND 0.01 ND 0.01 0.02 0.97 1.94 1.83 1.58
S5 0.62 0.04 0.03 0.02 0.18 ND ND ND ND 0 0.01 0.83 0.62 0.74 0.73
S6 0.68 0.04 0.06 0.03 0.2 ND ND ND ND 0 ND 0.65 0.53 0.68 0.62
S7 0.72 0.05 0.08 0.03 0.22 ND ND ND ND 0 ND 0.63 0.62 0.64 0.63
S8 0.73 0.05 0.08 0.03 0.22 ND ND ND ND 0 ND 0.64 0.71 0.61 0.65
0
0.2
0.4
0.6
0.8
1
1.2
1.4
1.6
1.8
Lea
d
(p
pm
)
S1 S2 S3 S4 S5 S6 S7 S8
Number of Samples
Pre Monsoon Season
Monsoon Season
Post Monsoon Season
Fig. 2.26 Distribution of Lead in the water sample of Pamba River (ppm)
ND- Not Detected

Chapter 2
94
Table 2.28 Distribution of Zinc in the water sample of Pamba River (ppm)
Stations
Pre Monsoon Season Monsoon Season Post Monsoon Season F
eb'0
9
Mar
'09
Apr
il'09
May
'09
Ave
rage
June
'09
July
'09
Aug
'09
Sep
'09
Ave
rage
Oct
'09
Nov
'09
Dec
'09
Jan'
09
Ave
rage
S1 0.18 0.15 0.12 0.08 0.013 0.01 0.01 0.01 0.01 0.01 0.03 0.16 0.07 0.06 0.08
S2 0.16 0.11 0.14 0.11 0.13 0.05 0.03 0.01 0.02 0.03 0.02 0.19 0.12 0.09 0.01
S3 0.23 0.18 0.14 0.12 0.17 0.09 0.07 0.04 0.05 0.06 0.09 0.22 0.18 0.21 0.18
S4 0.19 0.12 0.13 0.11 0.14 0.06 0.07 0.04 0.06 0.05 0.07 0.21 0.16 0.23 0.17
S5 0.14 0.14 0.13 0.19 0.15 0.03 0.06 0.04 0.03 0.04 0.03 0.16 0.17 0.17 0.13
S6 0.17 0.11 0.15 0.12 0.14 0.02 0.05 0..05 0.03 0.03 0.04 0.16 0.19 0.19 0.14
S7 0.19 0.13 0.14 0.11 0.14 0.02 0.07 0.04 0.04 0.04 0.03 0.18 0.18 0.12 0.13
S8 0.16 0.13 0.16 0.12 0.14 0.02 0.08 0.06 0.06 0.05 0.04 0.15 0.21 0.15 0.14
0
0.02
0.04
0.06
0.08
0.1
0.12
0.14
0.16
0.18
Zin
c
(pp
m)
S1 S2 S3 S4 S5 S6 S7 S8
Number of Samples
Pre Monsoon Season
Monsoon Season
Post Monsoon Season
Fig. 2.27 Distribution of Zinc in the water sample of Pamba River (ppm)
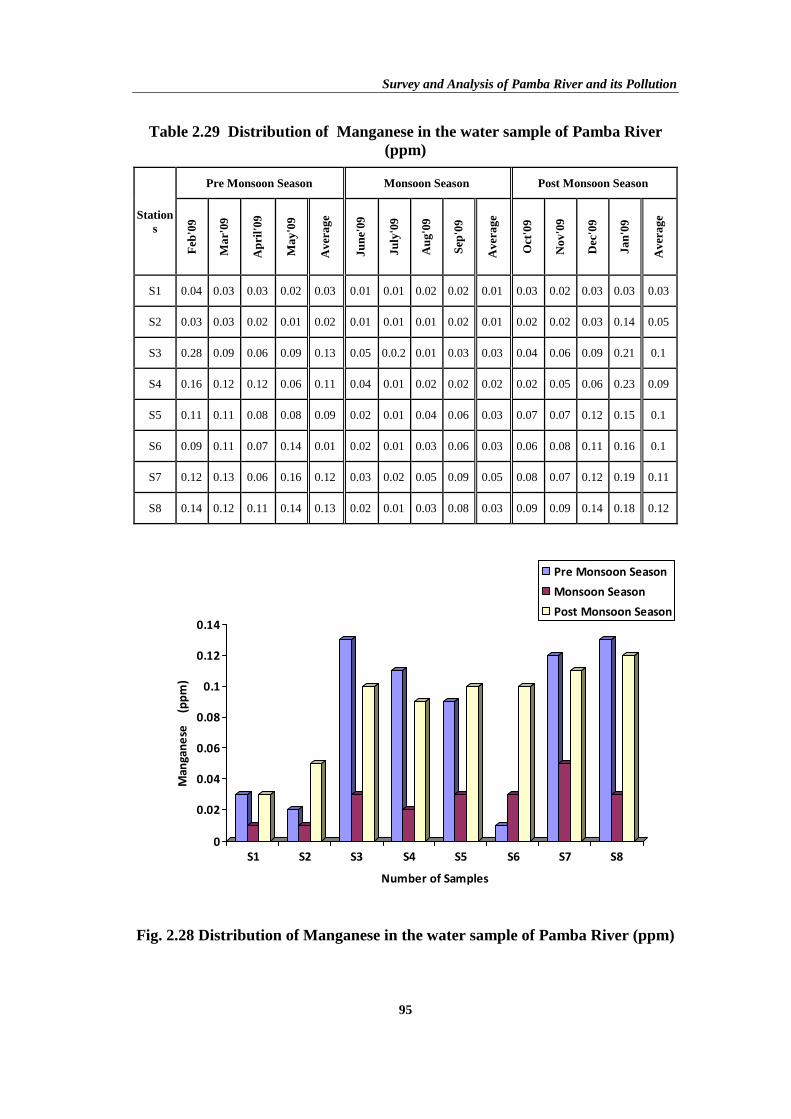
Survey and Analysis of Pamba River and its Pollution
95
Table 2.29 Distribution of Manganese in the water sample of Pamba River (ppm)
Stations
Pre Monsoon Season Monsoon Season Post Monsoon Season F
eb'0
9
Mar
'09
Apr
il'09
May
'09
Ave
rage
June
'09
July
'09
Aug
'09
Sep
'09
Ave
rage
Oct
'09
Nov
'09
Dec
'09
Jan'
09
Ave
rage
S1 0.04 0.03 0.03 0.02 0.03 0.01 0.01 0.02 0.02 0.01 0.03 0.02 0.03 0.03 0.03
S2 0.03 0.03 0.02 0.01 0.02 0.01 0.01 0.01 0.02 0.01 0.02 0.02 0.03 0.14 0.05
S3 0.28 0.09 0.06 0.09 0.13 0.05 0.0.2 0.01 0.03 0.03 0.04 0.06 0.09 0.21 0.1
S4 0.16 0.12 0.12 0.06 0.11 0.04 0.01 0.02 0.02 0.02 0.02 0.05 0.06 0.23 0.09
S5 0.11 0.11 0.08 0.08 0.09 0.02 0.01 0.04 0.06 0.03 0.07 0.07 0.12 0.15 0.1
S6 0.09 0.11 0.07 0.14 0.01 0.02 0.01 0.03 0.06 0.03 0.06 0.08 0.11 0.16 0.1
S7 0.12 0.13 0.06 0.16 0.12 0.03 0.02 0.05 0.09 0.05 0.08 0.07 0.12 0.19 0.11
S8 0.14 0.12 0.11 0.14 0.13 0.02 0.01 0.03 0.08 0.03 0.09 0.09 0.14 0.18 0.12
0
0.02
0.04
0.06
0.08
0.1
0.12
0.14
Ma
ng
an
ese
(pp
m)
S1 S2 S3 S4 S5 S6 S7 S8
Number of Samples
Pre Monsoon Season
Monsoon Season
Post Monsoon Season
Fig. 2.28 Distribution of Manganese in the water sample of Pamba River (ppm)

Chapter 2
96
The quality of water recourses depends on the management of the water
sources. This would include anthropogenic discharges as well as the natural physico-
chemical properties of the area. The seasonal variations of the physico-chemical and
biological parameters at different stations were monitored during the three seasons
are shown in table 2.3 to 2-29.
The holy river Pamba and its tributaries are the life line of the Central
Travancore and the Vembanadu Wetland system. The riverine system is now facing
a slow death. The holy river Pamba originates from Western Ghats which is a hottest
biodiversity hotspot and empties in to the Vembanadu Lake, a Ramsar site through
the most densely populated regions of the State. The environmental degradation of
Pamba river basin is a matter of serious concern.
In India, not a single water body is devoid of one or other form of pollution.
Various types of insecticides and pesticides too cause serious environmental
pollution. The alarming fact is that they are capable of undergoing biological
magnification. The water pollution problem becomes more prevalent during the dry
season, there is no rain and the water body get saturated with the waste water.
Another environmental nuisance is fertilizers which causes serious problem to the
river system. The nitrate, phosphates etc. cause algal blooms by acting as nutrients
for a luxuriant algal growth, which rise the BOD and destroy the aesthetic beauty of
water bodies imparting foul smell and odour.
Temperature
The temperature plays a vital role in controlling the physical and chemical
characters of water. It has been shown that low temperature decreases the
effectiveness of chlorination. Increased temperature may also cause bad taste and
Survey and Analysis of Pamba River and its Pollution
97
odour in water due to increased volatility of odour causing compound. The average
water temperature in the different stretches in Pamba river varied between 25.50C to
300C. Statistical value shows that there were slight significant differences between
values obtained in different seasons. Temperature fluctuations in the three seasons
are more evident in fresh water habitats. Flowing waters however take wide
fluctuations in temperature (Leonard, 1971). The maximum temperature of 30.50C
was recorded at station 8 during Pre Monsoon Season. Likewise the lowest
temperature of 24.50C was recorded at stations 4 and 6 during Post Monsoon season.
The highest temperature was noted during the summer season (pre monsoon). This
may be due to the rise in atmospheric temperature and decrease in the quantum of
water available. During summer season, the river dries up and reduces itself to be a
small stream. The distribution of temperature in different seasons and different
stations is appended in table 2.3 Figure 2.2 depicts the distribution of temperature in
different seasons and different stations.
pH
The pH or the hydrogen ion concentration of water is important because
many biological activities can occur only within a narrow range. Thus, any variation
beyond acceptable range could be fatal to a particular organism. The average
hydrogen ion concentration (pH) values of different seasons were between 6.54 and
6.88 in table 2.4 figure 2.3. According to Fakayode (2005), such pH that is near to
neutral is indicative of unpolluted water. Several factors influence the conductivity
including temperature, ionic mobility and ionic valencies. It provides a rapid mean
of obtaining approximate knowledge of total dissolved solids concentration and
salinity of water sample (Odum, 1971).

Chapter 2
98
Conductivity
The conductivity value fluctuates between 32.75 mhos/cm and 120µ
mhos/cm which comes within the permissible limit table 2.4 figure 2.4. Bathing of
millions of pilgrims especially during pilgrim season, besides agricultural runoff and
drainage in the course of river led to high concentration of salt and ions contributing
to the higher conductivity value. The variations in the conductivity value during
different seasons can be related to the quality of water in the river.
Turbidity
Turbidity of water is an important parameter because it restricts the light
penetration in to the water, which plays a vital role in photosynthesis. Turbidity of
natural waters is caused by suspended matters like clay, silt, organic matter,
phytoplankton and other microscopic organism. The degree of turbidity in a stream
is often taken as a measure of the intensity of the pollution. The distribution of
average turbidity in the water samples of Pamba river ranged from 2.27 to 12.22
NTU (Table 2.6, figure 2.5). Krishnakumar (2002) reported high turbidity of 38
NTU in the Neyyar river, Kerala due to sand mining activity. The increased turbidity
observed in Pamba river during pilgrim season may be due to the input of organic
matter and sewage effluents in to the river.
Total solids (TS)
The total solids are widely used for the majority of compounds, which are
present in natural waters and is approximately equivalent to the total content of
dissolved and suspended matter in water. The distribution of average total solids in
the water samples of Pamba river ranged from 42.16 to 114.31 mg / l table 2.7 &

Survey and Analysis of Pamba River and its Pollution
99
figure 2.6.The quantity of solids is proportional to the degree of pollution according
Subramanian (2000).
Total dissolved solids (TDS)
Total dissolved solids are an indication of the degree of dissolved substances
such as metal ions in the water. A high count of dissolved solids elevates the density
of water, influences osmoregulation of fresh water organism, reduces solubility of
gases and utility of water for drinking, irrigation and industrial purposes
(Swarnaletha and Rao 1998). The average total solids in the water samples of Pamba
river ranged from 33.07 to 78.23 mg / l table 2.8 & figure 2.7. Bordoloi et al., (2002)
reported high TDS due to the reduction of high evaporation. The TDS showed lower
values during monsoon owing to the influx of more water from the catchment areas
and subsequent dilution of the dissolved salts.
Dissolved Oxygen (DO)
Dissolved oxygen is very crucial for survival of aquatic organism and is also
to evaluate the degree of freshness of a river. The dissolved oxygen showed
maximum value in season. Dissolved oxygen showed inverse relationship with
water temperature (Ali., 2000). The distributions of average DO in the water
samples of Pamba river ranged from 2.01 to 7.16 mg/l. table 2.9 and figure 2.8. For
the healthy growth of aquatic organism a minimum DO level of 4 mg / l should be
maintained in a riverine system. The low DO level in the Pamba river during pilgrim
season may be due to high organic load. High organic load may reduce oxygen
content in fresh water. However high DO values were observed in all stations during
the rainy season.

Chapter 2
100
Biochemical Oxygen Demand (BOD)
The BOD is a means to determine the relative oxygen requirements of waste
waters, effluents, and polluted water. BOD is an excellent indicator of the strength
of domestic and industrial contaminants in aquatic environment (APHA, 2005). In
the present study higher BOD values were recorded as 34.12 mg / l at (S) 3 and 1.24
mg/l in (S1). The average BOD in the water samples of Pamba river ranged from
1.09 to 22.67 mg/l table 2.10 & figure 2.9. The analysis of BOD clearly indicates
that the higher BOD observed during pilgrimage season might be due to high
organic wastes discharged during the festival season. Mishra and Mishra (1994)
reported a BOD range, 3 mg / l to 60 mg/l in mass bathing of the river Ganges.
Chemical Oxygen Demand (COD)
The COD is the measure of oxygen required in oxidizing the organic
compound involving oxidizing agents under acidic conditions. The average COD in
the water samples of Pamba river ranged from 5.24 to 83.64 mg / l table 2.11 &
figure 2.10. The higher value of COD observed at upstream stations especially
during pilgrimage season may be due to the input of organic wastes and sewage in
the river. Pradeep et al., (2002) observed a COD value of 3.2mg/l in Killi Ar,
Ganesh et al., (2002) reported a COD range of 160-660mg/l in the river Gadana.
Kelkar et al., (2003) reported that COD can increase during the lean flow period.
Total hardness
Total hardness of water is mainly due to its calcium and magnesium ion
salts. The distribution of hardness in the water samples of river Pamba ranged from
7.5 to 47.75 mg/l table 2.12 & figure 2.11. Very high values of hardness were
reported by CPCB (1999) in different Indian rivers: Ganga (9200 mg/l), Cauvery

Survey and Analysis of Pamba River and its Pollution
101
(3400 mg/l), Chaliyar (2720 mg/l). Kannan (1991) has classified fresh water on the
basis of hardness value in the following manner: 0-120 as soft, 61-120 as moderately
hard, 120-160 as hard and above 180 very hard. On this basis Pamba river is soft
except at one station.
Alkalinity
Alkalinity in the river system ranged between and 68.38 mg/l table 2.13 &
2.12. Brown (1993) reported that total hardness act as limiting factor for alkalinity.
Calcareous water with more than 50ppm is most productive. Carbonates and
bicarbonates are the major components of alkalinity
Calcium (Ca)
Calcium - a metallic element is fifth abundant in the earth's crust, which
dissolve out of almost all rocks and is consequently detected in fresh water. The
solubility’s of various calcium minerals govern the level of calcium in solution.
Calcium is an important micronutrient in an aquatic environment. The calcium ion
concentration value starts from 6.54 mg/l to a maximum of 7.31 which was very
high. The presence of calcium and pH was very high shows a positive correlation.
The distribution of calcium in the water samples of river Pamba ranged from 6.54 –
6.85 mg/l table 2.15 & figure 2.14. According to Dhanapakiam et al., (1999)
reported 220 mg/l of calcium in Kaveri river and Rao (2003) reported 8 – 48 mg/l of
calcium in Godavari river. The average value of calcium concentration shows that
during pilgrim season, the upstream stations contain calcium rich water.

Chapter 2
102
Magnesium (Mg)
Magnesium occurs widely in nature, primarily in the minerals dolomite,
magnetite and salt deposits etc. The value ranges between 1.51 to 5.31 table 2.14 &
figure 2.13. The concentration of Mg in natural fresh waters ranges from 0.2 – 76.8
mg/l (Lindsay, 1979). The distribution of magnesium in the water samples of river
Pamba ranged from 1.07–5.31 mg/l. Dhanapakiam et al., (1999) reported 122.68
mg/l of magnesium in Cauvery river. Krishnakumar 2002, reported an average Mg
concentration of 10.2mg/l and 4.5mg/l in Neyyar and Karamana rivers respectively.
Magnesium is positively correlated with total hardness during pilgrimage and post-
pilgrimage seasons.
Nitrate (NO3)
Nitrate ion is the stable form of combined nitrogen found in natural water.
The distribution of nitrogen in the water samples of river Pamba ranged from 0.09 to
2.08 mg/l table 2.16 & figure 2.15. The highest nitrate value of 3.678 mg/l in S3
station. Reddy et al., (1986) reported high nitrate content (10.32 mg/l) in Enumala
Vagu basin. High nitrate content was observed in the pre monsoon season in the
present study. Similar results were reported by Sherly Annie (2008) and Koshy and
Nair (2000) and this could be attributed to the runoff from the agricultural land
during monsoon and the sewage discharge into the river. The pollution of river water
below 1mg/l. This indicate that the river is free from the nitrate pollution.
Phosphorous (P)
Phosphorus is an essential nutrient for all organisms. The environmental
importance of phosphorus stems from its role as a plant nutrient rather its
abundance. The distribution of phosphorous in the water samples of river Pamba
Survey and Analysis of Pamba River and its Pollution
103
ranged from 0.02 to 0.12 mg/l table 2.17 & figure 2.16. The highest nitrate value of
0.19 mg /l in S8. Pradeep et al., (2002) suggested that the use of soaps and
detergents can enhanced the phosphorous concentration in water bodies.
Sulphate (SO4)
The Sulphate is an abundant ion in the earth's crust and its concentration in
water can range from few milligrams to several thousands of milligrams per liter.
The distribution of sulphate in the water samples of river Pamba ranged from 4.55 to
14.88 mg/l table 2.18 & figure 2.17. The observed high value of sulphate may be
due to the input of sewage from Sabarinala pilgrimage. Krishnakumar (2002) also
observed a high concentration of sulphate in Karamana river.
Chloride (Cl2)
Chloride anions are usually present in natural waters. A high concentration in
water that has been in contact with chloride containing geological formations.
Otherwise, high chloride content may indicate pollution. The average chloride
content observed in the River Pamba varied from 6.23 to 79.11mg/l table 2.19 &
figure 2.18. The distribution of nitrogen in the water samples of river Pamba ranged
from 0.09 to 2.08 mg/l. The highest value of 121.28 mg /l in S3.
Sodium (Na) and Potassium (K)
Sodium and Potassium are common element present to some extent in
natural waters. The average distribution of sodium (1.99 to 35.5) and potassium in
the water samples of river Pamba ranged from 0.55 to 7.22 mg/l table 2.20 & figure
2.19. Kelkar et al., (2003) observed sodium range of 0.4 to 7.2 mg/l in the river
Mandovi, and potassium 0.2 to 1.4 mg/l table 2.21 & figure 2.20 in the fresh water
zone of river Mandov.

Chapter 2
104
Bacteriological parameters
Total coliforms (TC)
The presence of bacterial organisms in water was assumed it indicate a
potential health hazard because of their association with a variety of pathogenic
microorganism (Herwaldt, et al., 1992). The potential source of these infections
agents reaching waters include untreated or poorly treated municipal and/or
industrial effluents or sludge's, sanitary waste. Fecal waste, drainage landfills,
stream water runoff and excretion of animals (Cabelli, 1988). The presents of
organisms in water is indicative of the water being contaminated with fecal matter
(Edward, 1962). The average MPN of total coliforms in the water samples of Pamba
river ranged from 250 to 25812 MPN table 2.22 & figure 2.21. The highest MPN
Value of 46000 MPN/100 MPN was observed S3 and the lowest MPN of 250 was
observed at S5. The higher number of coliforms observed in the river Pamba may be
attributed to anthropogenic activated associated with pilgrimages season in almost
all station may due to the poor sanitation facilities for pilgrims.
Faecal Coliform (FC)
Generally, coliforms occure abundantly in faeses and sewage, but are also
found in the environment in absence of faecal contamination. Thus their presents in
water don’t necessarily signify faecal contamination. Hence faecal coliforms count
is necessary to state whether the water body is contaminated with faecal matters.
The MPN of faecal coliform in the water samples of Pamba river ranged from 64.75
to 15862.5 MPN/100 table 2.23 figure 2.22. In the present study the number of fecal
coliforms increases in proportion with the count of total coliforms. This indicates that
fecal coliforms contribute most share in total coliforms. Studies of Bhasker, K (2003),

Survey and Analysis of Pamba River and its Pollution
105
on Torsa river, reported faecal coliforms pollution from the wastes of mixed human
and animal sources, which contribute a substantial portion to the total coliforms
count. In river Pamba, the high faecal coliform count observed during the pilgrimage
season in all upstream stations may be due to anthropogenic activities associated
with pilgrimage at Sabarimala.
Trace elements
Iron (Fe)
Iron is an abundant element in the earth crust, but exist generally in minor
concentration in the natural water systems. The main source of Iron in water is the
weathering process. The average distribution of iron in the water samples of Pamba
river ranged from 0.01 to 0.87ppm table 2.24 & figure 2.23. During the pre-pilgrimage
season a declining of iron concentration can be seen in all stations this may be due to
the dilution of water with rain water. Madhyastha et al., (1996) reported dissolved iron
in water of Nathavathy river ranging from 0.07 to 0.234 ppm.
Cadmium (Cd)
Cadmium is commonly associated with Zinc in carbonates and sulphide ores
and is also a byproduct of the refining of other metals. It is used particularly in
electroplating batteries, pigments etc. (Moore and Ramamurthy, 1984). Salinity and
water hardness, along with pH determine the speciation of cadmium in natural
waters. (Cooper et al., 1979). The average distribution of cadmium in the water
samples of Pamba river ranged from 0.01 to 1.57 ppm table 2.25 & figure 2.24. The
natural unpolluted fresh waters the cadmium level varying from 0.00001 to 0.00004
ppm have been reported (Hart, 1984). Khalaf et al., (1984) reported 0.33 ppm of
cadmium in river Diyala, Iraq.
Chapter 2
106
Copper (Cu)
Copper is a metal and its compounds had been used by man since prehistoric
time. Copper occurs in nature mostly in the form of oxides and sulphides. The
average distribution of Cu in the water samples of Pamba river ranged from 0.01 to
0.08 ppm table 2.26 & figure 2.25. The land run off along with domestic and
agricultural waste in puts can enhance the Cu in natural waters. Krishnakumar
(2002) reported an average Cu content of 0.08 ppm in Neyyar river and 0.09 ppm in
Kramana river.
Lead (Pb)
Lead is the most abundant of the natural heavy element. Lead is emitted in
the environment through a large number of natural and anthropogenic sources. The
magnitude of lead contamination in the Environment is high relative by that of any
other trace elements (Nriagu and Pacyana, 1988). The average distribution of lead in
the water samples of Pamba river ranged from 0.01 to 1.61 mg/L table 2.27 & figure
2.26. In natural waters lead concentration ranges from 0.0006 ppm to 0.12 ppm with
a median value of 0.005 ppm (Biswas, 2003).
Zinc (Zn)
Zinc is an essential and beneficial micronutrient required in trace for the
growth of both plant and animals. The major source of Zn in aquatic system
including manufacturing process involving metals domestic waste water and
atmospheric fallouts. The average distribution of Zn in the water samples of Pamba
river ranged from 0.01 to 0.17 ppm table 2.28 figure 2.27. The high content of Zn
observed at up streame of the river during pilgrimage season may be due to the input
waste and waste water from the rilgrimage centre.Sharma and Pande, (1998)
Survey and Analysis of Pamba River and its Pollution
107
observed high Zn content 0.744 ppm in rama ganga river at moradabadh and they
attributed it to domestic waste water entry in to the river. Singh and Singh (1995)
reported Zn value ranging from 0.0127 ppm to 0.0486 ppm in the middle stretch of
rover Ganga.
Manganese (Mn)
Manganese is an essential nutritional element is found in every kind of plants
and animals it also occurs in great variety of minerals widely scattered over the
earth. The average distribution of Mn in the water samples of Pamba river ranged
from 0.01 to 0.13 ppm. Mn is also considered as a mobile element (Kemp and
Thomas, 1976) because it can be exchanged between sediment and water as result of
changes in temperature and pH (Stumm and Morgan, 1983).
2.5 DISCUSSION
In Pamba River all physico-chemical and biological parameters were
fluctuated in different seasons and different stations. Raised values of certain
parameters clearly indicated pollution at river water. The physico – chemical and
bacteriological parameters and their relationship have been statistically analysed by
using Pearson's correlation co – efficient matrix. The values derived from the study
are shown in table. 2.30. These values clearly indicated that majority of parameters
crossed the limit of tolerance. But it is noticing worthwhile that the levels show a
regular increase during the last few years.The results of previous studies (Sherley
and Annie, 2008) clearly agrees with the present study. This undoubtedly is harmful
to the survival of living organisms and ecosystem of river Pamba. During the post
monsoon season (pilgrimage season) the number of pilgrims visiting Sabarimala
runs into millions. Because of the lack of adequate sanitation facilities they use the
Chapter 2
108
river and the river basins for their daily chorus. As a result, the river water gets
contaminated. It becomes all the more dangerous since the same water is used for
bathing, washing, cooking and even for drinking purposes by the pilgrims and the
downstream inhabitants.
The uncontrolled increase of coliform bacteria has been proved beyond
doubt. This increased the hazard of pathogenic diseases and water borne diseases.
This adversely affected the whole ecosystem.
The present investigation indicated that the Pamba river water was unsuitable
for domestic use. To protect the river, there should be proper management and
planning to provide adequate facilities to the pilgrims and there should be provisions
for the deposition of domestic wastes, municipal wastes, agricultural runoff, and
poultry wastes. Present study is also helpful for implementing Pamba action plan.
The whole mass of night soil and other biodegradable waste can be used for
production of biogas etc. Among other floating materials that ultimately reach the
river some can be reused and others like plastic, bottle etc. can be recycled. An
effective strategy has to be developed for this. Otherwise it will be the death knell of
river Pamba.
The water samples were collected from different places in Pamba river water
and studied under various methods on number of parameters such as pH, Total
Dissolved Solids (TDS), Biological Oxygen Demand (BOD), Chemical Oxygen
Demand (COD), and Dissolved Oxygen (DO). The study showed wide range of
values under each test and samples were found to have inferior quality unsafe for
drinking purposes at most of the places.

Survey and Analysis of Pamba River and its Pollution
109
The term contaminant refers to a material which is present in a part of the
environment where it is not expected. When the materisl begins to cause a problem,
having a negative effect on health of humans or other organisms in the area or
causing widespread changes in the local environment, it is termed as a pollutant. All
environmental studies ultimately depend on the results of chemical analysis of
samples of water for pollutants. Policies of reduction of pollutants can not be
designed if the extent and identity of the pollutant is not known. Further the general
trend in the polluting factors should be known to the environmental engineer for
effective designing of the treatment strategies. Analysis of the water sample
becomes too difficult when the water is contaminated with large number of
pollutants and particularly when the pollutants are present in erxtremely in low
amount. Finding a correlation between the pollutants, analysis of the factors
affecting pollutant and the extent of variation of the amount of pollutant are matters
of concern when we are dealing with river pollution and its possible treatment
strategies.
In the present investgation extreme care was taken to analyse all the
polluting fctors of the river Pamba during the three main seasons viz; Pre monsoon,
monsoon and post monsoon. As expected, most of the values were less in monsoon
season, comparatively more during pre monsioon and high during post monsoon.
There was no significant change in temperature, pH, calcium, phosphorous, and
copper during the three seasons. However the content of these parameters was above
the permitted level. Obvisouly the DO was more during monsoon, however less than
8 mg/l. There was significant reduction in DO during both the pre and post monsoon
seasons. Also the amount of both total solids and suspended solids were

Chapter 2
110
significantly higher which very well indicated the necessity for an effective primary
treatment. Both feacal coliform and total coloform count was significantly higher in
all seasons.Post monsoon season represented the highest index for both coliform and
faecal coliform. The existing treatment strategy at Pamba by the Devaswam Board is
mainly inclusive of alum treatment followed by heavy chlorination with bleaching
powder. The high value represented for calcium in all seasons was attributed to this
processes.
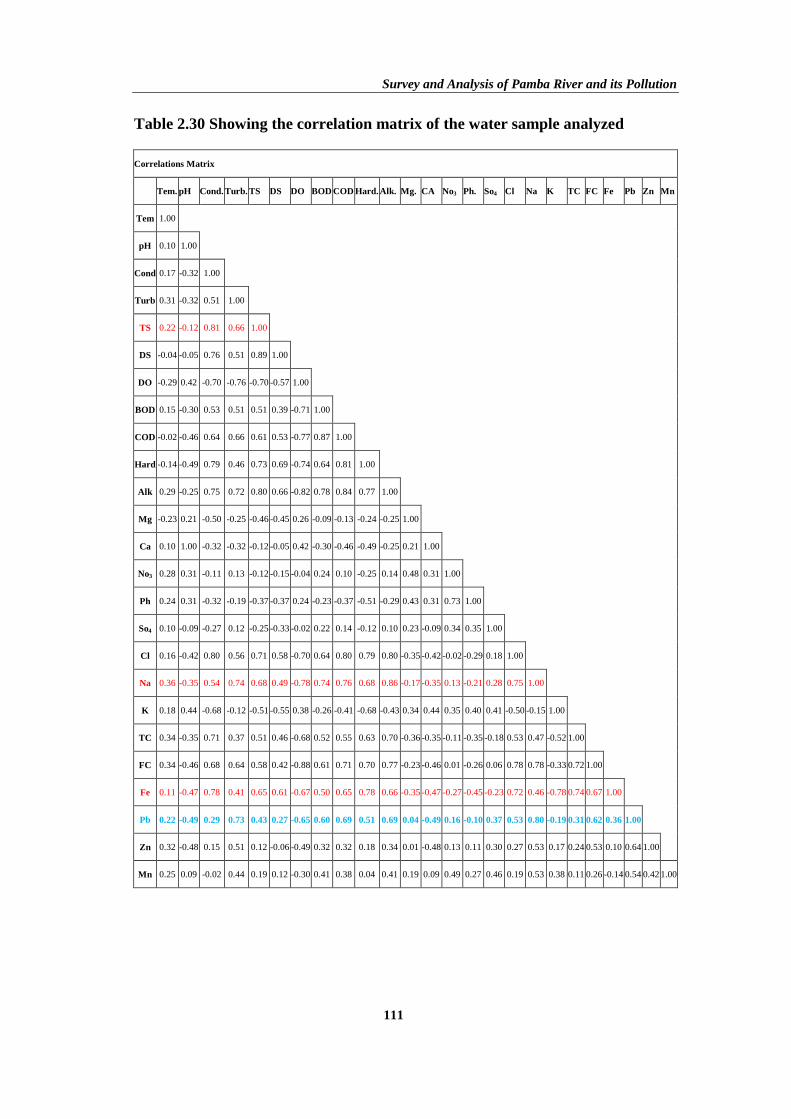
Survey and Analysis of Pamba River and its Pollution
111
Table 2.30 Showing the correlation matrix of the water sample analyzed
Correlations Matrix
Tem. pH Cond. Turb. TS DS DO BOD COD Hard. Alk. Mg. CA No3 Ph. So4 Cl Na K TC FC Fe Pb Zn Mn
Tem 1.00
pH 0.10 1.00
Cond 0.17 -0.32 1.00
Turb 0.31 -0.32 0.51 1.00
TS 0.22 -0.12 0.81 0.66 1.00
DS -0.04 -0.05 0.76 0.51 0.89 1.00
DO -0.29 0.42 -0.70 -0.76 -0.70 -0.57 1.00
BOD 0.15 -0.30 0.53 0.51 0.51 0.39 -0.71 1.00
COD -0.02 -0.46 0.64 0.66 0.61 0.53 -0.77 0.87 1.00
Hard -0.14 -0.49 0.79 0.46 0.73 0.69 -0.74 0.64 0.81 1.00
Alk 0.29 -0.25 0.75 0.72 0.80 0.66 -0.82 0.78 0.84 0.77 1.00
Mg -0.23 0.21 -0.50 -0.25 -0.46 -0.45 0.26 -0.09 -0.13 -0.24 -0.25 1.00
Ca 0.10 1.00 -0.32 -0.32 -0.12 -0.05 0.42 -0.30 -0.46 -0.49 -0.25 0.21 1.00
No3 0.28 0.31 -0.11 0.13 -0.12 -0.15 -0.04 0.24 0.10 -0.25 0.14 0.48 0.31 1.00
Ph 0.24 0.31 -0.32 -0.19 -0.37 -0.37 0.24 -0.23 -0.37 -0.51 -0.29 0.43 0.31 0.73 1.00
So4 0.10 -0.09 -0.27 0.12 -0.25 -0.33 -0.02 0.22 0.14 -0.12 0.10 0.23 -0.09 0.34 0.35 1.00
Cl 0.16 -0.42 0.80 0.56 0.71 0.58 -0.70 0.64 0.80 0.79 0.80 -0.35 -0.42 -0.02 -0.29 0.18 1.00
Na 0.36 -0.35 0.54 0.74 0.68 0.49 -0.78 0.74 0.76 0.68 0.86 -0.17 -0.35 0.13 -0.21 0.28 0.75 1.00
K 0.18 0.44 -0.68 -0.12 -0.51 -0.55 0.38 -0.26 -0.41 -0.68 -0.43 0.34 0.44 0.35 0.40 0.41 -0.50 -0.15 1.00
TC 0.34 -0.35 0.71 0.37 0.51 0.46 -0.68 0.52 0.55 0.63 0.70 -0.36 -0.35 -0.11 -0.35 -0.18 0.53 0.47 -0.52 1.00
FC 0.34 -0.46 0.68 0.64 0.58 0.42 -0.88 0.61 0.71 0.70 0.77 -0.23 -0.46 0.01 -0.26 0.06 0.78 0.78 -0.33 0.72 1.00
Fe 0.11 -0.47 0.78 0.41 0.65 0.61 -0.67 0.50 0.65 0.78 0.66 -0.35 -0.47 -0.27 -0.45 -0.23 0.72 0.46 -0.78 0.74 0.67 1.00
Pb 0.22 -0.49 0.29 0.73 0.43 0.27 -0.65 0.60 0.69 0.51 0.69 0.04 -0.49 0.16 -0.10 0.37 0.53 0.80 -0.19 0.31 0.62 0.36 1.00
Zn 0.32 -0.48 0.15 0.51 0.12 -0.06 -0.49 0.32 0.32 0.18 0.34 0.01 -0.48 0.13 0.11 0.30 0.27 0.53 0.17 0.24 0.53 0.10 0.64 1.00
Mn 0.25 0.09 -0.02 0.44 0.19 0.12 -0.30 0.41 0.38 0.04 0.41 0.19 0.09 0.49 0.27 0.46 0.19 0.53 0.38 0.11 0.26 -0.14 0.54 0.42 1.00
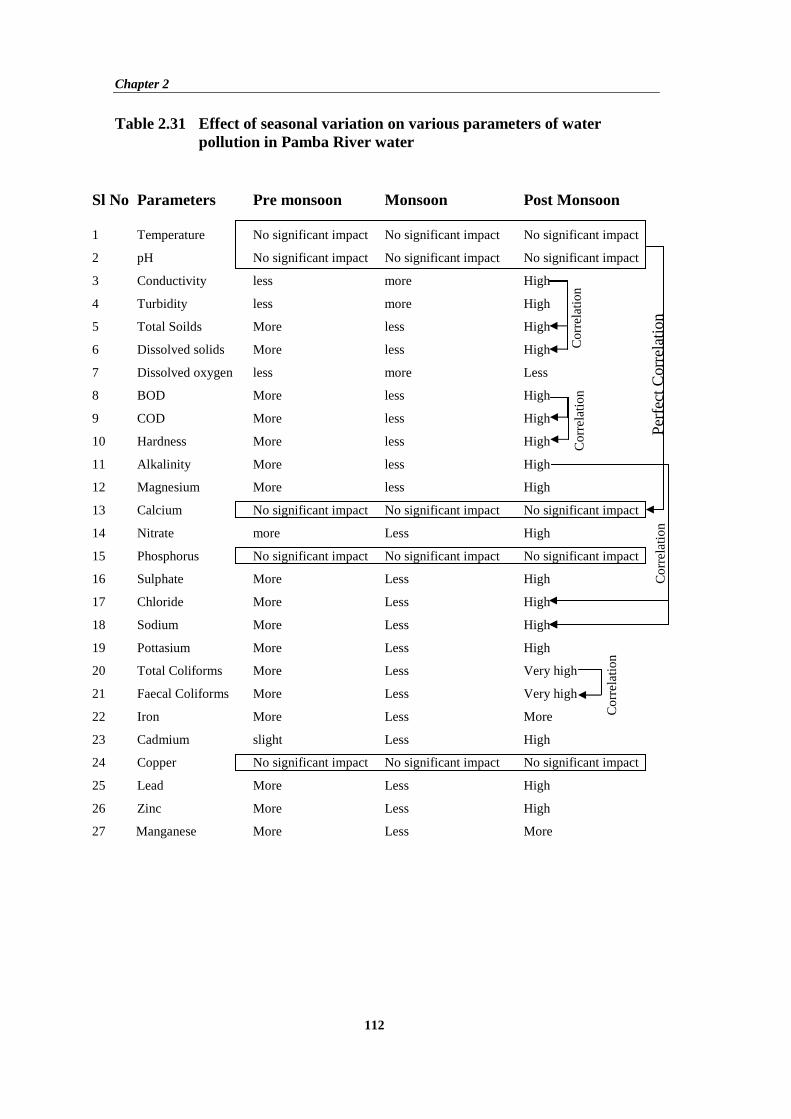
Chapter 2
112
Table 2.31 Effect of seasonal variation on various parameters of water pollution in Pamba River water
Per
fect
Cor
rela
tion
Co
rrel
atio
n
Co
rrel
atio
n
Co
rrel
atio
n
Co
rrel
atio
n
Sl No Parameters Pre monsoon Monsoon Post Monsoon
1 Temperature No significant impact No significant impact No significant impact
2 pH No significant impact No significant impact No significant impact
3 Conductivity less more High
4 Turbidity less more High
5 Total Soilds More less High
6 Dissolved solids More less High
7 Dissolved oxygen less more Less
8 BOD More less High
9 COD More less High
10 Hardness More less High
11 Alkalinity More less High
12 Magnesium More less High
13 Calcium No significant impact No significant impact No significant impact
14 Nitrate more Less High
15 Phosphorus No significant impact No significant impact No significant impact
16 Sulphate More Less High
17 Chloride More Less High
18 Sodium More Less High
19 Pottasium More Less High
20 Total Coliforms More Less Very high
21 Faecal Coliforms More Less Very high
22 Iron More Less More
23 Cadmium slight Less High
24 Copper No significant impact No significant impact No significant impact
25 Lead More Less High
26 Zinc More Less High
27 Manganese More Less More
Survey and Analysis of Pamba River and its Pollution
113
On evaluating the correlation matrix for the above factors several
conclusions could be made as general observations. The highest correlation was
observed with calcium and pH. The high rate of chlorination done through the
addition of excess bleaching powder contributed high calcium content which at the
same time supported balanced ionic concentration for a stable but slightly acidic pH.
Even the dilutions made during the monsoon seasons could not make much change
in the high calcium content of the river water. There was also satisfactory correlation
between conductivity and total solids and also between total solids and dissolved
solids which were quite expected and logic.
The very high concentration of suspended solids consistently present in the
Pamba river water was the prime reason for all these correlations. This necessitates
the requirement of an extensive primary treatment strategy in the treatment of
polluted Pamba river water. The coliform which was always present in high mount
could also be precipitated along with the high amount of suspended solids. If a
proper treatment strategy can be adopted giving much importance to coliform
sedimentation along with the suspended particle sedimention one can think of
chlorination being applied at a lower dose.
Coagulation can be effected with many compounds like alum,
polyelectrolyte, iron salts etc. Effective coagulation can be maintained when the
process is made slow and steady. An initial neutralisation followed by flocculation
favours massive separation of suspended matters. The large floc oriented
sedimentation process is better suited for simultaneous separation of coliform along
with suspended matter. Biocoagulants often result in slow and steady precipitation
and offers large floc formation. Also bioflocculants are generally non toxic. As this

Chapter 2
114
is a matter of polluted river water treatment strategy one should be equally
concerned with the cost and the availability of the flocculants.
Technically in all water and waste water treatment strategies the most
challenging issue is the presence of high suspended matter. If not effectively
removed at the initial stages of treatment, the high content of this suspended solids
may interfere with the subsequent treatment methods making them less efficient and
inconsistent. Offering tangential screens amidst the flow of running water is another
physical treatment strategy to bring down the suspended solids in a large volume of
polluted running water sample. This can also be set inside the water carrying pipe or
inside the containment. But the drawback comes when it comes to the question of
frequent screen replacement and washing. This is time consuming and labour
intensive.
The present study has led us to conclude that the quality of pamba river
water samples subjected to study was not acceptable from majority of
physicochemical and biological parameters particularly the bacteriological
standards.Hence the water needs to be treated before using it for any domestic
purposes.Based on the results of analysis, it is suggested that further detailed
investigations of the pamba river water purifying plants, storage tanks and pipe lines
as well as other sources of water may be carried out in future for the public to
access safe water for drinking and house hold uses.