survey development & qualitative research methods professor settles
TRANSCRIPT

Survey Development & Qualitative Research Methods
Professor Settles

Topics appropriate for survey Topics appropriate for survey researchresearch
• Used for exploratory, descriptive & Used for exploratory, descriptive & explanatory purposesexplanatory purposes
• Probably best method to collect original Probably best method to collect original data for describing a population too large data for describing a population too large to observe directlyto observe directly

Guidelines for Asking QuestionsGuidelines for Asking Questions
• Choose appropriate question form: two optionsChoose appropriate question form: two options
– Open-endedOpen-ended--Respondent is asked to provide own answer to question
– Closed-endedClosed-ended-- Respondent is asked to select an answer from among a list provided by researcher
• Closed-ended questions require the categories of answers to be exhaustive and mutually exclusive

Guidelines for Asking Questions Guidelines for Asking Questions
• Make items clearMake items clear
• Avoid double-barreled questionsAvoid double-barreled questions

Double-barreled to the maxDouble-barreled to the max
• Question on 1986 Harris poll re: American Question on 1986 Harris poll re: American public opinion about Libyapublic opinion about Libya
– If Libya now increases terrorist acts against the U.S. and we keep inflicting more damage on Libya, then inevitably it will all end in the U.S. going to war and finally invading that country which would be wrong.
– Respondents were given opportunity to answer “Agree”, “Disagree” or “Not sure”

Double-barreled to the max
• Notice the elements contained in the complex Notice the elements contained in the complex statementstatement
– Will Libya increase its terrorist acts against the U.S.?– Will the U.S. inflict more damage on Libya?– Will the U.S. inevitably or otherwise go to war with Libya?– Would the U.S. invade Libya?– Would that be right or wrong?
• These elements offer the possibility of numerous These elements offer the possibility of numerous points of view—far more than the three alternatives points of view—far more than the three alternatives offered to the Respondentoffered to the Respondent

Guidelines for Asking Questions, Guidelines for Asking Questions,
• Respondents must be Respondents must be competentcompetent to to answeranswer
• Respondents must be Respondents must be willingwilling to to answeranswer
– There may be a risk to the respondent in answering the question
– Reluctance may be due to nature of the information sought
– Using a technique that guarantees anonymity or confidentiality greatly increases respondents willingness to answer questions

Guidelines for Asking QuestionsGuidelines for Asking Questions
• Questions should be relevant to the Questions should be relevant to the RespondentRespondent
• Short items are bestShort items are best
• Avoid negative itemsAvoid negative items

Guidelines for Asking QuestionsGuidelines for Asking Questions
• Avoid biased items and termsAvoid biased items and terms
– Questions should not encourage a particular response or discourage another.
– Be wary of "social desirability" of answers

Questionnaire ConstructionQuestionnaire Construction
• General questionnaire format should be General questionnaire format should be uncluttereduncluttered
– Packed questionnaires are disastrous
• Formats for respondents should be clean Formats for respondents should be clean and clearand clear

Questionnaire ConstructionQuestionnaire Construction
• Contingency questionContingency question
– A question that only applies to the respondent’s who answered a previous question in a particular “qualifying” manner
– Make sure that the directions for answering the subsequent questions are clear for the respondent

Contingency question, Contingency question, exampleexample
• Have you ever been abducted by aliens?Have you ever been abducted by aliens?
– [ ] Yes– [ ] No (go to ques. # 4)
If yesIf yes: Did they let you steer the ship?
[ ] Yes
[ ] No
If yesIf yes: How fast did you go?
[ ] Warp speed
[ ] Weenie speed

Questionnaire ConstructionQuestionnaire Construction
• Matrix questionsMatrix questions
– AdvantagesAdvantages• Uses space efficiently, R's will probably complete it faster
• Format may increase comparability of responses to different questions
– DisadvantagesDisadvantages• Can foster a response-set among respondents in which
they may develop a pattern

Matrix question, Matrix question, exampleexample
• Contact with criminal justice systemContact with criminal justice system
Have you ever…Have you ever…
YesYes NoNo Ref/DKRef/DK
Been a defendant in a criminal case 11 22 77
Been a witness in a criminal case 11 22 77
Reported a crime to the police 11 22 77
Been the victim of a crime 11 22 77

Matrix question, Matrix question, example 2example 2
• Using the A, B, C, D, F grading system that we learned in school, Using the A, B, C, D, F grading system that we learned in school, please rate the importance of the following services in this hotel.please rate the importance of the following services in this hotel.
Hotel serviceHotel service AA BB CC DD FFRef/Ref/DKDK
Dining servicesDining services 55 44 33 22 11 77
Laundry serviceLaundry service 55 44 33 22 11 77
Room serviceRoom service 55 44 33 22 11 77
Questionnaire ConstructionQuestionnaire Construction
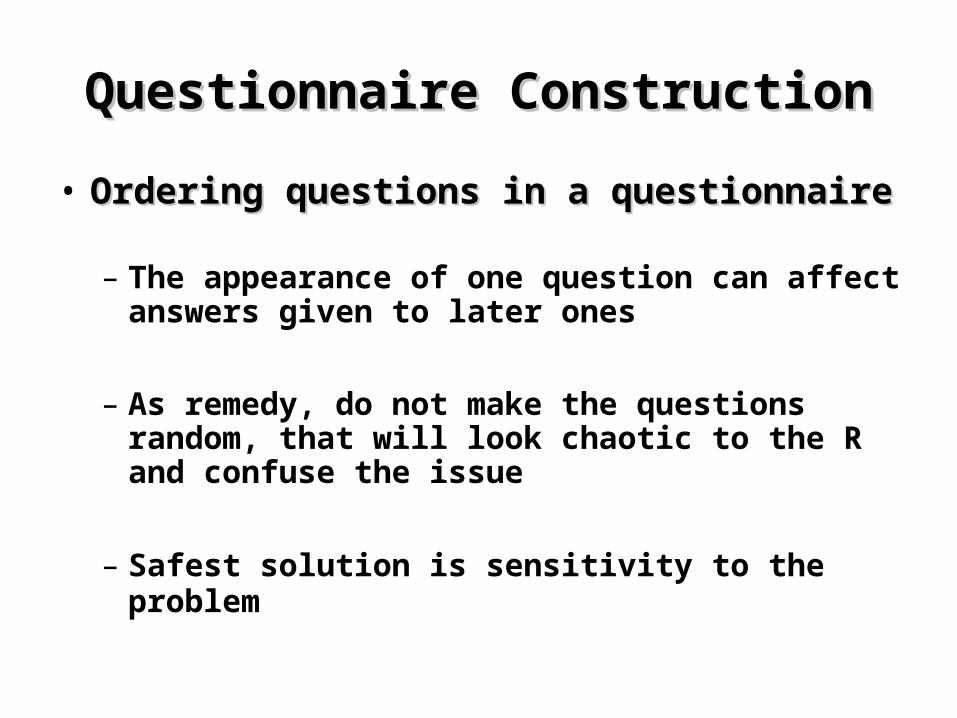
• Ordering questions in a questionnaireOrdering questions in a questionnaire
– The appearance of one question can affect answers given to later ones
– As remedy, do not make the questions random, that will look chaotic to the R and confuse the issue
– Safest solution is sensitivity to the problem
Questionnaire ConstructionQuestionnaire Construction
• Questionnaire InstructionsQuestionnaire Instructions
– Must be clear, concise and COMPLETECOMPLETE
• Pre-testing the questionnairePre-testing the questionnaire
– ALWAYS PRE-TEST!!!!ALWAYS PRE-TEST!!!!

Comparing different survey methodsComparing different survey methodsChoosing among mail questionnaire, personal interview and Choosing among mail questionnaire, personal interview and
telephone surveytelephone survey
Factors influencing coverage and information Factors influencing coverage and information gatheredgathered
Mailed questionnaire
Personal interview
Telephone survey
Lowest relative cost 1 3 2
Highest % return 3 1 2
Highest accuracy of information 2 1 3
Largest sample coverage 3 1 3
Completeness, including sensitive material 3 1 2
Overall reliability & validity 2 1 3
Time required to gather information 3 2 1
Ease of gathering information 1 3 2
Total number of rankings—1,2,3 2,2,4 5,1,2 1,5,1
Note: 1=most favorable ranking, 2=intermediate ranking, 3=least favorable ranking
Source: Delbert Miller. Handbook of Social Research Design and Measurement, 5th Edition,1991, p. 168

Strengths of survey researchStrengths of survey research
• Useful in describing large populationsUseful in describing large populations
• Are flexible in that you can ask many questions Are flexible in that you can ask many questions regarding your topicregarding your topic
• Standardized questionnaires have strength Standardized questionnaires have strength regarding measurement generallyregarding measurement generally
– Survey researcher must ask the same question of all subjects and…
– Impute the same intent to all respondents giving a particular response

Weaknesses of survey researchWeaknesses of survey research
• Standardized questionnaire items often Standardized questionnaire items often represent the least common denominator in represent the least common denominator in assessing people’s attitudes, etc.assessing people’s attitudes, etc.
• Does not deal well with the context of social Does not deal well with the context of social lifelife
• Can be inflexible…cannot change the survey Can be inflexible…cannot change the survey instrument if field conditions changeinstrument if field conditions change

Weaknesses of survey research,Weaknesses of survey research,
• Subject to artificialitySubject to artificiality
– A person giving a conservative answer to a questionnaire does not necessarily mean the person is conservative
– Artificiality has two aspects
• Topic of study may not be amenable to measurement through a questionnaire
• Studying the topic may affect it…

Quantifying data , CodingQuantifying data , Coding
• System to translate the responses to System to translate the responses to questions to numeric expressions that the questions to numeric expressions that the computer can processcomputer can process
• Two basic approaches to coding processTwo basic approaches to coding process
– Begin with developed coding schemeBegin with developed coding scheme
– Generate codes from data that you collectedGenerate codes from data that you collected.

Using a developed coding Using a developed coding scheme, scheme, exampleexample
• OccupationOccupation
– The question to the R would be: What is The question to the R would be: What is your occupation?your occupation?
– The R’s response is then placed in one of The R’s response is then placed in one of several categories that you have already several categories that you have already identifiedidentified

Using a developed coding schemeUsing a developed coding scheme, , exampleexample
• What is your occupation?What is your occupation?
– Let’s say that the answer was Let’s say that the answer was “nurse”“nurse”
– Scheme 1: by typeScheme 1: by type• Professional, managerial, clerical, semi-skilled, etc.
• In this scheme, the R’s occupation would be placed in the “professional” category
– Scheme 2: by sector of the economyScheme 2: by sector of the economy• Manufacturing, health, education, commerce, etc.
• In this scheme, the R’s occupation would be placed in the “health” category

Using a developed coding schemeUsing a developed coding scheme, , exampleexample
• Note:Note: record the response of the R record the response of the R verbatimverbatim
• Place the response into one of your pre-determined Place the response into one of your pre-determined categories during the data manipulation phasecategories during the data manipulation phase
– Use “recode” facility in SPSS Use “recode” facility in SPSS
• Remember, you can always Remember, you can always “aggregate”“aggregate” data data
– Cannot Cannot “disaggregate”“disaggregate” data data
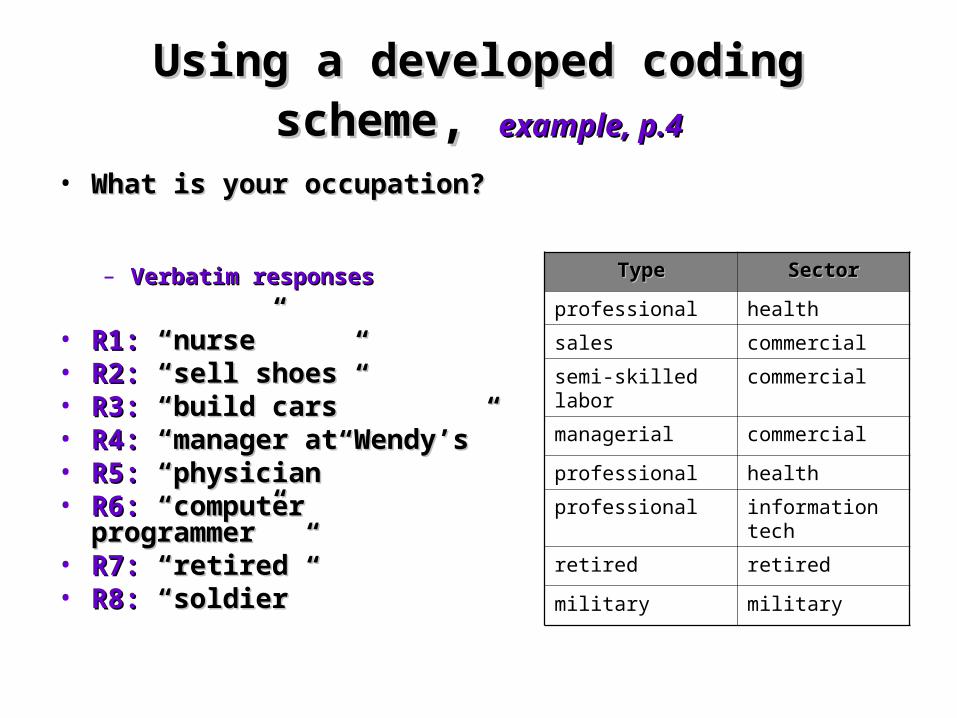
Using a developed coding schemeUsing a developed coding scheme, , example, p.4example, p.4
• What is your occupation?What is your occupation?
– Verbatim responsesVerbatim responses
• R1:R1: “nurse” “nurse”• R2:R2: “sell shoes” “sell shoes”• R3:R3: “build cars” “build cars”• R4:R4: “manager at Wendy’s” “manager at Wendy’s”• R5:R5: “physician” “physician”• R6:R6: “computer programmer” “computer programmer”• R7:R7: “retired” “retired” • R8:R8: “soldier” “soldier”
TypeType SectorSector
professional health
sales commercial
semi-skilled labor commercial
managerial commercial
professional health
professional information tech
retired retired
military military

Generating codes from data collected,Generating codes from data collected, exampleexample
Student responses to “biggest problem facing college today”Student responses to “biggest problem facing college today”
Responses can be coded as “academic” or “non-academic”Responses can be coded as “academic” or “non-academic”
AcademicAcademic Non-academicNon-academic
Tuition is too highTuition is too high xx
Not enough parking spacesNot enough parking spaces xx
Faculty don’t know what they’re Faculty don’t know what they’re doingdoing
xx
Advisors are never availableAdvisors are never available xx
Not enough classes offeredNot enough classes offered xx
Cockroaches in the dormsCockroaches in the dorms xx
Too many requirementsToo many requirements xx
Cafeteria food is infectedCafeteria food is infected xx
Books cost too muchBooks cost too much xx
Not enough financial aidNot enough financial aid xx

Codebook constructionCodebook construction• End product of the coding process is the conversion of data End product of the coding process is the conversion of data
items into numerical codesitems into numerical codes
• These codes represent attributes composing variables which.... These codes represent attributes composing variables which....
• Are assigned locations within a data fileAre assigned locations within a data file
– Location means the Location means the specific columnspecific column of the data file where, for of the data file where, for example, the responses for “gender” would occurexample, the responses for “gender” would occur
• A A codebookcodebook is a document that describes the locations and is a document that describes the locations and lists the assignment of codes to the attributes composing lists the assignment of codes to the attributes composing those variablesthose variables
– It is the It is the fundamentalfundamental document of the research process document of the research process

Codebook serves two functionsCodebook serves two functions
• Primary guide for the coding processPrimary guide for the coding process
• Guide to locating variables in the data Guide to locating variables in the data file during analysisfile during analysis

Data Cleaning...a fundamental Data Cleaning...a fundamental activityactivity
• The process of detecting and correcting coding errorsThe process of detecting and correcting coding errors
• Two typesTwo types
– Possible-code cleaningPossible-code cleaning--for any given variable there are only a --for any given variable there are only a specified set of codes possiblespecified set of codes possible
• ExampleExample, gender--computer program would "beep" when an erroneous , gender--computer program would "beep" when an erroneous code is entered and refuse the codecode is entered and refuse the code
• Family Court experience with gender codes Family Court experience with gender codes
– Contingency CleaningContingency Cleaning--process of checking only those cases that --process of checking only those cases that should have data on a particular variable should have data on a particular variable dodo in fact have such datain fact have such data

Reading
• Cycyota, C. S. & Harrison, D. A. (2006). What (not) to expect when surveying executives: A meta-analysis of top manager response rates and techniques over time. Organizational Research Methods, 9, 133-160

Hypotheses
• Hypothesis 1: Response rates for mailed surveys in executive populations are declining (monotonically) over time.
• Hypothesis 2: Topic salience will be positively related to response rates from executives.
• Hypotheses 3a-d: Inclusion of (a) an incentive, (b) advance notice to executive, (c) follow-up contact after mail date, and (d) personalization of the survey and cover letter will increase the likelihood of executive response to mailed surveys.

Hypotheses
• Hypothesis 4: Prior consent screening of executive samples will generate higher reported response rates.
• Hypothesis 5: Sponsorship (and therefore access) by a member of the executive’s or firm’s social network will increase the likelihood of response to mailed surveys.

Results
• Hypotheses 1, 2, 4, and 5 were supported• Structural aspects of survey administration
—advance notice, repeated contact, personalization (H3b-d)—were not associated with higher response rates from executives– Advance notice– Follow-up– Personalization

Cycyota & Harrison
• Findings– Found mean response rates to be declining
over the period, yielding an overall 32% rate. – Of the various methods suggested to increase
response rates in other populations, none were found to be effective for executives.
– Topical salience and sponsorship by an organization or person in the executive’s social networks did bring about response rate increases.

Sampling

Why do sampling?
• To learn about the characteristics of a group of people or objects without having to collect information about all of the people or objects of interest.
• To save money and time.
• To increase internal validity. Use of multiple data collectors or the passage of large amounts of time can negatively impact internal validity (and there is no way of determining how much of a problem this creates). Well conducted samples can actually be more accurate than collecting the desired data from all of the people or objects of interest.

Types of Sampling
• The following three types of samples are based on the use of probability theory. These types of samples increase external validity (i.e., they produce results which can to some extent be generalized to a broader group).
Simple random sample Stratified random sample Cluster samples

Non-Probability Samples
Other types of samples are not based on probability theory, do not produce external validity, and hence are very risky to use: quota, purposive, snowball, and haphazard.

Two ways of making a probability sample more representative of the
population being studied:• Make sure that every unit picked for the
sample has the same chance of being picked as any other unit (randomness).
• Increase the sample size (less important that (1) above).

Proper Size of the Sample
Factors that affect what the size of the sample needs to be:
• The heterogeneity of the population (or strata or clusters) from which the units are chosen.
• How many population subgroups (strata) you will deal with simultaneously in the analysis.
• How accurate you want your sample statistics (parameter estimates) to be.
• How common or rare is the phenomenon you are trying to detect.
• How much money and time you have.

Calculating Sample Size X2NP(1-P)
n = ________________
C2(N-1)+X2P(1-P)Where:
n = the required sample sizeX2 = is the chi-square value for 1 degree of freedom at some desired probability levelN = is the size of the population universe (which gets more important as N gets smaller)P = is the population parameter of the variable (set=.5 which is the worst case scenario, meaning maximally heterogeneous for a dichotomous variable)C = the chosen confidence interval
Important note: This formula is good for dichotomous variable (yes/no type variable), not more complex variables.

1 2 3 4 5
Confindence X 2 value for Population Population Required
Interval (+/-) 95% Level of Size Parameter Sample SizeC Significance N P n
5% 3.841 50 0.5 44
5% 3.841 100 0.5 80
5% 3.841 150 0.5 108
5% 3.841 200 0.5 132
5% 3.841 250 0.5 152
5% 3.841 300 0.5 169
5% 3.841 400 0.5 196
5% 3.841 500 0.5 217
5% 3.841 800 0.5 260
5% 3.841 1,000 0.5 278
5% 3.841 1,500 0.5 306
5% 3.841 2,000 0.5 322
5% 3.841 3,000 0.5 341
5% 3.841 4,000 0.5 351
5% 3.841 5,000 0.5 357
5% 3.841 10,000 0.5 370
5% 3.841 50,000 0.5 381
5% 3.841 1,000,000 0.5 384
5% 3.841 50,000,000 0.5 384
5% 3.841 100,000,000 0.5 384
5% 3.841 300,000,000 0.5 384
For Simple Dichotimous Choice
Sample Size Required for Various Populations Sizes
at 5% Confidence Interval

Stratified Sampling
Is done whenever it is likely than an important subpopulation will be under represented in a simple random sample.
Must know independent variables upon which to stratify Must know the sizes of the strata subpopulations Is complex and more costly Each strata has it's own sampling error. But the
aggregate sampling error of the total population is reduced.
There is proportionate and disproportionate random sampling

Cluster Sampling
Is a way to sample a population when there is no convenient lists or frames (e.g., homeless in shelters or soup kitchens).

Self-Selection Bias
• Is caused by the unit of observation (e.g., person) choosing whether or not to be a respondent in a survey.
• If the self-selection process itself is random, it will not compromise the randomness of the selection process.
• If the self-selection process is not random (is systematic), it will compromise the randomness of the selection process.

Using Sampling to CreateControl & Experimental Groups
• As we’ve previously discussed in this course, sampling is a very important tool for creating control groups and experimental groups in experimental research designs.
• To create two groups, you would simply draw two separate samples from the same universe, using a sample size that is adequate to produce the level of comparability (precision) desired.

Using Sampling to CreateControl & Experimental GroupsIf you have a “before/after” research design, the control group consists of units of observation randomly selected before a new program or policy was implemented (i.e., the “treatment’), and the experimental group consists of units of observation randomly selected after the new program or policy was implemented.

Using Sampling to CreateControl & Experimental Groups
Important Points!If:
A = the universe of units of observation you are studying;B = a properly drawn random sample of the universe A;then: B will be comparable (representative) of A.
Further, if:
C = another properly drawn random sample of the universe A; then: C will be comparable to (representative of) A, and C will also be comparable (representative of) B. The two samples (one a control group and one an experimental group) are comparable!

Single Indicator & Composite Measures

Single Indicators
A single indicator is a device for assigning units of observation to levels of a variable.
Questions are commonly used as single indicator devices.
Questions used for this purpose allow the respondent to categorize him or herself to a specified level of a variable.

Single Indicators
There are three types of questions that produce single indicator measures.

Single Indicators vs.Composite Measures
If the phenomenon that you are measuring is more complex (like “prejudice” or “socio-economic status” or “intelligence” or “historic significance”) you may need to use a composite measure. The function of a single indicator is to assign units of analysis to categories or levels of a variable. The purpose of a composite measure is exactly the same, but is used when a single indicator won’t do the job.
Composite Measures
Composite measures are based on more than one data item.
There are two different types of composite measures:
Indices Scales
Composite Measures
Both indices and scales are ordinal measures of variables. The difference between the two is based on how scores are assigned.
Composite Measures – Indices
An index is constructed through the simple accumulation of scores assigned to individual attributes. All items are weighted the same.

Composite Measures - Scales
A scale on the other hand is constructed through the assignment of scores to patterns of responses, recognizing that some items reflect a relatively weak degree of the variable, while other reflect something stronger. Scales take advantage of any intensity structure that may exist among attributes.

Composite Measures – Scales
Scales are generally superior to indices because scales take into consideration the intensity with which different items reflect the variable being measured.

Composite Measures – Factors to Consider in their Construction
Bi-variate and multi-variate relationship between items (items should be related to each other, but not perfectly related. If items are not related, they are probably measuring different things. If two items are perfectly related, they are redundant, and are not adding any new information).
Composite Measures – Factors to Consider in their Construction
“Index scoring” involves making decisions about the range of the index and the frequencies of responses across the chosen range. Once decided, the index is calculated.
Composite Measures – Factors to Consider in their Construction
Once created, a composite measure must be validated. The basic question is: does the index or scale actually measure the phenomenon that is sought to be measured?
“Item analysis” – examination of the extent to which the index is related to (predicts responses to) the individual items it comprises
“External validation” – validating the index using some other measure which is not part of the index being evaluated

Major Types of Scales
Bogardus Social Distance Scale – Increasing intensity of the questions clearly shows a pattern (e.g., Are you willing to let Albanians live in your country, be your neighbor, marry your son or daughter?).

Major Types of Scales
Likert Scales
3- point, 5-point or 7-point scale is common (example: agree, neutral, disagree)
Odd number in scale is used so mid-point is a whole number. Use of an even number of points on the scale forces people to “take a stand” on one side of an issue or the other.
Make questions as simple as possible Use words respondents will understand Don’t use double negatives Don’t put more than one concept in a question

Focus GroupsFocus Groups

Characteristics ofCharacteristics ofFocus GroupsFocus Groups
• A group meeting lead by a moderatorA group meeting lead by a moderator
• Seeks information about a topic that attendees are Seeks information about a topic that attendees are
knowledgeable about.knowledgeable about.
• Size of group should be between 7 and 18. The Size of group should be between 7 and 18. The
bigger the group, the more difficult it is to provide bigger the group, the more difficult it is to provide
enough speaking time to everyone, and the more enough speaking time to everyone, and the more
likely it is that some people won’t speak up.likely it is that some people won’t speak up.
• There is an “interaction effect.” On surveys There is an “interaction effect.” On surveys
completed by individual people, there is no completed by individual people, there is no
interaction effect. interaction effect.

Characteristics ofCharacteristics ofFocus GroupsFocus Groups
• Informed consent may be neededInformed consent may be needed
• Moderator uses prepared questionsModerator uses prepared questions
• Random selection of people from the universe of Random selection of people from the universe of
interest is good to do, but not always possible.interest is good to do, but not always possible.
• External validity is achieved by doing multiple focus External validity is achieved by doing multiple focus
groups and not stopping until the information groups and not stopping until the information
obtained in the most recent focus group is redundant obtained in the most recent focus group is redundant
with what was heard in prior focus group meetings.with what was heard in prior focus group meetings.

Characteristics ofCharacteristics ofFocus GroupsFocus Groups
• Extensive notes must be taken, or session may be Extensive notes must be taken, or session may be
audio and video recorded. audio and video recorded.
• The “focus group” is essentially a qualitative research The “focus group” is essentially a qualitative research
methods that requires a very systematic approach to methods that requires a very systematic approach to
analysis to ensure reliability.analysis to ensure reliability.
• In addition to analyzing what people say, the In addition to analyzing what people say, the
researcher may also analyze body language, speech researcher may also analyze body language, speech
patterns, patterns of interpersonal interaction.patterns, patterns of interpersonal interaction.

Characteristics ofCharacteristics ofFocus GroupsFocus Groups
• Information obtained through the focus group method Information obtained through the focus group method
can be quantified, but it is a very labor intensive can be quantified, but it is a very labor intensive
process, even with the use of sophisticated software.process, even with the use of sophisticated software.
• Focus groups can often be used along with other Focus groups can often be used along with other
data collection methods to provide context or to data collection methods to provide context or to
obtain useful information for the design of a survey obtain useful information for the design of a survey
questionnaire (helps the research decide what questionnaire (helps the research decide what
questions to ask in the survey).questions to ask in the survey).
• Focus groups can be cost effective, but not alwaysFocus groups can be cost effective, but not always